


Servicios Personalizados
Articulo
 Inglés (pdf)
 Articulo en XML
 Referencias del artículo
Indicadores

Links relacionados
-
 Citado por Google
 -
 Similares en Google
Compartir

 Permalink
SAMJ: South African Medical Journal
versión On-line ISSN 2078-5135
versión impresa ISSN 0256-9574
SAMJ, S. Afr. med. j. vol.105 no.10 Pretoria oct. 2015
http://dx.doi.org/10.7196/SAMJNEW.7766
RESEARCH
The epidemiology of major incidents in the Western Cape Province, South Africa
D J van HovingI; H J LateganII; L A WallisIII, IV; W P SmithV
IMB ChB, Dip PEC (SA), MMed (EM), MScMedSci (ClinEpi); Division of Emergency Medicine, Stellenbosch University, Tygerberg, Cape Town, South Africa
IIBSc, MB BCh, MMed (EM), FCEM (SA); Division of Emergency Medicine, University of Cape Town, South Africa
IIIMB ChB, MD, DIMCRCSEd, Dip Sport Med, FRCS (Ed) (A&E), FRCP (Ed), FRCEM, FCEM (SA), FEMSSA, FIFEM; Division of Emergency Medicine, Stellenbosch University, Tygerberg, Cape Town, South Africa
IVMB ChB, MD, DIMCRCSEd, Dip Sport Med, FRCS (Ed) (A&E), FRCP (Ed), FRCEM, FCEM (SA), FEMSSA, FIFEM; Division of Emergency Medicine, University of Cape Town, South Africa
VMB ChB, EMDM, FCEM (SA); Division of Emergency Medicine, University of Cape Town, South Africa
ABSTRACT
BACKGROUND: Major incidents put pressure on any health system. There are currently no studies describing the epidemiology of major incidents in South Africa (SA). The lack of data makes planning for major incidents and exercising of major incident plans difficult..
OBJECTIVE: To describe the epidemiology of major incidents in the Western Cape Province, SA.
Methods. A retrospective analysis of the Western Cape Major Incident database was conducted for the period 1 December 2008 - 30 June 2014. Variables collected related to patient demographics and incident details. Summary statistics were used to describe all variables.
RESULTS: Seven hundred and seventy-seven major incidents were reviewed (median n=11 per month). Most major incidents occurred in the City of Cape Town (57.8%, n=449), but the Central Karoo district had the highest incidence (11.97/10 000 population). Transport-related incidents occurred most frequently (94.0%, n=730). Minibus taxis were involved in 312 major incidents (40.2%). There was no significant difference between times of day when incidents occurred. A total of 8 732 patients were injured (median n=8 per incident); ten incidents involved 50 or more victims. Most patients were adults (80.0%, n=6 986) and male (51.0%, n=4 455). Of 8 440 patients, 630 (7.5%) were severely injured. More than half of the patients sustained minor injuries (54.6%, n=4 605.
CONCLUSION: Major incidents occurred more often than would have been expected compared with other countries, with road traffic crashes the biggest contributor. A national database will provide a better perspective of the burden of major incidents.
A major incident can be defined as 'any incident where the location, number, severity or type of live casualties requires extraordinary resources'.[1] Major incidents can be further classified into: (i) natural or man-made; (ii) simple or compound (infrastructure is lost); and (iii) compensated or uncompensated (healthcare system unable to cope despite additional resources).[1]
Major incidents happen more frequently than is generally recognised. Britain has 0 - 11 major incidents each year (average 3 - 4 per year), of which the majority (59.2%) involve public transportation.[2] In Pakistan, emergency medical services responded to 438 major incidents in only 6 months, the majority (48.6%) also related to road transportation.[3] The incidence in South Africa (SA) is unknown.
Prevention of future incidents is vital but nearly impossible, as the related hazards will never be completely eliminated.[4] The focus should be on actions that can change both the nature of the hazard and the risk that a hazard will evolve into a major incident, with the aim of decreasing the risk of the incident (in terms of both frequency and magnitude).[4] Risk management attempts to modify the probability that an incident will occur.[4] Risk management strategies mainly apply to man-made incidents and may include appropriate education and training, developing and implementing codes of practice, and developing preventive services.[4] However, risk management is only possible if appropriate risk markers can be identified.[4]
There are currently no studies describing the epidemiology of major incidents in SA. The lack of data makes planning for major incidents and exercising major incident plans difficult. Gaining an understanding of the 'pathophysiology' of major incidents should provide insight that could be applied to develop appropriate strategies for the prevention and modification of major incidents. The knowledge attained will also result in a better state of preparedness for major incidents.
Objective
To describe the epidemiology of major incidents in the Western Cape Province of SA.
Methods
Study design
A retrospective analysis of the Western Cape Major Incident database was conducted. The study was approved by the Health Research Ethics Committee of the University of Cape Town (ref. 441/2011).
Study setting
The Western Cape covers an area of 129 462 km2 and is home to more than 5.8 million people.[5] The province is divided into six district municipalities, five rural districts (Cape Winelands, Central Karoo, Eden, Overberg, West Coast), and one metropolitan district (City of Cape Town).[6] The City of Cape Town has the highest population density (1 520.3/km2) and the Central Karoo the lowest (1.8/km2). The population densities for Eden, Overberg and West Coast are 24.6/km2, 22.6/km2 and 12.6/km2, respectively.[6]
The Western Cape Major Incident database was started on 1 December 2008 by the Disaster Medicine and Special Events section of the divisions of emergency medicine at the University of Cape Town and Stellenbosch University and the Western Cape Government. It collects data on all major incidents in the Western Cape. SA standardised the Major Incident Medical Management and Support (MIMMS) principles in terms of major incident management as part of the FIFA 2010 Soccer World Cup legacy. Major incidents were accordingly defined as 'any incident where the location, number, severity or type of live casualties requires extraordinary resources'.[1] Incidents were only entered onto the database after they had been declared a major incident by the emergency medical services (EMS) officer commanding the scene (medical scene commander).
Standardised data collection sheets are completed by the EMS Central Control Centre, which receives the data from the scene commander by means of a two-way radio network with the forms completed as part of their day-to-day tasks. No personal or other identifying details (e.g. vehicle registration numbers) are collected. Completed forms are sent to the EMS Head Office, where the data are imported into an electronic spreadsheet (Microsoft Excel; Microsoft Corporation, USA). A single research assistant inserts the data. The database is stored on a password-protected work computer situated in the EMS Head Office, and access is limited to senior management personnel employed by the EMS.
Study population
All data in the Western Cape Major Incident database were analysed for the period 1 December 2008 - 30 June 2014. Incomplete data points were excluded from analysis.
Data collection and management
Variables collected related to patient demographics (age, gender, injury severity) and incident details (date, time, location, type and weather). Patients aged >12 years were classified as adults. Injury severity was assessed according to the MIMMS Triage Sieve tool, prioritising live patients as 'priority 1' (immediate priority), 'priority 2' (urgent priority), or 'priority 3' (delayed priority).[1] Data were stored on a password-protected work computer.
Statistical analysis
Summary statistics were used to describe all variables. Ranges and percentages were used as indicators of spread and medians as the measure of central tendency. Distributions of variables are presented with frequency tables. The population totals according to the 2011 Census were used as the denominator to calculate the incidence per health district.[6]
Results
There were 813 major incidents entered into the database. Seven hundred and seventy-seven major incidents were included for the 67 months under review after excluding 36 entries (no patients injured n=32, incidents before 1 December 2008 n=3, double entry n=1). There was a median of 11 incidents per month (minimum n=0, maximum n=39) (Fig. 1).

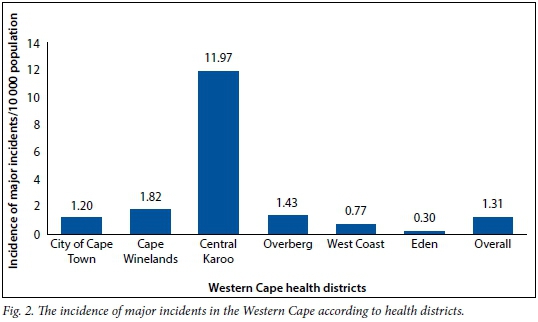
Most major incidents occurred in the City of Cape Town (57.8%, n=449), followed by the Cape Winelands (18.4%, n=143), Central Karoo (10.9%, n=85) and Overberg (4.8%, n=37). Only 30 incidents (3.9%) occurred in the West Coast region and 17 (2.2%) in the Eden district (location not specified n=16). The Central Karoo district had the most incidents per 10 000 population (Fig. 2).
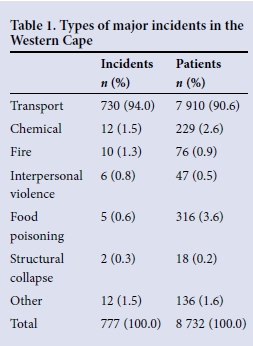
Transport-related incidents were the most frequent type of major incidents (Table 1). Road traffic crashes made up most of the transport-related incidents (99.2%, n=724), with the remainder divided between boats (n=3, 0.4%) and aircraft (n=3, 0.4%). Minibus taxis were involved in 312 major incidents (40.2%), heavy vehicles in 56 (7.2%) and buses in 46 (5.9%).
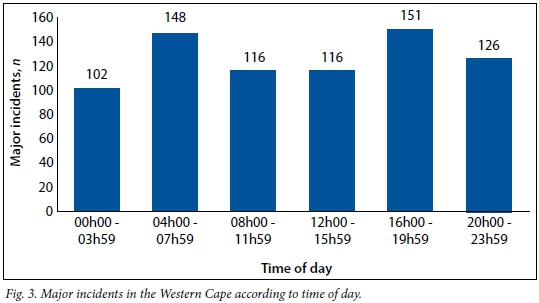
The prevailing weather conditions at the time of the major incidents are presented in Table 2. There was no significant difference between the times of the day when major incidents occurred (Fig. 3).

A total of 8 732 patients were injured (median n=8 per incident); the maximum number of patients per incident (n=193) was associated with a food poisoning episode.
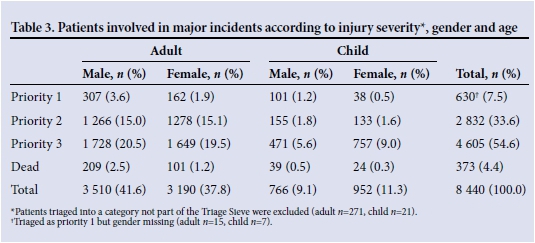
Ten incidents had > 50 victims. The majority of patients were adults (80.0%, n=6 986) and male (51.0%, n=4 455). Only 7.5% of patients (n=630) were severely injured and subsequently triaged as priority 1, and 33.6% (n=2 832) were triaged as priority 2. More than half of the patients were triaged as priority 3 (54.6%, n=4 605), while 4.4% (n=373) died on the scene (Table 3). Two hundred and ninety-two patients were triaged into a triage category that is not part of the Triage Sieve tool, and were excluded from analysis pertaining to injury severity.
Discussion
This study set out to describe the epidemiology of major incidents in the Western Cape over a 67-month period.
Major incidents happened more frequently than would have been expected compared with other countries. In contrast, in Pakistan's Punjab province, 73 major incidents occurred per month, while South Korea averaged 26.6 incidents per month;[3,7] 1.25 major incidents per month were registered during a 5-year study in southern Germany, and the city of Helsinki experienced less than one a month (59 incidents over a 6-year period).[8,9] The 11 incidents per month in the Western Cape are difficult to compare with international studies for two main reasons: firstly, a standard definition was not used in all studies, which may have resulted in over- or underestimation of the frequency of major incidents; and secondly, the Western Cape is only one of nine provinces in SA, whereas South Korea has 16 provinces, with an average number of incidents per province of about 1.7 per month.'[7] The Pakistan experience is also unique in that the Punjab province is home to more than half the population and their prehospital system is so severely under-resourced that incidents involving three or more patients are classified as major (this is calculated from the number of patients per incident, which averaged <8[3] v. the Western Cape average of 11.2).
The incidence of major incidents per 10 000 people in the Western Cape is higher than reflected in international studies. Although the denominators used in the calculations are admittedly arbitrary, they do provide an idea of the current situation. The overall figure for the Western Cape (1.31/10 000) is considerably higher than in more densely populated areas such as South Korea (0.67/10 000) and the Punjab province (0.06/10 000).[3,7,10] While the City of Cape Town had the most incidents (n=449), the sparsely populated Central Karoo district had the highest incidence of major incidents (11.97/10 000), reflecting the fact that it is transected by national roads infamous for their high traffic loads and road traffic crashes - notably, all major incidents in that district were related to road traffic crashes.
Worldwide, transport-related incidents are the chief cause of major incidents, with the proportion in the Western Cape (94.0%) exceeding that in both South Korea (74.5%) and Spain (71.6%).[7,11] This wide discrepancy increases if only the road traffic crashes are taken into account (Western Cape 93.2% v. South Korea 78.6%,[7] Finland 62.7%,[9] and Pakistan 48.6%[3]). Road traffic injuries are currently the eighth leading cause of death in the world and are soon expected to be ranked even higher.[12] A number of key risk factors (speed, drink-driving, and failure to use motorcycle helmets, seat-belts and child restraints) need to be addressed with both legislation and law enforcement.[12]
Minibus taxis are significant role players and were involved in 40.2% of all major incidents. The minibus taxi industry in SA is part of the public transport system, with 69% of households using taxis (90% minibus and 10% metered), 20.2% buses and 9.9% trains. [13,14] Although taxis are often perceived as unsafe, they are a preferred mode of transport, cutting down on travel time (and offering a door-to-door service with shorter waiting time compared with queuing at bus and train stations).[14] Driver attitude and vehicle roadworthiness of minibus taxis have long been flagged as the most important road safety aspects to address. With current strategies clearly falling short, as the fatal injury levels year-on-year remain largely unchanged,[14,15] it is time to shift the focus to ensure the 'crashworthiness' of vehicles, with legal requirements for seatbelts for all passengers, laminated windows and side-impact protection beams.
There were minimal differences between the times of day at which the incidents occurred. The suggestion of a bimodal distribution can be explained by the high portion of road traffic crashes that occurred during peak traffic periods (Fig. 3). Studies in Pakistan and Germany similarly indicated that time of day had no effect on the frequency of major incidents.[3,8]
Twenty percent of victims of major incidents in the Western Cape were children, compared with 14.1% in Finland.[9] However, the proportions of children injured in major incidents can range between 10% and 100% per incident.[16] Although difficulties in managing children are encountered in all phases of any major incident, triage has always been a concern, as most are placed in a higher category (effectively, over-triaged) when adult physiology-based triage scores are used. This may even compromise the care of adults when less severely injured children are channelled to high-priority care areas.[16] It is recommended that the adult triage score be modified in preference to implementing paediatric-specific triage scores,[16] as most of the latter have poor sensitivity for major incidents and fail to identify patients with serious injury. The over-triage of children could even be beneficial, especially when only small numbers of children are affected.[17]
The mortality rate in major incidents differs depending on the definition of a major incident used. This study defined major incidents as any significant incident that demanded extraordinary resources for live casualties and that overwhelmed the healthcare system.[1] The portion of patients who died was similar to international studies: 4.4% in the Western Cape compared with 10.4% in Pakistan, 6% in Korea and 3.8% in Finland.[3,7,9] In contrast, most patients (54.6%) sustained only minor injuries. Similar findings are reported in major incidents in Britain.[2]
Study limitations
There is no external method available to confirm that the scene commander appropriately declared a major incident or that data were recorded accurately at the time of the incident. All EMS personnel are trained according to the MIMMS principles that contain the definition of a major incident.[1] Personnel from the EMS control centre were also trained on the completion of the data collection sheets and to elicit the required data from the scene commanders. This should have ensured quality of the data, while minimising missing data points. The transcription process was done by a single research assistant but was not cross-checked; errors may therefore have occurred that could have influenced the results. Incomplete data forms with missing variables also limited the generalisability of the study results.
Conclusion
Major incidents occurred frequently in the Western Cape, and contingency plans should always be in place. Road traffic crashes were by far the biggest contributor, requiring both legislation and enforcement regarding road safety. A national database on major incidents will provide a better perspective of the burden of disease they create.
References
1. Advanced Life Support Group. Major Incident Medical Management and Support. 3rd ed. Oxford: Wiley-Blackwell, 2011. [ Links ]
2. Carley S, Mackway-Jones K, Donnan S. Major incidents in Britain over the past 28 years: The case for the centralised reporting of major incidents. J Epidemiol Community Health 1998;52(6):392-398. [http://dx.doi.org/10.1136/jech.52.6.392] [ Links ]
3. Waseem H, Carenzo L, Razzak J, et al. Epidemiology of major incidents: An EMS study from Pakistan. Int J Emerg Med 2011;4(1):48. [http://dx.doi.org/10.1186/1865-1380-4-48] [ Links ]
4. World Association for Disaster and Emergency Medicine. Health disaster management: Guidelines for evaluation and research in the Utstein Style. Volume I. Conceptual framework of disasters. Prehosp Disaster Med 2003;17(Suppl 3):1-177. http://www.wadem.org/guidelines.html (accessed 7 September 2015). [ Links ]
5. Statistics South Africa. Census 2011 Statistical Release - P0301.4. Pretoria: SSA, 2012. http://www.statssa.gov.za/publications/P03014/P030142011.pdf (accessed 4 September 2014). [ Links ]
6. Statistics South Africa. Census 2011 Municipal Report - Western Cape. Pretoria: SSA, 2012. https://www.statssa.gov.za/Census2011/Products/WC_Municipal_Report.pdf (accessed 4 September 2014). [ Links ]
7. Kim SJ, Kim CH, Shin SD, et al. Incidence and mortality rates of disasters and mass casualty incidents in Korea: A population-based cross-sectional study, 2000-2009. J Korean Med Sci 2013;28(5):658-666. [http://dx.doi.org/10.3346/jkms.2013.28.5.658] [ Links ]
8. Beck A, Bayeff-Filloff M, Bischoff M, et al. 'Analysis of the incidence and causes of mass casualty events in a southern Germany medical rescue area1. Unfallchirurg 2002;105(11):968-973. [http://dx.doi.org/10.1007/s00113-002-0516-2] [ Links ]
9. Kuisma M, Hiltunen T, Mááttá T, et al. Analysis of multiple casualty incidents - a prospective cohort study. Acta Anaesthesiol Scand 2005;49(10):1527-1533. [http://dx.doi.org/10.1111/j.1399-6576.2005.00761.x] [ Links ]
10. Government of Punjab, Pakistan. Quick Stats - Punjab Portal. Lahore, Punjab, 2014. http://www.punjab.gov.pk/punjab_quick_stats (accessed 22 August 2014). [ Links ]
11. Arcos Gonzalez P, Pérez-Berrocal Alonso J, Castro Delgado R, et al. Trends in disasters in Spain and their impact on public health: 1950-2005. Public Health 2007;121(5):375-377. [http://dx.doi.org/10.1016/j.puhe.2006.11.014] [ Links ]
12. World Health Organization. Global Status Report on Road Safety 2013: Supporting a Decade of Action. Geneva: WHO, 2013. http://www.who.int/violence_injury_prevention/road_safety_status/2013/report/en/ (accessed 4 September 2014). [ Links ]
13. Statistics South Africa. National Household Travel Survey 2013. Pretoria: SSA, 2014. http://beta2.statssa.gov.za/publications/P0320/P03202013.pdf (accessed 4 September 2014). [ Links ]
14. Arrive Alive South Africa. Minibus Taxis and Road Safety. http://www.arrivealive.co.za/Minibus-Taxis-and-Road-Safety (accessed 4 September 2014). [ Links ]
15. Road Traffic Management Corporation. Annual Report 2011/2012. Faerie Glen: RTMC, 2013. http://www.rtmc.co.za/images/docs/publication.pdf (accessed 4 September 2014). [ Links ]
16. Carley SD, Mackway-Jones K, Donnan S. Delphi study into planning for care of children in major incidents. Arch Dis Child 1999;80(5):406-409. [http://dx.doi.org/10.1136/adc.80.5.406] [ Links ]
17. Wallis LA, Carley S. Comparison of paediatric major incident primary triage tools. Emerg Med J 2006;23(6):475-478. [http://dx.doi.org/10.1136/emj.2005.032672] [ Links ]
Accepted 15 September 2014.
Corresponding author: D J van Hoving (nvhoving@sun.ac.za)

