


Services on Demand
Article
 English (pdf)
 Article in xml format
 Article references
Indicators

Related links
-
 Cited by Google
 -
 Similars in Google
Share

 Permalink
SAMJ: South African Medical Journal
On-line version ISSN 2078-5135
Print version ISSN 0256-9574
SAMJ, S. Afr. med. j. vol.105 n.8 Pretoria Aug. 2015
http://dx.doi.org/10.7196/SAMJNEW.7791
RESEARCH
Do low levels of physical activity in female adolescents cause overweight and obesity? Objectively measured physical activity levels of periurban and rural adolescents
I Cook
PhD. Physical Activity Epidemiology Laboratory, Kinesiology Discipline, Faculty of Humanites, University of Limpopo, Sovenga, Limpopo, South Africa
ABSTRACT
BACKGROUND: The increase in obesity levels in South African adolescents is attributed to an energy imbalance such that physical inactivity is causally related to adiposity. However, in some settings obesity occurs in spite of high physical activity levels.
OBJECTIVES: To examine objectively measured physical activity levels of rural black female and male adolescents from periurban to rural settings in relation to weight status, and specifically the direction and strength of the associations.
METHODS: Seven-day accelerometry-derived pedometry data (step counts and activity energy expenditure) were collected for 17 adolescents (85 females, 93 males; age 13.7 - 18.0 years) living in six demographic surveillance site villages. Anthropometric measures were body mass index (kg/m2), waist circumference (cm) and sum of skinfolds (mm). Weight status was determined using international growth standards for stunting, underweight (UW), normal weight (NW), overweight (OW) and obesity (OB).
RESULTS: Females had greater adiposity and lower 7-day average step counts and activity energy expenditure, and achieved fewer day at >10 000 steps and more days at <5 000 steps (p<0.05). The age and gender-weighted prevalences for female/male stunting, UW-NW OW-OB, <5 000 steps/day and >12 500 steps/day were 12.4%/20.7%, 74.3%/99.1%, 25.8%/0.9%, 12.3%/0.9% and 50%/64.9%, respectivel (females v. males, p<0.05). In multivariate models (weighted and adjusting for age, gender, village, season), step counts and activity energy expenditure were positively related to adiposity measures (p<0.05).
CONCLUSION: Both UW-NW and OW-OB periurban to rural adolescents were active to highly active on most days of the week. Physical activity was directly associated with adiposity measures.
Recently Mokabane et al. asserted that black female periurban adolescents exhibited low levels of physical activity and high levels of sedentary behaviour, and that there is a causal, unidirectional, inverse relationship between physical activity and adiposity.[1] However, contrary to their conclusions, the data they presented show female adolescents who are active to highly active and not overly sedentary.[1] First, the physical activity levels reported are in excess of the daily 60 minutes of recommended health-enhancing physical activity (HEPA) for adolescents.[2] Moreover, their estimate of HEPA did not include active commuting (cycling, walking).[1] Second, the sedentary time reported[1] is not in excess of the limit recommended for adolescents.[2] Third, acknowledging that association does not prove causality, an association should be robust, significant and in the expected direction to even consider that a causal relationship may exist. In this regard, there is evidence for reverse and bidirectional causal relationships between physical activity and adiposity.[3]
The Dikgale Health and Demographic Surveillance System (HDSS) site in Limpopo Province, South Africa,[4] provides objectively measured physical activity data to examine: (i) whether female and male adolescents from periurban to rural settings are indeed physically inactive; and (ii) whether significant, robust inverse relationships exist between physical activity and adiposity measures.
Methods
The methodology behind these cross-sectional data is described in detail elsewhere.'41 Briefly, 7-day accelerometry-based pedometry data and anthropometric measures were obtained from 178 male and female adolescents (age range 13.7 - 18.0 years) residing in the Dikgale HDSS site across six villages varying in infrastructure and amenities. Only 26 participants were recruited from three villages (Ntsima, Ga-Tjale, Moduane), and because these three villages are geographically closely linked they were combined. The study was approved by the Ethics Committee of the University of Limpopo.
Anthropometric outcomes were body mass index (BMI, kg/m2), waist circumference (WC, cm) and sum of two skinfolds (triceps + subscapular, SSKF, mm). BMI was classified as underweight (UW), normal weight (NW), overweight (OW) or obese (OB), depending on the adolescent's age and gender, based on adult BMI cut-offs at 18 years as recommended by the International Obesity Task Force (IOTF).[5,6] Height-for-age z-scores (HAZ) were generated using the 2007 World Health Organization (WHO) growth standards.[7] HAZ <-2 was classified as stunted. Daily step counts and activity energy expenditure were summed and averaged for 7 days. Standard step count categories that complemented adolescent cut-points were used.[8]
Descriptive statistics comprised means and one standard deviation (SD), quartiles and prevalence. Post-stratification weights by age and gender were derived from the Dikgale HDSS site population[4] to adjust for bias introduced through convenience sampling and applied to all subsequent procedures except basic descriptive statistics, independent t-tests and repeated measures with post hoc analyses which were used to compare variables across gender, weight status and days. Where required, corrections were applied for multiple comparisons. Relationships between categorical variables and differences between proportions were examined through Pearson's χ2 and z-tests with correction for multiple comparisons. Forced multiple linear regression models were constructed with adiposity and pedometry variables as dependent variables and report the association between variables with zeroorder correlation coefficients. Explanatory variables that were forced into the model were gender, age, village, season, adiposity (BMI, WC, SSKF) and average 7-day step count. Appropriate data transformations and non-parametric statistical procedures were used to confirm parametric results if data were not normally distributed. Data were analysed using appropriate statistical software (IBM SPSS Statistics Release 22.0.0.0 (IBM Corporation, USA, 2013) and GraphPad Prism version 6.04 (GraphPad Software, USA, 2014)). Significance for all inferential statistics was set at p<0.05.
Results and discussion
Females displayed significantly greater adiposity and lower 7-day average step count and activity energy expenditure, and achieved fewer days at >10 000 steps and more days at <5 000 steps (p<0.05) (Table 1). Significantly more males achieved an average of >12 500 steps/day (p<0.05), and significantly more females fell into the sedentary category (<5 000 steps/day) (p<0.05) (Table 2). The level of activity of the Dikgale adolescents was remarkable, with some achieving two to three times the recommended levels[8] (Fig. 1, A) and nearly 60% of the sample achieved an average daily step count of >12 500 steps (Table 2). One obese female (BMI 46.3) achieved >10 000 steps on 5 days, of which 2 days approached 20 000 steps (Fig. 1, A). The very high step volumes achieved in the Dikgale sample are in good agreement with the high objectively measured volumes of physical activity in rural black adolescents in another HDSS site.[9] In fact the accelerometry-measured volumes were nearly three times higher than those for adolescents in the UK,[9] and Dikgale sample achieved average daily step counts more than 1.5 times higher than those reported for North American children and adolescents.[8]
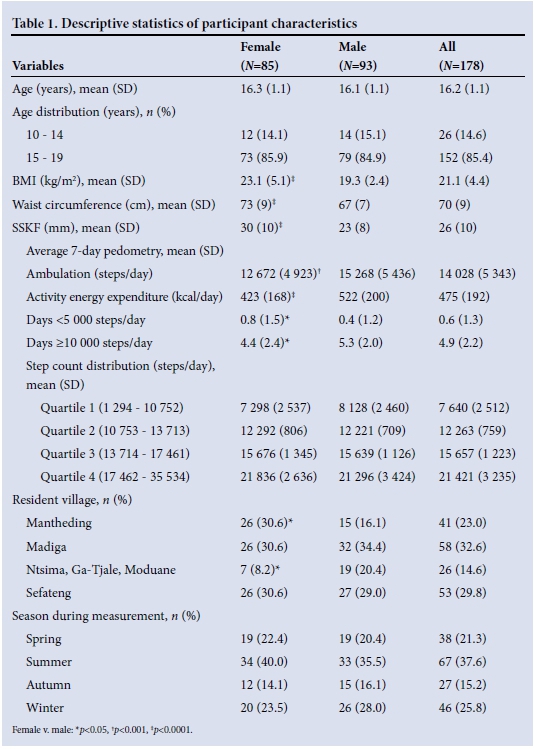
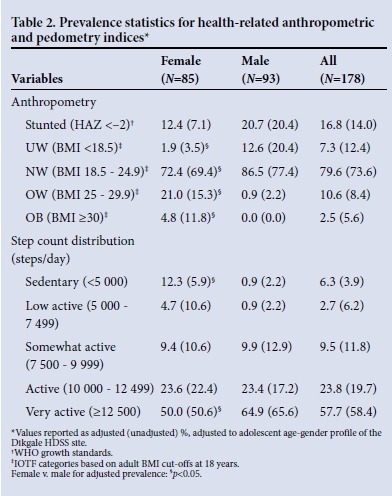
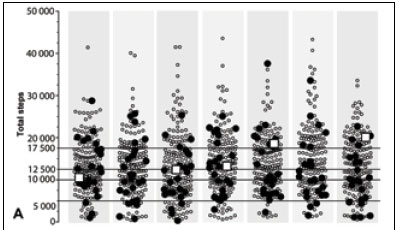

OW-OB adolescents often accrued some of the highest daily step counts, and there was no clear pattern of consistently lower daily step counts in the OW-OB group (Fig. 1, A). Daily step counts were not significantly lower for the OW-OB group compared with the UW-NW group (p>0.05) (Fig. 1, B). Because 92% of the OW-OB group consisted of females, with only two OW males, the female step profile was similar to the OW-OB profile. However, there was a noticeably lower step count for the OW-OB group on Wednesdays and especially on Saturdays, suggesting reduced participation in usual sporting/ recreational activities in OW-OB females (Fig. 1, B). In contrast, males achieved significantly higher step counts on weekend days and some weekdays (p<0.05) (Fig. 1, B). The significant gender-specific patterns midweek and over weekends were probably due to females attending less active social activities on Wednesdays and males participating in sport (mainly soccer) on Saturdays, so that overall Saturday step counts were significantly higher than Tuesday and Wednesday step counts (p<0.05) (Fig. 1, B).
Micklesfield et at.[10]categorised their self-reported physical activity data for adolescent rural black African females, nearly identical in age and BMI to the Polokwane group, such that a comparison was possible with the physical activity data reported by Mokabane et at.[1] Assuming 5 days per week for moderate to vigorous physical activity (MVPA, e.g. organised school and club sport), the Agincourt HDSS sample would be more sedentary (+52 minutes per day) and participate in less MVPA (-50 minutes per day) and less home-based informal play/recreation (-21 minutes per day), resulting in a total physical activity volume of 1.1 hours per day, excluding the 40 minutes per day, 5 days per week active travel to school. In contrast, the Polokwane group reported double the amount of physical activity, 2.2 hours per day.[1] Considering that the HEPA recommendation[2] for adolescents is 60 minutes per day and the reported daily sedentary time was no more than 2 hours, it seems likely that the Polokwane group did not 'spend a significant amount of time in sedentary activities or 'spend very little time being physically active'.[1]Even allowing for significant over-reporting in the Polokwane group it would be difficult to classify them, on the basis of the data provided, as being sedentary and physically inactive.
The Dikgale results for weight status category prevalence are in good agreement with national estimates for Limpopo adolescents[11] and rural black adolescents (Table 2).[12] Kimani-Murage et al.[13] reported that 3% of their sample displayed concurrent stunting and OW-OB, which is in contrast to the Dikgale weighted prevalence (OW-OB 21.4%). Estimates of the prevalence of OW-OB among male adolescents in the Agincourt HDSS site show a peak of approximately 5%, which is in agreement with the Dikgale weighted estimate of 0.9% (Table 2).[13] Likewise, estimates of the prevalence of OW-OB among female adolescents in the Agincourt HDSS site peak at 20 - 25%, which is similar to the present estimate of 25.8% (Table 2).[13]
The weight status prevalence for females reported by Mokabane et al.[1] yielded some anomalous results. Irrespective of weighting, the present results (Table 2) stand in contrast to their UW category prevalence (1.9 - 3.5% v. 16.1%, respectively) and OW-OB prevalence (25.8 - 27.1% v. 16.1%, respectively). The weight status prevalence of the Dikgale sample was also determined using the adult BMI definitions without computing IOTF BMI categories and yielded a similar elevated female UW prevalence (10.6%). Consequently there is uncertainty as to the methodology used by Mokabane et al.[1] to evaluate the weight status of their sample.
Overall there was no significant difference between UW-NW and OW-OB for active to very active weighted prevalence (83.5% v. 71.4%, respectively). In Madiga, Ntsima, Ga-Tjale, Moduane and Sefateng, just as many OW-OB as UW-NW subjects were active to very active (>80%), yet in Mantheding, more UW-NW than OW-OB subjects were active to very active (57.1% v. 18.2%; p<0.05). Similarly, overall there was no significant difference in sedentary weighted prevalence (7.4% v. 2.4%, respectively) or step count quartile 1 weighted prevalence (23.2% v. 27.9%, respectively) between UW-NW and OW-OB subjects. Only in Mantheding was step count quartile 1 weighted prevalence higher in the OW-OB group than the UW-NW group (81.8% v. 41.7%, respectively; (p<0.05). Since village residence status appears to modulate the expected prevalence profile (OW-OB prevalence lower in active to very active groups and higher in sedentary to low active groups), this suggests that a unidirectional inverse relationship between physical activity and adiposity may not hold in all circumstances.
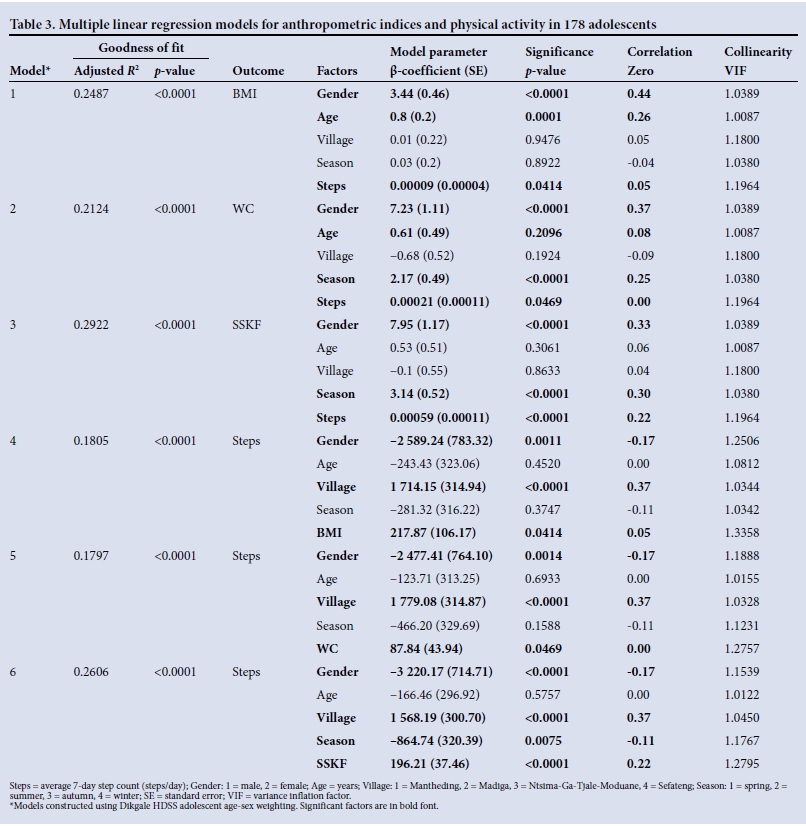
Independent of gender, age, village and season, adiposity measures were positively associated with step counts, albeit weakly so (Table 3). In other words, higher walking volumes were associated with higher levels of adiposity. The increase in adiposity was higher in females, increased with age, was higher during colder months and was directly associated with step counts (models 1 - 3, Table 3). An increase in step counts was higher in males, in villages with less infrastructure, during warmer months and with increasing adiposity (models 4 - 6, Table 3). Interestingly, step counts decreased but adiposity increased with decreasing seasonal temperature (p<0.01). However, overall, adiposity increased as step counts increased once other contributing factors were held constant (Table 3). The same analyses were run using activity energy expenditure instead of step counts, because in addition to purposeful walking accelerations, non-walking, low-intensity, incidental accelerations are also detected and recorded in this measure. Very similar models and coefficient significance and directions were found, although zero-order correlations between activity energy expenditure and adiposity measures were slightly stronger (r=0.10 to r=0.30; p<0.01) (data not shown). These results suggest a more nuanced explanation of causal pathways, as opposed to a strictly unidirectional approach.[1]
Conclusion
It is difficult to concur with Mokabane et al.[1] that their data are evidence of an energy imbalance through a sedentary, physically inactive lifestyle. Moreover, the methodology employed to ascertain weight status was of concern. Insufficient details were provided, and the results suggested that the appropriate growth standards were not applied to their raw data. Consequently, there appears to be a disjoint between the data they reported and the subsequent conclusions and recommendations.[1]
The results reported here are certainly not conclusive, yet do provide some interesting anomalous associations in light of the traditional energy balance hypothesis,[1] i.e. an inverse relationship between physical activity and adiposity levels. This should at least suggest that other explanations may be considered as to why there is increasing adiposity in some communities where physical activity levels are very high and food insecurity and poverty are elevated.
The investigation of physical activity, inactivity and sedentary behaviour must move beyond the widely accepted unidirectional causality and consider the alternative hypothesis that increasing adiposity, especially in rural and periurban populations that are active to highly active, may be due to factors related to diet quality and energy partitioning rather than energy balance.[14] In this regard, there is agreement with Mokabane et al.[1]that certain macronutrients are over-emphasised in the adolescent diet. Indeed, in the Dikgale HDSS adult and child populations, consumption of carbohydrates is very high and protein/ fat intake is low.[15,16] In the Dikgale setting, the data suggest that being obese does not deterministically result in lower physical activity levels.[17] Rather, obligatory subsistence requirements coupled with social and environmental factors[18] appear to override the purely biological/endocrinological drives[17] that reduce physical activity, provided the integrity of biological systems/organs is not threatened.
Funding disclosure. The Research Development and Administration Division of the University of Limpopo and the Thuthuka Programme of the National Research Foundation supported this study
References
1. Mokabane M, Mashao M, van Staden M, Potgieter M, Potgieter A. Low levels of physical activity in female adolescents cause overweight and obesity: Are our schools failing our children? S Afr Med J 2014;104(10):665-667. [http://dx.doi.org/10.7196/SAMJ.8577] [ Links ]
2. Botha C, Wright H, Moss S, Kolbe-Alexander TL. "Be active!' Revisiting the South African food-based dietary guideline for activity. S Afr J Clin Nutr 2013;26(3):S18-S27. [ Links ]
3. Richmond RC, Smith GD, Ness AR, et al. Assessing causality in the association between child adiposity and physical activity levels: A Mendelian randomization analysis. PLoS Med 2014;11:e1001618. [http://dx.doi.org/10.1371/journal.pmed.1001618] [ Links ]
4. Cook I, Alberts M, Brits JS, Choma S, Mkhonto SS. Descriptive epidemiology of ambulatory activity in rural, black South Africans. Med Sci Sports Exerc 2010;42(7):1261-1268. [http://dx.doi.org/10.1249/mss.0b013e3181ca787c] [ Links ]
5. Cole TJ, Bellizzi MC, Flegal KM, Dietz WH. Establishing a standard definition for child overweight and obesity worldwide: International survey. BMJ 2000;320:1240. [http://dx.doi.org/10.1136/bmj.320.7244.1240] [ Links ]
6. Cole TJ, Flegal KM, Nicholls D, Jackson AA. Body mass index cut offs to define thinness in children and adolescents: International survey. BMJ 2007;335:194. [http://dx.doi.org/10.1136/bmj.39238.399444.55] [ Links ]
7. De Onis M, Onyango AW, Borghi E, et al. Development of a WHO growth reference for school-aged children and adolescents. Bull World Health Organ 2007;85(9):660-667. [http://dx.doi.org/10.2471/blt.07.043497] [ Links ]
8. Tudor-Locke C, Craig C, Beets M, et al. How many steps/day are enough? For children and adolescents. Int J Behav Nutr Phys Act 2011;8:78. [http://dx.doi.org/10.1186/1479-5868-8-78] [ Links ]
9. Craig E, Bland R, Reilly J. Objectively measured physical activity levels of children and adolescents in rural South Africa: High volume of physical activity at low intensity. Appl Physiol Nutr Metab 2013;38(1):81-84. [http://dx.doi.org/10.1139/apnm-2012-0115] [ Links ]
10. Micklesfield LK, Pedro TM, Kahn K, et al. Physical activity and sedentary behavior among adolescents in rural South Africa: Levels, patterns and correlates. BMC Public Health 2014;14:40. [http://dx.doi.org/10.1186/1471-2458-14-40] [ Links ]
11. Reddy SP, James S, Sewpaul R, et al Umthente Uhlaba Usamila - the South African Youth Risk Behaviour Survey 2008. Cape Town: South African Medical Research Council, 2010:37-38, 106-107, 156-157. http://www.mrc.ac.za/healthpromotion/yrbs_2008_final_report.pdf (accessed 18 December 2014). [ Links ]
12. Reddy SP, Resnicow K, James S, et al Rapid increases in overweight and obesity among South African adolescents: Comparison of data from the South African National Youth Risk Behaviour Survey in 2002 and 2008. Am J Public Health 2012;102(2):262-268. [http://dx.doi.org/10.2105/ajph.2011.300222] [ Links ]
13. Kimani-Murage EW, Kahn K, Pettifor JM, et al. The prevalence of stunting, overweight and obesity, and metabolic disease risk in rural South African children. BMC Public Health 2010;10:158. [http://dx.doi.org/10.1186/1471-2458-10-158] [ Links ]
14. Willett WC, Leibel RL. Dietary fat is not a major determinant of body fat. Am J Med 2002;113(Suppl9B):47S-59S. [http://dx.doi.org/10.1016/s0002-9343(01)00992-5] [ Links ]
15. Mamabolo RL, Alberts M, Steyn NP, Delemarre-van de Waal HA, Levitt NS. Prevalence and determinants of stunting and overweight in 3-year-old black South African children residing in the Central Region of Limpopo Province, South Africa. Public Health Nutr 2005;8(5):501-508. [http://dx.doi.org/10.1079/phn2005786] [ Links ]
16. Steyn NP, Burger S, Monyeki KD, Alberts M, Nthangeni G. Seasonal variation in dietary intake of the adult population of Dikgale. S Afr J Clin Nutr 2001;14(4):140-145. [ Links ]
17. Ludwig DS, Friedman MI. Increasing adiposity: Consequence or cause of overeating? JAMA 2014;311(21):2167-2168. [http://dx.doi.org/10.1001/jama.2014.4133] [ Links ]
18. Panter-Brick C. Issues of work intensity, pace, and sustainability in relation to work context and nutritional status. Am J Hum Biol 2003;15(4):498-513. [http://dx.doi.org/10.1002/ajhb.10189] [ Links ]
Accepted 30 May 2015
Corresponding author: I Cook (ian.cook@ul.ac.za)

