


Servicios Personalizados
Articulo
 Inglés (pdf)
 Articulo en XML
 Referencias del artículo
Indicadores

Links relacionados
-
 Citado por Google
 -
 Similares en Google
Compartir

 Permalink
SAMJ: South African Medical Journal
versión On-line ISSN 2078-5135
versión impresa ISSN 0256-9574
SAMJ, S. Afr. med. j. vol.104 no.3 Pretoria mar. 2014
RESEARCH
Cardiometabolic markers to identify cardiovascular disease risk in HIV-infected black South Africans
J M van RooyenI; C M T FourieII; H S SteynI; G KoekemoerIV; H W HuismanV; R SchutteV ; L MalanII; M GlynV; W SmithV; C MelsV; A E SchutteV
IDSc. Hypertension in Africa Research Team, School of Physiology, Nutrition and Consumer Sciences, Potchefstroom Campus, North-West University,
Potchefstroom, South Africa
IIRN, PhD. Hypertension in Africa Research Team, School of Physiology, Nutrition and Consumer Sciences, Potchefstroom Campus, North-West University,
Potchefstroom, South Africa
IIIDSc. Statistical Consultation Services, Potchefstroom Campus, North-West University, Potchefstroom, South Africa
IVPhD. Statistical Consultation Services, Potchefstroom Campus, North-West University, Potchefstroom, South Africa
VPhD. Hypertension in Africa Research Team, School of Physiology, Nutrition and Consumer Sciences, Potchefstroom Campus, North-West University, Potchefstroom, South Africa
ABSTRACT
BACKGROUND: The prevalence of HIV is the highest in sub-Saharan Africa; South Africa (SA) is one of the most affected countries with the highest number of adults living with HIV infection in the world. Besides the traditional risk factors for cardiovascular disease (CVD) in the general population, in people living with HIV there are specific factors - chronic inflammation, metabolic changes associated with the infection, therapy, and lipodystrophy - that potentially increase the risk for developing CVD.
OBJECTIVE: This study proposes a screening discriminant model to identify the most important risk factors for the development of CVD in a cohort of 140 HIV-infected black Africans from the North West Province, SA.
METHODS: Anthropometric measures, systolic blood pressure, diastolic blood pressure and the carotid-dorsalis pedis pulse wave velocity were determined. Blood was analysed to determine the levels of total cholesterol (TC), high-density lipoprotein cholesterol (HDL-C), low-density lipoprotein cholesterol, triglycerides (TGs) and glucose. Partial least squares discriminant analysis was performed as a supervised pattern recognition method. Independent Student's t-tests were further employed to compare the means of risk factors on interval scales; for comparison of categorical risk factors between groups, x2 tests were used.
RESULTS: A TG:HDL-C ratio >1.49, TC:HDL-C ratio >5.4 and an HDL-C level <0.76 mmol/l indicated CVD risk in this cohort of patients living with HIV.
CONCLUSION: The results have important health implications for black Africans living with HIV as these lipid levels may be a useful indicator of the risk for CVD.
HIV prevalence is highest in sub-Saharan Africa, with South Africa (SA) being one of the most affected countries with the highest number of adults living with HIV in the world.[1] The use of antiretroviral therapy (ART) has improved the quality and life expectancy in the HIV-infected population worldwide.[2] The HIV-infected population in SA gained free access to ART through the antiretroviral (ARV) roll-out programme,[3] which has made HIV a manageable disease in SA.
However, infection with HIV and the treatment thereof may affect the heart and vasculature, leading to the development of cardiovascular disease (CVD),[4] which currently, after cancer, is the most frequent cause of death among HIV-infected individuals.[2] In SA, CVDs such as hypertension, atherosclerotic disease and heart failure are increasing among the black African population,[5,6] which could be exacerbated by the high number of people living with HIV in SA. Furthermore, the HIV-infected population is ageing and, since age is a major non-modifiable risk factor for CVD, the risk for CVD may be expected to increase progressively in this population. [2] In relation to CVD, HIV infection is associated with an increase in insulin resistance, dyslipidaemia,[7] lipodystrophy,[8,9] endothelial dysfunction,[10] accelerated atherosclerosis[11] and coagulation disorders.[12] Lipid abnormalities, characterised by low high-density lipoprotein cholesterol (HDL-C) and high triglyceride (TG) levels form a large part of the risk for CVD in the HIV-infected population, and may be related to the viral infection, ART or both.[4] Even though black Africans normally exhibit lower fasting TG and higher HDL-C levels than whites,[13] the HDL-C levels of HIV-infected black South Africans were found to be lower than the levels normally associated with increased risk for the development of CVD.[14] Besides the risk factors for CVD seen in the general population, there are specific factors in people living with HIV that could increase risk, i.e. chronic inflammation, metabolic changes associated with the infection, its therapy and lipodystrophy.
HIV-infected people are managed in clinics through the ARV roll-out programme in SA. Early identification and management of CVD complications is essential, but also difficult as resources are not always readily available. The development of a non-invasive tool to help identify individuals who are most likely to derive clinical benefit from CVD risk-reduction therapy is therefore of great importance. This study aimed to identify the most important risk factors for the development of CVD in a cohort of 140 HIV-infected black Africans from the North West Province, SA.
Methods
Study design and participants
This cross-sectional sub-study is embedded in the international Prospective Urban and Rural Epidemiology (PURE) study, which was designed to address questions regarding the cause and development of cardiovascular risk factors and disease.[15] In the present sub-study we included 154 HIV-uninfected and 140 HIV-infected persons known to be infected for at least three years. Data collection took place in 2008 and the 140 HIV-infected participants were used in a hierarchical cluster analysis[16] to separate participants with and without risk for the development of CVD. HIV-infected participants were stratified into risk and no risk groups and the following variables were assessed: age; body mass index (BMI); waist-to-hip ratio; systolic blood pressure (SBP); diastolic blood pressure (DBP); carotid-dorsalis pedis pulse wave velocity (cdPWV); total cholesterol (TC); HDL-C; low-density lipoprotein cholesterol (LDL-C); TG; TG:HDL-C ratio; TC:HDL-C ratio; and glucose. The group identified by the analysis as exhibiting CVD risk factors was cross validated for the cut-off values for CVD risk according to the SA guidelines.[17] All the participants in the CVD risk group exhibited one or more CVD risk factors. The cluster analysis was based on the cardiometabolic profile of the HIV-infected participants and was used to separate the HIV-infected participants into a group exhibiting risk factors for the development of CVD and a group without CVD risk factors.
Of the participants, 63 received ART consisting of two nucleoside reverse transcriptase inhibitors (stavudine and lamivudine) plus one non-nucleoside reverse transcriptase inhibitor (efavirenz or nevirapine). Twenty of the 63 participants had received ART for >2 years. The mean CD4+ cell count for those receiving ART was 260 cells/ul and for those not receiving ART was 264 cells/ul.
All participants provided signed informed consent after all procedures were explained in their home language. The study protocol complies with the Declaration of Helsinki as revised in 2008 and was approved by the Ethics Committee of the North-West University, Potchefstroom, SA (code 04M10).
Experimental protocol
During data collection, the participants arrived at the research locality of the rural or urban areas at 08h00 each morning after a 10 - 15-min drive (provided by the research team) from their communities. The participants were introduced to the planned research and, after the procedures were explained, they signed informed consent forms and received HIV pre-counselling from trained counsellors. In the course of the morning, demographic and lifestyle questionnaires were completed with the help of specially trained field workers in each subject's home language. Lifestyle data included self-reported current tobacco and alcohol use as well as medical history. Referrals to the local clinic or hospital, if necessary, and feedback on HIV status and cardiovascular variables were provided to participants during individual post-counselling.
Anthropometric measurements
Height, weight, hip and waist circumference (WC) were measured (Precision Health Scale, A & D Company, Japan; Invicta Stadiometer, IP 1465, UK; Holtain unstretchable metal tape) using standardised procedures.[18]
Demographic questionnaire
Demographic and lifestyle information were obtained from the above-mentioned questionnaire.
Cardiovascular measurements
SBP and DBP were obtained with the validated OMRON HEM-757 apparatus (Omron Healthcare, Japan). After a 10-min rest period, blood pressure measurements were performed twice (5 min apart) on the right arm while the participant was seated upright and relaxed with his/her right arm supported at heart level. Appropriate sized cuffs were used for obese participants.
Pulse wave velocity, a measure of arterial stiffness, was measured on the left side of each participant in the supine position. The measurement was determined using non-invasively accessible superficial pulses with the Complior SP device (Artech-Medical, France) in a segment over the carotid-dorsalis pedis vessels.
Blood, serum and plasma samples
The subjects were required to fast overnight. Blood was drawn from the brachial vein using a sterile winged infusion set and syringes. Serum and plasma samples were prepared according to appropriate methods and stored at -80°C. In rural areas, samples were stored at -18°C (for no longer than five days) until transported to the laboratory facility and then stored at -80°C until analysis.
Biochemical analysis
Quantitative determinations of the TC, HDL-C, TG and glucose were performed with the Beckman Coulter DxC 800 Synchron Clinical System (Beckman Coulter Inc., USA). LDL-C was calculated by using the Friedewald formula.[19] HIV status was determined with the First Response rapid HIV card test (PMC Medical, India) using whole blood. If tested positive, the test was repeated with the Sensa card test (Seyama Solutions, SA).
Statistical analysis
Statistical analysis was performed using Statistica (version 10.0) and R (version 2.13). Independent Student's f-tests were used to compare means of risk factors on interval scales; for comparison of categorical risk factors between groups, x2 tests were used.
Multivariate analysis was performed in the form of pattern recognition methods. Pattern recognition methods are commonly divided into supervised and unsupervised methods, where supervised methods make use of the grouping of information in the data. Prior to multivariate analysis, the input data were scaled using the transformation Y = log[X/X], where X is the arithmetic mean. This transformation was applied to make the scales of the CVD risk factors more comparable, so that the factors with larger scales would not dominate in the multivariate analysis. Hierarchical cluster analysis using the method of Ward[16] with an euclidean distance measure was then performed as an unsupervised pattern recognition method to create two clusters of cases with similar multivariate profiles concerning the CVD risk factors measured. These clusters contain cases with and without CVD risk within the 140 HIV-infected participants. Using these clusters as dependent variables and the risk factors as independent predictors, a partial least squares (PLS) discriminant analysis (DA) was performed as a supervised pattern recognition method. Although the PLS-DA model can be used to predict a person's cluster membership given the CVD risk factors as input, our aim in fitting this model was to identify those risk factors that contribute most (in a multivariate sense) to the existence of the grouping (clusters) formed by the cluster analysis.
The variable importance in the projection (VIP) from PLS-DA is a measure that is commonly used in this regard. Risk factors with a VIP value >1 were used as the criteria for variable selection.[20] To validate the interpretations made from the discriminant model, the following fit statistics are reported: percentage of variance explained for the risk factors (R2X), the percentage variance explained for the dependent variable (R2Y), the predictive R2Y values (Q2) and cross-validated estimates of sensitivity (percentage true positives) and specificity (percentage true negatives). The model dimension was selected using the Q2 statistics. The cross-validated estimates of sensitivity and specificity are calculated to confirm that the PLS-DA model did not overfit the data. Hence, whether the model could make accurate cluster predictions for cases unseen by the model was investigated. These estimates were calculated as follows:
A PLS-DA model was constructed using all 140 cases. This model was used to determine a cut-off point for the model predicted value (used to make cluster predictions) by calculating the Youden index. [21] Then, 10 000 unique stratified samples of size 39 (24 from cluster 1 and 15 from cluster 2) were randomly selected and excluded from the data. This equated to an exclusion of ~30% of the data. For each of the 10 000 samples, a PLS-DA model was constructed using the remaining cases, after which the cluster membership of the withheld cases was predicted. For each of the 10 000 trials, the sensitivity and specificity were recorded and finally averaged to find the cross-validation estimates of sensitivity and specificity.
Receiver-operating characteristic (ROC) analysis was used to determine the optimum cut-off values (based on the Youden index) for risk and no risk in HIV-infected participants to develop CVD for each of the selected variables.[21]
Results
In Table 1, the characteristics of HIV-infected participants are compared with the uninfected control participants. The HIV-infected participants had significantly lower SBP, TC and HDL-C levels. However, their TC:HDL-C and TG:HDL-C ratios were significantly higher compared with the uninfected control group.

The dendrogram of the cluster analysis of the 140 infected participants is shown in Fig. 1, from which a clear separation of the cases is visible. To identify the risk factors that contribute most to the separation, a PLS-DA model was constructed using the clusters formed (Fig. 1) as dependent variables and the risk factors as independent variables. One component was extracted for the PLS-DA model based on the Q2 value. The summary fit statistics of the PLS-DA model indicated that the model accounted for only 23.2% of the total variance observed in the scaled risk factors; however, the variance explained for the dependent variable is 61.5%. The Q2 value was 0.602, which indicated that the model did not overfit the data, and that good prediction performance could be expected if required. This was further confirmed by the cross-validation estimates of sensitivity and specificity, which were 94.4% and 93.3%, respectively. The respective standard errors of these estimates were 6% and 4.7%. From these statistics we concluded that the PLS-DA model fits reasonably well and could be used to identify risk factors that separated the group into no- and high-CVD risk within the HIV-infected participants.

There was no statistically significant difference between the risk and no-risk groups concerning age, gender, BMI, ART, alcohol or tobacco use. The CD4+ count (291 v. 225 cells/ul; p=0.08) also did not differ significantly when no-risk and risk groups were compared.
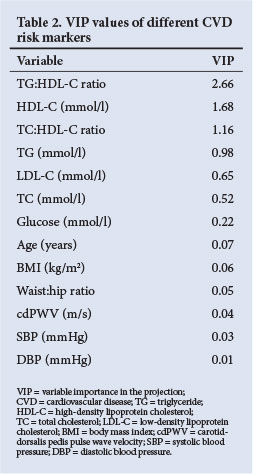
VIP values are presented in Table 2, from which TG:HDL-C ratio, HDL-C and TC:HDL-C ratio were identified as the risk factors that primarily cause group separation. Tobacco and alcohol use were not included in the PLS-DA as it was obtained from a self-reported questionnaire. High-sensitivity C-reactive protein (hsCRP) was included primarily in the PLS-DA but did not contribute to the cluster formation. To test the discriminatory ability of the three main risk factors identified, a PLS-DA model containing only HDL-C, TG:HDL-C and TC:HDL-C ratios (as independent variables) was fitted and cross-validated. The estimated sensitivity was 96.4% and the estimated specificity was 92.1%. The respective standard errors of these estimates were 4.9% and 4.8%. This confirms that the three risk factors identified contained almost all the discriminatory information, since similar results were obtained when using all 13 variables in the PLS-DA model.
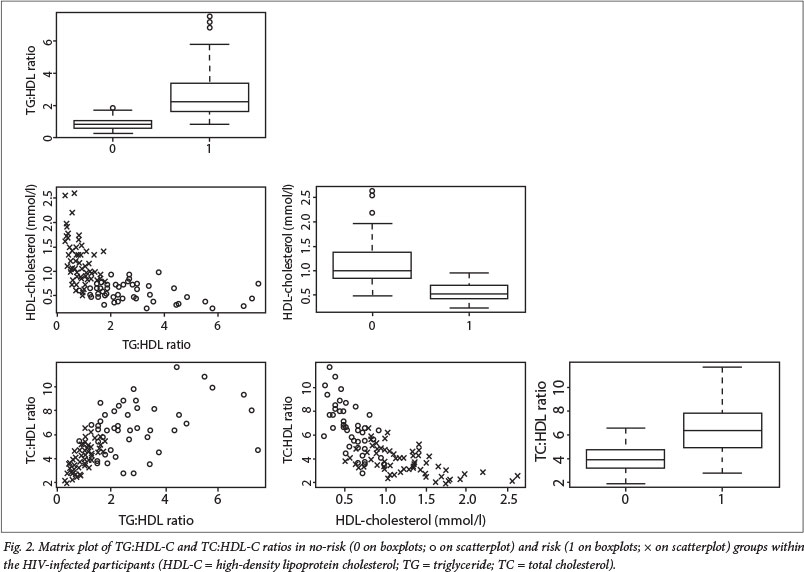
The distributional properties and the relationship among these three risk factors are illustrated as a matrix-plot (Fig. 2). Categorised boxplots of each risk factor are on the diagonal and scatterplots with appropriate labels are in the off-diagonal entries. Each box's height indicates the variability (difference between third and first quartile), while the median is the central line. The whiskers give the range of values except for the extremes displayed as individual points.
From ROC analysis, optimum cut-off values were determined for the participants.The cut-off values between risk and no-risk for CVD in participants were: HDL-C 0.76 mmol/l; TC:HDL-C ratio 5.40; and TG:HDL-C ratio 1.49.
Discussion
By making use of the PLS-DA statistical analysis method, we identified those CVD risk variables that contributed most (in a multivariate sense) to the existence of the grouping (clusters) observed in the total HIV-infected group that consisted of ARV-treated and never-treated participants. The most important variables identified by the PLS-DA were TG:HDL-C, HDL-C and TC:HDL-C with values of VIP >1. ROC analysis indicated that a TG:HDL-C ratio >1.49, TC:HDL-C ratio >5.4 and an HDL-C level <0.76 mmol/l constituted risk values with the potential to contribute to the development of CVD in HIV-infected black Africans.
The statistical PLS-DA method was employed to discriminate between HIV-infected participants with risk and no risk in the same group. Wold et al.[22] reported that PLS regression is useful for the analysis of noisy, incomplete data where multicollinearity is present. The PLS-DA method is also useful when a large number of variables are investigated simultaneously. In addition, the PLS/VIP method is used to assist in the identification of relevant predictors (Table 2), while Chong and Jun[20] found that this outperforms other variable selection methods.
HIV-related CVD is under-recognised and the clinical assessment thereof is a critical challenge for practitioners, especially in SA. Bearing in mind the enormous task facing the practitioners managing the ARV roll-out programme and the high number of people in SA living with HIV, the results of this study should simplify the identification of those individuals who exhibit a CVD risk. The discriminant model showed that the determination of HDL-C levels, and TG:HDL-C and TC:HDL-C ratios could be of clinical benefit for the identification of individuals at risk. It is well known that people living with HIV exhibit dyslipidaemia characterised by low HDL-C and high TG levels.[3] The latter was reported in newly identified HIV-infected South Africans,[14] although black Africans normally exhibit lower fasting TG and higher HDL-C levels than whites.[13] The HDL-C levels seen in the total HIV-infected group in this study (0.92 mmol/l) were below the level (1.28 mmol/l) generally regarded as an increased risk of developing CVD.[23]
The cut-off values of TG:HDL-C (1.49) and HDL-C levels (0.76 mmol/l) seen in our study indicated that risk is lower than that described in the literature.[24,25] However, modified CVD risk equations and models such as the Framingham Risk Score have not been validated for use in black Africans living with HIV. Thus, in light of the ethnic differences in TG and HDL-C levels,[13,26] and the findings of this study, different cut-off values may be needed to define the dyslipidaemia in HIV-infected black Africans that indicates risk of developing CVD. However, to evaluate individual risk the composite risk factor profile of traditional risk factors such as gender, lifestyle (smoking and alcohol abuse) and family history of CVD must be considered.
The strength of this study is that it contributes to CVD risk data in HIV-infected black South Africans, which are sparse. It would benefit practitioners, and be clinically advantageous to use metabolic variables such as TG:HDL-C and TC:HDL-C ratios as well as HDL-C levels, to discriminate between those individuals with risk, and those without risk, for the development of CVD.
Study limitations
Although there were no gender or treatment differences between the risk and no-risk groups, a limitation of the study is that this model did not discriminate between gender and those who were treated and those who did not receive treatment. It is difficult to differentiate between risk associated with HIV and that associated with ART.[4] As previously reported, not all HIV-infected individuals eligible for treatment have enrolled in the ART programme[27] and, in fact, in 2009, the treatment coverage in SA was <40%.[1] When the interaction between treatment and no treatment was determined statistically in the risk groups, interaction was seen only in the TC:HDL-C ratio. ART (including nevirapine and efavirenz) was associated with the normalisation of HDL-C levels and an increase in TC levels.[28]
Conclusion
Our study involved a cohort of people living with HIV in the North West Province, SA. Future research in larger prospective studies is warranted to assess the predictive power of lipid ratios and HDL-C levels for CVD development in people living with HIV in sub-Saharan Africa. Despite the limitations and the relatively small size of this study, we propose that by employing lipid ratios and HDL-C levels for screening, early identification of South Africans living with HIV and at risk for CVD may be achieved. A TG:HDL-C ratio >1.49, TC:HDL-C ratio >5.4 and an HDL-C level <0.76 mmol/l were indicative of CVD risk.
These results have important health implications for black Africans living with HIV, as these lipid levels may be useful indicators of CVD risk in clinical settings.
Acknowledgements. We thank Prof. A Kruger; the PURE-SA research team; the field workers and office staff at the Africa Unit for Transdisciplinary Health Research (AUTHeR), North-West University, SA; Dr S Yusuf (PURE-International) and the PURE project staff at the Population Health Research Institute (PHRI), Hamilton Health Sciences and McMaster University, Canada. This work was financially supported by the South Africa-Netherlands Research Programme on Alternatives in Development, South African National Research Foundation (NRF GUN no. 2069139 and FA2006040700010), North-West University, PHRI and the Medical Research Council of South Africa.
References
1. United Nations Programme on HIV/AIDS. UNAIDS Report on the Global AIDS Epidemic 2010. Geneva: UNAIDS, 2010. http://www.unaids.org/documents/20101123_globalreport_em.pdf (accessed 12 March 2012). [ Links ]
2. Giannarelli C, Klein RS, Badimon JJ. Cardiovascular implications of HIV-induced dyslipidemia Atherosclerosis 2011;219(2):384-389. [http://dx.doi.org/10.1016/j.atherosderosis.2011.06.003] [ Links ]
3. Forsyth B, Vandormael A, Kershaw T, Grobbelaar J. The political context of AIDS-related stigma and knowledge in a South African township community. SAHARA J 2008;5(2):74-82. [http://dx.doi.org/10.1080/17290376.2008.9724904] [ Links ]
4. Dubé MP, Lipshultz E, Fichtenbaum CJ, Greenberg R, Schecter AD, Ficher SD. Effects of HIV infection and antiretroviral therapy on the heart and vasculature. Circulation 2008;118:e36-e40. [http://dx.doi.org/10.1161/CIRCULATIONAHA.107.189625] [ Links ]
5. van Rooyen JM, Kruger HS, Huisman HW, et al. An epidemiological study of hypertension and its determinants in a population in transition: The THUSA study. J Hum Hypertens 2000;14(12):779-787. [http://dx.doi.org/10.1038/sj.jhh.1001098] [ Links ]
6. Sliwa K, Wilkinson D, Hansen C, et al. Spectrum of heart disease and risk factors in a black urban population in South Africa (the Heart ofSoweto Study): A cohort study. Lancet 2008;371(9616):915-922. [http://dx.doiorg/10.1016/S0140-6736(08)60417-1] [ Links ]
7. Riddler SA, Smit E, Cole SR, et al. Impact of HIV infection and HAART on serum lipids in men. JAMA 2003;289(22):2978-2982. [http://dx.doi.org/10.1001/jama.289.22.2978] [ Links ]
8. Carr A, Cooper DA. Lipodystrophy associated with an HIV-protease inhibitor. N Engl J Med 1998;339(18):1296. [http://dx.doi.org/10.1056/NEJM199810293391806] [ Links ]
9. Grinspoon SK. Metabolic syndrome and cardiovascular disease in patients with human immunodeficiency virus. Am J Med 2005;118(Suppl 2):23S-28S. [http://dx.doiorg/10.1016/j.amjmed.2005.01.047] [ Links ]
10. Constans J, Conri C. Circulating markers of endothelial function in cardiovascular disease. Clin Chim Acta 2006;368(1-2):33-47. [http://dx.doi.org/10.1016/j.cca.2005.12.030] [ Links ]
11. Hsue PY, Lo JC, Franklin A, et al. Progression of atherosclerosis as assessed by carotid intima-media thickness in patients with HIV infection. Circulation 2004;109(13):1603-1608. [http://dx.doi.org/10.1161/01.CIR.0000124480.32233.8A] [ Links ]
12. Glazier JJ, Spears JR, Murphy MC. Interventional approach to recurrent myocardial infarction in HIV-1 infection. J Interv Cardiol 2006;19(1):93-98. [http://dx.doi.org/10.1111/j.1540-8183.2006.00111.x; [ Links ]
13. Seedat YK. Hypertension in black South Africans. J Hum Hypertens 1999;13:96-103. [http://dx.doi.org/10.1038/sj.jhh.1000773] [ Links ]
14. Fourie CMT, van Rooyen JM, Kruger A, Schutte AE. Lipid abnormalities in a never-treated HIV-1 subtype C-infected African population. Lipids 2010;45(1):73-80. [http://dx.doiorg/10.1007/s11745-009-3369-4] [ Links ]
15. Teo K, Chow CK, Vaz M, Rangarajan S, Yusuf S. The Prospective Urban Rural Epidemiology (PURE) study: Examining the impact of societal influences on chronic non-communicable diseases in low-, middle-, and high-income countries. Am Heart J 2009;158(1):1-7. [http://dx.doi.org/10.1016/j.ahj.2009.04.019] [ Links ]
16. Johnson RA, Wichern DW. Applied Multivariate Statistical Analysis. 4th ed. New Jersey: Prentice Hall, 1998. [ Links ]
17. Seedat YK, Rayner BL. South African Hypertension Guideline 2011. S Aft Med J 2012;102(1):57-88. [ Links ]
18. International Society for the Advancement of Kinanthropometry. International Standards for Anthropometric Assessment. Adelaide: ISAK, 2001:19-59. [ Links ]
19. Johnson R, McNutt P, MacMahon S, Robson R Use of the Friedewald formula to estimate LDL-cholesterol in patients with chronic renal failure on dialysis. Clin Chem 1997;43(11):2183-2184. [ Links ]
20. Chong I-G, Jun C-H. Performance of some variable selection methods when multicollinearity is present. Chemometr Intell Lab Syst 2005;78(1-2):103-112. [http://dx.doi.org/10.1016/j.chemolab.2004.12.011] [ Links ]
21. Fluss R, Faraggu D, Reiser F. Estimation of the Youden index and its associated cutoff point. Biom J 2005;47(4):458-472. [http://dx.doi.org/10.1002/bimj.200410135] [ Links ]
22. Wold S, Sjóstróm M, Eriksson L. PLS-regression: A basic tool of chemometrics. Chemometr Intell Lab Syst 2001;58:109-130. [http://dx.doiorg/10.1016/S0169-7439(01)00155-1] [ Links ]
23. Miller NE, Thelle DS, Forde OH, Mjos OD. The Troms0 heart-study. High-density lipoprotein and coronary heart-disease: A prospective case-control study. Lancet 1977;309(8019):965-968. [http://dx.doi.org/10.1016/S0140-6736(77)92274-7] [ Links ]
24. Expert panel on detection, evaluation, and treatment of high blood cholesterol in adults. Executive summary of the Third Report of the National Cholesterol Education Program (NCEP) Expert panel on detection, evaluation, and treatment of high blood cholesterol in adults (Adult Treatment Panel III). JAMA 2001;285(19):2486-2497. [http://dx.doi.org/10.1001/jama.285.19.2486] [ Links ]
25. International Diabetes Federation. The IDF Consensus Worldwide Definition of the Metabolic Syndrome. http://www.idf.org/webdata/docs/Metabolic_syndrome_definition.pdf (accessed 12 March 2012). [ Links ]
26. Zoratti R A review on ethnic differences in plasma triglyceride and high-density-lipoprotein cholesterol: Is the lipid pattern the key factor for the low coronary heart disease rate in people of African origin? Eur J Epidemiol 1998;14(1):9-21. [http://dx.doiorg/10.1023/A:1007492202045] [ Links ]
27. Fourie CMT, van Rooyen JM, Kruger A, et al. Soluble urokinase plasminogen activator receptor (suPAR) is associated with metabolic changes in HIV-1-infected Africans: A prospective study. Inflammation 2012;35(1):221-229. [http://dx.doi.org/10.1007/s10753-011-9308-6] [ Links ]
28. van Leth F, Phanuphak P, Stroes E, et al. Nevirapine and efavirenz elicit different changes in lipid profiles in antiretroviral-therapy-naive patients infected with HIV-1. PLoS Med 2004;1(1):e19. [http://dx.doi.org/10.1371/journal.pmed.0010019] [ Links ]
 Corresponding author:
JM van Rooyen
(johannes.vanrooyen@nwu.ac.za)
Accepted 8 January 2014.

