


Servicios Personalizados
Articulo
 Inglés (pdf)
 Articulo en XML
 Referencias del artículo
Indicadores

Links relacionados
-
 Citado por Google
 -
 Similares en Google
Compartir

 Permalink
SAMJ: South African Medical Journal
versión On-line ISSN 2078-5135
versión impresa ISSN 0256-9574
SAMJ, S. Afr. med. j. vol.103 no.7 Pretoria jul. 2013
FORUM
ANALYSIS
Increasing pathology utilisation lies behind increasing pathology costs
M Lawrie; A Good
Meriel Lawrie is a statistician and economist with an interest in medical industry financing and sustainability, and is a data analyst at Prognosys, South Africa. Andrew Good is one of South Africa's leading managed care experts, passionate about disease risk management and optimising healthcare strategy, and is Director of Prognosys, SA and Lifechoice, South Africa
ABSTRACT
Recent increases in pathology costs per scheme member are a concern to medical schemes and pathologists alike. To better understand the observed increasing costs, the National Pathology Group commissioned Prognosys to analyse the trends affecting these increases. We found that these increases are driven by inflation, increases in utilisation, and redistribution of the burden of cost. The identification of utilisation as a cost driver for pathology services is noteworthy as almost all pathology services are by referral from another doctor.
Above-inflation increases in pathology costs per scheme member are a concern to medical schemes. To better understand the observed increasing costs, the National Pathology Group (NPG) commissioned Prognosys (an independent actuarial company) to analyse the trends affecting the increases. Prognosys used only publicly available information for this research. These data were compiled from the Council for Medical Schemes' latest annual reports and annual statutory returns as well as supplementary data from Statistics South Africa (SA). This article has been prepared using this research, which was completed in May 2013.
While pathology costs are a small proportion of the total expenditure on private healthcare, expenditure on pathology has increased in the 5-year period from 2006 to 2011.
Pathology costs per beneficiary increased by 72% in nominal terms (i.e. before adjusting for inflation) from 2006 to 2011. In real terms (i.e. after adjustment for inflation) pathology expenditure has experienced an increase of 23% in this period. This is equivalent to an average annual increase of 4.21% above inflation. In contrast, overall average benefits paid per beneficiary have increased by 53% in nominal terms and 8.94% in real terms. This equates to an average annual increase of 1.84% above inflation.
The most important findings were:
• That the increase in pathology costs is driven by an utilisation increase of 18%
• When correcting for increase in utilisation, pathology costs per utilisation (CPU) have increased by only 3.78% in real terms. This is below the increase in overall benefits of 8.94% in real terms.
The identification of utilisation as a cost driver for pathology services is noteworthy as almost all pathology services are by referral from another doctor.
As a result of the decrease in the burden of pathology costs borne by members, the real increase in charges of 13% by pathologists translated to a real increase of 23% for medical schemes. The most likely explanation for this movement of the cost burden is the payment of costs related to Prescribed Minimum Benefits (PMB) conditions, which now have to be paid in full by schemes.
Further work needs to be done to understand factors contributing to the increased utilisation. Factors that could be playing a role are:
• Disease management initiatives
• Improved disease screening
• Defensive medicine against the backdrop of increased medical malpractice litigation.
However, the largest health quality survey in the SA private sector reports that members with HIV on antiretroviral medication on average only have a CD4 or viral load test every second year and that members with diabetes mellitus only have an HbA1C test every second year. This suggests that there has not been an improvement in disease risk management initiatives across the industry.
Trends in scheme benefit expenditure
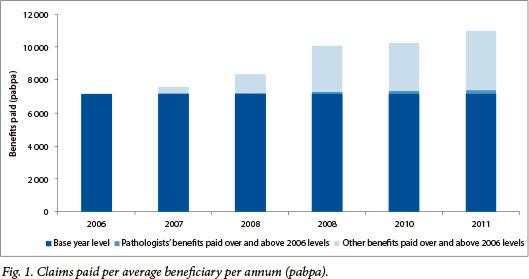
Medical schemes and their members have seen benefit expenditure rise steadily at a rate above inflation. Fig. 1 presents the claim costs per average beneficiary per annum for each year from 2006 to 2011. The graph highlights the direct impact of pathology cost increases over the period. Fig. 1 reveals a trend of increasing benefit costs for medical schemes. This increase is equivalent to an average increase of 8.94% (1.84% above inflation) per annum from 2006 to 2011. Pathology costs have also increased in this period with their share of total claim costs increasing, from 4.2% in 2006 to 4.7% in 2011.
Pathology utilisation
Pathology utilisation has increased cumulatively by 18% since 2006. This increase must be seen in light of the large increases in pathology utilisation against a background of relative stability in pathology CPU since 2006.
From Fig. 2 it is clear that real pathology CPU have fluctuated at around 4% above 2006 levels for the last four years, while hospital CPU and medical specialists' CPU have been increasing.
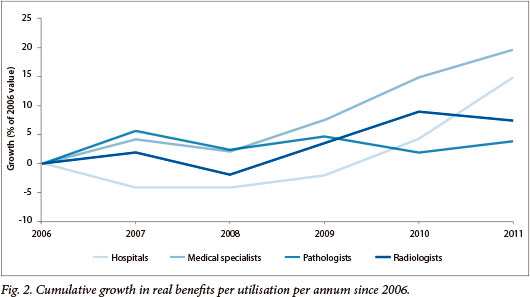
It must be stressed that this measure does not take into account possible changes in the age of members, the burden of disease, the length of stay in hospitals, or the complexity of cases. Furthermore, the utilisation measure does not reflect the number of pathology tests run, but the number of pathology claims. These factors could affect the comparability of the CPU at different points in time.
This increase in pathology costs, whether borne by members or schemes, needs to be better understood to avoid the implementation of counter-productive interventions. Ideally, this cost should be assessed relative to consequent changes in health outcomes. Given the limitations of available public data, this report focused on details regarding benefit expenditure trends, utilisation, and CPU for pathology (and other categories of expenditure).
More research must be done to understand the factors driving the observed increased in utilisation. This research should include an analysis of which pathology tests are being performed more often, as well as the reasons for these tests being requested.
Sources
All data used for the purposes of this report have been extracted from Prognosys databases, which have been compiled from the sources listed below:
1. Council for Medical Schemes. Annual Report 2005-2006. Pretoria: Council for Medical Schemes, 2006. http://www.medicalschemes.com/Publications.aspx (accessed 20 May 2013). [ Links ]
2. Council for Medical Schemes. Annual Report 2006-2007. Pretoria: Council for Medical Schemes, 2007. http://www.medicalschemes.com/Publications.aspx (accessed 20 May 2013). [ Links ]
3. Council for Medical Schemes. Annual Report 2007-2008. Pretoria: Council for Medical Schemes, 2008. http://www.medicalschemes.com/Publications.aspx (accessed 20 May 2013). [ Links ]
4. Council for Medical Schemes. Annual Report 2008-2009. Pretoria: Council for Medical Schemes, 2009. http://www.medicalschemes.com/Publications.aspx (accessed 20 May 2013). [ Links ]
5. Council for Medical Schemes. Annual Report 2009-2010. Pretoria: Council for Medical Schemes, 2010. http://www.medicalschemes.com/Publications.aspx (accessed 20 May 2013). [ Links ]
6. Council for Medical Schemes. Annual Report 2010-2011. Pretoria: Council for Medical Schemes, 2011. http://www.medicalschemes.com/Publications.aspx (accessed 20 May 2013). [ Links ]
7. Council for Medical Schemes. Annual Statutory Returns for each scheme 2006-2011. Pretoria: Council for Medical Schemes, 20062011. Available on request from the Council for Medical Schemes. [ Links ]
8. Statistics South Africa. P0141 - Consumer Price Index (CPI), monthly releases. Pretoria: Statistics South Africa, 2007-2011. http://www.stats-sa.gov.za/publications/statspastfuture.asp?PPN=P0141&SCH=4575 (accessed 20 May 2013). [ Links ]
9. Statistics South Africa. CPI history 1960 onwards. http://www.statssa.gov.za/keyindicators/CPI/CPIHistory_rebased.pdf (accessed 20 May 2013). [ Links ]
Accepted 4 June 2013
 Correspondence: M Lawrie (mlawrie@prognosys.co.za)

