


Servicios Personalizados
Articulo
 Inglés (pdf)
 Articulo en XML
 Referencias del artículo
Indicadores

Links relacionados
-
 Citado por Google
 -
 Similares en Google
Compartir

 Permalink
SAMJ: South African Medical Journal
versión On-line ISSN 2078-5135
versión impresa ISSN 0256-9574
SAMJ, S. Afr. med. j. vol.103 no.5 Pretoria may. 2013
RESEARCH
Provincial screening rates for chronic diseases of lifestyle, cancers and HIV in a health-insured population
L AdonisI; R AnII ; J LuizIII; A MehrotraV; D PatelIV; D BasuVI; R SturmVII
IMB BCh, MBA, MMed, FCPHM (SA); School of Public Health, Faculty of Health Sciences, University of the Witwatersrand, Johannesburg, South Africa
IIMPhil, MPP; RAND Corporation, Santa Monica, California, USA
IIIBCom Hons, MCom, PhD;Graduate School of Business, University of Cape Town, South Africa
IVMB BCh, MMed, MPhil; Discovery Vitality, Sandton, South Africa
VMD, MPH;School of Public Health, Faculty of Health Sciences, University of the Witwatersrand, Johannesburg, South Africa
VIFCPHM (SA), MMed, PhD (Med); School of Public Health, Faculty of Health Sciences, University of the Witwatersrand, Johannesburg, South Africa
VIIMS Ecos, MA Stats, PhD Ecos RAND Corporation, Santa Monica, California, USA
ABSTRACT
BACKGROUND: Screening for asymptomatic diseases can reduce the burden of morbidity and mortality in all population groups. There is widespread geographical variation in the quality of care. Few data are available on national screening rates in South Africa and how these vary across the provinces.
OBJECTIVE: To examine screening rates for chronic diseases of lifestyle (CDL), HIV and cancer in a privately insured population for a single insurer across all nine provinces in South Africa, and to determine whether or not there are any differences between the provinces.
METHOD: Screening rates were calculated as the proportion of eligible members who had received screening tests during 2011 in each province. Mean screening rates were compared between Gauteng and the other eight provinces.
RESULTS: Nationwide screening rates were 20.5% for CDL, 8.2% for HIV and 31.9% for cancer. Despite similar insurance coverage, screening rates ranged from 0.3% to 0.95% lower in other provinces compared with Gauteng. Of all the provinces, Gauteng had the highest annual screening rates for CDL, breast cancer, prostate cancer and HIV (p<0.001), while the Western Cape had the highest rate for cervical cancer (p<0.001).
CONCLUSION: There is much variation in preventive care utilisation across the provinces within this health-insured population. Provinces with more abundant healthcare resources have higher screening rates. Further research is required to understand the reasons for the variation, given equal payment access.
Geographical variations in healthcare utilisation can perpetuate health disparities.[1] Use of preventive services is particularly likely to be low when access to health services is a barrier.[2-5] In addition, there is a strong association between a population's residential location or region and use of preventive screening services.[6-8] As a result, there are wide variations in healthcare utilisation and health outcomes across the provinces of South Africa (SA).[9] Gauteng and the Western Cape are economically more prosperous and urbanised, are better resourced, and have superior health and development indicators compared with poorer provinces such as Limpopo and the Northern Cape.[10] Access to medical insurance is positively associated with the use of preventive care services. [11,12] Approximately 14% of SA's population currently has access to medical insurance.[13] Little is known about provincial disparities in healthcare utilisation in the privately insured sector, or what factors drive these disparities.
Discovery Health, the largest medical aid in SA, with an approximately 40% market share, offers a fully paid screening programme for its members. This study aimed to investigate the variation in use of preventive screening services of the Discovery Health membership across the nine provinces of SA. Given that all members have equal access to preventive services, other factors may be at play if disparities do exist. Understanding the provincial disparities may steer more targeted messaging or further research into defining reasons, such as health and human resources availability and capacity, for varying preventive care use.
Materials and methods
Setting
The study population consisted of all members of Discovery Health medical aid as at the end of 2011. The Discovery Health screening programme offers a paid screening benefit to its members for mammograms, Pap smears, HIV tests, glaucoma screening, prostate-specific antigen (PSA) for prostate cancer screening, random glucose and cholesterol tests, 'flu vaccines and pneumococcal vaccines, irrespective of the type of medical plan members belong to. Other preventive screening tests are not fully paid for and have some form of co-payments; these include colorectal cancer and osteoporosis screening. The Human Research Ethics Committee of the University of the Witwatersrand granted ethical clearance for the study (certificate No. M120854).
Methods
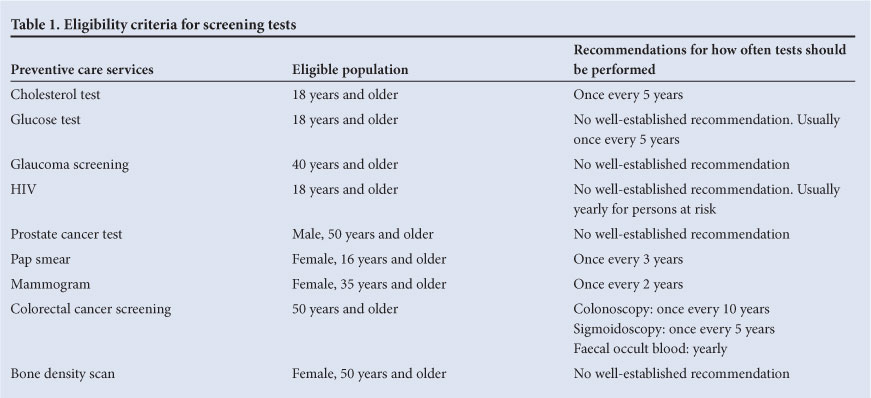
Eligibility criteria for the tests evaluated were adapted from the US Preventive Services Task Force Recommendations and are outlined in Table 1. Some preventive tests have clear recommendations for screening frequency, while others do not. For this study, screening for a disease was characterised as having had at least one of the screening tests outlined in Table 1 for the calendar year of 2011 (annual average). It is therefore not an evaluation of whether members' screening behaviour adheres to screening recommendations. The study also did not evaluate differences between covered and non-covered tests, but simply the provincial variation in annual screening rates. Each member was assigned to one of the nine provinces according to a valid address in that province for the duration of 2011.
Statistical analyses
The study was a cross-sectional descriptive analysis of the annual screening rate of all eligible medical aid members in 2011 across all nine provinces. The mean screening rate for each test was compared between provinces using Student's t-test for unpaired samples, with Gauteng as the baseline. Variation between provinces was described using ratios of differences. All analyses were conducted using STATA 12.0 (StataCorp, USA).
Results
Screening rates for a total of 1 889 447 members were evaluated for the year 2011. Descriptive statistics of the study sample by province are reported in Table 2. The provincial screening rates are shown in Table 3.

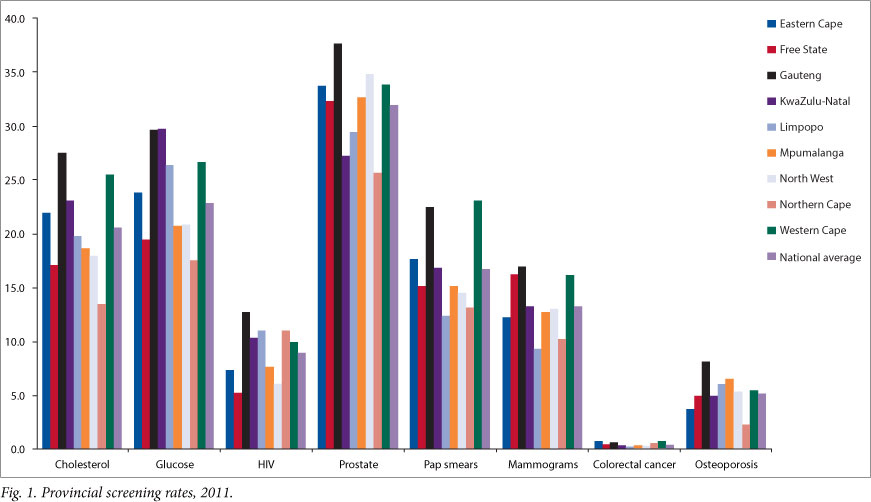
Gauteng had the highest annual screening rate for cholesterol at 27.5% of eligible insured members, and the Northern Cape the lowest at 13.4%. Gauteng's screening rate for cholesterol was also significantly higher than those of the other provinces, figures for which were between 0.93 (Western Cape) and 0.49 (Northern Cape) times lower than Gauteng (p<0.001). The variations in screening rates are shown in Table 4. The highest annual screening rate for glucose was 29.7% (Mpumalanga), although this was not significantly different from Gauteng's 29.6% (p=0.97). The lowest screening rate for glucose was in the Northern Cape (17.5%), with a variation of 0.59 times lower than Gauteng. KwaZulu-Natal had a 0.84 times lower screening for cholesterol than Gauteng.
Prostate cancer screening had the highest uptake of all preventive screening tests. Around 37.7% of males over 50 years old had had a PSA test in Gauteng, versus a low of 25.6% of males in the Northern Cape. Gauteng had the highest screening rate for prostate cancer of all the provinces (p<0.001), and screening rates for prostate cancer ranged from 0.90 to 0.68 times lower in other provinces compared with Gauteng.
The Western Cape had the highest cervical cancer screening rate (p<0.001), with 23.1% of all eligible females having had a Pap smear versus only 13.1% of females in the Northern Cape. The screening rate for cervical cancer in the Western Cape was 1.03 times higher than that in Gauteng, while the rate was 0.55 times lower in Limpopo than in Gauteng.
The highest screening rate for breast cancer was in Gauteng (p<0.001), with 17.0% of eligible females having had a mammogram, while the lowest rate of 9.4% was in the Northern Cape. Rates for mammograms ranged from 0.95 to 0.60 times lower in the other provinces compared with Gauteng.
HIV screening had the largest variation of all the screening tests. Gauteng had the highest rate (p<0.001), with 12.8% of members having had the test, and the lowest rate was in the Northern Cape, where only 4.8% of members had been tested in 2011. Northern Cape had a 0.38 times lower screening rate than Gauteng.
Colorectal cancer screening, currently not part of the paid screening benefit, had the lowest rate. The Eastern Cape (0.7%) had the highest rate (p<0.001), while the lowest rate (0.2%) was in Limpopo. The Eastern Cape's screening rate was 1.17 times higher than Gauteng's and 3.5 times higher than Limpopo's.
Osteoporosis screening, which is also not part of the paid screening benefit, had the highest rate in Gauteng (p<0.001), with 7.9% of members undergoing screening, and the lowest rate in the Northern Cape (2.2%). Rates of screening for osteoporosis were between 0.82 and 0.28 times lower in the other eight provinces than in Gauteng.
Screening rates for all the provinces are presented in Fig. 1, with Gauteng shown in black.
Discussion
Use of screening services in this SA medical aid population is low and far below international benchmark targets of 93.0% for cervical cancer, 70.5% for colorectal cancer, 81.1% for breast cancer and 82.1% for cholesterol screening.[14] Surveys of screening rates in comparable populations showed that 68% of adults in the USA reported having had a cholesterol test in the preceding 5 years, and more than 75% of females aged 40 years and older had had a mammogram in the preceding 2 years;[15] in European countries (Germany, the Netherlands, England and Italy), between 61% and 79% of females over 50 years were screened for breast cancer biennially.[15,16] Screening rates among medically insured individuals tend to be slightly higher than in the uninsured, with rates of up to 77.6% for mammograms, 91.5% for Pap smears, 85.5% for cholesterol tests and 50.9% for colorectal cancer.[17]
There is considerable variation in utilisation of screening services between provinces in the SA insured population. Screening rates for chronic diseases of lifestyle varied from 30% to 50% lower in the Northern Cape and Limpopo compared with Gauteng and the Western Cape. Cancer screening ranged from 45% to 5% lower in some provinces compared with Gauteng. Rates of HIV screening in the Free State, North West and the Northern Cape were less than half that in Gauteng. This is consistent with findings of others that urbanised areas achieved better uptake of screening services.[18]
The variation in utilisation of screening services seen in this medically insured population may not be unusual. Even among medical aid members, where the costs of screening tests are paid for, and in settings where screening facilities are easily accessible, researchers have found poor uptake of services.[19,20] This confirms the previous conclusion that access alone is not the only driver of healthcare utilisation disparities.[1] Access to facilities may be better in the more urbanised provinces and may play a role in the unequal use of preventive services, together with several other individual and provider factors.[6,21] Further research is required to fully understand the reasons for inequitable use of preventive services across the nine provinces in this health insured population.
This study is limited by the fact that it focused only on annual uptake of screening services and not on adherence to screening guidelines, disease detection rates or treatment/management outcomes. Further research is necessary to analyse available data over longer time frames in order to establish the proportion of people who have availed themselves of recommended screening, as well as their health outcomes. Another limitation is that inferences in respect of screening rates can be drawn only on other groups within SA with similar health insurance coverage and not on the uninsured population. It is expected that the general uninsured population screening rate would be much lower than those of the health-insured population. Future research agendas should include comprehensive evaluation of all preventive screening services utilisation (CDL, cancers and HIV) in the uninsured population, with a view to establishing eligibility criteria and creating targets for utilisation of services at various national, provincial and district levels and strengthening national databases, given the imminent introduction of National Health Insurance. This study provides some indication of screening patterns at a national level and the variation that persists in this privately insured population. The strength of this study is that it analysed the entire health-insured population's screening activity over a 1-year period at both national and provincial level and therefore accurately represents their annual screening practices compared with survey data estimations.
Conclusion
This is the first look at national screening practices in a South African population. In this health-insured population, screening varies greatly between provinces for CDL, cancers and HIV. Screening rates in the larger uninsured South African population may be even lower.
We found that the better-resourced provinces had higher screening rates. The variations between the provinces deserve further exploration in order to evaluate the effect of resource allocation, access to care, provider factors and socio-demographic characteristics that may impact on screening rates.
References
1. Long JA, Chang VW, Ibrahim SA, Asch DA. Update on the health disparities literature. Ann Intern Med 2004;141(10):805-812. [ Links ]
2. Seo HS, Lee NK. Predictors of PSA screening among men over 40 years of age who had ever heard about PSA. Korean Journal of Urology 2010;51(6):391-397. [http://dx.doi.org/10.4111/kju2010.5L6.391; [ Links ]
3. Holden DJ, Jonas DE, Porterfield DS, Reuland D, Harris R. Systematic review: Enhancing the use and quality of colorectal cancer screening. Ann Intern Med 2010;152(10):668-676. [ Links ]
4. Zapka JG, Lemon SC. Interventions for patients, providers, and health care organizations. Cancer 2004;101(5 Suppl):1165-1187. [http://dx.doi.org/10.1002/cncr.20504] [ Links ]
5. Meersman SC, Breen N, Pickle LW, Meissner HI, Simon P. Access to mammography screening in a large urban population: A multi-level analysis. Cancer Causes Control 2009;20(8):1469-1482. [http:// dx.doi.org/10.1007/s10552-009-9373-41 [ Links ]
6. Richardson H, Aronson KJ, James A, McGregor SE, Bryant H. Factors related to use of prostate cancer screening: The Alberta Tomorrow Project. Open Med 2007;1(1):e3-e12. [ Links ]
7. Dailey AD, Kasl SV, Holford TR, et al. Neighborhood-level socioeconomic predictors of non-adherence to mammography screening guidelines. Cancer Epidemiol Biomarkers Prev 2007;16(11):2293-2303. [http://dx.doi.org/10.1158/1055-9965.EPI-06-1076] [ Links ]
8. Elit L, Krzyzanowska M, Saskin R, et al. Sociodemographic factors associated with cervical cancer screening and follow-up of abnormal results. Can Fam Physician 2012;58(1):e22-31. [ Links ]
9. Bradshaw D, Laubscher NNR, Groenewald P, et al. South African National Burden of Diseases Study 2000. Estimates of Provincial Mortality. Summary Report. Cape Town: Medical Research Council, 2006. [ Links ]
10. Coovadia H, Jewkes R, Barron P, Sanders D, McIntyre D. The health and health system of South Africa: Historical roots of current public health challenges. Lancet 2009;374(9692):817-834. [http://dx.doi.org/10.1016/S0140-6736(09)60951-X] [ Links ]
11. Nelson W, Moser RP, Gaffey A, Waldron W. Adherence to cervical cancer screening guidelines for US women aged 25-64: Data from the 2005 Health Information National Trends Survey (HINTS). J Womens Health 2009;18(11):1759-1768. [http://dx.doi.org/10.1089/jwh.2009.1430] [ Links ]
12. Zhao D, Zhang Z, Rao K. Health insurance and household income associated with mammography utilization among American women, 2000-2008. Chin Med J 2011;124(20):3320-3326. [http://dx.doi. org/10.3760/cma.j.issn.0366-6999.2011.20.021] [ Links ]
13. McIntyre D, Thiede M. Health care financing and expenditure. In: Ijumba P, Padarath A, eds. South African Health Review. Durban: Health Systems Trust, 2007. [ Links ]
14. Healthy People 2020. Summary of objectives. http://www.healthypeople.gov/2020/topicsobjectives2020/pdfs/Cancer.pdf (accessed 3 March 2013).
15. Centers for Disease Control and Prevention. Use of selected clinical preventive services among adults -United States, 2007-2010. MMWR Morb Mortal Wkly Rep 2012;61(Suppl; June 15, 2012):1-79. [ Links ]
16. Biesheuvel C, Weigela S, Heindela W. Mammography screening: Evidence, history and current practice in Germany and other European countries. Breast Care 2011;6(2):104-109. [http://dx.doi.org/10.1159/000327493] [ Links ]
17. Hughes MC, Hannon PA, Harris JR, Patrick DL. Health behaviors of employed and insured adults in the United States, 2004-2005. Am J Health Promot 2010;24(5): 315-323. [http://dx.doi.org/10.4278/ajhp.080603-QUAN-77] [ Links ]
18. Schumacher MC, Slattery ML, Lanier AP, et al. Prevalence and predictors of cancer screening among American Indian and Alaska native people: The EARTH study. Cancer Causes Control 2008;19(7):725-737. [http://dx.doi.org/10.1007/s10552-008-9135-8] [ Links ]
19. Mobley LR, Kuo TM, Clayton LJ, Evans WD. Mammography facilities are accessible, so why is utilization so low? Cancer Causes Control 2009;20(6):1017-1028. [http://dx.doi.org/10.1007/s10552-009-9295-1] [ Links ]
20. DuBard CA, Schmid D, Yow A, Rogers AB, Lawrence WW. Recommendation for and receipt of cancer screenings among Medicaid recipients 50 years and older. Arch Intern Med 2008;168(18):2014-2021. [http://dx.doi.org/10.1001/archinte.168.18.2014] [ Links ]
21. Damiani G, Federico B, Basso D, et al. Socioeconomic disparities in the uptake of breast and cervical cancer screening in Italy: A cross-sectional study. BMC Public Health 2012;12(99):1-10. [http://dx.doi.org/10.1186%2F1471-2458-12-99] [ Links ]
Accepted 18 March 2013.
 Correspondence: L Adonis (leegale@me.com, leegale@mweb.co.za)

