


Services on Demand
Article
 English (pdf)
 Article in xml format
 Article references
Indicators

Related links
-
 Cited by Google
 -
 Similars in Google
Share

 Permalink
SAMJ: South African Medical Journal
On-line version ISSN 2078-5135
Print version ISSN 0256-9574
SAMJ, S. Afr. med. j. vol.102 n.10 Pretoria Oct. 2012
RESEARCH
Challenges with using estimates when calculating ART need among adults in South Africa
Annette A M GerritsenI; Janine S MitchellII; Suzanne M JohnsonIII; Wim DelvaIV
IPhD; Epi Result, Louis Trichardt
IIBPE; Foundation for Professional Development, Tshwane
IIIBSLA, MPH; Foundation for Professional Development, Tshwane
IVMD, PhD; Department of Science and Technology/National Research Foundation (DST/ NRF) Centre for Excellence in Epidemiological Modelling and Analysis (SACEMA), Stellenbosch University, South Africa, and International Centre for Reproductive Health, Ghent University, Belgium
ABSTRACT
BACKGROUND: The Foundation for Professional Development (FPD) collects information annually on HIV/AIDS service provision and estimates service needs in the City of Tshwane MetropolitanMunicipality (CTMM).
METHODS: Antiretroviral therapy (ART) data from the Department of Health and Statistics South Africa (SSA) mid-year population estimates were used to approximate the ART need among adults in the CTMM.
RESULTS: According to SSA data, ART need decreased dramatically from 2010 to 2011 and was lower than the number of adults receiving ART. Although the noted difference was probably due to changes in the calculations by SSA, no detailed or confirmed explanation could be offered.
CONCLUSIONS: We provide a constructive contribution to the discussion regarding the use of model-derived estimates of ART need.
Information regarding HIV/AIDS service provision and need in South Africa (SA) is limited, especially in municipal areas. Since 2007, the Foundation for Professional Development (FPD) has conducted an annual survey among organisations providing HIV/AIDS-related services in the City of Tshwane Metropolitan Municipality (CTMM) to collect information on service provision and estimate service needs. The project aims to identify service provision gaps, prioritise municipal activities and promote evidence-based target-setting. The 2010 FPD survey findings were published1 and the 2011 report was released.
Methods
ART data from the Department of Health (DoH) and Statistics South Africa (SSA) mid-year population estimates were used to approximate antiretroviral therapy (ART) need among adults in the CTMM, as previously published.1 A distinction was made between the number of adults requiring ART initiation and the total ART need (total number of adults receiving ART plus those in need of ART initiation) in a set year. Total ART need in the CTMM was calculated based on the total ART need among adults aged >15 years in SA. The latter, reported in the Statistics South Africa (SSA) mid-year population estimates, was calculated using Spectrum Software.2 To calculate the need for ART initiation among adults in the CTMM, the number already receiving ART was required. This was extrapolated from SSA mid-year population estimates of the number of adults aged >15 years receiving ART in SA2 (data obtained from the DoH).1
Results and discussion
Estimating ART need using the aforementioned approach has limitations. Firstly, only ART provision by the public sector is taken into account. We therefore included data regarding the number of individuals receiving ART via non-governmental organisations (NGOs), the private sector, workplace treatment programmes and disease management providers, according to the United Nations General Assembly Special Session (UNGASS) country progress report on the declaration of commitment on HIV/AIDS 2010.3 Secondly, this approach assumes that the proportion of adults receiving ART in the CTMM is similar to that of the rest of the country; this is probably an underestimate, considering routine monitoring data from the FPD.1 Thirdly, the DoH data may not account for under- or over-reporting, including non-adherence, loss to follow-up, transfer and death. Lastly, limitations of the Spectrum methodology include assumptions derived from few studies, which may not be representative of all populations and regions.4
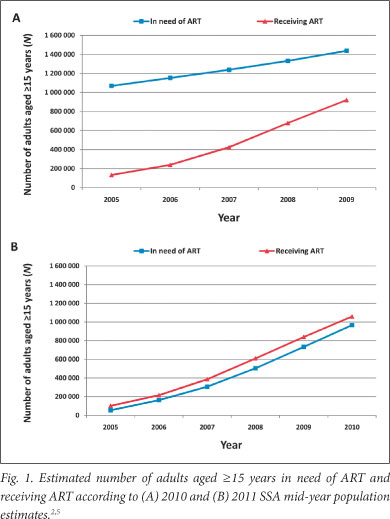
Despite these limitations, the approach seemed reasonable and simple for approximating ART need (total and initiation) among adults in the CTMM. However, when compiling the 2011 FPD report, we observed the following in the 2010 and 2011 SSA midyear population estimates: the estimated number of adults receiving ART was similar between 2010 and 2011,2,5 but estimated ART need decreased drastically in 2011, to lower than the number of adults receiving ART (Fig. 1).
Although limited data are available on ART coverage, the 2011 SSA data do not appear to reflect the reality. In a previous study, estimated ART coverage among adults in 2008 was 54.2% with unmet need defined as untreated AIDS, 40.2% with DoH criteria (CD4 count <200) and 22.2% according to the Southern African HIV Clinicians Society guidelines (CD4 count <350).6 The World Health Statistics 2011 report described a 37% coverage (range 35 - 39%) among people with advanced HIV infection in 2009, and the 2011 UNGASS report reported a 55% coverage (range 52 - 58%) in 2010.7,8 In turn, however, these reports are probably based on figures from the DoH, SSA/ Spectrum Software estimates and UNGASS report.3
Thus, these data cannot be used to calculate the ART need in the CTMM and the trend in ART coverage cannot be monitored over the years of the CTMM study. The latter, particularly in light of the advent of nurse initiation and maintenance of ART (NIMART) and the rapid transition of ART to primary healthcare, is critical in determining the success of programmes and inferring effect. This must be clarified, especially in light of the possibility that others may solely rely on the latest SSA report figures.
ART need change: possible explanations
The drastic change in ART need suggests a fundamental change in inclusion criteria and/or calculation methodology. This was probably supported by the subtle label change from 'number of persons in need for ART, 2005 - 2010'5 to 'number of persons in need of ART, 2005 - 2011'.2 The latter could imply that it only reflects persons requiring ART initiation. However, SSA indicated that there was no change in definition (SSA, personal communication) and when looking at the data for children provided in the SSA mid-year population estimates this indeed does not seem to be the case (the number of children in need showed a large increase as expected).
The UNAIDS Reference Group on Estimates, Models and Projections regularly reviews new data, hence, the methodology and assumptions used in the Spectrum programme are updated continuously. According to the WHO/UNICEF/UNAIDS 2011 Global HIV/AIDS response report,8 the 2011 Spectrum model accounts for HIV-positive adults according to CD4 count (to capture threshold changes).8 Furthermore, defining ART need depends on national criteria of ART eligibility.9 In 2010 SA partly adopted the revised WHO guidelines (threshold altered from a CD4 count of 200 to 350). Based on this, an increase in ART need would be expected.
The Global HIV/AIDS response report8 highlights that the time from acquiring HIV until progression to ART eligibility is slower than previously estimated. As a result, ART need estimates from the 2011 Spectrum model are lower than from the 2009 Spectrum model (for 2010, a 12% decrease). The comparison of coverage rates using different criteria for the denominator should therefore be avoided.8 SSA indicated that new calculations are performed each year, based on the latest information available, therefore calculations should not be compared with those of previous years (SSA, personal communication).
SSA could not identify what caused the vast difference in their 2010 and 2011 calculations. Furthermore, it is unclear whether SSA already used the 2011 Spectrum model, because the methodology documents that accompany each mid-year population estimates report, do not provide information on the need for ART estimates.10 This is possibly because, according to SSA, 'the HIV data are not the main focus of the report'. However, the decrease reported in the 2011 Global HIV/AIDS response report is much less than that of the SSA mid-year estimates report. An explanation for this should be sought.
Conclusion
We provide a constructive contribution to the discussion concerning the use of model-derived estimates of ART need. It is critical that those providing estimates (in this case, SSA) clearly indicate whether any significant changes exist compared with earlier reports and, if so, the cause and implications of these changes.
References
1. Gerritsen AA, Mitchell JS, White B. Provision and need of HIV/AIDS services in the City of Tshwane Metropolitan Municipality, 2010. S Afr Med J 2011;102(1):44. [ Links ]
2. Statistics South Africa. Mid-year population estimates 2011. Pretoria: Statistics South Africa, 2011. http://www.statssa.gov.za/publications/statsdownload.asp?PPN=P0302&SCH=4986 (accessed 28 February 2012). [ Links ]
3. Department of Health. 2010 UNGASS Country Progress Report. Pretoria: Department of Health, 2010. http://www.unaids.org/en/dataanalysis/monitoringcountryprogress/2010progressreportssubmittedby countries/southafrica_2010_country_progress_report_en.pdf (accessed 28 February 2012). [ Links ]
4. Stover J, Johnson P, Hallett T, Marston M, Becquet R, Timaeus IM. The Spectrum projection package: improvements in estimating incidence by age and sex, mother-to-child transmission, HIV progression in children and double orphans. Sex Transm Infect 2010;8(Suppl 2):16-21. [http://dx.doi.org/10.1136/sti.2010.044222] [ Links ]
5. Statistics South Africa. Mid-year population estimates 2010. Pretoria: Statistics South Africa, 2010. http://www.statssa.gov.za/publications/statsdownload.asp?PPN=P0302&SCH=4696 (accessed 28 February 2012). [ Links ]
6. Adam MA, Johnson LF. Estimation of adult antiretroviral treatment coverage in South Africa. S Afr Med J 2009;99:661-667. [ Links ]
7. World Health Organization. World Health Statistics 2011. Geneva: WHO, 2011. http://www.who.int/whosis/whostat/2011/en/index.html (accessed 28 February 2012). [ Links ]
8. WHO, Unicef, UNAIDS. Progress report 2011: Global HIV/AIDS response. Geneva: WHO, 2011. http://www.who.int/hiv/pub/progress_report2011/en/index.html (accessed 28 February 2012). [ Links ]
9. Mahy M, Tassie JM, Ghys PD, et al. Estimation of antiretroviral therapy coverage: methodology and trends. Curr Opin HIV AIDS 2010;5(1):97-102. [http://dx.doi.org/10.1136/sti.2010.046060] [ Links ]
10. Statistics South Africa. A methodology for population estimation at the national and provincial levels: The approach used by Statistics South Africa. Pretoria: Statistics South Africa, 2011. http:// www.statssa.gov.za/Publications/P0302/Methodology%20of%20projections_Midyear%202011.pdf (accessed 28 February 2012). [ Links ]
Accepted 30 April 2012.
 Corresponding author:
A A M Gerritsen
(annette.gerritsen@epiresult.com)

