


Serviços Personalizados
Artigo
 Inglês (pdf)
 Artigo em XML
 Referências do artigo
Indicadores

Links relacionados
-
 Citado por Google
 -
 Similares em Google
Compartilhar

 Permalink
SAMJ: South African Medical Journal
versão On-line ISSN 2078-5135
versão impressa ISSN 0256-9574
SAMJ, S. Afr. med. j. vol.102 no.1 Pretoria Jan. 2012
ORIGINAL ARTICLES
Provision and need of HIV/AIDS services in the city of Tshwane Metropolitan Municipality, 2010
Annette A M GerritsenI; Janine S MitchellII; Brenda WhiteIII
IMSc, PhD, Epi Result, Louis Trichardt, Limpopo
IIBPE, Foundation for Professional Development, Tshwane, Gauteng
IIIBSc Ed, BCom Hons, Foundation for Professional Development, Tshwane, Gauteng
ABSTRACT
OBJECTIVES: To determine the need for HIV/AIDS service provision in the City of Tshwane Metropolitan Municipality (CTMM), especially in municipal areas.
METHODS: The Foundation for Professional Development initiated the Compass Project. Using a questionnaire, data were collected during May - June 2010 from organisations providing HIV/AIDS services in the CTMM (organisational information and types of HIV/AIDS services). The need for HIV counselling and testing (HCT), antiretroviral treatment (ART), prevention of mother-tochild transmission (PMTCT), and care for orphans and vulnerable children (OVC) was estimated using data from various sources.
RESULTS: A total of 447 service providers was included in the study: 72.3% non-governmental organisations (NGOs); 18.1% in the public sector; 5.1% in the private sector; and 4.5% faithbased organisations. The majority of the prevention- (70.2%) and support-related services (77.4%) were provided by NGOs, while the majority of treatment-related services originated from the public sector (57.3%). Service need estimates included: HCT - 1 435 438 adults aged 15 - 49 years (11 127/service provider); total ART - 75 211 adults aged 15+ years (1 213/service provider); ART initiation - 30 713 adults aged 15+ years (495/service provider); PMTCTHCT - 30 092 pregnant women (510/service provider); PMTCTART - 7 734 HIV+ pregnant women (221/service provider); and OVC care - 54 590 children (258/service provider).
CONCLUSION: Service gaps remain in the provision of HCT, PMTCT-ART and OVC care. ART provision must be increased, in light of new treatment guidelines from the Department of Health.
In 2010 it was estimated that 5.24 million people were living with HIV/AIDS in South Africa; overall HIV prevalence was approximately 10.5%, with 17.3% of adults aged 15 - 49 years HIV-positive.1Data on antiretroviral therapy (ART) provision and need are provided by Statistics South Africa in the mid-year population estimates.1 The ASSA2008 model provides national- and provinciallevel estimates until 2025, including the number of adults receiving or not receiving ART, and the number of maternal AIDS orphans.2The District Health Barometer provides national-, provincial- and district-level data such as the proportion of antenatal care (ANC) clients tested for HIV.3
Information regarding the provision and need of HIV/AIDS services is limited, especially in municipal areas; therefore the Foundation for Professional Development (FPD) initiated the Compass Project. Since 2007, an annual survey has been carried out of organisations providing HIV/AIDS-related services in the City of Tshwane Metropolitan Municipality (CTMM) to collect information on service provision, and to estimate service needs. The project aims to prioritise municipal activities by providing this overview and identifying service provision gaps.
We present the findings of the 2010 survey and discuss future implications thereof. The content and methods of the annual survey have changed since its inception in 2007, making it difficult to compare certain findings across years; therefore only results on key services (HCT, ART, PMTCT, and OVC) were compared with the 2009 survey.
Methods
The ethics committee of the School of Health Systems and Public Health (SHSPH) of the University of Pretoria approved the initial survey protocol. The survey was conducted in the CTMM over 7 weeks in May - June 2010. Service providers approached were organisations included in the previous year's study, new organisations identified through existing lists, and those listed in the HIV-911 Tshwane database.4 Information pertaining to the organisation (e.g. the type of service provider, and number of employees) and the types of HIV/AIDS services provided were obtained telephonically by trained fieldworkers using a questionnaire. Requested service information focused on the provision of prevention-, support- and treatment-related services. Survey data were analysed with SPSS software using frequency tables.
Using data from various sources, service needs were estimated and linked to the actual number of available services. The estimated need for HIV counselling and testing (HCT) services was based on the assumption that the adult population (15 - 49 years) should be tested at least once per year. An estimate of the number of adults (15 - 49 years) living in the CTMM was made by multiplying the number of adults in Gauteng (Statistics South Africa mid-year population estimates 2010)1by the proportion of the total population of the province living in the CTMM (Community Survey 2007 data).5
A distinction was made between adults requiring ART initiation, and the total need for ART (number of adults on ART plus those in need of ART initiation). The Statistics South Africa mid-year population estimates indicated the total need for ART in adults (15+ years).1Total need for ART in the CTMM was calculated by multiplication of this figure by the proportion of the total population of South Africa living in the CTMM (Community Survey 2007).5The Statistics South Africa mid-year population estimates also indicated the number of adults (15+ years) that were already receiving ART in 2009.1 Division of this by the total number in need of ART in South Africa gave the proportion of patients on treatment; further multiplication by the estimate of total ART need in the CTMM gave an estimate of those receiving treatment in the metropole. Subtraction of the latter from the calculated total need for ART in the CTMM, gave an estimate of those in need of ART initiation in the metropole.
For the estimated need for prevention of mother-to-child transmission (PMTCT) services, a distinction was made between the provision of HCT to all pregnant women, and ART for those women who were HIV-positive. The number of live births in 2009 (Statistics South Africa) was used as a proxy for determining the number of women in need of HCT (i.e. all pregnant women).6 Estimation of the need for ART for HIV-positive women was based on the number of live births in 2009 multiplied by the HIV prevalence (National Antenatal Sentinel HIV and Syphilis Prevalence Survey 2009).7
For the estimated need for services for orphaned and vulnerable children (OVC), the estimated number of maternal AIDS orphans (< 18 years) in the CTMM was calculated by applying the proportion of the total population of Gauteng living in the CTMM (using data from the Community Survey 2007) to the number of orphans in the province (using data from the ASSA2008 model).2,5
Results
Organisational information
A total of 447 service providers were included in the 2010 study; 31 organisations surveyed in the previous year were not included as they did not respond (58.1%), had closed down (22.6%) or did not provide any HIV/AIDS-specific services for the community as a whole (19.4%). The 447 service providers comprised 323 (72.3%) non-governmental organisations (NGOs), 81 (18.1%) public sector service providers, 23 (5.1%) private sector service providers and 20 (4.5%) faith-based organisations (FBOs).
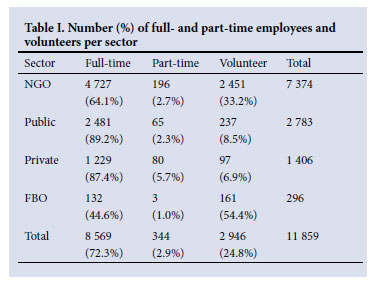
Most organisations (443 or 99.1%) provided their number of employees; 11 859 people were employed in total (Table I) including 8 569 (72.3%) full-time employees, 344 (2.9%) part-time employees and 2 946 (24.8%) volunteers. Most employees in the public and private sectors were full-time, while a third in NGOs and more than half in FBOs comprised volunteers.
Types of HIV/AIDS services provided
The services provided were broadly categorised into 3 types: (i) prevention-related services - awareness and education, training and development, and condom distribution; (ii) support-related services - counselling and support groups, income generation, HIV/AIDS advocacy, home- and community-based care (HCBC), hospice and palliative care, nutritional support, legal assistance, care for OVC, and rape/domestic violence victim support; and (iii) treatment-related services - HCT, ART, PMTCT HCT, PMTCT-ART, STI treatment, TB DOTS, PHC, and paediatric AIDS clinical treatment.
Of prevention-related services (N=986), 42.5% focused on awareness and education, 29.1% on training and development, and 28.4% on condom distribution. More than two-thirds (70.2%) of prevention-related services were offered by NGOs, 20.1% by the public sector, 6.0% by the private sector, and 3.8% by FBOs.
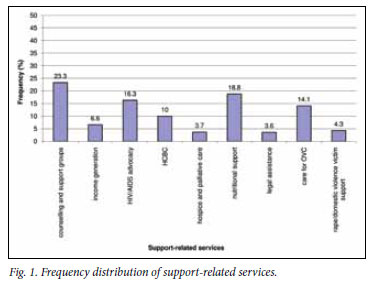
Support-related services (N=1504) (Fig. 1) comprised 23.3% counselling and support groups, 18.8% nutritional support, 16.3% HIV/AIDS advocacy and 14.1% care for OVC. The majority (77.4%) of support-related services were offered by NGOs, 14.7% by the public sector, 5.0% by FBOs, and 2.9% by the private sector.
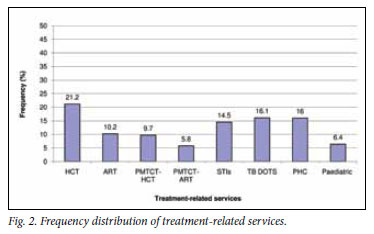
Of treatment-related services (N=607), 21.1% focused on HCT, followed by directly-observed treatment short course for tuberculosis (16.1%), primary health care (16.0%), treatment of sexually transmitted infections (14.5%), ART (10.2%), PMTCT-HCT (9.7%), paediatric AIDS clinical treatment (6.4%) and PMTCT-ART (5.8%) (Fig. 2). The public sector offered 57.3% of these treatment-related services, while NGOs offered 26.0%, the private sector offered 15.7%, and FBOs offered 4.1%.
Estimates of the need for care
HCT: the number of adults (15 - 49 years) in the CTMM is estimated to be 1 435 438, which indicates the estimated need for HCT services. In total, 129 HCT service providers were identified, giving a ratio of 11 127 people per service provider on average.
ART: the total ART need of adults (15+ years) in the CTMM is 75 211, with 30 713 in need of ART initiation. The number of ART service providers was 62 in 2010, giving a ratio of 1 213 people in need of ART (total) and 495 (initiation) per service provider on average.
PMTCT: 30 092 pregnant women were estimated to be in need of counselling and testing, with 7 734 estimated to be in need of ART. In total, 59 providers of PMTCT-HCT services were identified, as well as 35 providers of PMTCT-ART services. This equates to an average ratio of 510 people per service provider for the HCT services, and 221 for ART provision per provider of PMTCT.
Care for OVC: the estimated number of maternal AIDS orphans (<18 years) in the CTMM was 54 590. In the survey, 212 OVC care service providers were identified: a ratio of 258 children per provider.
Discussion
Our objectives were to present findings of the 2010 survey and related need estimates, and discuss future implications thereof. Here we focus on need estimates in relation to actual service provision, and discuss the limitations and strengths of the study.
The number of HCT service providers in 2010 (129) was considerably higher than in 2009 (99), giving a lower number of patients per service provider. However, each provider still had to consult and test 30 people per day on average throughout the year. Adding to this, the HCT campaign (including provider-initiated HCT), launched in April 2010, would have motivated further scaling up of facilities as it aimed to have tested 15 million people for HIV/ AIDS in South Africa by June 2011.8
The number of ART providers increased from 46 in 2009 to 62 in 2010; however, the number in need of but not receiving ART is considerable (an estimated 41%). This figure may be an overestimate; no data were available yet on the number of people receiving ART in 2010 and, more importantly, only public sector providers were included. There is no centrally co-ordinated data-collection system on ART provision by NGOs and the private sector,9although some information is available in the UNGASS report.10 With the introduction of new treatment guidelines in 2010, more people will be eligible for ART (e.g. early treatment initiation for TB clients), thereby increasing need.11
The number of PMTCT service providers in 2010 (59 HCT; 35 ART) was lower than in 2009 (81 HCT; 51 ART). Although there seems to be a downward trend in the number of pregnant women (live births), this reduction puts pressure on the remaining service providers (especially ART) as the new treatment guidelines, which prescribe early treatment for pregnant women, increase service need.12
In 2009 there were 161 service providers for OVC care; this rose to 212 in 2010. Although this is a positive development, the number of children per service provider is still high.
The methods used to derive the need estimates were subject to limitations and should be interpreted with caution. Data for 2010 were not available for certain estimates (e.g. population data, people on ART, number of live births, ANC HIV prevalence); these figures may change with the availability of more recent data. Secondly, most data used are also based on estimates, and not on survey data (e.g. need for ART from Statistics South Africa, and number of orphans from the ASSA2008 model). Over time, these estimates are adapted with more current data (e.g. the recent replacement of ASSA2003 with ASSA2008). Furthermore, in the need for ART initiation, it is assumed that the CTMM has the same ART coverage as the mean for the country. The FPD assists the Gauteng Department of Health with the provision of ART services, and is therefore able to determine the number of people currently on ART. Accordingly, this number seems higher than estimated with national data: 47 353 (Suzanne Johnson, personal communication) versus 44 498 respectively; however, this might have been partly attributed to the inclusion of providers outside the public sector. This gives an ART coverage of 63% (compared with 59% nationally).1 Despite these limitations, no other South African municipality has such current information on the provision of HIV/AIDS-related services. These data will facilitate adequate planning of interventions.
The data-collection instrument, and the way in which the need estimates are calculated, has improved over the years of the project. Based on the 2010 survey, considerations for the 2011 survey include determination of the number of clients serviced by providers, e.g. (i) the number of clients tested per month (HCT, PMTCT-HCT), and (ii) the number of clients placed on treatment each month (PMTCT-ART). This information is required to make an improved comparison with the need estimates.
Conclusion
In conclusion, service gaps exist for HCT, PMTCT-ART and care for OVC, and ART provision needs to be increased in the CTMM. Given the developments at national and municipal level over the past year (the HCT campaign, and new treatment guidelines), it is expected that the need for ART will be higher than estimated. A further increase in the number of ART service providers will be required to satisfy the demand.
Author contributions. JM was involved in the conception of the study; AG, JM, BW in the design of the study; and AG was responsible for data analysis and interpretation. AG drafted the manuscript, JM and BW revised it critically, and all authors gave final approval for publication.
Acknowledgements. The Compass project acknowledges the contributions of the HIV/AIDS service providers and staff for the survey. Thanks to HIV-911 for lists of service providers, and the School of Health Systems and Public Health, University of Pretoria, for its continued support of the project.
References
1. Statistics South Africa. Mid-year population estimates 2010. Pretoria: Statistics South Africa, 2010. http://www.statssa.gov.za/publications/statsdownload.asp?PPN=P0302&SCH=4696 (accessed 18 March 2011). [ Links ]
2. Actuarial Society of South Africa. Provincial Output ASSA2008 model. http://aids.actuarialsociety.org.za/ASSA2008-Model-3480.htm (accessed 18 March 2011). [ Links ]
3. Day C, Monticelli F, Barron P, et al., editors. The District Health Barometer 2008/09. Durban: Health Systems Trust, 2010. http://www.hst.org.za/publications/864 (accessed 18 March 2011). [ Links ]
4. HIV-911. Gauteng HIV-related services directory series 3 2010. Durban: HIV-911, 2010. [ Links ]
5. Statistics South Africa. Community Survey 2007. Basic results: municipalities. Pretoria: Statistics South Africa, 2008. http://www.statssa.gov.za/Publications/Report-03-01-27/Report-03-01-272007.pdf (accessed 18 March 2011). [ Links ]
6. Statistics South Africa. Recorded live births 2009. Pretoria: Statistics South Africa, 2010. http://www.statssa.gov.za/publications/statsdownload.asp?PPN=P0305&SCH=4711 (accessed 18 March 2011). [ Links ]
7. Department of Health. 2009 National Antenatal Sentinel HIV and Syphilis Prevalence Survey. Pretoria: Department of Health, 2010. http://www.health-e.org.za/documents/85d3dad6136e8ca9d02cceb7f4a36145.pdf (accessed 18 March 2011). [ Links ]
8. Motsoaledi A. Outline of the national HIV counselling and Testing (HCT) Campaign [press release]. Pretoria: Department of Health, 25 March 2010. http://www.sanac.org.za/files/uploaded/Media%20Statement%2025%2003%2010.pdf (accessed 18 March 2010). [ Links ]
9. Adam MA, Johnson LF. Estimation of adult antiretroviral treatment coverage in South Africa. S Afr Med J 2009;99:661-667. [ Links ]
10. Department of Health. 2010 UNGASS Country Progress Report. Pretoria: Department of Health, 2010. http://www.unaids.org/en/dataanalysis/monitoringcountryprogress/2010progressreportssubmittedbycountries/southafrica_2010_country_progress_report_en.pdf (accessed 18 March 2011). [ Links ]
11. Department of Health. Clinical Guidelines for the Management of HIV and AIDS in Adults and Adolescents. Pretoria: Department of Health, 2010. http://www.doh.gov.za/docs/factsheets/guidelines/adult_art.pdf (accessed 18 March 2011). [ Links ]
12. Department of Health. Clinical guidelines: PMTCT. Pretoria: Department of Health, 2010. http://www.doh.gov.za/docs/factsheets/guidelines/pmtct.pdf (accessed 18 March 2011). [ Links ]
Accepted 13 October 2011.
Corresponding author: A A M Gerritsen (annette.gerritsen@epiresult.com)

