


Serviços Personalizados
Artigo
 Inglês (pdf)
 Artigo em XML
 Referências do artigo
Indicadores

Links relacionados
-
 Citado por Google
 -
 Similares em Google
Compartilhar

 Permalink
SAMJ: South African Medical Journal
versão On-line ISSN 2078-5135
versão impressa ISSN 0256-9574
SAMJ, S. Afr. med. j. vol.100 no.9 Pretoria Set. 2010
ORIGINAL ARTICLES
Dual time-point FDG PET/CT for differentiating benign from malignant solitary pulmonary nodules in a TB endemic area
Mike Machaba SathekgeI; Alex MaesII; Hans PottelIII; Anton StoltzIV; Christophe van de WieleV
IMB ChB, MMed (Nucl Med), PhD. Department of Nuclear Medicine, Steve Biko Academic Hospital and University of Pretoria
IIMD, PhD. Department of Nuclear Medicine, AZ Groeninge, Kortrijk, Belgium
IIIPhD. Subfaculty of Medicine, Catholic University Leuven, Campus Kortrijk, Belgium
IVMB ChB, MMed (Int Med), PhD. Division of Infectious Diseases, University of Pretoria
VMD, PhD. Department of Nuclear Medicine, University Hospital Ghent, Ghent, Belgium
ABSTRACT
OBJECTIVE: Fluorodeoxyglucose(FDG)-positronemission tomography (PET) is an accurate non-invasive imaging test for differentiating benign from malignant solitary pulmonary nodules (SPNs). We aimed to assess its diagnostic accuracy for differentiating benign from malignant SPNs in a tuberculosis (TB)-endemic area.
METHODS: Thirty patients, 22 men and 8 women, mean age 60 years, underwent dual time point FDG-PET/computed tomography (CT) imaging, followed by histological examination of the SPN. Maximum standard uptake values (SUVmax) with the greatest uptake in the lesion were calculated for two time points (SUV1 and SUV2), and the percentage change over time per lesion was calculated (%DSUV). Routine histological findings served as the gold standard.
RESULTS: Histological examination showed that 14 lesions were malignant and 16 benign, 12 of which were TB. SUVmax for benign and malignant lesions were 11.02 (standard deviation (SD) 6.6) v. 10.86 (SD 8.9); however, when tuberculomas were excluded from the analysis, a significant difference in mean SUV1max values between benign and malignant lesions was observed (p=0.0059). Using an SUVmax cut-off value of 2.5, a sensitivity of 85.7% and a specificity of 25% was obtained. Omitting the TB patients from analysis resulted in a sensitivity of 85.7% and a specificity of 100%. Mean %DSUV of benign lesions did not differ significantly from mean %DSUV of malignant lesions (17.1% (SD 16.3%) v. 19.4% (SD 23.7%)). Using a cut-off of %DSUV >10% as indicative of malignancy, a sensitivity of 85.7% and a specificity of 50% was obtained. Omitting the TB patients from the analysis yielded a sensitivity of 85.7% and a specificity of 75%.
CONCLUSION: Our findings suggest that FDG-PET cannot distinguish malignancy from tuberculoma and therefore cannot reliably be used to reduce futile biopsy/thoracotomy.
Fluorodeoxyglucose (FDG)-positron emission tomography (PET) has proved to be an accurate non-invasive imaging test for differentiating benign from malignant solitary pulmonary nodules (SPNs).1-4 However, some types of cancers, e.g. carcinoid tumours and bronchoalveolar carcinoma, have low FDG uptake that can give false-negative results. Many benign processes such as infection, inflammation and granulomatous diseases, especially tuberculosis (TB), present as SPNs with enhanced FDG uptake leading to false-positive findings.5,6 Since TB is more prevalent in South Africa than in developed countries, it may be anticipated that the accuracy of FDG-PET in differentiating benign from malignant SPNs will be significantly worse owing to a drop in specificity.
Over time the uptake of FDG continues to increase in malignant lesions, whereas it decreases or remains stable in benign lesions.7-9 It was therefore deduced that dual time-point imaging might further improve the accuracy of FDG-PET to distinguish benign from malignant SPNs. However, a study of 27 patients suffering from SPN using delayed FDG-PET imaging in a tuberculosis endemic region such as Taiwan, found no significant difference in mean SUV, maximal SUV and retention index between benign and malignant solitary pulmonary nodules with an initial mean SUV less than 2.5; the area under the receiver operating curve did not differ from 0.5.10 Accordingly, we aimed to assess the diagnostic accuracy of dual-time point FDG-PET imaging in differentiating benign from malignant SPNs in a region with a high prevalence of TB.
Patients and methods
The study was approved by the Ethics Committee of the University of Pretoria. Thirty consecutive patients were prospectively included after giving written informed consent. There were 22 men and 8 women. SPNs were all incidentally detected on chest radiographs and computed tomography (CT) scans done for clinical indications such as dyspnoea, chest pain, cough and pre-operative radiographs. The patients underwent FDG-PET imaging followed by biopsy or surgical removal of the SPN. Routine histological examination of the biopsy material or surgical specimens served as the gold standard.
Dual-phase FDG-PET/CT scanning
The patients fasted for a minimum of 4 hours before the FDG-PET/ CT whole-body scan. The [18F]-FDG was administrated intravenously using the formula [(body weight/10)+1)]*37 MBq. Between injection and scanning they were asked to remain still, covered with a blanket and without auditory stimuli, for at least 45 minutes to avoid uptake of the radiotracer at physiological sites excited by these stimuli, which can result in artefacts that have false-positive interpretations. During this activation phase, patients were instructed to drink 1 litre of contrast material (barium diluted in water).
The images were acquired in a three-dimensional mode using a PET/CT Biograph 40 (Siemens Medical Solutions). Forty-five minutes after injection, the first whole-body scan, with a 3-minute emission scan for each of 9 bed positions, was done from the skull base to the pelvis. Patients were asked not to move while on the scanning table, and a second whole-body scan was started from 120 minutes after injection. For CT imaging, contrast enhancement was achieved by intravenous administration of 100 ml of non-ionic contrast material (Ultravist) at a rate of 2 ml/s. Matrix size was 512×512.
Images were reconstructed with and without attenuation correction (CT based) using OSEM (ordered subset expectation maximisation) yielding axial, sagittal and coronal slices. The FDG-PET images obtained were analysed by two experienced nuclear medicine specialists, blinded to the results obtained by morphological imaging. Disagreements were resolved by consensus.
Quantitative analysis
All images were initially evaluated visually. Foci of intense uptake exceeding the uptake of the surrounding mediastinal/normal structures and of nodular appearance were considered abnormal. The semi-quantitative analysis of the degree of uptake of the lesions characterised by the FDG-PET/CT scans was based on the standard uptake value (SUV). The SUV represents the activity of the radiotracer in a topographic region of the body image or volume of interest normalised to the weight of the patient and to the quantity of radiotracer administered, hence the formula: SUV = radiotracer activity × weight of the patient/injected dose, which characterises the relative concentration of the radiotracer in the lesion of interest.
We used the SUV for the pixel with the greatest uptake in the lesion (maximum pixel SUV). SUVmax values were obtained for all lesions identified by drawing manually defined regions of interest on the attenuation-corrected early and delayed axial images. The corresponding CT image was used as anatomical landmark. Regions of interest (ROI) were overlaid onto the lesions of scans 1 and 2 axial slices through direct visual assessment of the lesions on the CT scan and subsequent identification of the corresponding area on PET scans 1 and 2. In tumour lesions that extended over several slices in the craniocaudal direction, the ROI was placed in the midportion of the lesion where the maximal SUV was measured. In case no discernable uptake was present on either PET scan, ROIs were drawn in the presumed location that corresponded best with the radiographic density. The retention index was defined as follows: (maximal SUV on delayed images - maximal SUV on early images)/ maximal SUV on early images %. Hence from the SUVmax values obtained, percentage change in SUVmax from early to delayed images was calculated using the following formula:
%DSUVmax = (SUV maxD-SUVmaxE)/SUVmaxE × 100
SUV1max values and %DSUVmax values were used for further analysis.
Statistical analysis
Statistical analysis was performed using SPSS version 15.0.
Differences in SUVmax between benign and malignant SPNs were assessed using a two-tailed unpaired t-test. Differences in SUVmax values on early imaging as well as percentage changes in SUVmax between different underlying pathologies were assessed using analysis of variance and Kruskal-Wallis test, followed by Dunn's multiple comparison test. Statistical significance was defined as p<0.05.
Results
Results are set out in Table I.
The mean age of the patients was 60 years (range 37 -84 years). There were 8 women and 22 men. On histological examination, SPNs proved to be benign in 16 patients; there were 12 tuberculomas, 1 hamartoma, 2 rheumatoid nodules and 1 fibrous lesion. In the remaining 14 patients SPNs were malignant (Table I). The diameter of the SPNs was not significantly different between benign (mean 1.9, standard deviation (SD) 0.2) and malignant lesions (mean 1.9, SD 0.3) (p= 0.5).
Malignant versus benign
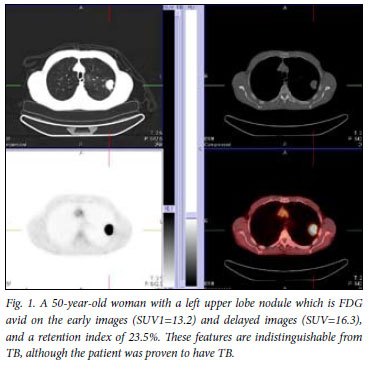
Mean SUV1max values of the benign lesions did not differ significantly from those of the malignant lesions (11.02 (SD 6.6) v. 10.86 (SD 8.9)). The high overlap in SUV mean values between the two groups limits the clinical value of FDG-PET/CT in a TB-endemic area (Fig. 1).
However, when tuberculomas were excluded from the analysis, a significant difference in mean SUV1max values between benign and malignant lesions was observed (p=0.0059). Using an SUVmax cut-off value of 2.5, as reported in literature, a sensitivity of 85.7% and a specificity of 25% was obtained.11,12 Omitting the tuberculomas from this analysis resulted in a sensitivity of 85.7% and a specificity of 100%, results comparable to other reports. Receiver operating characteristic (ROC) curve analysis (Fig. 2) performed to try to identify a single cut-off did not display discriminatory power when tuberculomas were included (area under the curve (AUC)=0.558, p=0.224) owing to the very poor specificity.
Mean %DSUV of benign lesions did not differ significantly from mean %DSUV of malignant lesions (17.1% (SD 16.3%) v. 19.4% (SD 23.7%)). Using a cut-off of >10% as indicative of malignancy, as reported in the literature, a sensitivity of 85.7% and a specificity of 50% were obtained. Omitting the tuberculoma patients from the analysis yielded a sensitivity of 85.7% and a specificity of 75%.
Malignant lesions versus tuberculomas versus other benign conditions
Median SUV1max values of malignant lesions, tuberculomas and other benign conditions were respectively 6.7 (25 - 75 percentile: 3.2 -13.1), 7.6 (25 - 75 percentile: 5.9 - 12.7) and 1.4 (25 - 75 percentile: 0.9 -1.8). SUV1 values of tuberculomas were significantly higher than those of other benign lesions (p<0.05) (Fig. 3).
Median %DSUV values of malignant lesions, tuberculomas and other benign conditions were respectively 19.5% (25 - 75 percentile: 12.9 - 41.5), 13% (25 - 75 percentile: 5.9 - 22.7%) and -11.3% (25 - 75 percentile: -25.3 -10.1). %DSUV values did not differ significantly between TB and malignant lesions (Fig. 4).
Finally, plotting SUV1 over SUV2 values per patient, indicating the rate of increase in SUVmax, graphically illustrates that the rate of increase in SUVmax is not different between tuberculomas and malignant lesions (Fig. 5).
Discussion
Few studies have assessed the potential of dual time-point imaging for differentiating malignant from benign SPNs. Using a 10% increase in delayed SUV for pulmonary malignancy, Matthies et al. claimed an increase in sensitivity from 80% to 100% and a decrease in specificity from 94% to 89%.7 In this series, 36 patients were studied and the benign character of SPNs was established by long-term follow-up in the majority of patients. Using the same threshold, Xiu et al. found that in patients presenting with SPNs with an initial SUVmax below 2.5, the dual technique increased the accuracy of PET from 65.2% to 84.8%, largely because of an increase of sensitivity versus only minor drop in specificity.13 Chen et al., reporting on patients cumulatively presenting with 31 lesions in a geographic region with epidemic granulomatous disease, including tuberculosis, found that delayed FDG PET imaging was not useful for differentiating benign from malignant pulmonary nodules with an initial mean SUV less than 2.5.10 Our data extend these findings to the global patient population presenting with SPNs in a TB-endemic environment such as South Africa, and confirms the findings even on patients with an initial SUV above 2.5. Hence FDG-PET is unable to distinguish malignancy from TB and therefore cannot be reliably used as a tool to reduce futile biopsy/thoracotomy in these patients.
It has been suggested that in tumours an increased ratio of hexokinase to glucose-6-phosphatase results in gradual accumulation of FDG and therefore in a further increase in SUV on delayed imaging.14 In contrast, high levels of glucose-6-phosphatase are expressed by mononuclear cells which represent the major cell population in chronic inflammation and infection, causing rapid clearance of FDG and subsequently a low ratio of hexokinase to glucose-6-phosphatase.9 Our findings do not necessarily contradict this hypothesis. Rather they may point towards other cells or Myocobacterium tuberculosis itself as being responsible for the high, progressive accumulation of FDG in tuberculomas over time.15 Enzymes involved in glycosidic bond synthesis represent more than 1% of all open-reading-frame genes in M. tuberculosis, emphasising the relevance of this group of enzymes for their physiology and pathogenicity. More specifically, high levels of glucose are required to construct their unique, impermeable mycobacterial wall, characterised by an outer layer of mycolic acids, containing among others methylglucose lipopolysaccharides.15 Further research is needed to unravel this finding.
References
1. Cronin P. Thoracic CT. Appl Radiol 2003; 32: 14-27. [ Links ]
2. Winer-Muram H. The solitary pulmonary nodule. Radiology 2006; 239: 34-49. [ Links ]
3. Lillington GA. Disease-a-Month. 37th ed. St Louis, MO: Mosby-Yearbook, 1991: 271-318. [ Links ]
4. Gould MK, Maclean CC, Kuschner WG, Rydzak CE, Owens DK. Accuracy of positron emission tomography for diagnosis of pulmonary nodules and mass lesions: a meta-analysis. JAMA 2001; 285: 914-924. [ Links ]
5. Knight SB, Delbeke D, Stewart JR, Sandler MP. Evaluation of pulmonary lesions with FDG-PET. Comparison of findings in patients with and without a history of prior malignancy. Chest 1996; 109: 982-988. [ Links ]
6. Kapucu LO, Meltzer CC, Townsend DW, Keenan R, Luketich J. Fluorine-18- fluorodeoxyglucose uptake in pneumonia. J Nucl Med 1998; 39: 1267-1269. [ Links ]
7. Matthies A, Hickeson M, Cuchiara A, Alavi A. Dual-time-point 18F-FDG PET for the evaluation of pulmonary nodules. J Nucl Med 2002; 43: 871-875. [ Links ]
8. Kubota K, Itoh M, Ozaki K, et al. Advantage of delayed whole-body FDG-PET imaging for tumor detection. Eur J Nucl Med 2001; 28: 696-703. [ Links ]
9. Zhuang H, Pourdehnad M, Lambright ES, et al. Dual time point 18F-FDG PET imaging for differentiating malignant from inflammatory processes. J Nucl Med 2001; 42: 1412-1417. [ Links ]
10. Chen C, Lee B, Yao W, et al. Dual-phase 18F-FDG PET in the diagnosis of pulmonary noduels with an initial standard uptake value less than 2.5. AJR Am J Roentgenol 2008; 191: 475-479. [ Links ]
11. Duhaylongsod F, Lowe V, Patz E, Vaughn A, Coleman R, Wolfe W. Detection of primary and recurrent lung cancer by means of F-18 fluorodeoxyglucose positron emission tomography (FDG PET). J Thorac Cardiovasc Surg 1995; 110: 130-139. [ Links ]
12. Lowe V, Duhaylongsod F, Patz E, et al. Pulmonary abnormalities and PET data analysis: a retrospective study. Radiology 1997; 202: 435-439. [ Links ]
13. Xiu J, Bhutani C, Dhurairaj T, et al. Dual-time point FDG PET imaging in the evaluation of pulmonary nodules with minimally increased metabolic activity. Clin Nucl Med 2007; 32: 101-105. [ Links ]
14. Mochizuki T, Tsukamoto E, Kuge Y, et al. FDG uptake and glucose transporter subtype expressions in experimental tumor and inflammation models. J Nucl Med 2000; 42: 1551-1555. [ Links ]
15. Barbosa Pereira P, Empadinhas N, et al. Mycobacterium tuberculosis glucosyl- 3-phosphoglycerate synthase: structure of a key enzyme in methylglucose lipopolysaccharide biosynthesis. PloS ONE 2008; 3: 1-12. [ Links ]
Accepted 19 March 2010.
Corresponding author: M M Sathekge (mike.sathekge@up.ac.za)

