


Servicios Personalizados
Articulo
 Inglés (pdf)
 Articulo en XML
 Referencias del artículo
Indicadores

Links relacionados
-
 Citado por Google
 -
 Similares en Google
Compartir

 Permalink
SAMJ: South African Medical Journal
versión On-line ISSN 2078-5135
versión impresa ISSN 0256-9574
SAMJ, S. Afr. med. j. vol.98 no.9 Pretoria sep. 2008
ORIGINAL ARTICLES
Fatal road traffic accidents in the Mthatha area of South Africa, 1993 - 2004
B L Meel
MB BS, MD, DHSM, MPhil; Department of Forensic Medicine, Faculty of Medicine, Walter Sisulu University for Technology and Science, Mthatha, E Cape
ABSTRACT
BACKGROUND: Trauma is one of the leading causes of death in the Mthatha area, which is one of the least developed regions of South Africa. Road traffic accidents (RTAs) contribute substantially to the number of such deaths.
OBJECTIVE: To estimate the number of fatal RTAs in the Mthatha area, and analyse age and sex of the deceased.
METHODS: A review of autopsies performed in the Mthatha General Hospital mortuary was conducted. Data were analysed using the GENSTAT 9 package with a Poisson regression model.
RESULTS: There were 2 736 deaths from RTAs over the 12-year period 1993 - 2004 in the Mthatha area. These casualties constituted an average annual rate of 57 deaths per 100 000 population. The highest (69.4/100 000) was in 1998, and the lowest (40.2/100 000) in 2001. Males outnumbered females by 2.6:1 (95% confidence interval (CI) 2.13 - 3.22), and the rate showed a decline of 0.97/100 000/year (95% CI 0.95 - 0.99) for the 1998 - 2001 period. The rate of decline was the same for males and females. The highest annual rate was 14.2 per 100 000 population in the age group 21 - 30 years, and the lowest, of 2.6 per 100 000 population, in the group above 70 years of age. The death rates were related to sex (p<0.001) and calendar year (p<0.049). There was no significant connection between year and sex, implying that the effect of year (time) was the same for men and women. These results are statistically significant despite the very high variability in the data (S2=5.53).
CONCLUSION: RTA-related deaths in the Mthatha area are 3 times higher than the global average.
Each year, 1.2 million people die in RTAs worldwide and millions more sustain injuries, with some suffering permanent disabilities; the young are particularly vulnerable. The average daily global death toll is 3 285 people.1 Earlier this century, public health experts predicted that, if current trends continue, RTA injuries will have risen by 60% by the year 2020.1 The highest RTA mortality rates occur in Latin-American countries: 42.2 per 100 000 population in El Salvador, 24 in Brazil and 22.7 in Venezuela.2
Low- and middle-income countries have a rate slightly greater than the global average of 19/100 000, while that of high-income countries is considerably lower. The vast majority (90%) of RTA deaths are in low- and middle-income countries.1 The World Health Organization has estimated that African countries have some of the world's highest RTA mortality rates; for example, more than 3 000 Kenyans are killed every year, most of whom were between 15 and 44 years. The cost to the economy of these accidents equates to some US$50 million - besides the actual loss of life.3 According to the South African National Injury Mortality Surveillance System (NIMSS), 25 000 fatal injuries were registered at 32 state mortuaries in 2001. Motor vehicle-related deaths accounted for 27% of all fatal injuries.4 Alcoholic intoxication was a factor in around 29% of non-fatally-injured drivers, and in over 47% of fatally-injured drivers in South Africa.5 The cost of RTA collisions in 2000 in South Africa was estimated at R13.8 billion (US$2 billion).6 The average annual incidence of violent and/or traumatic deaths in the Mthatha area was 162 per 100 000 population, of which RTAs contributed 63 per 100 000.7 The aim of this analysis was to estimate the mortality connected with RTAs and link it with demographic variables such as age and gender.
Cases and methods
The records in the mortuary of Umtata General Hospital (UGH) for RTA deaths for the period January 1993 to December 2004 were reviewed. Details of all medico-legal autopsies were recorded in the postmortem register in the mortuary, including names, addresses and ages of the deceased, and causes of death. The referrals were mainly from the Mthatha and Nqgeleni magisterial districts (combined population 400 000). All the autopsy records for the specified period were reviewed, compiled and collated manually. Data were ansalysed using the GENSTAT 9 package with a Poisson regression model (with overdispersion of the data in Table I), assuming a stable population of 200 000 males and 200 000 females. The models were: females loge (deaths)=46.5-0.0273 year+loge (200 000), and males loge (deaths)=47.4665-0.0273 years+loge (200 000).10 The model fitted well. All residuals lay within the simulation envelope. Temporary removal of the influential point (males, year 1993) increased the significance level of the year, so no change was made in the model.
Results
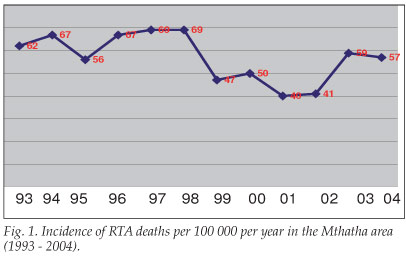
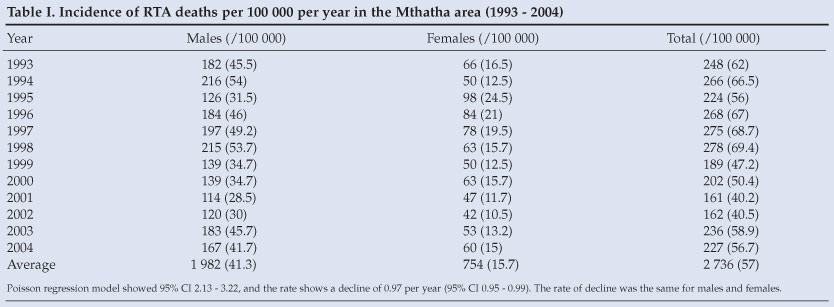
There were 2 736 deaths from RTAs over the 12-year period 1993 - 2004 in the Mthatha area (Table I). These casualties accounted for an average annual rate of 57 deaths per 100 000 population. The highest (69.4/100 000) was in 1998, and the lowest (40.2/100 000) in 2001 (Table I and Fig. 1).
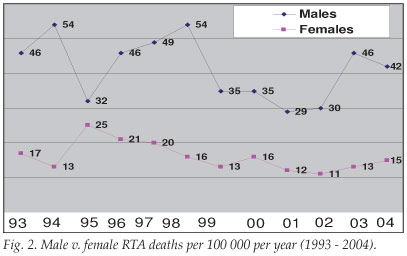
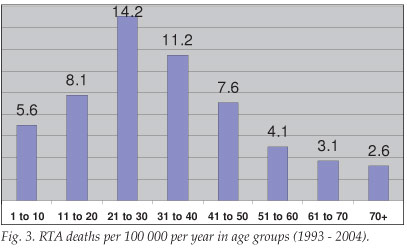
Males outnumbered females by 2.6:1 (95% CI, 2.13 - 3.22), and the rate showed a decline of 0.97 per year (95% CI 0.95 - 0.99). The incidence of death for males in the Mthatha area during 1993 - 2004 was 41.3/100 000, and that for females 15.7, giving a ratio of approximately 3:1. The rate of decline was the same for males and females in the Poisson regression-fitted model (Fig. 2). A similar fitted model confirmed the higher trend in death rates (14.2 per 100 000 population) in the age group 21 - 30 years. The lower trend (2.6 per 100 000 population) was observed among the elderly (over 70 years of age) (Table II and Figs 3 and 4). Death rates correlated with sex (p<0.001) and year (p<0.049). There was no significant correlation between year and sex, implying that the effect of year (time) was the same for men and women. These results are statistically significant despite the very high variability in the data (S2=5.53).

Discussion
This is believed to be the first study on RTA-related deaths in rural South Africa. The NIMSS statistics come from metropolitan areas such as Cape Town, Pretoria, Johannesburg, Durban and Port Elizabeth. South Africa can be viewed as both a First- and a Third-World country. The Eastern Cape has the highest percentage of poor (24%), and this figure rises to 92% in the Transkei region.8 Mthatha (previously Umtata) was the capital city of the former 'homeland' of Transkei, where the mainly African (of the Xhosa tribe) people live in poverty. Infrastructure such as roads and health and communication systems are poorly maintained. Public transport comprises solely minibus taxis, of which many are not roadworthy.
Long hours of driving result in fatigue and sleep deprivation. Reckless driving is commonplace on the main roads, which has led to these taxis being called danfos (flying coffins).9
There is a great variation in RTA-related deaths in South Africa. The Mthatha average annual rate of 57 deaths per 100 000 population is 3 times the global average (19/100 000) (Table I). The RTA-related death rate among low- and middle-income countries is 20.2 per 100 000 population, and for high-income countries 12.6 per 100 000. South Africa is regarded as a middle-income country.1 RTA-related deaths are about 3 times higher than in other low- and middle-income countries, and about 4.5 times higher than in high-income countries. The highest national RTA mortality is in El Salvador (42.2/ 100 000).1 The figure for the Mthatha area is 1.4 times higher than El Salvador's. Contributory factors for the local high RTA mortality are lack of fencing, reckless driving, unroadworthy vehicles, and speeding. In 1996, the Arrive Alive campaign was introduced during festive seasons in South Africa; it has had only a limited effect. In 1998, RTA mortality was the highest (69.4/100 000); the lowest was in 2001 (40.2/100 000). The fluctuation in the rate from year to year is not readily explicable (Fig. 1).
In 2002, males accounted for 73% of all RTA deaths globally;1 in the present study, males comprised 72.4% of all deaths. Male deaths globally from RTAs were 27.6 per 100 000 population, and females 10.4 per 100 000 population.1 This study showed RTA deaths among males of 41.3 per 100 000 population, and 15.7 per 100 000 for females. Although the ratio of males to females remained the same, the actual number of deaths was higher (Figs 2 and 3). RTA deaths were more evident in the 21 - 30 years age group, where the gender ratio was 3.6:1 (Table II and Figs 4 and 5). RTA mortality rates are higher for men than women in all regions, regardless of income level, and also across all age groups,1 which also applied to this study. One reason could be the greater degree of movement of men than of women.
Over 50% of global mortality due to RTAs occurs among adults aged 15 - 44 years.1 Mortality in this study was 59% in the age group 10 - 40 years. A quarter of deaths were in the 21 -30-year age group. Roughly 1 in 4 RTA deaths was of a person <18 years old. Young males increasingly indulge in alcohol and drugs and also tend to practise risk-taking behavior such as driving recklessly at high speed. This trend contributes to the very high death toll. An in-depth study is needed to explore these aspects. Additionally, a very strong cultural belief in witchcraft exists among Xhosa people. Trauma, illness, poverty, misfortune and even HIV infection are commonly attributed to witchcraft. Any attempt to tackle the problem of RTA deaths will have to address this aspect as well.
Conclusion
The annual death rate from RTAs in the Mthatha area is 57 per 100 000 population. The government's Arrive Alive campaign should be implemented throughout the year and not just for festive seasons.
I thank part-time doctors Dr M B Mafanya and Dr S Qaba and other mortuary staff for their contribution in assisting with autopsies. My special thanks go to Dr George Rupesinghe, a principal specialist in the Department of Family Medicine, Umtata General Hospital, for his help in editing this manuscript, and to the reviewer for valuable comments on the statistical analysis.
References
1. Milestones in International Road Safety. World Health Day 2004 and Beyond. Geneva: World Health Organization, 2004. [ Links ]
2. World Report on Road Traffic Injury Prevention. Geneva: World Health Organization, 2003. [ Links ]
3. Kibaki M, President, Republic of Kenya. Preface to the World Report on Road Traffic Injury Prevention. Geneva: World Health Organization, 2004. [ Links ]
4. Butchart S. A Profile of Fatal Injuries in South Africa 1999. First Annual Report of NIMSS. Cape Town: Medical Research Council, 2000. [ Links ]
5. Peden M, van der Spuy J, Smith P, Bautz P. Injured pedestrians in Cape Town: the role of alcohol. S Afr Med J 1996; 16: 1103-1105. [ Links ]
6. The Road to Safety 2001-2005: Building the Foundations of a Safe and Secure Road Traffic Environment in South Africa. Pretoria: Ministry of Transport, 2001. http://www.transport.gov.za/projects/index.html (accessed 12 June 2006). [ Links ]
7. Meel BL. Incidence and patterns of violent and/or traumatic deaths between 1993 and 1999 in the Transkei Region of South Africa. J Trauma 2004; 57: 125-129. [ Links ]
8. Rural development framework document (draft). Faculty Executive Committee (Facex), Faculty of Health Sciences, University of Transkei, 6 January 2003. [ Links ]
9. Nantulya VM, Reich MR. Equity dimensions of road traffic injuries in low-and middle-income countries. Injury Control and Safety Promotion 2003; 31: 319-320. [ Links ]
10. McCullagh P, Nelder JA. Generalized Linear Models. Dordrecht, Netherlands: Chapman & Hall Publishers, 1989. [ Links ]
 Correspondence:
B Meel
(bmeel@wsu.ac.za)
Accepted 20 November 2007

