


Servicios Personalizados
Articulo
 Inglés (pdf)
 Articulo en XML
 Referencias del artículo
Indicadores

Links relacionados
-
 Citado por Google
 -
 Similares en Google
Compartir

 Permalink
SAMJ: South African Medical Journal
versión On-line ISSN 2078-5135
versión impresa ISSN 0256-9574
SAMJ, S. Afr. med. j. vol.98 no.8 Pretoria ago. 2008
ORIGINAL ARTICLES
Temporal evolution of cerebrospinal fluid following initiation of treatment for tuberculous meningitis
V B PatelI; I BurgerII; C ConnollyIII
IMBChB, FCP, FCN; Department of Neurology, University of KwaZulu-Natal, Durban
IIMBChB, FCN; Department of Neurology, University of KwaZulu-Natal, Durban
IIIMSc; Department of Biostatistics, Medical Research Council, Durban
ABSTRACT
OBJECTIVE: Clinicians often perform follow-up lumbar punctures (LPs) on patients with tuberculous meningitis (TBM) to document changes occurring in the cerebrospinal fluid (CSF). Normalisation of the CSF then serves as indirect confirmation of the diagnosis. However, changes occurring in CSF following the initiation of anti-tuberculosis (TB) treatment are not well described. We undertook a retrospective study to determine the temporal evolution of CSF in patients with TBM on anti-TB treatment in an attempt to provide a more rational basis for the interpretation of repeat LPs.
METHODS: Patients diagnosed with TBM at King George V Hospital in Durban from 1994 to 2003 were identified. Demographic, clinical, laboratory and radiological data were recorded. We examined the change in CSF lymphocyte cell count, polymorphonuclear (PMN) cell count, glucose concentration and protein concentration. Initially, scatter plots of the data modelled over time were produced and random effects models were then used to model the predicted changes in CSF over time.
RESULTS: Ninety-nine patients were identified, and a total of 327 LPs were done. The average number of LPs per patient was 3 (range 3 - 9). Statistically significant changes in all four variables (lymphocytes, PMN cells, glucose and protein) were demonstrated, with a p value <0.001. The predicted models showed that lymphocyte count and protein concentration change slowly over time. PMN cells and glucose concentration changed rapidly in an exponential manner.
CONCLUSIONS: Our results demonstrate the tendency for CSF to normalise over time. The slow change in lymphocyte count and protein concentration limits clinical use. The rapid change in PMN cells and glucose concentration allows us to make reasonable clinical decisions. If a repeat LP does not show definite improvement in these two parameters, it should be considered atypical for TBM.
Tuberculosis (TB) remains a major health challenge worldwide, with the global incidence estimated to be increasing by 0.4% per annum.1,2 Tuberculous meningitis (TBM) represents 1% of the annual risk of infection with TB3 and, despite optimal treatment, carries a mortality rate of 30%.4 The most important factor influencing the outcome of TBM is prompt diagnosis and early initiation of treatment.5
Confirming the diagnosis of TBM is difficult as culture and microscopy is either too insensitive or takes too long to provide rapid and accurate diagnosis.6 Newer diagnostic techniques such as nucleic acid amplification tests (e.g. polymerase chain reaction (PCR)) have not been assessed completely and are not available in resource-poor countries.7 The decision to treat for TBM is frequently empirical, based on assessment of clinical presentation, CSF biochemistry and microscopy, and neuro-imaging. Diagnostic uncertainty remains a problem, and clinicians are often reluctant to start a patient on months of treatment without firm evidence.
Clinicians frequently repeat LPs to document changes occurring in the CSF, and normalisation of CSF is used to validate the decision to treat and indirectly serves as confirmation of the diagnosis. However, the changes occurring in CSF following the initiation of anti-TB treatment are not well described and make the interpretation of a follow-up LP difficult. We undertook a retrospective chart review of a group of patients on treatment for TBM, with the objective of:
- documenting the cross-sectional and longitudinal CSF changes in patients with TBM
- developing a predicted model of change for CSF after the initiation of treatment for TBM
- documenting clinical and demographic features of a series of patients with TBM.
Methods
Ethical approval for this study was obtained from the Ethics Committee of the University of KwaZulu-Natal. The study was performed at King George V Hospital (KGV) in Durban, KwaZulu-Natal, and permission was obtained from the hospital manager. KGV is a district hospital dedicated to the care of patients with all forms of TB, including TBM. All patients are admitted for the duration of their illness and complete treatment in hospital; they are discharged only when cured and treatment is complete. Before 2003, it was routine practice to perform repeat LPs on patients with TBM. These were repeated until the CSF had returned to normal or the patient was considered to be cured and treatment discontinued. This approach created a unique patient population where CSF data was available from onset to cure of disease.
We identified all patients who had had a LP at KGV from 1994 to 2003 by reviewing the laboratory records. The case file for each of these patients was then reviewed. We included those in whom a diagnosis of TM was confirmed or probable.
The selection of patients was based on the following inclusion criteria:
1. smear-positive or culture-positive CSF for TB
2. clinical findings of a subacute meningitis
3. CSF features consistent with a diagnosis of TBM
4. presence of confirmed TB elsewhere
5. neuro-imaging in keeping with tuberculous meningitis.
Patients had to meet criterion 1 (confirmed TBM) or criteria 2+3 and either 4 and/or 5 (probable TBM) for inclusion. The probable TBM group of patients either improved on anti-TB treatment alone or died from disseminated TB.
Patients were excluded if:
1. an alternative diagnosis was confirmed, e.g. bacterial or fungal meningitis
2. the CSF change was not in keeping with TBM or normal, unless patients had smear-positive or culture-positive CSF for MTB
3. they had been treated with antibiotics other than anti-TB treatment
4. patient information was incomplete.
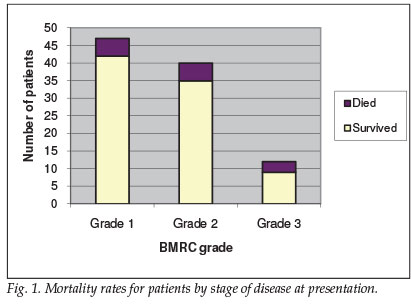
Demographic, clinical, laboratory and radiological data for all patients fulfilling these criteria were reviewed. The staging of TBM was based on the British Medical Research Council (BMRC) grading: stage 1 patients were fully conscious and rational and had no focal neurological signs; stage 2 patients were confused and/or had focal neurological signs; and stage 3 patients were comatose.
Statistical methods
Continuous data were summarised by medians and categorical data by percentages. CSF data were transformed using a natural logarithm to stabilise the variance. Initially, a separate analysis was done for HIV-positive and -negative patients; however, there was no statistical significance between the two groups, and therefore the data were pooled.
We evaluated the change in the lymphocyte cell count, polymorphonuclear (PMN) cell count, glucose concentration and protein concentration over time. Scatter plots of the data modelled over time as a continuous variable were produced. A non-parametric curve was overlaid on the data using Lowess smoothing to demonstrate the trend. Random effects models were then used to produce a smooth curve that represented our predicted model for the change of CSF over time.
The retrospective nature of the study meant that the number of LPs and the time interval between LPs varied among patients. The uniqueness of the KGV patient population means that, although intervals between LPs were not standardised, a set of LPs that reflects the entire course of every patient's illness, from onset to cure, was available for analysis. By using time as a continuous variable and a random effects model, one can compensate to some extent for the variability in the intervals between LPs.
Results
Patients
Ninety-nine patients with either definite (5) or probable (94) TBM were identified. Ninety-five patients were black, and 4 were Indian; 51 were male, and 48 were female. The median age was 19 years (range 3 months - 66 years); 53 were >18 years, and 46 were <18 years.
Forty-seven patients were classified as BMRC grade 1 at presentation, 40 were grade 2, and 12 grade 3 (see Fig. 1 for a mortality data summary). Morbidity data were not collected. A strong association between BMRC grade and mortality was demonstrated, with mortality rates doubling between grade 2 (12.5%) and grade 3 (25%).
Laboratory and radiology data
Forty-three patients tested positive for HIV, 46 tested negative, and 10 were not tested for HIV.
A computed tomography (CT) brain scan was done on 63 of the 99 patients; 50 (84%) showed features in keeping with TBM. Neuro-imaging pathology included basal enhancement, hydrocephalus, striatocapsular infarcts and tuberculoma.
CSF
A total of 327 LPs were performed, averaging 3 (range 3 - 9) LPs per patient. The average time period between first and last LP was 153 days. Sixty-six patients had their initial LP before commencement of treatment, whereas 33 patients were already on anti-TB treatment (average duration of treatment 28 days) by the time the diagnosis of TBM was made.
The cross-sectional data for the first LP performed are shown in Table I. A lymphocytic predominant pleocytosis was seen in 67.7% of initial LPs, and PMN cells predominated in 32.3%. Glucose levels <2.2 mmol/l were seen in 65% of patients, and protein levels elevated above 1 g/1 were seen in 88%. All 3 features were present in only 34% of patients. No patient had smear-positive CSF for AFB; 5 patients had TB cultured from CSF.

Fig. 2 represents the scatter plots of the four different parameters plotted against time. A non-linear curve was applied to the data to demonstrate the trend using Lowess smoothing. All four parameters demonstrated a statistically significant change over time, with p<0.001.
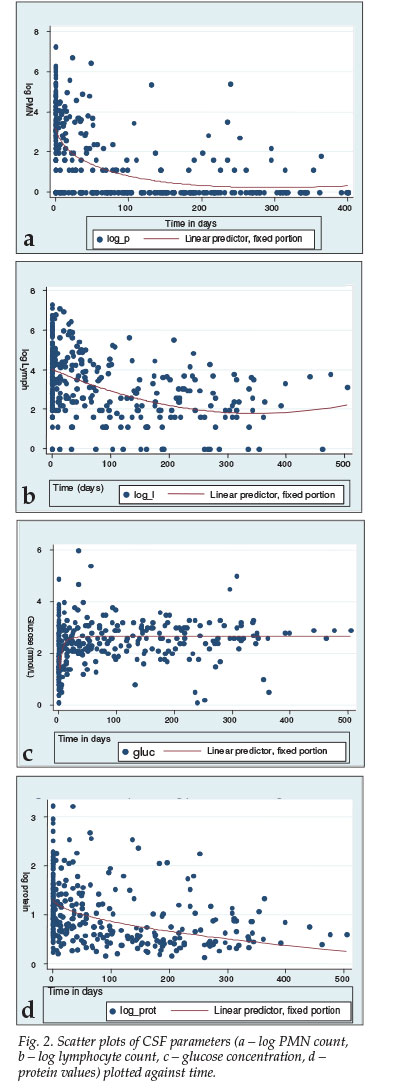
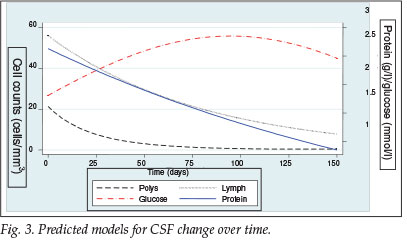
Fig. 3 shows the predicted model that was produced using a random effects model, demonstrating only the first 150 days. For PMN cells, the curve rapidly returns to zero, dropping by 64% within the first 25 days. The glucose concentration also changed rapidly, reaching 2.2 mmol/l by day 25, a maximum of 2.8 mmol/l by day 100, and by day 150 stabilising at 2.5 mmol/l. Lymphocytes and protein concentration changed much slower and in a more linear fashion.
Discussion
Our series, including 99 patients of whom 5 had definite TBM and the rest probable TBM, reflects normal clinical practice in which the most TBM cases will not be proven microbiologically.
Patients can develop TBM while already on TB treatment,15-17 which was the case in a third of our patients; in these, the first LP used in the analyses of both the cross-sectional and longitudinal data still represents the CSF change at the onset of their meningeal disease. We do not believe that it affected our results negatively. These patients had prednisone added to their treatment and/or ethambutol substituted with ethionamide, which has better CSF penetration. They also received a longer course of treatment.
The exclusion of patients with CSF deemed atypical for TBM creates the problem of selection bias. One objective was to assess the initial CSF changes in TBM; excluding atypical cases would skew this aspect of the results. This exclusion was felt necessary because a small number of patients had had more than one LP for nonspecific and trivial neurological complaints, e.g. mild transient headache. The CSF was then either normal or, in those who were HIV-positive, showed minimal cellular reactivity (e.g. CSF white cell count <10 cells/mm3). These patients clearly did not have TBM and were excluded. All files were reviewed by a senior consultant neurologist with experience in TBM, and we tried to ensure that no patient with probable TBM was excluded.
The typical CSF change for TBM is a lymphocytic predominant pleocytosis, depressed glucose and elevated protein levels.10 All three features were simultaneously present in only a third of our patients, which emphasises the variability of CSF in TBM and highlights that CSF may be atypical or that the abnormality may be confined to only one aspect of the CSF.
Studies8,9,11,13,14 examining the serial CSF changes in patients with TBM on treatment have emphasised the following: (i) CSF normalises with time; the rate of change is very variable and is often very slow; (ii) the different parameters change at different rates, with glucose usually normalising faster than protein and the white cell count; (iii) in all studies, the lymphocyte and PMN counts are usually grouped together, and no study has assessed the rate of change for lymphocytes and PMNs individually; (iv) CSF can temporarily worsen after anti-TB treatment is started; and (v) there is no correlation between the rate of change in CSF and the patient's clinical response to treatment or to the stage of the disease.
Our results were similar, but this appears to be the first time that the differential rate of change between the lymphocyte and PMN cells has been demonstrated which, together with the rapid change in the glucose, is of practical importance. In the clinical setting of a patient with a presumptive diagnosis of TBM who is deteriorating despite treatment, a repeat LP may be of value as the PMNs and glucose should be changing in a rapid and predictable fashion. If these two parameters show no definite imp rovement on repeat LP, it should be considered atypical for TBM and an alternative diagnosis or drug resistance should be considered. The marked variation as demonstrated in the sc after plots must be kept in mind, and no change or failure to change or even deterioration in a specific CSF parameter necessarily indicates treatment failure or diagnostic error.
The value of neuro-imaging must also be noted, with 84% of those in whom imaging was done demonstrating abnormalities associated with TBM, which supports the notion that neuro-imaging in TBM is sensitive although nonspecific and adds to circumstantial evidence for TBM,12 and where available is therefore an important tool in aiding the diagnosis of TBM.
In conclusion, our study has attempted to define the changes that occur in CSF over time in cases of TBM. Despite the limitations, we feel that the findings are valid and representative of the general TBM population, and provide valuable information that has clinical application in the everyday management of TBM patients. Our study also highlights that rapid, reliable and accurate diagnosis of TBM remains a major challenge, and new diagnostic methods are urgently needed.
References
1. WHO annual report on global TB control - summary. Wkly Epidemiol Rec 2003; 78: 122-128. [ Links ]
2. WHO Report on Global TB control 2005. Geneva: World Health Organization. http://www.who.int/tb/publications/global_report/2005/en/ (accessed 21 June 2006). [ Links ]
3. Thwaites GE, Chau TT, Mai NT, Drobniewski F, McAdam K, Farrar JJ. Tuberculous meningitis. J Neurol Neurosurg Psychiatry 2000; 68: 289-299. [ Links ]
4. Thwaites GE, Chau TT, Stepniewska K, et al. Diagnosis of adult TBM by use of clinical and laboratory features. Lancet 2002; 360: 1287-1292. [ Links ]
5. Karstaedt AS, Valtchanova S, Barriere R, Crewe-Brown HH. Tuberculous meningitis in South African urban adults. Q J Med 1998; 91: 743-747. [ Links ]
6. Caws M, Wilson SM, Clough C, Drobniewski F. Role of IS6110-Targeted PCR, culture, biochemical, clinical and immunological criteria for diagnosis of TBM. J Clin Microbiol 2000; 38: 3150-3155. [ Links ]
7. Pai M, Flores LL, Pai N, Hubbard A, Riley LW, Colford JM. Diagnostic accuracy of nucleic acid amplification tests for tuberculous meningitis: a systematic review and meta-analyses. Lancet Infect Dis 2003; 3: 633-643. [ Links ]
8. Schoeman JF, Elshof JW, Loubscher JA, Janse van Rensburg A, Donald PR. The effect of adjuvant steroid treatment on serial CSF changes in TBM. Ann Trop Paediatr 2001; 21: 299-305. [ Links ]
9. Verdon R, Chevret S, Lasissy JP, Wolff M. Tuberculous meningitis in adults: review of 48 cases. Clin Infect Dis 1996; 22: 982-988. [ Links ]
10. Kennedy DH, Fallon RJ. Tuberculous meningitis. JAMA 1979; 241: 264-268. [ Links ]
11. Kent SJ, Crowe SM, Yung A, Lucas CR, Mijch M. Tuberculous meningitis: A 30-year review. Clin Infect Dis 1993; 17: 987-994. [ Links ]
12. Bhargava S, Gupta AK, Tandon PN. Tuberculous meningitis: a CT study. Br J Radiol 1982; 55: 189-196. [ Links ]
13. Donald PR, Schoeman JF, Cotton MF, Van Zyl LE. Cerebrospinal fluid investigations in tuberculous meningitis. Ann Trop Paediatr 1991; 11: 241-246. [ Links ]
14. Thwaites GE, Simmons CP, Quyen NT, et al. Pathophysiology and prognosis in Vietnamese adults with tuberculous meningitis. J Infect Dis 2003; 188: 1105-1115. [ Links ]
15. Mital VN, Misra M, Gupta OP. Tuberculous meningitis developing during course of chemotherapy for tuberculosis including isoniazid - report of two cases. J Assoc Physicians India 1980; 28(9): 311-313. [ Links ]
16. Lintermans JP, Seyhnaeve V. Tuberculous meningitis developing during the course of chemotherapy for pulmonary tuberculosis. Pediatrics 1969; 44(4):514-517. [ Links ]
17. Agarwal KN, Singh SJ, Routh BR, Ghosh S, Taneja PN. Tuberculous meningitis developing during the course of chemotherapy for pulmonary tuberculosis. Clin Pediatr (Phila) 1968; 7(1): 61-62. [ Links ]
 Correspondence:
I Burger
(Izakburger@vodamail.co.za)
Accepted 16 May 2008.

