


Servicios Personalizados
Articulo
 Inglés (pdf)
 Articulo en XML
 Referencias del artículo
Indicadores

Links relacionados
-
 Citado por Google
 -
 Similares en Google
Compartir

 Permalink
SAMJ: South African Medical Journal
versión On-line ISSN 2078-5135
versión impresa ISSN 0256-9574
SAMJ, S. Afr. med. j. vol.98 no.5 Pretoria may. 2008
ORIGINAL ARTICLES
Determinants and treatment of hypertension in South Africans: The first Demographic and Health Survey
Krisela SteynI; Debbie BradshawII; Rosana NormanIII; Ria LaubscherIV
IMSc, MD, NED; Chronic Diseases of Lifestyle Unit and Department of Medicine, University of Cape Town
IIDPhil (Oxon); Burden of Disease Research Unit, Medical Research Council, Cape Town
IIIPhD; Burden of Disease Research Unit, Medical Research Council, Cape Town
IVBCom; Biostatistics Unit, Medical Research Council, Cape Town
ABSTRACT
OBJECTIVES: To identify the groups of patients with high prevalence and poor control of hypertension in South Africa.
METHODS: In the first national Demographic and Health Survey, 12 952 randomly selected South Africans aged 15 years and older were surveyed. Trained interviewers completed questionnaires on socio-demographic characteristics, lifestyle and the management of hypertension. This cross-sectional survey included blood pressure, height and weight measurements. Logistic regression analyses identified the determinants of hypertension and the treatment status.
RESULTS: A high risk of hypertension was associated with less than tertiary education, older age groups, overweight and obese people, excess alcohol use, and a family history of stroke and hypertension. Hypertension risk was lowest in rural blacks and significantly higher in obese black women than in women with a normal body mass index. Improved hypertension control was found in the wealthy, women, older persons, Asians, and persons with medical insurance.
CONCLUSIONS: Rural black people had lower hypertension prevalence rates than the other groups. Poorer, younger men without health insurance had the worst level of hypertension control.
South Africa's Demographic and Health Survey (SADHS) in 1998 first described the national prevalence of hypertension.1 Using a cut-off point of 140/90 mmHg and age adjusting, 25% of men and 26% of women had hypertension.2 Using previous cut-off points of 160/95 mmHg, a prevalence rate of 11% and 14% was found for men and women, respectively.1
Hypertension, the degree of its diagnosis and control, and underlying risk factors were included in the SADHS to assess the feasibility of collecting population-based data, and evaluate how well a country is managing chronic diseases. High blood pressure (BP) was identified as a suitable chronic disease risk factor for surveillance, as its measurement is non-invasive and it can be accurately measured electronically.3
In 1998, the recommended cut-off point of 160/95 mmHg was used for diagnosing hypertension: 41% of men with hypertension were aware of this condition, 39% used antihypertensive medication, and 26% had their BP controlled (<160/95 mmHg); for women these rates were 67%, 55% and 38%, respectively.
The poor level of hypertension control highlights the need to identify people needing intervention for early diagnosis and cost-effective control. Groups with the highest risk of having hypertension are identified and patients with poor BP control, who should be targeted for treatment, described. We also examine the potential of using the level of hypertension control as an adult health indicator for South Africa.
Methods
This study employed multi-stage sampling to select a nationally representative sample, using the 1996 census, from the nine provinces by urban and non-urban areas.4 All men and women 15 years and older, excluding pregnant women and people who could not stand upright or those in a wheelchair, were interviewed in up to three visits.
Trained interviewers recorded socio-demographic variables. Poverty, measuring ownership of durable goods, dwelling characteristics, source of drinking water, toilet facilities and hunger, was identified using a principal component factor analysis. An asset index was based on 14 items with a factor loading greater than 0.5 and households were divided into wealth quintiles.5 Excess alcohol use was assessed using the CAGE questions.6 Participants reported on their family and personal medical history, and prior hypertension diagnosis by a doctor or nurse. The names of all prescribed medications were recorded after having viewed the containers. The Anatomical Therapeutic Chemical Index was used to code medications.7
BP was measured using an electronic BP monitor after participants had been seated for 5 minutes in accordance with the JNC V1 methodology. Three measurements were taken and the mean SBP and DBP calculated. Hypertension was diagnosed for participants whose BP was > 140/90 mmHg and/or who were taking appropriate antihypertensive medication. Uncontrolled hypertension was defined according to the South African guidelines applying in 1998, i.e. >160/95 mmHg. Controlled hypertension was defined as being on antihypertensive medication and with a BP below 160/95 mmHg.
Weight was measured to the nearest 0.5 kg with subjects in light clothing and height was measured to the nearest 0.1 cm. Body mass index (BMI) was calculated and subjects classified underweight (<18.5 kg/m2), overweight (25 - 29.9 kg/m2), and obese (>30 kg/m2).8
Descriptive and multivariate statistics were calculated using weighted data that adjust for non-response in each stratum and the size of each stratum according to the 1996 census. Prevalence rates were also age-adjusted to the world population.2 A model was developed using logistic regression analysis to calculate the adjusted odds ratio (OR) and 95% confidence interval (CI). The variable categories used for the regression of hypertension were sex, age, poverty, education level, and urban-rural population group to allow for an interaction effect. (Population group classifications used in this article are based on self-reported categories according to the population group categories used by Statistics South Africa. Use of this classification allows for further exploration of previously observed differences in hypertension prevalence. The authors do not subscribe to this classification for any other purpose.) The hypertension risk factors were BMI and excess alcohol use. A family history of hypertension or stroke was included in the model. The survey set option in the STATA statistical package (Release 7.0, College Station, TX) was used to account for the survey design.
A stratified analysis compared the association of hypertension with BMI among black women and among other women using logistic regressions to adjust for age in each group.
The OR and 95% CI for participants with hypertension on the correct medication, or having controlled BP (<160/95 mmHg), were regressed on the same socio-demographic variables, as well as membership of a medical aid. The latter broadly defined the use of public or private health services.
Results
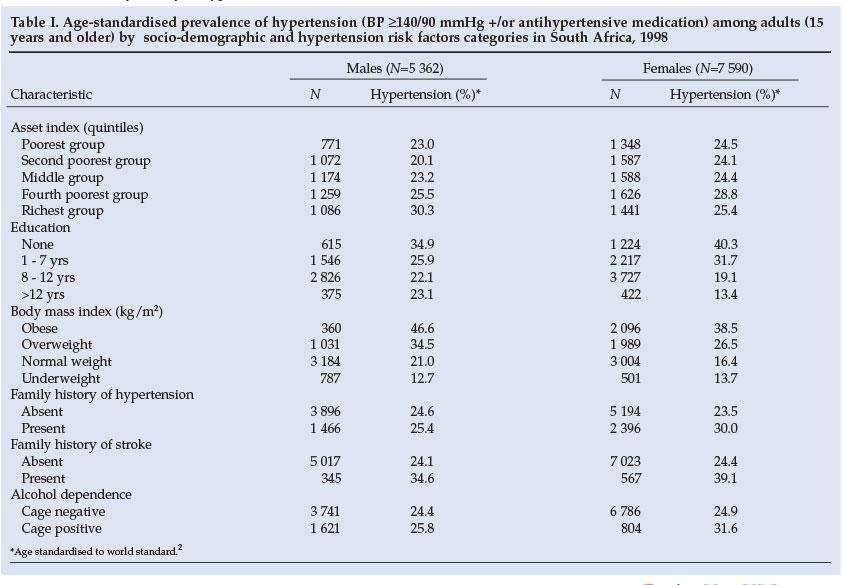
The results include 12 952 participants with complete data. Table I provides the age-adjusted (to the world population) hypertension prevalence rates. The prevalence according to age and population group is reported elsewhere.1 The prevalence of hypertension was higher in women. Hypertension prevalence decreased with higher education; however, the wealthiest quintile had higher prevalences of hypertension than the poorest. Adults with a family history of hypertension or stroke had a higher prevalence, as did the obese.
Table II shows the results for all participants adjusting for the socio-demographic and known hypertension risk factors. The adjusted risk for hypertension was significantly lower in women than in men. For BMI, the adjusted risk for hypertension was about 2-fold higher in obese participants than in those of normal weight. Being underweight had a protective effect. A family history of stroke and of hypertension was significantly associated with hypertension. Participants who may have used alcohol excessively (positive CAGE questionnaire) had a significantly increased adjusted risk for hypertension. The odds ratio (OR) for hypertension in obese black women compared with black women of normal weight was 1.83 (95% CI 1.47, 2.29). The same comparison among the other women found an OR of 2.35 (95% CI 1.61, 3.42); detailed data not shown.
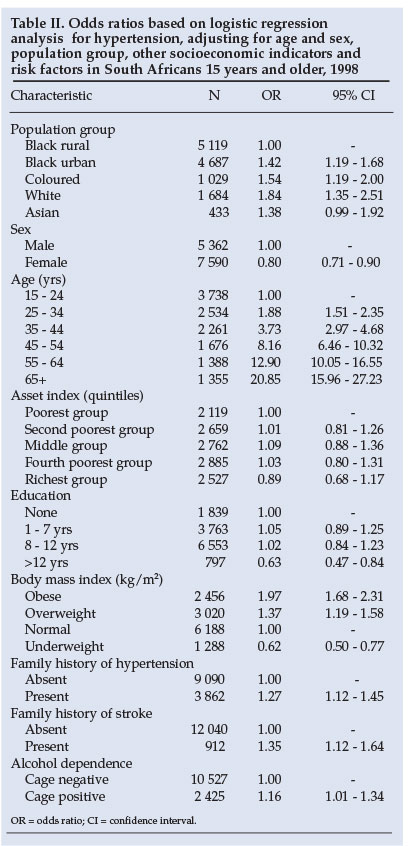
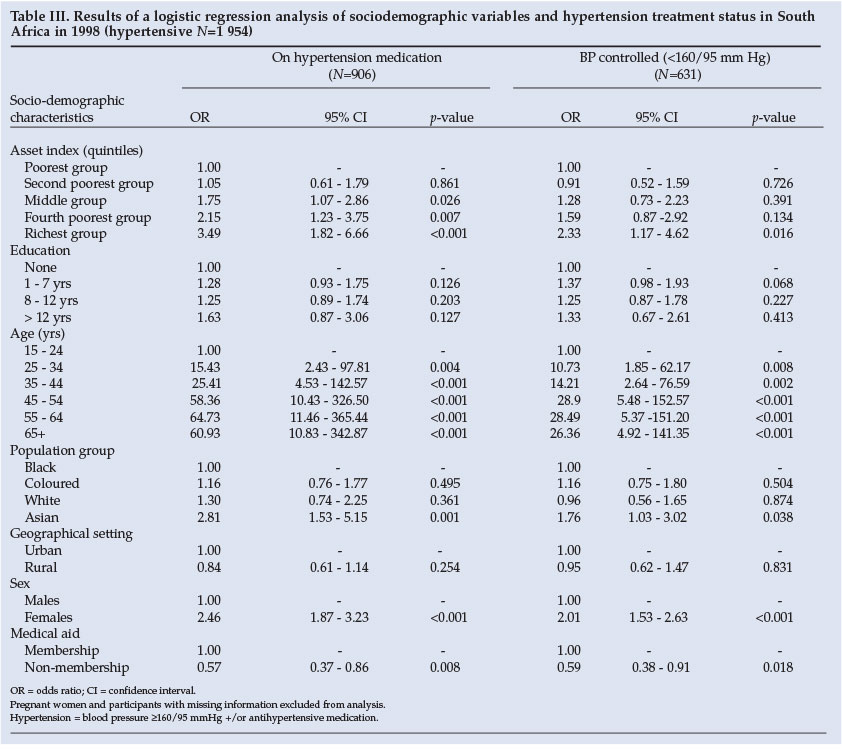
Table III assesses the relationship between socio-demographic variables and treatment status among people with hypertension (cut-off point 160/95 mmHg and/or on anti-hypertension medication). The use of medication and control of hypertension increased with increasing wealth. Higher levels of education did not improve treatment status to a greater extent than being wealthier. Older participants were more likely to use medication and to have a controlled BP. Participants with hypertension above age 45 were about 28 times more likely to have controlled BP than those aged 15 - 25. Women had significantly better controlled hypertension and took more medication than men.
Asians were more likely to use medication and have higher levels of control of hypertension than blacks. There were no differences in treatment status among the black, white and coloured participants with hypertension.
Discussion
This study identifies, for the first time, in a nationally representative sample of South Africans with hypertension, groups at highest risk of having hypertension and with the poorest level of BP control. Such data can support targeting those who could benefit most from diagnosis and effective treatment, and serve as baseline observations in the distribution of the determinants of hypertension in South Africans, as the National Department of Health plans to repeat the national Demographic and Health Survey every 5 years.
The data show that observed differences in the prevalence of hypertension9-11 are not ethnically based and can be accounted for by other socio-demographic parameter differences. Rural blacks had a significantly lower risk of hypertension than urban black, coloured and white participants, suggesting a clear urban-rural difference, but no inherent differences among the population groups regarding the risk of developing hypertension. The influence of urbanisation, leading to the emergence of hypertension in the black group independently of the other socio-demographic and risk factors, is reflected. A traditional rural black African lifestyle disappears rapidly with urbanisation. Studies in Kenya of rural men migrating to the cities suggested factors associated with developing hypertension.12,13 Hypertension was associated with consuming excess salt, more stress and less physical activity in urban men.
Analyses showed that the urban-rural differences among blacks were pronounced among women, with OR 1.65 (95% CI 1.34, 20.3) compared with OR 1.16 (95% CI 0.90, 1.51) for men (data not shown). A rural environment appears to protect black women from having hypertension more than black men.
This is in keeping with the fact that historically rural black men have been more exposed to urbanisation influences through the migrant labour system that contracted them to work predominantly in the mines, while restricting women to rural areas by law.
Underlying factors that contributed to the higher prevalence of hypertension among persons of black African descent compared with whites in the USA were studied.14 The high prevalence of hypertension and the steeper slope of BP increases with age among US blacks are unlikely to be attributed to genetic factors; environmental factors probably play a much larger role than had previously been assumed. Although Jamaican and US blacks derived approximately 75% of their ancestry from populations similar to the Nigerians,15 the prevalence of hypertension in blacks was 16% in West Africa, 26% in the Caribbean, and 33% in the USA.14 Differences in the prevalence of hypertension could be ascribed, at least in part, to obesity, high sodium/low potassium intake, psychosocial stress, physical inactivity, and excessive alcohol use.
US data suggest that obesity has a less noxious effect in African-American women than in white American women.16,17 Obese African-American women were found to have a lower prevalence of cerebrovascular disease risk factors and lower mortality than white women.18 Obesity has fewer health disadvantages in black women than in white women, although obesity seems to have little influence on their proneness to hypertension, coronary heart disease and breast cancer.19 Our data show that there are no significant differences between the risk of hypertension in obese black African and other obese women compared with the respective normal BMI groups of women.
Table III identifies groups with poor treatment and control profiles. The finding that young people with hypertension have poor hypertension control is of particular concern as prolonged exposure to high BP can result in serious damage to the eyes, kidneys, and coronary and cerebral arteries. Hypertension was far less well controlled in men than in women, suggesting that young, poverty-stricken men irrespective of their population group have the lowest degree of control.
Participants receiving their treatment in the private sector and having medical aid insurance were no more aware of their condition than those without medical aid. However, medical aid participants took medication significantly more frequently and had significantly better BP control. Participants with hypertension receiving treatment in the private sector and having insurance to cover costs do better than those who receive care elsewhere. Inadequate hypertension care for people attending public health services is probably due in part to failure of service provision rather than non-compliance to treatment.
These findings can assess the performance of the health care services in diagnosing and treating people with hypertension and form part of adult health indicators for an ongoing health surveillance system for South Africa, as suggested previously.20 They can also can be used to monitor the impact of policy changes aimed at improving hypertension care when the National Department of Health repeats the SADHS. Repeated surveys of this nature will enable the monitoring of intervention programmes to manage risk factors for hypertension in South Africa.
We acknowledge with thanks the South African National Department of Health as the initiator and main fund provider, the Medical Research Council as co-ordinator and fund provider, the Centre for Health Systems Research and Development and their teams for the fieldwork, OrcMacro International for technical assistance and USAID for additional funding. Each provincial Department of Health provided a provincial co-ordinator to assist the Human Sciences Research Council in monitoring the fieldwork quality. Statistics South Africa provided the sampling frame and sample details. Ms J Fourie provided editorial and technical assistance.
References
1. Steyn K, Gaziano TA, Bradshaw D, Laubscher R, Fourie JM. Hypertension in South African adults: results from the Demographic and Health Survey, 1998. J Hypertens 2001; 19: 1717-1725. [ Links ]
2. Ahmad OB, Boschi-Pinto C, Lopez AD, Murray CJL, Lozano R, Inoue M. Age Standardization of Rates: A New WHO Standard (GPE Discussion Paper Series No. 31). Geneva: EIP/GPE/ EBD WHO. s.a. http://www.who.int/healthinfo/paper31.pdf (last accessed 12 February 2008). [ Links ]
3. O'Brien E. Automated blood pressure measurement: state of the market in 1998 and the need for an international validation protocol for blood pressure measuring devices. Blood Press Monit 1998; 3: 205-211. [ Links ]
4. Report of the Census Evaluation Task Team of the Statistics Council on the Final Post-Enumeration Survey adjusted Count of the 1996 Population Census. http://www.statssa.gov.za/default2.asp (last accessed 27 November 2002). [ Links ]
5. Booysen FleR. Using demographic and health surveys to measure poverty - an application to South Africa. Journal for Studies in Economics and Econometrics 2002; 26: 53-70. [ Links ]
6. Erwing JA. Detecting alcoholism: the CAGE questionnaire. JAMA 1984; 252: 1905. [ Links ]
7. World Health Organisation Collaborating Centre for Drug Statistics Methodology. Anatomical Terapeutic Chemical Classification (ATC) Index with Defined Daily Doses (DDDs). Oslo, Norway: WHO Collaborating Centre for Drug Statistics Methodology, 1998. [ Links ]
8. Puoane TR, Steyn K, Bradshaw D, et al. Obesity in South Africa: the South African demographic and health survey. Obes Res 2002; 10: 1038-1048. [ Links ]
9. Steyn K, Jooste PL, Fourie JM, Parry CDH, Rossouw JE. Hypertension in the coloured population of the Cape Peninsula. S Afr Med J 1986; 69: 165-169. [ Links ]
10. Rossouw JE, Du Plessis JP, Benadé AJ, et al. Coronary risk factor screening in three rural communities. The CORIS baseline study. S Afr Med J 1983; 64: 430-436. [ Links ]
11. Steyn K, Fourie JM, Lombard CJ, Katzenellenbogen J, Bourne LT, Jooste PL. Hypertension in the black community of the Cape Peninsula. The BRISK study. East Afr Med J 1996; 73:756-760. [ Links ]
12. Poulter N, Khaw KT, Hopwood BE, et al. Blood pressure and its correlates in an African tribe in urban and rural environments. J Epidemiol Commun Health 1984; 38: 181-185. [ Links ]
13. Poulter N, Khaw KT, Hopwood BE, et al. The Kenyan Luo migration study: observations on the initiation of a rise in blood pressure. BMJ 1990; 300: 967-972. [ Links ]
14. Cooper R, Rotimi C, Ataman S, et al. The prevalence of hypertension in seven populations of West African origin. Am J Public Health 1997; 87: 160-168. [ Links ]
15. Rotimi C, Puras A, Cooper R, et al. Polymorphisms of the genes in the renin-angiotension system among Nigerians, Jamaican and African Americans. Hypertension 1996; 27: 558-563. [ Links ]
16. Stevens J, Truesdale KP. Epidemiology and consequences of obesity. J Gastrointest Surg 2003; 7: 438-442. [ Links ]
17. Sanchez AM, Reed DR, Price RA. Reduced mortality associated with body mass index (BMI) in African Americans relative to Caucasians. Ethn Dis 2000; 10: 24-30. [ Links ]
18. Johnson JL, Heineman EF, Heiss G, Hames CG, Tyroler HA. Cardiovascular disease risk factors and mortality among black women and white women aged 40-64 years in Evans County, Georgia. Am J Epidemiol 1986; 123: 209-220. [ Links ]
19. Walker AR, Adam F, Walker BF. World pandemic of obesity: the situation in Southern African populations. Public Health 2001; 115: 368-372. [ Links ]
20. Steyn K, Bradshaw D. Non-communicable disease surveillance in developing countries. Editorial. Scand J Public Health 2001; 29: 161-165. [ Links ]
 Correspondence:
K Steyn
(krisela.steyn@mrc.ac.za/krisela.steyn@gmail.com)
Accepted 24 August 2007.

