


Serviços Personalizados
Artigo
 Inglês (pdf)
 Artigo em XML
 Referências do artigo
Indicadores

Links relacionados
-
 Citado por Google
 -
 Similares em Google
Compartilhar

 Permalink
South African Journal of Education
versão On-line ISSN 2076-3433
versão impressa ISSN 0256-0100
S. Afr. j. educ. vol.41 no.3 Pretoria Ago. 2021
http://dx.doi.org/10.15700/saje.v41n3a1765
ARTICLES
Evaluating the alignment between the Grade 9 mathematics Annual National Assessment and the TIMSS test items
Zwelithini Bongani Dhlamini
Department of Mathematics Science and Technology Education, School of Education, University of Limpopo, Sovenga, South Africa. zwelithini.dhlamini@ul.ac.za
ABSTRACT
In the study reported on here I evaluated the alignment between the Annual National Assessment (ANA) and Trends in International Mathematics and Science Study (TIMSS). Theoretical perspectives were drawn from the Survey Enacted Curriculum (SEC), while quantitative correlational methods were used to determine the alignment between ANA and TIMSS using 2 variables in the assessments, topics and cognitive levels. The research design was the correlational prediction design. The evaluation revealed that the Porter's alignment index between ANA and TIMSS was 0.657 in 2012, 0.728 in 2013 and 0.681 in 2014. Statistically, this was significantly low at the Alpha level of 0.05, in accordance with Fulmer's critical values at 20, 60 and 120 standard points. The low statistical significance of the alignment indices justifies discrepancies in topics and cognitive levels for ANA and TIMSS, justifying misalignment in what was tested in the two assessments. It is recommended that alignment studies be sanctioned frequently by the ANA developers as one of many measures to gauge the performance of the curriculum both in a national and international context.
Keywords: alignment index; cognitive levels; mean deviation; misalignment; systemic assessment; topics
Introduction
Alignment in education refers to the degree to which the curriculum objectives and topics found in instructional materials (learning guides, textbooks and assessments) are in alignment with the intentions of an educational system (Porter, 2002; Webb, 2007). The process of alignment is designed to address challenges relating to a misaligned educational system (Webb, 1997). Specifically, it focuses on how the different educational components relate to one another, either vertically or horizontally (Martone & Sireci, 2009). Vertical alignment matches curriculum objectives with instructional materials, while horizontal alignment matches instructional materials (Shelton & Brown, 2008). In most cases, alignment is performed vertically, which conflates its meaning. Assessments are configured by using curriculum objectives and assessing learners' mastery of topics against standards, referred to as cognitive levels (Porter, 2002).
There is a paucity of studies on horizontal alignment. A study on horizontal alignment by Shelton and Brown (2008), which evaluated alignment between a high school mathematics test and a college placement test, found that the two tests were misaligned. Such misalignment made it difficult for teachers to fully prepare learners for college. A study on vertical alignment by Ndlovu and Mji (2012) investigated alignment between the 2003 TIMSS and the Revised National Curriculum Statement (RNCS). The results signalled misalignment between the TIMSS and the RNCS, which was the likely cause for the low performance in TIMSS by South African learners. The study also revealed that this misalignment had the potential to affect the configuration of other assessments, such as the Grades 1 to 6 and Grade 9 ANA.
ANA was introduced for the purpose of evaluating how effectively the Curriculum and Assessment Policy Statement (CAPS) was being applied in South Africa (Bansilal, 2012). However, the Department of Basic Education (DBE) used the data emanating from the ANA testing process to name and shame underperforming schools (Kanjee & Moloi, 2016). This led to teacher unions rejecting ANA testing after 2014 (Bansilal, 2017). As a result, the challenges that teachers face in working with the curricula currently in use are likely to affect the quality of what is being taught (Porter, 2002). At present a new form of national assessment, as prescribed by the National Integrated Assessment Framework (NIAF) (DBE, Republic of South Africa [RSA], 2016), which is intended to replace the ANA is being developed. Studies like this one on the alignment of the previous (ANA) are crucial in the provision of data that will assist test developers of the new national assessment to consider aspects that were problematic.
In parallel to the ANA testing, South Africa's participation in TIMSS was premised on gauging how effective the CAPS was compared to other international curricula (DBE, RSA, 2011). However, the TIMSS testing has been conflated to the rating of participating countries (Long & Wendt, 2017). The TIMSS response items are configured with reference to the curricula of the participating countries (Mullis, Martin, Ruddock, O'Sullivan & Preuschoff, 2009). While ANA uses topics and cognitive levels set out in the CAPS (DBE, RSA, 2011), the benchmarking of TIMSS and ANA is essential as it informs how the topics tested at national level falls short of those of the international context (Ndlovu & Mji, 2012). When the weaker areas are addressed, it has the potential of assisting global competitiveness of South African learners. Furthermore, data from this study may help to inform the configuration of national systemic testing that is proposed by the NIAF. This may go a long way in ensuring that challenges associated with the difficult content tested by ANA are minimised in the new national assessments.
The purpose of this study was to evaluate the alignment between ANA and TIMSS. One research question was formulated: How do the topics and cognitive levels tested by ANA and TIMSS, respectively, relate to one another?
Literature Review
In 2012, ANA was introduced to gauge curricula performance through the assessment process. However, the process was disrupted owing to the misuse of data by the DBE (Bansilal, 2017; Graven & Venkat, 2014). Surprisingly, in the wake of poor performance in ANA, especially in Grade 9 mathematics, the DBE used the results to label and shame poorly performing schools, districts and provinces. This resulted in teacher unions rejecting ANA (Bansilal, 2017; Spaull, 2016). My experience with the DBE, especially in teacher training, confirms such conduct on the part of the DBE, despite the purpose of ANA being clearly articulated in policy documents. The purpose of systemic assessments, in which ANA is not an exception, has widely been reported in literature.
Firstly, ANA was envisaged to provide big chunks of data on learner performance in the education system (Graven & Venkat, 2014). To achieve this, it is the norm for ANA to deliver valuable data on the performance of the system (Pournara, Mpofu & Sanders, 2015). This large scale assessment, ANA, certainly produced qualitative data which was analysed to yield quantitative data (Kanjee & Moloi, 2016). However, much attention was focused on aggregated scores of schools, districts and provinces (DBE, RSA, 2011). Such a situation conflated ANA to a tool that named and shamed underperformance in these levels of the system (Bansilal, 2017).
Secondly, national systemic testing serves as strategic indicators that gauge the effectiveness of education policies, including the curriculum (Graven & Venkat, 2014). In South Africa, the tests are administered at specific Grades, namely Grades 3, 6 and 9 (DBE, RSA, 2011), which conforms to global trends of systemic testing (Ferrini-Mundy & Schmidt, 2005). Hence, systemic testing in these areas suggests either success or failure of the implementation of the curriculum (Bansilal, 2017). There is dearth of literature on how the DBE utilised the information gathered during ANA testing to effect corrective measures in the implementation of education policies.
Thirdly, another important issue is the quality of teaching and learning (Kanjee & Moloi, 2016). The expectation is that national systemic testing provides pointers on quality in classrooms (Graven & Venkat, 2014). If the quality of the indicators, ANA, is questionable, then, reliability and validity concerns exist (Bansilal, 2017). Likewise, Graven and Venkat (2014) report issues of disaggregation in the ANA testing. The disaggregation has focused on issues of affluent and impoverished schools and provinces. There was limited disaggregation on the ANA in terms of the quality of mathematics topics and cognitive levels, although, studies have indicated a mismatch in these two components (Bansilal, 2017; Pournara et al., 2015). Also, evidence on how the DBE dealt with these issues is still not documented in literature.
Clearly, the misuse of ANA results was in breach of their intended purpose, which saw an important and influential national assessment system being used as a means to judge performance rather than gauge quality in the interests of ongoing educational development. After extensive consultative processes with educators and other stakeholders in various platforms, it was decided that national systemic testing that replaces ANA would resume in a timeous manner (DBE, RSA, 2016).
Few studies have investigated the quality of ANA as an instrument for monitoring the effectiveness of the education system in South Africa. If well-structured and if the results are used as intended, major assessment systems such as ANA will greatly influence the standard of mathematics taught in schools (Kanjee & Moloi, 2014). Research (Bansilal, 2017; Ferrer-Esteban, 2016; Ferrini-Mundy & Schmidt, 2005) has shown that teachers have a tendency to teach towards a national assessment at the expense of discursive mathematical knowledge.
Surprisingly, there have been few empirical studies on systemic assessments (Dhlamini, Chuene, Masha & Kibirige, 2019; Long & Wendt, 2017). Likewise, ANA has not been the subject of much research. In a study by Bansilal (2017), which compared ANA and the Grade 9 internal assessment, ANA proved to be difficult for the cohort of Grade 9 learners when tested in 2012, 2013 and 2014, respectively. A study by Graven, Venkat, Westaway and Tshesane (2013), in turn, indicated that in the Foundation and Intermediate Phases, ANA lacked mental mathematics which is a critical component for learners' ability of grasping algorithms and algebraic reasoning. Such a discrepancy in ANA content has a negative impact on the quality of mathematics teaching and learning. Furthermore, an analytical study by Pournara et al. (2015) found that ANA tests in the 3 consecutive years of 2012, 2013 and 2014 conveyed quite different content messages and lacked consistency in the cognitive demands they placed on learners.
All these observed challenges relating to the quality of ANA are likely to raise concerns about its reliability, which is one of the principal goals to which a national assessment must aspire. Accordingly, there is a need to conduct alignment studies to verify whether ANA conveys the same content message when benchmarked against other systemic assessments, such as TIMSS. This will positively inform the performance of CAPS in the local and international context (Ndlovu & Mji, 2012).
One of many approaches used in benchmarking a national assessment is aligning it to other established systemic assessments, such as TDMSS. According to Webb (2007), alignment means that there is coherence or an agreement between curriculum objectives and assessments. Such an agreement can emanate both from cognitively easy or complex statements of intent and the manner in which learners are tested in assessments (Porter, 2002). Parallel to this is the need to take into account the alignment of what is assessed in order to ensure that educational outcomes are properly tested (Polikoff, Porter & Smithson, 2011).
People will inevitably assume that perfectly aligned assessments will lead to strong achievements (Porter, Smithson, Blank & Zeidner, 2007). Another view is that a single assessment may not be perceived to be aligned to a curriculum since it is part of a collection of assessments, each serving its own purpose (Webb, 1997). This notion does not, however, obviate the need for alignment because a system must account for learners' ability to meet core knowledge standards and expectations in all discourses (Fulmer, 2011). Hence, conducting alignment studies on ANA is justified.
Systemic assessments such as TIMSS provide well-documented evidence of alignment of some sort (Mullis et al., 2009). For example, the 2011 TIMSS used item analysis (difficulty index) as a way of ensuring that the test was aligned to the educational outcomes of the participating countries (Mullis et al., 2009). According to Webb (1997), item difficulty is a way of aligning content standards that are linked to objectives and assessments. Martone and Sireci (2009), in turn, assert that alignment has to be achieved through systemic assessments (both national and international) to ensure the necessary content quality in the education system(s). Surprisingly, it has been noted that ANA was conducted for the 3 consecutive years of 2012, 2013 and 2014 in the absence of any form of alignment. To this day, its quality as an evaluative instrument remains uncertain. This makes the idea of a study on the alignment between ANA and TIMSS all the more compelling.
Some noteworthy studies have been conducted that have calculated the alignment between curriculum objectives and assessments in the United States of America (USA) and South Africa. A few of these studies are considered below.
In a study on the extent of alignment between state standards and assessments, Polikoff et al. (2011) found a misalignment between the coverage of the topics and the way in which they were assessed in the USA. In a study on the evident alignment between the RNCS and TIMSS, Ndlovu and Mji (2012) report poor alignment, which reflect badly on international benchmarking in South Africa. They used descriptive statistics and the Porter's alignment index to identify discrepancies in specific cells of content and cognitive levels between the RNCS and TIMSS. The majority of alignment studies (Martone & Sireci, 2009, Polikoff et al., 2011; Porter et al., 2007) have focused on the alignment between the curriculum and one system of assessment. However, there have been few studies on the alignment between two different assessments. It is within this context that I examined the alignment between ANA and TIMSS.
The configuration of topics in the Grade 9 mathematics ANA should ideally be guided by the Subject Assessment Guideline for mathematics (SAGM) (Senior Phase): i.e. patterns, functions and algebra (35% coverage); numbers, operations and relations (15%); geometry (30%), measurement (10%); and data handling (10%) (DBE, RSA, 2011). Correspondingly, the 2011 Grade 8 TIMSS test items were configured using the 2011 Grade 8 mathematics TIMSS assessment framework as follows: numbers (30%); algebra (30%); geometry (20%); and data and chance (20%), (Mullis et al., 2009).
In contrast, the cognitive levels for ANA were configured according to the SAGM as follows: knowledge (25%), routine procedures (45%), complex procedures (20%), and problem-solving (10%), (DBE, RSA, 2011). However, Berger, Bowie and Nyaumwe (2010) advise that the SAGM requires urgent attention as it conflates mathematical reasoning. Surprisingly, the DBE has not addressed these concerns to date and as a result, teachers lack the pedagogical knowledge required to assess required cognitive levels (Chirinda & Barmby, 2018).
Congruently, the cognitive levels of the 2011 Grade 8 TIMSS test items were configured using the 2011 Grade 8 TIMSS assessment framework, i.e. knowing (35%), applying (40%) and reasoning (25%), (Dhlamini, 2018; Mullis et al., 2009). In my study, the focus was on the alignment index and the discrepancies in the respective cells of content and cognitive levels. The actual percentages in terms of coverage of topics and cognitive levels were not the focus of the study.
Theoretical Framework
The theoretical perspectives of this study were drawn from the SEC (Porter, 2002), which focuses on how well topics and cognitive levels match corresponding matrices of objectives and assessments.
Firstly, topics serve as an important determinant of what must be learned and how it is taught (Porter, 2002). Teachers are arbiters of what and how they teach (Martone & Sireci, 2009) and most often they use assessments to gauge how learners have achieved the learning objectives. According to different assertions, teachers teach what they know, teach what is in prescribed books or teach what is tested (Webb, 1997).
Secondly, cognitive levels are used to determine standards and to ascertain whether statements of intent in the curriculum are aligned to teaching and assessments (Porter et al., 2007). For example, when learners take a course in statistics, the question is often posed: Is statistics the focus of teaching and assessment? And if so, what kind of statistics is learned and tested? (Porter, 2002). In this study, the SEC is used to evaluate horizontal alignment between ANA and TIMSS. The topics and cognitive levels of these assessments are matched to evaluate the strength of the alignment. Thus, the SEC was deemed a suitable lens through which to explain standards in ANA.
Methodology and Research Design
The quantitative correlational methodology was used to evaluate the alignment between ANA and TIMSS. In this method, the co-variance of two or more variables is assessed without effecting treatment (Creswell, 2014). In my study the correlational prediction design (Creswell, 2014) was employed to do the following: 1) co-variance, the predictor variables, which were the topics and cognitive levels, tested in the corresponding assessments, ANA and TIMSS, to; 2) predict the outcome, the strength of alignment of ANA and TIMSS.
The Grade 9 mathematics ANA in 2012 (n = 59), 2013 (n = 62) and 2014 (n = 61) and the Grade 8 mathematics TIMSS response items (n = 90) were purposively sampled (Creswell, 2014), due to access provided by the DBE. These question papers were available on the internet and were accessed from there. Matrices were generated using topics and cognitive levels in ANA and TIMSS (Porter, 2002).
In my study topics were drawn from the SAGM and 2011 TIMSS mathematics framework as follows: numbers and operations; algebra and functions; geometry and measurement; and data handling and probability (DBE, RSA, 2011; Mullis et al., 2009).
Correspondingly, cognitive levels were adapted from the 2011 TIMSS and the SAGM as follows: 1) knowing facts and procedures, knowledge of mathematical facts, formulae and algorithms; 2) using concepts, using various mathematical ideas in a single solution strategy; 3) routine problem-solving, computing non-routine problems, which requires extrapolating mathematics from contexts, analysing the problem by splitting it into manageable parts to reach the required solution; and 4) complex problems and reasoning, multi-step problems that require justifications. These are solution strategies that are abstract and unfamiliar to learners, requiring logical thought, justification and reflection (DBE, RSA, 2011; Mullis et al., 2009).
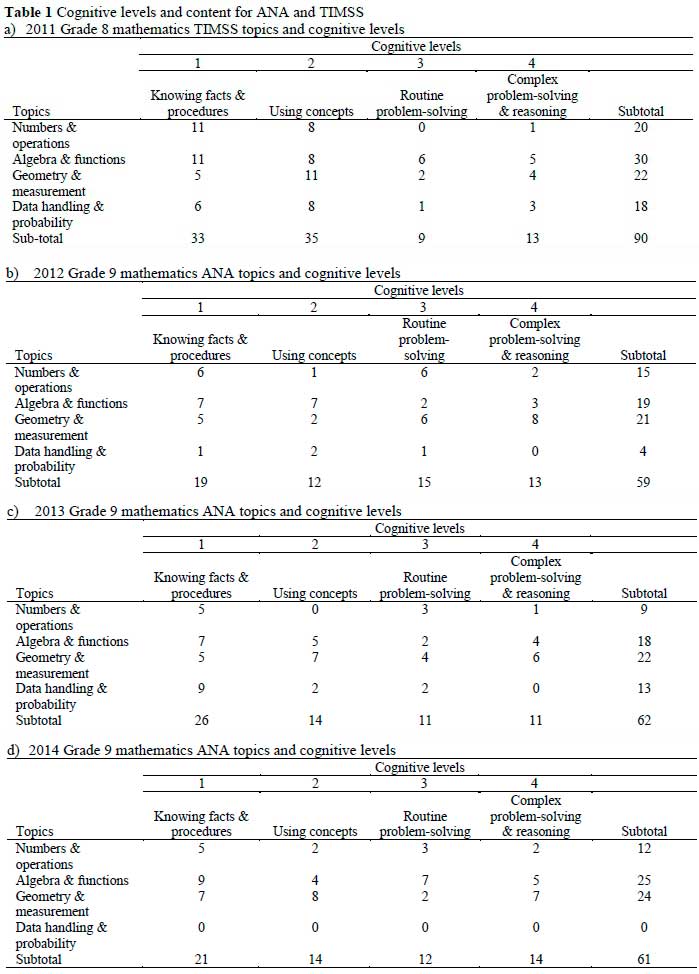
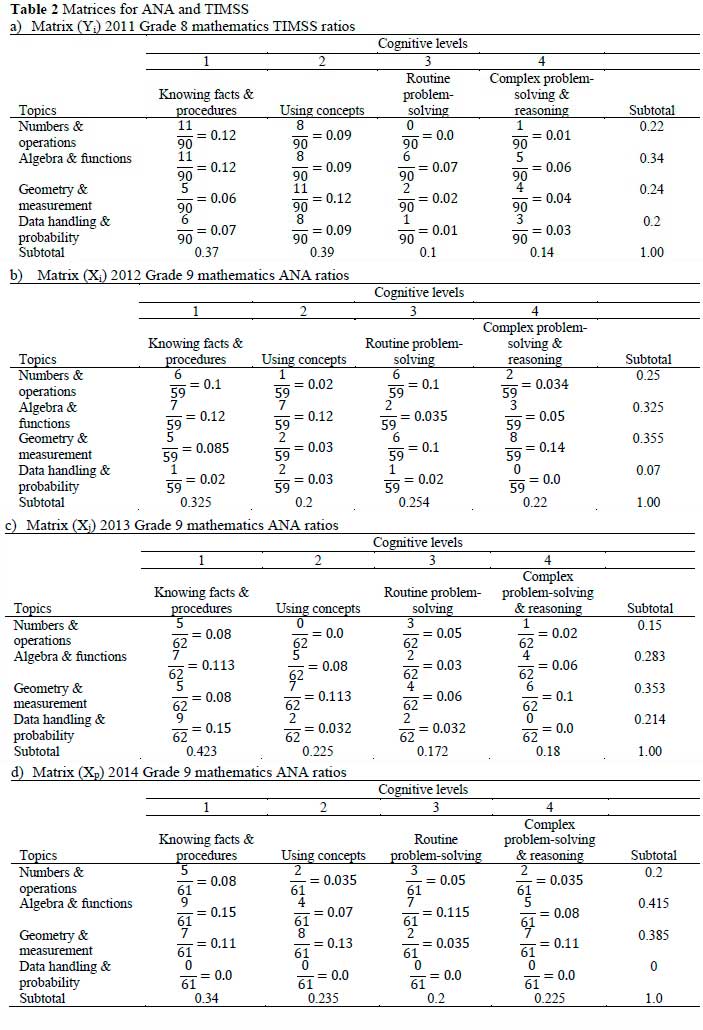
Using the corresponding matrices, a panel of three reviewers (three lecturers in mathematics education) mapped the topics and cognitive levels of the two assessments (ANA and TIMSS) to record matches, using hits in the cells (see Table 1 a, b, c and d). The interrater reliability was 0.96, which was acceptable and scientifically sound when considering that the statistical significance of the alignment indices was computed (McHugh, 2012). In addition, ratios were generated from the frequencies. In calculating the Porter's alignment index, the formula IMAGEMAQUI was used by first generating quotients from the frequencies in the matrices (see Table 2 a, b, c and d). In order to explain the alignment procedure, X1and Y1are corresponding matrices. The Porter's alignment index ranges from 0 to 1, where the range 0 to 0.5 depicts no alignment to moderate alignment, and the range 0.51 to 1.0 depicts moderate to perfect alignment (Porter, 2002). Subsequently, quantitative descriptive statistics, means and mean deviations were generated to explain discrepancies in all the cells of content and cognitive levels.
Results
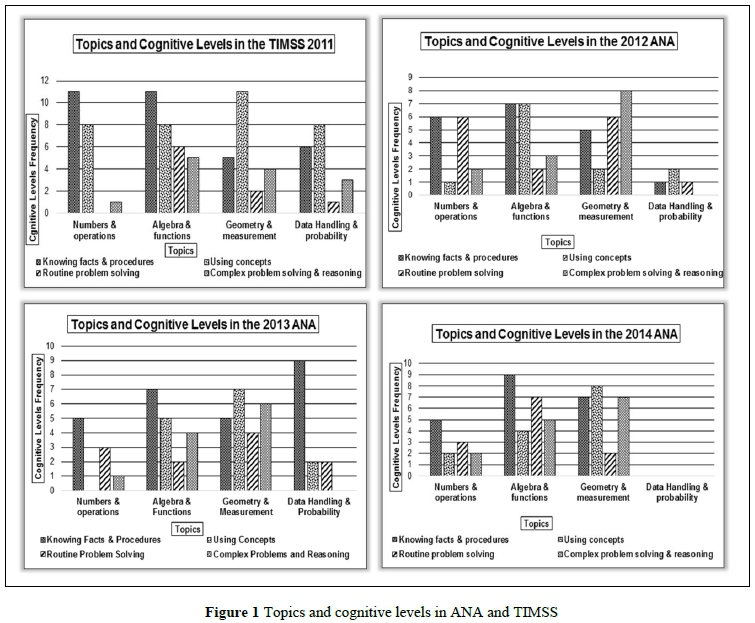
Figure 1 provides a synopsis of frequencies for topics and cognitive levels for the Grade 9 mathematics ANA in 2012, 2013 and 2014 and the Grade 8 mathematics TIMSS in 2011.
Firstly, the 2012 ANA testing of the topics numbers and operations, algebra and functions was biased towards knowing facts and procedures, as well as routine problem-solving. Subsequently, for the topics geometry and measurement, and data handling and probability, testing was biased towards complex problem-solving and reasoning and using concepts, respectively.
Secondly, the 2013 ANA testing of the topics numbers and operations, algebra and functions, and data handling and probability was biased towards knowing facts and procedures. However, the ANA testing of geometry and measurement content was biased towards using concepts.
Thirdly, the 2014 ANA testing of the topics numbers and operations, algebra and functions, and geometry and measurement was biased towards knowing facts and procedures. In contrast, ANA testing of the topics data handling and probability was not done in 2014.
Fourthly, the 2011 TIMSS testing of the topics numbers and operations, and algebra and functions was biased towards knowing facts and procedures. On the other hand, the ANA testing of geometry and measurement, and data handling and probability was biased towards using concepts.
Therefore, in the 3 consecutive years of ANA testing, the testing of the cognitive levels was not consistent. A comparison of ANA testing in the 3 consecutive years shows that the testing of topics and cognitive levels was irregular.
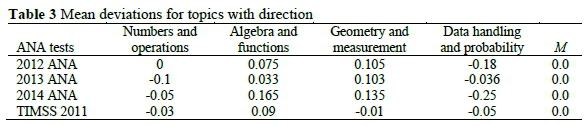
The data in Table 3 constitutes mean deviations derived from the means of the frequencies in Tables 2 a, b, c and d. The directions (positive and negative) posit the extent to which topics were preferred by ANA testing in 2012, 2013 and 2014 and by the 2011 Grade 8 mathematics TIMSS.
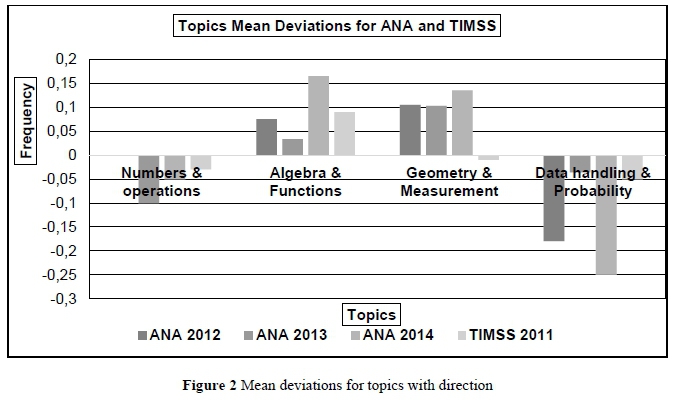
The data in Figure 2 is a synopsis of topics' mean deviations generated from the data in Table 1. The positive mean deviations (upward direction) depict topics that were most preferred by ANA and TIMSS testing. The negative mean deviations (downward direction) show topics that were less often preferred by ANA and TIMSS testing. In the 2012, 2013 and 2014 ANA, the topics algebra and functions, and geometry and measurement were most preferred. However, there was irregular testing in the 3 consecutive years. Notably, the three ANA tests in the 3 years did not prefer numbers and operations, and data handling and probability. Correspondingly, in the 2011 TIMSS testing, only algebra and functions was most preferred at the expense of numbers and operations, geometry and measurement, and data handling and probability.
This data (Figure 2) substantially supplements the data on the frequencies and clearly show which topics that were most preferred and less preferred during ANA testing in the 3 consecutive years and in the 2011 Grade 8 mathematics TIMSS.
The data in Table 4 show the mean deviations derived from the means of the frequencies in Tables 2 a, b, c and d. The directions (positive and negative) posit cognitive levels that were either most preferred or less preferred by ANA testing in 2012, 2013 and 2014 and in the 2011 Grade 8 mathematics TIMSS.
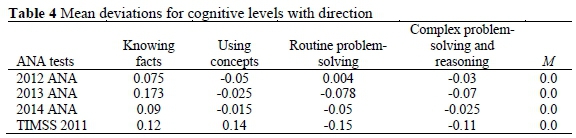
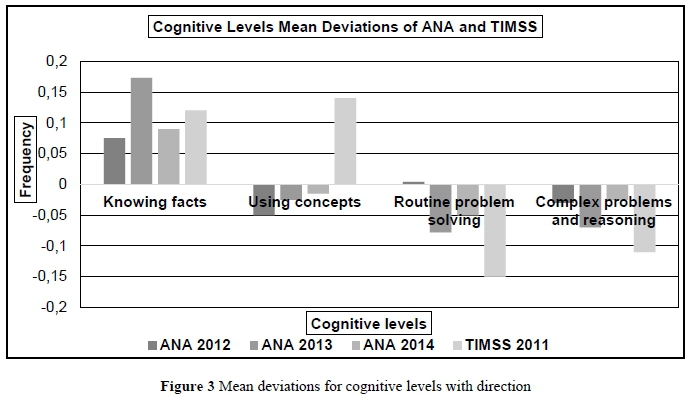
The data in Figure 3 illustrate the cognitive levels' mean deviations generated from the data in Table 2. The positive mean deviations (upward direction) depict cognitive levels that were most preferred by ANA and TIMSS testing. The negative mean deviations (downward direction) posit cognitive levels that were less preferred by ANA and TIMSS testing. In 2012, ANA testing preferred knowing facts, and routine problem-solving and not using concepts and complex problems and reasoning. In contrast, the 2012 ANA testing showed the less preferred topics of using concepts, and complex problem-solving and reasoning. In 2013 and 2014, ANA testing mostly preferred knowing facts at the expense of the other three cognitive levels. The 2011 Grade 8 TIMSS testing preferred mostly knowing facts and using concepts at the expense of routine problem-solving and complex problems and reasoning.
Figure 4 provides a synopsis of the alignment index for the 2012, 2013 and 2014 ANA and the 2011 TIMSS. The data were generated from Tables 2 a, b, c and d, the quotients for calculating the Porter's alignment index. As such, the Porter's alignment index for the 2012 Grade 9 mathematics ANA and the 2011 Grade 8 mathematics TIMSS was 0.657 (65.7%), for the 2013 Grade 9 mathematics ANA and the 2011 Grade 8 mathematics TIMSS 0.728 (72.8%), and for the 2014 Grade 9 mathematics ANA and the 2011 Grade 8 mathematics TIMSS 0.681 (68.1%).
The Porter's alignment index suggests an overall moderate to perfect alignment. Further analysis of the cells provided evidence of potential sources of misalignment. The levels of misalignment were as follows: in 2012, it was 34.3%; in 2013, 27.2% and in 2014 31.9%. In addition, the mean deviations (Figures 2 and 3) posit topics and cognitive levels that were preferred by ANA and TIMSS. Viewed together, these sets of data suggest that there is some misalignment between ANA and TIMSS.
The computation of the Porter's alignment index in this study used matrices of topics and cognitive levels. The cells for the topics in the ANA and TIMSS had varying subtopics and to manage the process, the cells were collapsed to form four by four matrices. Fulmer (2011) asserts that the Porter's alignment index relies on the size of the tables used in the computations. By collapsing the cells in this study, the alignment indices varied. Taken at an alpha level of 0.05, the evaluated Porters' alignment indices of 0.657, 0.728 and 0.681 were significantly lower than the Fulmer's critical values at standard points of 20, 60 and 120. In the study by Ndlovu and Mji (2012), the computed Porter's alignment index of 0.751 for the RNCS and TIMSS was found to be statistically significantly low in accordance with the Fulmer's critical values at standard points of 20, 60 and 120.
Discussion
The data in Figure 2 show the topics that were preferred in the ANA and TIMSS testing. On one hand, the testing in ANA preferred algebra and functions, and geometry and measurement. These results confirm that the ANA configuration was consistent with the SAGM (DBE, RSA, 2011). On the other hand, ANA testing did not prefer numbers and operations and data handling, again showing consistency with the SAGM. This is contrary to the assertion by Spaull (2016) that in lower grades, numeracy is key to success in advanced mathematics. Surprisingly, ANA did not test probability, which is a topic that is prescribed in the curriculum for the Senior Phase (DBE, RSA, 2011).
Parallel to the inferences above, the 2011 Grade 8 mathematics TIMSS testing preferred mostly algebra and functions at the expense of numbers and operations, geometry, and data handling and probability. These results seem to be consistent with the ANA testing in all topics, except for geometry and measurement. Such a discrepancy between ANA and TIMSS could be due to the latter being an international systemic assessment which consolidates topics from participating countries (Mullis et al., 2009). Surprisingly, by not favouring numbers and operations, the 2011 Grade 8 mathematics TIMSS contradicted its own assessment framework (Mullis et al., 2009). On a different note, the preference for geometry and measurement in ANA explains the misalignment of ANA and TIMSS in their testing of this topic.
For cognitive levels, the data in the matrices of frequencies and in the mean deviations indicates that for ANA, numbers and operations, and algebra and functions were inclined towards knowing facts, except for geometry and measurement, and data handling and probability. The implication is that during the configuration of ANA, the examiners prioritised procedures, which is in agreement with the SAGM (DBE, RSA, 2011). As a consequence, learners' participation in ANA is most likely characterised by facts and procedures, at the expense of the ability to use concepts (Pournara et al., 2015). This has a negative impact on the structure of ANA and its role in gauging the performance of curricula in South Africa (Kanjee & Moloi, 2016). If results from an evaluative assessment such as ANA are indicative, it is imperative to restructure the SAGM (Bansilal, 2017; Berger et al., 2010).
In contrast, the data in Figure 3 illustrate that geometry and measurement were prejudiced towards using concepts in the 3 consecutive years of ANA testing. Such consistency justifies the reliability of ANA only in geometry and measurement (Pournara et al., 2015). Parallel to this, the data in Figure 1 clarifies that cognitive levels in data handling were inconsistent during ANA testing in the 3 consecutive years, i.e. they were biased towards testing using concepts and preferred knowing facts and procedures. Too much focus by ANA on procedures could have been caused by a configuration that conformed to the SAGM (DBE, RSA, 2011). Consequently, this inconsistency in ANA testing posed challenges in terms of the reliability of ANA to gauge the performance of curricula in South Africa, especially the topic of data handling, which was not tested in 2014 (Pournara et al., 2015).
Correspondingly, the 2011 Grade 8 mathematics TIMSS preferred knowing concepts in two topics: numbers and operations, and algebra and functions. In addition, the testing preferred using concepts in geometry and measurement, and data handling and probability. Subsequently, the data in the descriptive statistics confirmed these results by positive mean deviations in knowing facts and using concepts. This discrepancy in the 2011 TIMSS test items was consistent with its own assessment framework (Mullis et al., 2009). As a result, participation in TIMSS suggests that learners must not be limited in knowledge of procedures (Porter, 2002). Learners need to be fluent in using concepts (Mullis et al., 2009).
The data in Figure 4 indicate that the Porter's alignment was in the range of moderate to perfect (Porter, 2002). This data are supplemented by the descriptive statistics which show discrepancies in topics and cognitive levels, hence justifying misalignment in the topics and cognitive levels posed by ANA (Pournara et al., 2015). Teachers had a tendency to teach the content that was tested by ANA (Bansilal, 2012). This misalignment creates a high probability of fragmenting the mathematics topics, which in turn will impact the quality of what is taught (Polikoff et al., 2011). One cause of this misalignment could be excessive attention to procedures as promoted by the SAGM (DBE, RSA, 2011). Another reason might be missing topics in the Senior Phase, which is evident in the Grade 8 mathematics TIMSS, such as probability (DBE, RSA, 2011; Mullis et al., 2009). These findings are crucial in shaping the implementation of the NIAF (DBE, RSA, 2016).
Conclusion
In this study I focused on the evaluation of the alignment between the ANA and TIMSS. The conclusion drawn from the results of the computed Porter's alignment indices of 0.657, 0.728 and 0.681 in the 3 consecutive years of 2012, 2013 and 2014 is that ANA and TIMSS were misaligned. This misalignment is very serious in view of its statistical significance and the fact that an average of 31.13% of topics in ANA and TIMSS did not match.
The observed inconsistency in the tested topics and cognitive levels in ANA raises concerns about reliability. The data generated by ANA appear dubious when interpreted against what ANA should achieve. The implication is that the gaps in topics and cognitive levels must be addressed if South Africa intends to use ANA to prepare learners for TIMSS testing. This means that assessment frameworks in South Africa must be frequently reviewed in order to align with current global trends in mathematics assessment. Such a practice will go a long way towards improving the quality of mathematics education through assessment.
Of interest is whether or not the new assessment framework for mathematics took into account the matter of misalignment of assessments, including ANA. Considering that ANA gauges curriculum performance in the country and participation in TIMSS, the evaluated misalignment needs attention. The misalignment revealed in this study should guide policy-makers and ANA test developers in aligning ANA to simultaneously improve the quality of the test and its ability to gauge the performance of curricula in South Africa.
Recommendations
Firstly, it is recommended that policy-makers and ANA test developers engage in frequent ANA alignment exercises in order to maintain the quality of topics tested and close any knowledge gaps that may arise as a result of misalignment. Secondly, ANA test developers should maintain uniform levels of testing topics and cognitive levels to ensure that the tests attain acceptable levels of reliability. Finally, studies on alignment need to be frequently conducted in South Africa, with a view to providing continuous insights into acceptable quality standards for ANA tests. This should greatly influence the quality of mathematics teaching and learning through assessment.
Acknowledgements
This work emanated from my Doctor of Philosophy (PhD) which was conducted at the university of affiliation. Many thanks to my supervisors, staff members, the schools, the DBE and the research office for support, reviews and permissions provided.
Notes
i. Published under a Creative Commons Attribution Licence.
ii. DATES: Received: 2 October 2018; Revised: 7 March 2020; Accepted: 18 May 2020; Published: 31 August 2021.
References
Bansilal S 2012. What can we learn from the KZN ANA results? SA-eDUC Journal, 9(2):1-12. [ Links ]
Bansilal S 2017. The difficulty level of a national assessment of Grade 9 mathematics: The case of five schools. South African Journal of Childhood Education, 7(1):a412. https://doi.org/10.4102/sajce.v7i1.412 [ Links ]
Berger M, Bowie L & Nyaumwe L 2010. Taxonomy matters: Cognitive levels and types of mathematical activities in mathematics examinations. Pythagoras, 71:30-10. https://doi.org/10.4102/pythagoras.v0i7L4 [ Links ]
Chirinda B & Barmby P 2018. South African Grade 9 mathematics teachers' views on the teaching of problem solving. African Journal of Research in Mathematics, Science and Technology Education, 22(1):114-124. https://doi.org/10.1080/18117295.2018.1438231 [ Links ]
Creswell JW 2014. Educational research: Planning, conducting and evaluating quantitative and qualitative research (4th ed). Upper Saddle River, NJ: Pearson Education. [ Links ]
Department of Basic Education, Republic of South Africa 2011. Curriculum and Assessment Policy Statement Grades 7-9: Mathematics. Pretoria: Author. Available at https://www.education.gov.za/Portals/0/CD/National%20Curriculum%20Statements%20and%20Vocational/CAPS%20SP%20%20MATHEMATICS%20GR%207-9.pdf?ver=2015-01-27-160141-373. Accessed 5 August 2021. [ Links ]
Department of Basic Education, Republic of South Africa 2016. The development of a national integrated assessment framework for 2016 and beyond (including proposals on the re-design of the Annual National Assessments). Available at https://docsbay.net/the-development-of-a-national-integrated-assessment-framework-for-2016-and-beyond. Accessed 10 August 2018. [ Links ]
Dhlamini ZB 2018. The effectiveness of annual national assessment in monitoring mathematics education standard in South Africa. PhD thesis. Polokwane, South Africa: University of Limpopo. Available at http://ulspace.ul.ac.za/bitstream/handle/10386/2543/dhlamini_zb_2018.pdf?sequence=1&isAllowed=y. Accessed 2 October 2019. [ Links ]
Dhlamini ZB, Chuene K, Masha K & Kibirige I 2019. Exploring Grade nine geometry spatial mathematical reasoning in the South African Annual National Assessment. Eurasia Journal of Mathematics Science and Technology Education, 15(11):em1772. https://doi.org/10.29333/ejmste/105481 [ Links ]
Ferrer-Esteban G 2016. Trade-off between effectiveness and equity? An analysis of social sorting between classrooms and between schools. Comparative Education Review, 60(1):151-183. https://doi.org/10.1086/684490 [ Links ]
Ferrini-Mundy J & Schmidt WH 2005. International comparative studies in mathematics education: Opportunities for collaboration and challenges for researchers. Journal for Research in Mathematics Education, 36(3):164-175. [ Links ]
Fulmer GW 2011. Estimating critical values for strength of alignment among curriculum, assessments, and instruction. Journal of Educational and Behavioral Statistics, 36(3):381-402. https://doi.org/10.3102/1076998610381397 [ Links ]
Graven M & Venkat H 2014. Primary teachers' experiences relating to the administration processes of high-stakes testing: The case of Mathematics Annual National Assessments. African Journal of Research in Mathematics, Science and Technology Education, 18(3):299-310. https://doi.org/10.1080/10288457.2014.965406 [ Links ]
Graven M, Venkat H, Westaway L & Tshesane H 2013. Place value without number sense: Exploring the need for mental mathematical skills assessment within the Annual National Assessments. South African Journal of Childhood Education, 3(2):131- 143. https://doi.org/10.4102/sajce.v3i2.45 [ Links ]
Kanjee A & Moloi Q 2014. South African teachers' use of national assessment data. South African Journal of Childhood Education, 4(2):90-113. Available at http://www.scielo.org.za/pdf/sajce/v4n2/07.pdf. Accessed 2 August 2021. [ Links ]
Kanjee A & Moloi Q 2016. A standard-based approach for reporting assessment results in South Africa. Perspectives in Education, 34(4):29-51. https://doi.org/10.18820/2519593X/pie.v34i4.3 [ Links ]
Long C & Wendt H 2017. A comparative investigation of South Africa's high-performing learners on selected TIMSS items comprising multiplicative concepts. African Journal of Research in Mathematics, Science and Technology Education, 21(2):109-124. https://doi.org/10.1080/18117295.2017.1306343 [ Links ]
Martone A & Sireci SG 2009. Evaluating alignment between curriculum, assessment, and instruction. Review of Educational Research, 79(4):1322-1361. https://doi.org/10.3102/0034654309341375 [ Links ]
McHugh ML 2012. Interrater reliability: The kappa statistic. Biochemia Medica, 22(3):276-282. Available at https://hrcak.srce.hr/89395. Accessed 2 August 2021. [ Links ]
Mullis IVS, Martin MO, Ruddock GJ, O'Sullivan CY & Preuschoff C 2009. TIMSS 2011 assessment frameworks. Chestnut Hill, MA: TIMSS & PIRLS International Study Center, Lynch School of Education, Boston College. Available at https://timssandpirls.bc.edu/timss2011/downloads/TIMSS2011_Frameworks.pdf. Accessed 14 August 2014. [ Links ]
Ndlovu M & Mji A 2012. Alignment between South African mathematics assessment standards and the TIMSS assessment frameworks. Pythagoras, 33(3):Art. #182, 9 pages. https://doi.org/10.4102/pythagoras.v33i3.182 [ Links ]
Polikoff MS, Porter CA & Smithson J 2011. How well aligned are state assessments of student achievement with state content standards? American Educational Research Journal, 48(4):965-995. https://doi.org/10.3102/0002831211410684 [ Links ]
Porter AC 2002. Measuring the content of instruction: Uses in research and practice. Educational Researcher, 31(7):3-14. https://doi.org/10.3102/0013189X031007003 [ Links ]
Porter AC, Smithson J, Blank R & Zeidner T 2007. Alignment as a teacher variable. Applied Measurement in Education, 20(1):27-51. https://doi.org/10.1080/08957340709336729 [ Links ]
Pournara C, Mpofu S & Sanders Y 2015. The Grade 9 maths ANA - What can we see after three years? Learning and Teaching Mathematics, 18:34-11. [ Links ]
Shelton AR & Brown RS 2008. Measuring the alignment of high school and community college math assessments. Paper presented at the annual meeting of the American Educational Research, New York, NY, 24-28 March. Available at https://files.eric.ed.gov/fulltext/ED500764.pdf. Accessed 14 August 2014. [ Links ]
Spaull N 2016. Disentangling the language effect in South African schools: Measuring the impact of 'language of assessment' in grade 3 literacy and numeracy. South African Journal of Childhood Education, 6(1):a475. https://doi.org/10.4102/sajce.v6i1.475 [ Links ]
Webb NL 1997. Criteria for alignment of expectations and assessments in Mathematics and Science education (Research Monograph No. 6). Washington, DC: National Institute for Science Education. Available at https://eric.ed.gov/?id=ED414305. Accessed 14 August 2014. [ Links ]
Webb NL 2007. Issues related to judging the alignment of curriculum standards and assessments. Applied Measurement in Education, 20(1):7-25. https://doi.org/10.1080/08957340709336728 [ Links ]

