


Services on Demand
Article
 English (pdf)
 Article in xml format
 Article references
Indicators

Related links
-
 Cited by Google
 -
 Similars in Google
Share

 Permalink
South African Journal of Education
On-line version ISSN 2076-3433
Print version ISSN 0256-0100
S. Afr. j. educ. vol.40 n.1 Pretoria Feb. 2020
http://dx.doi.org/10.15700/saje.v40n1a1676
ARTICLES
The alignment of the Grade 12 physics examination with the CAPS curriculum: (November 2014-March 2018)
Nishaal BhawI; Jeanne KriekII
IDepartment of Physics, College of Science, Engineering and Technology, University of South Africa, Florida, South Africa
IIDepartment of Physics, College of Science, Engineering and Technology, University of South Africa, Florida, South Africa kriekj@unisa.ac.za
ABSTRACT
The South African Department of Education has attributed the poor pass rates in Grade 12 Physical Sciences to the learners' lack of practical work and the inability of learners to solve problems by integrating their knowledge from different topics in Physical Sciences. A possible reason for this could be a disjointed alignment between the curriculum and the examinations. The study reported on in this article focused on the alignment between the curriculum and the examination by analysing the Curriculum and Assessment Policy Statement (CAPS) document, the Examinations Guidelines documents, and the final and supplementary examinations of Paper 1 (P1) for Grade 12 Physical Sciences. We used the Surveys of Enacted Curriculum method, which incorporates a document analysis of CAPS and P1 using Bloom's taxonomy as a classification tool for the 4 physics topics and the 4 levels of cognitive demand. We found a balance of representation of 67%; a cognitive complexity of 80%; and an average Porter's alignment index of 0.76 between the CAPS and P1, all of which indicates a disjointed CAPS-P1 alignment. We recommend that the CAPS-P1 alignment be reconsidered.
Keywords: Bloom's taxonomy; CAPS Grade 12 Physical Sciences; National Senior Certificate examinations; Porter's alignment index; Surveys of Enacted Curriculum
Introduction
For the South African education system to compare globally, best practices of the top education systems in the world, such as those of Finland and Singapore, must be leveraged (Schleicher, 2012:81). In Singapore, it is accepted that learning does not necessarily imply the mastery of subject content, but for learners to become future leaders, they need to become critical thinkers and solvers of complex problems. These were the type of thinkers that would be in high demand in the future economy (Yahya, 2017). The learners' ability to critically understand information, and the ability to generate ideas from their understanding are essential to their future. Changes in the Singaporean curricular policies and initiatives enabled a shift in focus from the knowledge of content to the development of learners as critical thinkers. The way forward in Singapore was to embark on school-based curriculum innovation that emphasised critical thinking across subject content at the national level (Tan, Koh, Lee, Ponnusamy & Tan, 2017:518). Curriculum changes similar to those applied in Singapore where also implemented in Finland to foster critical thinking in educators and learners.
The Finnish education system aimed to create new models for school and teacher development - to ensure an increased alignment between the curricula and educational assessment (Schleicher, 2012:83). Some of the outcomes of the policy changes included shorter school days, minimal homework, focus on play, free time, and outdoor learning (Jackson, 2016). South Africa must adopt the best practices of global education leaders to achieve success in STEM (science, technology, engineering, and mathematics) education. Not only must there be changes in the current education system, but the South African government must support investment in STEM education, which includes an investment in STEM educators (Kennedy & Odell, 2014:249). The number of tertiary level graduates becomes a necessary measure of the success of government investments towards STEM education.
The minimum admission requirement for entry into an undergraduate science degree in South Africa is 50% in the Grade 12 physical sciences examination. The minimum entry for an undergraduate degree in engineering is 60% in the Grade 12 Physical Sciences examination (Stellenbosch University, 2018; University of Cape Town, 2017; University of Johannesburg, 2018; University of KwaZulu-Natal, 2016; University of Pretoria, Faculty of Health Sciences, 2017; University of the Witwatersrand, 2018). On average only 24% of the learners who complete the Grade 12 physical sciences examination meet the minimum entry requirement to study towards an undergraduate degree in the sciences (Department of Basic Education [DBE], Republic of South Africa, 2018a:176). Furthermore, an average of only 14% of the learners meet the minimum entry requirement to study towards an undergraduate degree in engineering (DBE, Republic of South Africa, 2018a:176). The low percentage of learners studying Grade 12 Physical Sciences who qualify to study engineering and the sciences at the tertiary level is of great concern.
A possible reason for the poor learner performance in Physical Sciences could be the non-alignment between the curriculum and the examination (Squires, 2012:129). Alignment studies allow for the analytical research of the various components of an educational system to compare the content and make decisions about how well they agree with each other (Martone & Sireci, 2009:1337). Horizontal coherence is the alignment between the curriculum content and instructional activities with the assessment (Mhlolo & Venkat, 2009:35). Traditional methodologies for determining the alignment between the curriculum and the assessment include sequential development, expert review, and document analysis. In the study reported on here we used the Surveys of Enacted Curriculum (SEC) research method that included three measures of alignment (Kurz, Elliott, Wehby & Smithson, 2010:132) which formed the basis for the research questions.
The alignment measures are balance of representation, cognitive complexity, and Porter's alignment index (AI). Balance of representation refers to the measure of the relative emphasis of topic coverage between the curriculum and the assessment. Cognitive complexity refers to the measure of the relative emphasis of cognitive demand between the curriculum and the assessment. The alignment index refers to the quantitative measure of the alignment between the curriculum and the assessment.
The subject-specific documents of the Grade 12 Physical Sciences curriculum included the Curriculum and Assessment Policy Statement for Physical Sciences (Grades 10-12) (DBE, Republic of South Africa, 2011) and the Examination Guidelines for Physical Sciences Grade 12 (DBE, Republic of South Africa, 2014; 2017b; Eastern Cape Education, 2015; South African Comprehensive Assessment Institute [SACAI], 2016), jointly referred to as the Curriculum and Assessment Policy Statement (CAPS). The examination for Grade 12 Physical Sciences comprised two examination papers: National Senior Certificate (NSC) Grade 12 Physical Sciences: Physics Paper 1 (P1) and NSC Grade 12 Physical Sciences: Chemistry Paper 2 (P2). The duration of the examinations for P1 and P2 were 3 hours each and each examination paper comprised 150 marks. The final score for the Grade 12 Physical Sciences was 400, which was made up of the 300 marks for P1 and P2 combined, and 100 marks for school-based assessment (SBA). The SBA consisted of class tests, mid-year examinations, trial examinations, and three prescribed experiments, conducted as formal assessments (DBE, Republic of South Africa, 2011:144). The CAPS is central to the organisation, planning, and teaching of Grade 12 Physical Sciences (DBE, Republic of South Africa, 2011:5). The first Grade 12 Physical Sciences examination based on the CAPS was written in November 2014. This study included the final and supplementary P1s from 2014 to 2018.
The purpose of this study was to undertake an in-depth analysis of the CAPS and the physics content of the Grade 12 Physical Sciences examination to assess the alignment of the CAPS and P1 with regard to the three criteria of the SEC method as presented by Kurz et al. (2010:132). P2 was excluded from this study as it did not contain any physics content. The alignment between the CAPS and P2 also requires an analysis but did not form part of this study and will be dealt with at a later stage.
Literature Review
The pass mark for Grade 12 Physical Sciences is a final mark of 30% (DBE, Republic of South Africa, 2018a:6). According to the DBE, Republic of South Africa (2018a:175), 179,561 students wrote P1 in November 2017, and the pass rate was 65.1%. An achievement of 30% will not allow learners entry into STEM-related fields of study at tertiary institutions. Low learner achievement is a problem in physical sciences education (Kriek & Grayson, 2009:185) and the poor performance in physics causes learners to dislike the subject, due to fear (Ayene, Damtie & Kriek, 2010:546), compounding the problem of poor performance. The DBE acknowledged this problem and included the aim of increasing the pass rate in physical sciences examinations in its action plan (DBE, Republic of South Africa, 2017a:1). However, according to the 2017 NSC Grade 12 Examination Report (DBE, Republic of South Africa, 2018b:61), the aim of increasing the pass rate in the physical sciences examinations was not achieved. A reason for the poor performance could be the disjointed alignment between the curriculum and the examination, which we planned to investigate in this study.
Alignment in an education system refers to the degree to which the curriculum and the assessment are in agreement (Rothman, Slattery, Vranek & Resnick, 2002:9). Webb (1997:4) elaborated on this by stating that the alignment between the curriculum and the assessment is the degree to which they guide learners to learn what they need to know. In education, an assessment refers to the process of determining the degree to which learners have learned what they were supposed to learn (Kahl, 2013:2617). In the curriculum, the concepts "needs to know" and "supposed to learn" reflect the content and how it needs to be assessed. This could create a problem when determining where changes should be made to facilitate an improved alignment between them. Addressing this problem requires of policymakers to review the aims of the curriculum. One of the principal objectives of the CAPS is to encourage active and critical learning to produce learners that can critically evaluate information (DBE, Republic of South Africa, 2011). This aim lends itself to the concept of higher-order thinking skills (HOTS), which is essential for learners in the 21st century (Resnick, 2001).
In the 1950s, Benjamin Bloom created a scheme of classification that categorised the levels of reasoning skills required by learners (Bloom, 1956). Bloom's taxonomy comprises six levels of cognitive demand (CDLs), namely knowledge, comprehension, application, analysis, synthesis, and evaluation. Krathwohl (2002:215) presented a revision to Bloom's original taxonomy, which was verb based rather than noun based. The six levels of cognitive demand in the revised taxonomy are: remember, understand, apply, analyse, evaluate, and create. Similar to the original taxonomy, the revised taxonomy is also hierarchical.
HOTS refers to the skills required by learners for them to successfully invoke the higher levels of cognitive processes. HOTS presents itself in three categories, the first of which is about knowledge transfer, which occurs at a level above understanding and remembering, both of which are deemed lower-order cognitive processes (Anderson, Krathwohl, Airasian, Cruikshank, Mayer, Pintrich, Raths & Wittrock, 2001). According to Anderson et al. (2001) the transfer of knowledge skills and consequently, meaningful learning, enables a learner to make sense of what was learned and to apply that knowledge to new situations. The second HOTS category is critical thinking - a level above apply and analyse, both of which are middle-order cognitive processes, which require of a learner to judge and critique (Barahal, 2008). The third HOTS category is problem-solving; learners critically evaluate ideas, form creative alternatives, and effectively communicate responses (Collins, 2014). The importance of teaching learners HOTS is that learners with a high level of HOTS tend to be more successful (Tanujaya, Mumu & Margono, 2017) and leaners that have not been taught a demanding, challenging, and thinking curriculum perform poorly in assessments based on problem-solving (Resnick, 2001). Based on the arguments above, the curriculum and the assessment must both foster an environment that promotes the use of HOTS.
Guo, Xing, Xu and Zheng (2012) as well as Liu, Zhang, Liang, Fulmer, Kim and Yuan (2009), conducted studies on other countries/cities where the alignment between the curriculum and the examination for Grade 12 physics or equivalent was investigated. The study by Liu et al. (2009) showed that New York had a significant alignment between the curriculum and the examination, while China and Singapore did not. The reasons stated for the lack of alignment between the curriculum and examination for Singapore and China indicated a shift towards higher-order thinking skills required in the examination. These studies emphasised the need for ongoing studies of the alignment between the curriculum and the examination to determine its effect on teaching.
An earlier study by Edwards (2010) concerning the South African context included the analysis of the National Curriculum Statement (NCS), the NSC Grade 12 Physical Sciences: Physics Paper 1 (P1) and NSC Grade 12 Physical Sciences: Chemistry Paper 2 (P2). In this study Edwards analysed the 2008 Exemplar, 2008 November and 2009 November examinations, and found that the calculated AI of 0.80 was consistent between the two final P1s analysed. Edwards (2010:587) also states that a low AI is not necessarily a bad thing if it is due to examination questions containing a higher cognitive demand than prescribed by the curriculum. Edwards' (2010) study was the first to quantify the alignment between the curriculum and the examination for Physical Sciences in South Africa.
Since Edwards' (2010) study the curriculum has changed from the NCS to the CAPS. This change required a new study to determine the alignment between the CAPS and P1. Edwards (2010) analysed three examinations that included P1 and P2 while in this study, eight P1s were analysed. Another difference is that Edwards (2010) used a revision of Bloom's taxonomy that has six hierarchical levels of cognitive demand while the current study uses a modification of Bloom's taxonomy that has four non-hierarchical levels of cognitive demand.
The CAPS uses the four levels of cognitive demand of the modified Bloom's taxonomy (DBE, Republic of South Africa, 2011:144).
The research questions underpinning the study were:
-
What is the measure of the relative emphasis of coverage of physics topics in the CAPS and P1 for the period November 2014 to March 2018? (Balance of representation.)
-
What is the measure of the relative emphasis of the cognitive demand level coverage in the CAPS and P1 for the period November 2014 to March 2018? (Cognitive complexity.)
-
What is the alignment between the CAPS and P1 for the period November 2014 to March 2018? (Porter's alignment index.)
Theoretical Framework
Bernstein's cognitive device and Bloom's theory of cognitive taxonomies are the theoretical bases for the framework that guides this study. In 1977 Basil Bernstein presented a structuralist view of education based on the three pillars of education: curriculum, pedagogy, and evaluation (Bernstein, 1977). Each of these pillars in Bernstein's cognitive device is a message system that delivers formal educational knowledge. The mechanisms of knowledge communication in Bernstein's pedagogic device follow a set of distributive rules that specify the communication of content and also perform the monitoring function of adequate understanding of the pedagogic discussion (Bertram, 2012:7). The first field of knowledge analysed in Bernstein's study was the field of re-contextualisation - where knowledge generated in the field of production is re‑contextualised, simplified, and transformed into new pedagogic knowledge. The second field was the field of reproduction - where generated knowledge is simplified and transformed into new pedagogic knowledge. The third field was re-contextualisation where the knowledge generated in the field of re‑contextualisation is transformed for the second time for general consumption.
Hoadley (2006:22) reports that pedagogy consists of the following five classifications rules: the strength of the boundary between the subject area and other subject areas; the strength of the boundary between the subject area and shared knowledge; the strength of the boundary between spaces used by teachers and learners; the strength of the boundary between spaces - internal and external to the classroom and learning; and finally, the strength of the boundary of pedagogical identities.
In this study, we used the strength of the boundary between the subject area and other subject areas as the classification rule that resulted in the use of the breadth of the CAPS. The breadth of the CAPS comprises the four physics topics (PST) (DBE, Republic of South Africa, 2011:8): mechanics (PST1), waves, sound, and light (PST2), electricity and magnetism (PST3), and optical phenomena (PST4).
Furthermore, we used the SEC method using Bloom's taxonomy of cognitive domain as classification tool to determine the cognitive complexity of CAPS content items and P1 assessment items, and subsequently, we used Porter's alignment index to determine the alignment between the CAPS and P1 assessment items. We used a modified version of the original taxonomy of cognitive domain, which comprises of four non-hierarchical levels, referred to as cognitive demand levels. These cognitive demand levels (CDL) were recall (CDL1), comprehension (CDL2), application and analysis (CDL3), and synthesis and evaluation (CDL4). Unlike Bloom's original taxonomy, the modified taxonomy used in this study was not hierarchical as it is assumed that learners may be able to apply (CDL3) a principle without actually comprehending (CDL2) it.
Methodology
Research methods have been developed to attain a more sophisticated level of analysis of the components of an education system. The three methods used most often are the Webb method (Webb, 1997), the Achieve method (Resnick, Rothman, Slattery & Vranek, 2004) and the SEC method (Blank, Porter & Smithson, 2001).
The Webb method and the Achieve method are used to gain a better understanding of the subject coverage comparisons while the SEC method is used to gain an understanding of both the subject content and the levels of cognitive demand between the curriculum and the examination (Edwards, 2010:575). We used the SEC method to determine the alignment between the CAPS and P1. The reason for using this method was that it also provides a quantitative measure of alignment: an understanding of cognitive demand between the curriculum and the examination of one subject (Physical Sciences) in one grade (Grade 12) in the absence of any performance data. The SEC method uses a topic and cognitive demand classification of the curriculum and the examination. This classification produces a two-dimensional frequency matrix with physics topics in the rows and cognitive demand levels in the columns. In our study, the PST and CDL classification resulted in eight frequency matrices for P1 and four frequency matrices for the CAPS.
A cell-by-cell division of the frequency matrix by the frequency matrix total produces the ratio matrix. A cell-by-cell absolute difference between the CAPS ratio matrix and the P1 ratio matrix produced the absolute differences matrix.
We used Porter's equation (Porter, 2002) to calculated the alignment index between the CAPS and P1:
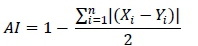
The term,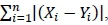 , in Porter's equation is the sum total of the absolute differences matrix. No established criteria existed to determine the strength of the AI since the calculation of the AI is dependent on the size of the ratio matrix (number of categories) and the number of content items classified (Fulmer, 2011:386). Fulmer developed a computational algorithm to calculate simulated mean critical values based on varying the number of topics, cognitive demand levels, and curriculum content items.
The reliability of the SEC alignment method and Porter's alignment index was affected by rater effects. The consistency and the dependability of the SEC alignment method and Porter's equation were verified by computing an interrater reliability coefficient. We used Cohen's kappa method to calculate the interrater reliability coefficient. Porter, Polikoff, Zeidner and Smithson (2008:3) reported on the work of Porter (2002) who computed an interrater reliability coefficient of 0.7 for two raters and an interrater reliability coefficient of 0.8 for four raters. The overall kappa interrater reliability coefficient for the coding of the CAPS and P1 was 0.88, which is higher than the 0.70 kappa interrater reliability index of Porter (2002) and, according to Coleman (2017:31) is "almost perfect" reliability.
The coding of items from P1 included an analysis of the cognitive processes involved in each P1 assessment item. The analysis revealed a commonality of explicit verbs which were tabled according to the four levels of cognitive demand and was used as the coding scheme for this study. An example is presented to illustrate the analysis of the cognitive processes involved in P1 assessment items. P1 assessment items required of learners to "read off from the graph." The learner was required to analyse the graph and apply the information given. The cognitive processes involved in this example were application and analysis, and "read off from the graph" was accordingly added to the CDL3 column of the explicit verbs table. Two experts performed the coding on four separate occasions -three trial runs and the final coding. We used the data from the final coding in this study. Cohen's kappa for the coding of the documents was 0.91 for the 149 CAPS content items; 0.97 for the 518 guideline content items; and 0.81 for the 429 P1 assessment items. The overall Cohen's kappa for all the items coded was 0.88.
Results
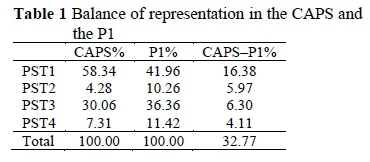
The data in Table 1 shows that the relative frequency of the CAPS content items was greater than the relative frequency of the P1 assessment items by 16.38% only for items based on PST1. For the remaining topics, the relative frequency of the CAPS content items was less than the relative frequency of the P1 assessment items by an average of 5.46%. The PST absolute value of the difference between the relative frequencies of the CAPS and the relative frequencies of P1 was 32.77% and indicate a balance of representation of 67.23% (100% - 32.77%) between the CAPS and P1.
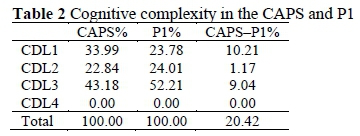
The data in Table 2 shows that the relative frequency of the CAPS content items was greater than the relative frequency of P1 assessment items by 10.21%, only for items based on CDL1. In terms of CDL2, the relative frequency of the CAPS content items was approximately equal to the relative frequency of P1 assessment items, having a difference of only 1.17%. In terms of CDL3, the relative frequency of the CAPS content items was less than the relative frequency of P1 assessment items by 9.04%. There were no items based on CDL4 in either the CAPS or P1. The CDL absolute value of the difference between the relative frequencies of the CAPS and the relative frequencies of P1 was 20.42% and indicate a cognitive complexity of 79.58% (100%-20.42%) between the CAPS and P1.
Substitution of the absolute differences matrix total for the expression  in Porter's alignment equation allowed for the calculation of the AI between the CAPS and P1. The data in Table 3 shows that the CAPS and P1 were the least aligned (AI = 0.7119) in the March 2016 examination and were the most aligned in the November 2016 examination (AI = 0.7852). The average AI between the CAPS and the final (November) P1s (0.7708) was higher than the average AI between the CAPS and the supplementary (March) P1s (0.7419).
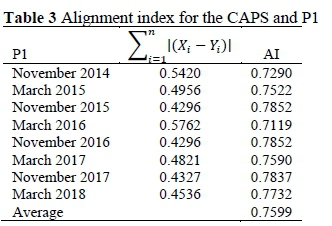
Figure 1 below shows the data obtained for the AI between the CAPS and P1 and the frequency of P1 assessment items based on CDL1, CDL2, and CDL3 for the period November 2014 to March 2018. The trend shows that the AI has been increasing during the period. In this same period, the trend indicates that the frequency of P1 assessment items based on CDL1 and CDL3 has been increasing, while the trend for P1 assessment items based on CDL2 has been decreasing.

Discussion
The findings of our study indicate that both the CAPS and P1 focus on PST1 and CDL3, which is in contrast to the findings obtained by Edwards (2010) who reported that the NCS was focused more on PST3 and CDL1. Figure 1 shows an increasing trend in the relative frequencies of P1 assessment items based on CDL3 for the period November 2014 to March 2018, and during the same period, there has been an increase in the CAPS-P1 alignment. We also found that there were no P1 assessment items based on CDL4, which is in agreement with the findings by Mothlabane (2017). Although this finding does not directly affect the measurement of the AI, it does demonstrate that there is room for a shift towards higher-order thinking skills in the CAPS and P1. Instruction and assessment that focus on higher-order thinking improve learner achievement and should be an essential aim in education systems (Zohar & Dori, 2003). Unlike the curriculum changes made in 2009, the changes made to P1 has positively affected the alignment with the CAPS and indicates that an improved alignment is possible with a curriculum focused on higher-order thinking.
The average AI (0.76) calculated in this study was comparable to the average AI (0.78) calculated by Edwards (2010). In Edwards' study there was a change to the NCS curriculum, which reduced the AI between the NCS and P1. In our study, the November 2014 P1 was the first CAPS-based examination and presented the lowest AI (0.73) between the CAPS and the November P1, indicating that although changes to the curriculum initially lowers the curriculum-assessment alignment, the alignment does improve with time, which results in an improved curriculum and an enhanced curriculum-assessment alignment. The data in Table 3 indicates that the average AI (0.76) calculated in this study was higher than the average AI (0.71) calculated by Liu et al. (2009:787). Liu et al. considered the AI (0.71) calculated by them as low. The reasons for the low AI calculated by Liu et al. was a curriculum shift that decreased the frequency of content items based on CDL1 in favour of content items based on CDL3. Liu et al. further argue that a low AI is not necessarily a negative consequence if the misalignment is due to the promotion of higher-order thinking skills, as in this study. Guo et al. (2012) calculated an average AI of 0.30, and the authors explained that the low AI was due to a curriculum that focused on lower-order thinking skills, while the assessment focused on higher-order thinking skills. While Guo et al. dismissed the AI as only being useful for describing the relative content and cognitive compositions of the curriculum and the assessment, the AI is a measure of the gap between the intended curriculum and the attained curriculum (Wang & McDougall, 2019), which Tienken (2008) described as the opportunity to learn and improve learner performance.
To improve learner achievement, an increase in the AI between the CAPS and P1 is required (Squires, 2012). The variables affecting the AI are the balance of representation and the cognitive complexity in both the CAPS and P1. The option of making changes to P1 to increase the CAPS-P1 alignment entails increasing the relative frequency of the assessment items based on CDL1 by correspondingly decreasing the relative frequency of the assessment items based on CDL3. This option directs P1 toward assessing lower‑order-thinking skills and is unwarranted. The other option entails making changes to the CAPS, which entails decreasing the relative frequency of the content items based on CDL1 and correspondingly increase the relative frequency of content items based on CDL3. Although the curriculum serves as the driver of success within an education system (Lyneis & Fox-Melanson, 2002), the high relative frequency of the content items based one CDL1 in the CAPS compared to P1 indicates that a revision of the CAPS seems necessary. The proposed changes to the CAPS, a shift from CDL1 to CDL3, will result in an improved CAPS-P1 alignment as well as a shift towards increasing higher-order thinking skills.
Recommendations
Neither the CAPS nor the P1 CDL distributions foster higher-order thinking as indicated by Ball and Garton (2005:62-63) who report CDL weights of 10%, 20%, and 70% for CDL1 through CDL3. We propose that both the CAPS and P1 reduce the frequency of items based on CDL1 to 10%, reduce the frequency of items based on CDL2 to 20%, and increase the frequency of items based on CDL3 to 70%. The absence of items based on CDL4 is of concern; however, as these items are absent in both the CAPS and the P1, their absence does not affect the CAPS-P1 alignment. The items based on CDL4 are included in the SBA, which was outside the scope of this study. We recommend that further research should include the SBA, which, in addition to providing a full description of what learners are taught and what they are expected to know, it should also provide for a comprehensive view of learners' cognitive demand.
To improve the CAPS-P1 alignment, we have proposed changes to the CAPS. A systematic approach to these changes may be facilitated by further studies that expand on the balance of representation and the cognitive complexity dimensions of alignment. In terms of the balance of representation, further studies may extend the four topics used in this study to include the 29 subtopics in the CAPS. In terms of the cognitive complexity, further studies may include the factual, conceptual, procedural, and metacognitive knowledge areas as described by Krathwohl (2002). We noted the exclusion of CDL4 in both the CAPS and P1, which does not provide a complete picture of the Grade 12 physics curriculum. A concluding recommendation is to include the practical activities of the school‑based assessments (SBA) in future studies. Including the practical activities of the SBA will provide a full description of what learners are taught and what they are expected to know.
Authors' Contributions
NB conducted the study as part of the qualifying criteria for the MSc degree in Physics Education. JK provided the conceptual transition of the thesis into a journal article and an invaluable supervisory and support function. All authors reviewed the final manuscript.
Notes
i . This article is based on the master's dissertation of Nishaal Bhaw.
ii. Published under a Creative Commons Attribution Licence.
References
Anderson LW, Krathwohl DR, Airasian PW, Cruikshank KA, Mayer RE, Pintrich PR, Raths J & Wittrock MC 2001. A taxonomy for learning, teaching, and assessing: A revision of Bloom's taxonomy of educational objectives (abridged ed). White Plains, NY: Pearson, Allyn & Bacon. [ Links ]
Ayene M, Damtie B & Kriek J 2010. Mismatch between the progression of the mathematics course and the level of mathematics required to do advanced physics. Latin-American Journal of Physics Education, 4(3):538-546. Available at https://dialnet.unirioja.es/servlet/articulo?codigo=3696853. Accessed 17 February 2020. [ Links ]
Ball AL & Garton BL 2005. Modeling higher order thinking: The alignment between objectives, classroom discourse, and assessments. Journal of Agricultural Education, 46(2):58-69. Available at https://s3.amazonaws.com/academia.edu.documents/41525812/46-02-58.pdf?response-content-disposition=inline%3B%20filename%3DMODELING_HIGHER_ORDER_THINKING_THE_ALIGN.pdf&X-Amz-Algorithm=AWS4-HMAC-SHA256&X-Amz-Credential=AKIAIWOWYYGZ2Y53UL3A%2F20200216%2Fus-east-1%2Fs3%2Faws4_request&X-Amz-Date=20200216T175826Z&X-Amz-Expires=3600&X-Amz-SignedHeaders=host&X-Amz-Signature=39b2516681b96ad760bf9a8bdd92cd4a69de322e00e7f1493f6548a1575aabbd. Accessed 16 February 2020. [ Links ]
Barahal SL 2008. Thinking about thinking. Phi Delta Kappan, 90(4):298-302. https://doi.org/10.1177%2F003172170809000412 [ Links ]
Bernstein B 1977. Aspects of the relations between education and production (2nd ed., Vol. 3). London, England: Routledge. [ Links ]
Bertram C 2012. Bernstein's theory of the pedagogic device as a frame to study history curriculum reform in South Africa. Yesterday and Today, 7:1-11. Available at http://www.scielo.org.za/pdf/yt/n7/02.pdf. Accessed 16 February 2020. [ Links ]
Blank RK, Porter A & Smithson J 2001. New tools for analyzing teaching, curriculum and standards in Mathematics and Science: Results from Survey of Enacted Curriculum Project (Final report). Washington, DC: Council of Chief State Schools. Available at https://files.eric.ed.gov/fulltext/ED458275.pdf. Accessed 10 January 2018. [ Links ]
Bloom BS (ed.) 1956. Taxonomy of educational objectives (Vol. 1). New York, NY: McKay. Available at http://nancybroz.com/nancybroz/Literacy_I_files/Bloom%20Intro.doc. Accessed 14 February 2018. [ Links ]
Coleman V 2017. On the reliability of applying educational taxonomies. Research Matters, 24:30-37. Available at https://www.cambridgeassessment.org.uk/Images/426171-on-the-reliability-of-applying-educational-taxonomies.pdf. Accessed 15 February 2020. [ Links ]
Collins R 2014. Skills for the 21st Century: Teaching higher-order thinking. Curriculum & Leadership Journal, 12(14). Available at http://www.curriculum.edu.au/leader/teaching_higher_order_thinking,37431.html?issueI. Accessed 15 February 2020. [ Links ]
Department of Basic Education, Republic of South Africa 2011. Physical Sciences National Curriculum Statement (NCS): Curriculum and Assessment Policy Statement Further Education and Training Phase Grades 10-12. Pretoria: Author. Available at https://www.education.gov.za/LinkClick.aspx?fileticket=uVcOcx728Y8%3d&tabid=570&port alid=0&mid=1558&forcedownload=true. Accessed 10 February 2018. [ Links ]
Department of Basic Education, Republic of South Africa 2014. Physical Sciences examination guidelines Grade 12 2014. [ Links ]
Department of Basic Education, Republic of South Africa 2017a. National Senior Certificate examination report 2016. Pretoria: Author. Available at https://www.education.gov.za/Portals/0/Documents/Reports/NSC%20EXAMINATION%20REPORT %202016.pdf?ver=2017-01-05-110635-443. Accessed 11 February 2018. [ Links ]
Department of Basic Education, Republic of South Africa 2017b. Physical Sciences examination guidelines Grade 12 2017. Available at https://www.education.gov.za/Portals/0/CD/2017%20NSC%20Exam%20Guidelines/Phys ical%20Sciences%20GR%2012%20Exam%20Guidelines%202017%20Eng.pdf?ver=2017-02-22-100225-000. Accessed 11 September 2017. [ Links ]
Department of Basic Education, Republic of South Africa 2018a. 2017 National Senior Certificate: Diagnostic report - Part 1. Pretoria: Author. Available at https://www.education.gov.za/Resources/Reports.aspx. Accessed 29 April 2018. [ Links ]
Department of Basic Education, Republic of South Africa 2018b. 2017 National Senior Certificate examination report. Pretoria: Author. Available at https://www.education.gov.za/Portals/0/Documents/Reports/2017%20NSC%20Examination%20Report.pdf?ver=2018-01-05-112628-360. Accessed 25 January 2018. [ Links ]
Eastern Cape Education 2015. Examination guidelines for the 2015 Senior Certificate Examination. Available at https://www.ecexams.co.za/2015_Assessment_Instructions/AssIn_23_2015_Exam_Guidelines.pdf. Accessed 10 February 2018. [ Links ]
Edwards N 2010. An analysis of the alignment of the Grade 12 Physical Sciences examination and the core curriculum in South Africa. South African Journal of Education, 30(4):571-590. https://doi.org/10.15700/saje.v30n4a389 [ Links ]
Fulmer GW 2011. Estimating critical values for strength of alignment among curriculum, assessments, and instruction. Journal of Educational and Behavioral Statistics, 36(3):381-402. https://doi.org/10.18844/cerj.v8i1.3431 [ Links ]
Guo Y, Xing T, Xu G & Zheng C 2012. Alignment between physics curriculum standard and high school physics exit examination in China: A comparison among Guangdong, Ningxia, Shandong, and Hainan provinces. E-Journal of REAL, 3(2):29-40. [ Links ]
Hoadley U 2006. Analysing pedagogy: The problem of framing. Journal of Education, 40(1):15-34. [ Links ]
Jackson A 2016. Finland has one of the world's best education systems. Here's how it compares to the US. Available at https://www.weforum.org/agenda/2016/11/finland-has-one-of-the-worlds-best-education-systems-four-ways-it-beats-the-us. Accessed 2 April 2018. [ Links ]
Kahl DH Jr 2013. Critical communication pedagogy and assessment: Reconciling two seemingly incongruous ideas. International Journal of Communication, 7:2610-2630. Available at https://ijoc.org/index.php/ijoc/article/view/1897/1033. Accessed 13 February 2020. [ Links ]
Kennedy TJ & Odell MRL 2014. Engaging students in STEM education. Science Education International, 25(3):246-258. Available at https://files.eric.ed.gov/fulltext/EJ1044508.pdf. Accessed 11 February 2020. [ Links ]
Krathwohl DR 2002. A revision of Bloom's taxonomy: An overview. Theory into Practice, 41(4):212-218. https://doi.org/10.1207/s15430421tip4104_2 [ Links ]
Kriek J & Grayson D 2009. A holistic professional development model for South African physical science teachers. South African Journal of Education, 29(2):185-203. https://doi.org/10.15700/saje.v29n2a123 [ Links ]
Kurz A, Elliott SN, Wehby JH & Smithson JL 2010. Alignment of the intended, planned, and enacted curriculum in general and special education and its relation to student achievement. The Journal of Special Education, 44(3):131-145. https://doi.org/10.1177%2F0022466909341196 [ Links ]
Liu X, Zhang B, Liang LL, Fulmer G, Kim B & Yuan H 2009. Alignment between the physics content standard and the standardized test: A comparison among the United States‐New York State, Singapore, and China‐Jiangsu. Science Education, 93(5):777-797. https://doi.org/10.1002/sce.20330 [ Links ]
Lyneis DA & Fox-Melanson D 2002. The challenge of infusing system dynamics into a K-8 curriculum. The Creative Learning Exchange, 11(2):1, 3-9. Available at http://static.clexchange.org/ftp/newsletter/CLEx11.2.pdf. Accessed 18 February 2020. [ Links ]
Martone A & Sireci SG 2009. Evaluating alignment between curriculum, assessment, and instruction. Review of Educational Research, 79(4):1332-1361. https://doi.org/10.3102%2F0034654309341375 [ Links ]
Mhlolo MK & Venkat H 2009. Curriculum coherence: An analysis of the National Curriculum Statement for Mathematics (NCSM) and the exemplar papers at further education and training (FET) level in South Africa. African Journal of Research in Mathematics, Science and Technology Education, 13(1):33-49. https://doi.org/10.1080/10288457.2009.10740649 [ Links ]
Mothlabane A 2017. Unpacking the South African Physics-examination questions according to Blooms' revised taxonomy. Journal of Baltic Science Education, 16(6):919-931. Available at http://www.scientiasocialis.lt/jbse/files/pdf/vol16/919-931.Motlhabane_JBSE_Vol.16_No.6.pdf. Accessed 8 February 2018. [ Links ]
Porter AC 2002. Measuring the content of instruction: Uses in research and practice. Educational Researcher, 31(7):3-14. https://doi.org/10.3102%2F0013189X031007003 [ Links ]
Porter AC, Polikoff MS, Zeidner T & Smithson J 2008. The quality of content analyses of state student achievement tests and content standards. Educational Measurement: Issues and Practice, 27(4):2-14. https://doi.org/10.1111/j.1745-3992.2008.00134.x [ Links ]
Resnick LB 2001 Making America smarter: The real goal of school reform. In AL Costa (ed). Developing minds: A resource book for teaching thinking (3rd ed). Alexandria, VA: Association for Supervision & Curriculum Development. [ Links ]
Resnick LB, Rothman R, Slattery JB & Vranek JL 2004. Benchmarking and alignment of standards and testing. Educational Assessment, 9(1-2):1-27. https://doi.org/10.1080/10627197.2004.9652957 [ Links ]
Rothman R, Slattery JB, Vranek JL & Resnick LB 2002. Benchmarking and alignment of standards and testing (CSE Technical report 566). Los Angeles, CA: Center for the Study of Evaluation, National Center for Research on Evaluation, Standards, and Student Testing, Graduate School of Education & Information Studies, University of California. Available at https://files.eric.ed.gov/fulltext/ED466642.pdf. Accessed 10 January 2018. [ Links ]
Schleicher A (ed.) 2012. Preparing teachers and developing school leaders for the 21st century: Lessons from around the world. Paris, France: OECD Publishing. https://doi.org/10.1787/9789264174559-en [ Links ]
South African Comprehensive Assessment Institute 2016. Examination guidelines: Physical Sciences 2016. Available at http://auxilio.co.za/documents/StudyAid/Gr12/Gr%2012%20Physical%20Science%20Examination%20Guidelines.pdf. Accessed 2 March 2018. [ Links ]
Squires D 2012. Curriculum alignment research suggests that alignment can improve student achievement. The Clearing House: A Journal of Educational Strategies, Issues and Ideas, 85(4):129-135. https://doi.org/10.1080/00098655.2012.657723 [ Links ]
Stellenbosch University 2018. 2019 admission requirements for undergraduate programmes. [ Links ]
Tan LS, Koh E, Lee SS, Ponnusamy LD & Tan KCK 2017. The complexities in fostering critical thinking through school-based curriculum innovation: Research evidence from Singapore. Asia Pacific Journal of Education, 37(4):517-534. https://doi.org/10.1080/02188791.2017.1389694 [ Links ]
Tanujaya B, Mumu J & Margono G 2017. The relationship between higher order thinking skills and academic performance of student in Mathematics instruction. International Education Studies, 10(11):78-85. https://doi.org/10.5539/ies.v10n11p78 [ Links ]
Tienken CH 2008. Rankings of international achievement test performance and economic strength: Correlation or conjecture? International Journal of Education Policy & Leadership, 3(4):1-15. Available at https://files.eric.ed.gov/fulltext/EJ898876.pdf. Accessed 10 April 2019. [ Links ]
University of Cape Town 2017. 2018 undergraduate prospectus. Available at https://www.uct.ac.za/downloads/uct.ac.za/apply/prospectus/uctugprospectus.pdf. Accessed 11 February 2018. [ Links ]
University of Johannesburg 2018. 2019 undergraduate prospectus. [ Links ]
University of KwaZulu-Natal 2016. Undergraduate prospectus 2017. [ Links ]
University of Pretoria, Faculty of Health Sciences 2017. 2018/2019 undergraduate faculty brochure. Available at http://www.up.ac.za/media/shared/360/Faculty%20Brochures%202015%202016/2018/fb-health-sciences-2018-19-pdf-6-04.12.2017.zp136568.pdf. Accessed 10 February 2018. [ Links ]
University of the Witwatersrand 2018. NSC admission requirements. Available at https://www.wits.ac.za/undergraduate/entry-requirements/admission-requirements-nsc/. Accessed 10 February 2018. [ Links ]
Wang Z & McDougall D 2019. Curriculum matters: What we teach and what students gain. International Journal of Science and Mathematics Education, 17(6):1129-1149. https://doi.org/10.1007/s10763-018-9915-x [ Links ]
Webb NL 1997. Criteria for alignment of expectations and assessments in Mathematics and Science education. Research Monograph, 6:1-39. Available at https://eric.ed.gov/?id=ED414305. Accessed 11 January 2018. [ Links ]
Yahya Y 2017. Parents put high value on critical thinking, creativity. The Straits Times, 25 February. Available at http://www.straitstimes.com/business/banking/parents-put-high-value-on-critical-thinking-creativity. Accessed 1 April 2018. [ Links ]
Zohar A & Dori YJ 2003. Higher order thinking skills and low-achieving students: Are they mutually exclusive? Journal of the Learning Sciences, 12(2):145-181. https://doi.org/10.1207/S15327809JLS1202_1 [ Links ]
Received: 6 June 2018
Revised: 23 July 2019
Accepted: 1 August 2019
Published: 29 February 2020

