


Services on Demand
Article
 English (pdf)
 Article in xml format
 Article references
Indicators

Related links
-
 Cited by Google
 -
 Similars in Google
Share

 Permalink
South African Journal of Education
On-line version ISSN 2076-3433
Print version ISSN 0256-0100
S. Afr. j. educ. vol.39 n.1 Pretoria Feb. 2019
http://dx.doi.org/10.15700/saje.v39n1a1670
ARTICLES
The relation between intellectual risk-taking regarding science classes and test anxiety inventory of secondary school
Belgin Bal-İncebacakI; Süleyman YamanII; Aslı Sarişan-TungaçII
IDepartment of Primary Education, Education Faculty, Ondokuz Mayis University, Samsun, Turkey belgin.bal@omu.edu.tr
IIDepartment of Science Education, Education Faculty, Ondokuz Mayis University, Samsun, Turkey
ABSTRACT
In learning of students, cognitive and affective skills and interaction of these skills are very significant. Intellectual risk taking (IRT) and test anxiety inventory (TAI) fall between these cognitive and affective skills. In this research, in addition to the relation between the skills of secondary school students, whether their class level and science success (SS) have any affect receives scrutiny. The research data has been obtained from 591 students, studying in 12 different government schools in 5 different provinces of Central Blacksea Region of Turkey. Three different data collection tools were used in this research conducted with the cross-sectional method. The correlation analysis results show that there is a negative relation between success in science and TAI, whereas there is a low relation between TAI and IRT. MANOVA results have revealed that as class level gets higher, IRT decreases and TAI does not have a significant tendency. It has been found that as the academic success of students gets higher, their TAI decreases and their IRT points do not have a specific tendency.
Keywords: intellectual risk taking; science class; science success; test anxiety
Introduction
Science has a place in every area of life and as a subject it contributes students to prepare for the daily life, follow science and technology closely, and obtain embraced permanent information. In the curriculum (2018), it is aimed that cognitive skills, such as solving problems, scientific process, and science literacy, over and above the daily life skills that are acquired by the students. Another skill included in the programme is risk-taking. Risk-taking has an important place in academic activities. Noting that there are different types of risk-taking Neihart (1999) classifies this skill into five groups, viz.: cognitive, social, affective, physical, and spiritual risk-taking.
Risk-taking in education is a cognitive process, and has different stages, such as thinking profoundly about a problem, subject, or case (Beghetto, 2009), and making an inference about the problem (Clifford & Chou, 1991), presenting a hypothesis, and rearranging the results of those hypotheses by discussing them with peer groups and creating new alternatives for solutions (Weiner, 1994). IRT involves cognitive actions that the students make during the process of contributing educational activities and contemplating, using existing knowledge, and acquiring new knowledge. Examination types are also among those risks that students face affecting their future, in addition to the selection of school and department (Yaman, 2017). The exams constitute the most important factor that student will take in moving to the next stage in their lives, causing students to take risks as well as causing them anxiety.
Test Anxiety
Exams are one of the most important ways of shaping the lives of students, but may enhance the anxiety of the students (Dündar, Yapici & Topcu, 2008). Those effects may cause psychosomatic and cognitive complaints before, during, or after an exam (Totan & Yavuz, 2009). According to Spielberger (1966), TAI is an unpleasant occasion of emotions during a formal exam, or in an evaluation environment that hinders an individual from revealing his/her real performance; has cognitive, affective and behavioral features and creates anxiety in an individual. Another definition states that the TAI is the unpleasant emotions and excitement experienced by the students during any kind of evaluation (Öner, 1990). There are emotional, physiological and psychological dimensions of test anxiety (Pekrun, 2004; Zeidner, 2004). Öner (1990) studied TAI according to two subscales: dimension of worry involving one's own internal negative assessment about her/himself; and dimension of emotionality that includes physiological signs occurring in an individual during an exam. Spielberger and Vagg (1995) determined TAI to have two dimensions, called Worry (TAI-W), and Emotionality (TAI-E), respectively. Worry is the cognitive dimension of the TAI. The individual's negative evaluations about him include negative internal conversations and thoughts about failure and inadequacy. Dimension of worry is the process within which the individual believes he/she cannot do what she/he has to do during the exam, where he/she will not be able solve the problem he/she is facing, and where the individual is distracted by negative thoughts, such as "what if I cannot succeed, what if I cannot do." Affectively, this dimension stimulates the autonomous nervous system, which constitutes the sensory physiological side of the TAI. The affective dimension is a process including physical reactions, such as fast heart rate, sweating, getting hot and cold chills, skin rashes, nausea, irritability, and tension.
Exams are one of the most important elements of the education process. It is known that in every stage of education the exams have a great influence on the students especially in our country (Yaman, 2011). Co§aner and Serin (2012) have indicated that test anxiety is a special type of anxiety, which can cause fear and uneasiness during assessment. Generally, anxiety can also be seen as a life experience, as it will appear in a certain part of an individual's life. Hill and Sarason (1966) specify that the anxiety was seen mostly in school environment, and since anxiety is such an intensive emotional situation, it also affects the performance of the students during the exam (Qapulcuoglu & Gündüz, 2013).
It is known that there is a strong relation between anxiety and learning. The qualification of this relation cannot be fully defined, yet it is accepted that some certain level of anxiety is essential for learning (Kilingkaya, 2013). Bilicioglu and Yilmaz (2017) have compared the success of Turkish and Singaporean students and stated that exam success, as well as the test anxiety of Singaporean students, who ranked first in international exam (Programme for International Student Assessment [PISA]), was higher than the level of Turkish students. By way of contrast, in a preliminary study examining the relation between these variables conducted by Atkinson (1957), it has been stated that test anxiety has an adverse influence on the success of students. By describing the influence of test anxiety on performance with the attention model, Wine (1980) has indicated that highly anxious people gave unrelated responses in their exams. In other words, they spent their time worrying instead of studying. Cassady (2004), on the other hand, stated that very anxious students cannot use their cognitive skills, and that therefore, they have solid concerns in exams. The results of those studies show that students with high anxiety levels obtain low success in the exams. Success or failure in the exams is related to many of the cognitive and affective skills of the students.
Intellectual Risk Taking
Strum (1971) pointed out that the students with high-risk taking skills are more willing to take part in activities in classes, even though they know they are going to fail, and that likewise, they are braver about taking the exams. Clifford (1988) has noted that those students enjoy the learning process and are also more successful at putting up resistance against problems during this process. This situation can mean that students with high risk taking skills are going to be more successful at dealing with the test anxiety. Aksan (2006), as well as Pitan and Atiku (2017), have stated that there are numerous factors that students encounter during decision-making or the problem-solving process. Aksan has classified those factors as affective, physical, and cognitive, respectively. Affective factors comprise of tension, stress, anxiety and motivation; physical factors comprise of light, sound, heat; and that cognitive factors comprise of exercises, way of perception and decision-making processes. These factors affect the academic accomplishment of the students directly or indirectly. The reason for this is that as the affective skills progress, the upper cognitive skills improve as well (Boyer, 2006). Liebert and Morris (1967) defined test anxiety as a cognitive component concern. This concern includes negative expectations from the exam, as well as internal conversations about the possible failures in the exam. From this point of view, this concerning situation influences especially students, because their exams affect the future opportunities of the individuals. One of the affective and cognitive features of students is IRT (Qakir & Yaman, 2015). IRT, academic success, and test anxiety, can be considered to be the main processes that affect the behaviours of students while approaching a topic (Chin, Williams, Taylor & Harvey, 2017; Hill & Sarason, 1966). Knowing the skill levels of secondary school students regarding these variables shapes the education that will be offered. Moreover, studies comparing test anxiety and IRT skills with the SS of secondary school students are found, yet no studies including these two variables can be found in the literature review. In this study, we aim to determine whether there is a relationship among the SS, IRT and TAI skills of secondary school students, and to point out the extent to which these variables explain one another. Depending on this problem, it has been discussed by researchers as to whether the IRT and TAI scores of the students differ according to grade and SS.
Method
In the research conducted in cross-sectional review, findings regarding the variables have been reached by obtaining data from the sample at once (Fraenkel & Wallen, 2000).
Participants
The data was obtained from 591 secondary school students studying in 12 different public schools in five different provinces in the respective 20162017 and 2017-2018 academic years in the Central Black Sea Region of Turkey. The data was collected from the 5th-8th grades using convenient sampling method. This type of sample involves the choice of sample that can be easily reached in the study. Two hundred and eighty of the participant students are female, while 311 of them are male.
Measures
In the research, three different data collecting tools were used. The first scale is the perception scale related to Intellectual Risk Taking and Predictors in Science Learning, which was adapted to Turkish by Yaman and Köksal (2014). The adapted scale was developed by Beghetto (2009) as a Likert-type scale, where the propositions proceed from completely incorrect, to completely correct. The scale has four sub-factors: IRT, interest in science (IS), creative self-efficacy (CSE) and perceptions of teacher support (PTS). It is stated that the structure validated measurement tool by the Exploratory and Confirmatory Factor Analysis can be used for secondary school students by taking the fit indices and expert opinions. Cronbach's Alpha internal consistency coefficient was calculated separately for both of the sample groups and found for the first group as .87 and for the second group as .86. Reliability levels related to the sub-factors obtained with alpha factor analysis (AFA) were .75, .80, .83 and .72, respectively. According to the analysis performed on the data of the research, the reliability coefficient of the entire scale was determined to be 0.89. The reliability levels of the collected data in this study were .75, .80, .83, and .72, respectively.
The second data-collecting tool was TAI, developed by Spielberger (1980) and adapted into Turkish by Öner and Albayrak-Kaymak (1990). TAI consists of 20 items, graded according to quartile rating. A reliability study about TAI has been conducted and reliability coefficient has been found to be r = .95. The internal consistency coefficient of TAI for this research was found to be .90. In addition, the researchers have stated that the validity level of TAI is high. TAI consists of two subtests, viz.: Worry (TAI-W) and Emotionality (TAI-E). For this reason, it is suggested that the scores related to these subtests have to be analysed and interpreted separately. The higher score of the exams means a higher level of TAI of the students (Öner, 1990).
a. TAI-W subtest is related to the cognitive aspect of the TAI. It constitutes the individual's negative opinions, failures, and personal incompetencies; in short it means internal conversation of the individual. Eight out of the 20 items in the inventory are intended to the measure the worry anxiety of the students. The sum of the obtained scores from these items constitutes the raw score related to the worry subtest of the students. The reliability level of TAI-W is .76.
b. The TAI-E subtest is related to excitement and emotional aspect of the TAI. Physiological signs and practices based on psychological basis, such as rapid heartbeat, sweating, nausea, and tension, which are also included in the physical infrastructure of the excitement (Öner, 1990). The reliability level of TAI-E is.86.
The third dependent variable of the research is the report score of the science course in the period of data collecting. Three written examinations, three in-class activities scores, and one project score are considered while calculating the report card score of the students. The average score of the students is 72.96, the standard deviation is 18.05, coefficient of skewness is -.78, and coefficient of kurtosis is .82. In the versatile analysis of variance, the scores of the students were categorised by considering the grades of the Ministry of National Education (MEB, 2015). Accordingly, between 85.00-100 is Very Good; between 70.00-84.99 is Good; between 60.00-69.99 is Average; between 50.00-59.99 is Pass and between 0.00-49.99 is a Fail. These categories are also used as independent variable and the relation between them and the dependent variable is examined.
Analysis
The data collected with two different measurement tools were analysed using descriptive analysis. Collected data is first examined to find out whether there is any kind of deficient and erroneous information. It was determined that in all the data, 59 of the 22,838 set cells were left blank by the students. It has been examined whether those boxes were left open at random, and it has been determined that there is not any kind of order. The ratio of the number of blank set cells to the number of filled cells was to be .002. As this ratio is lower than 1/20, serial average score was appointed for every blank set cell (Hair, Anderson, Tatham & Black, 1998). By calculating the Mahalanobis distance values, the research data has been examined so as to determine whether it matches with the normal distribution assumption values (Büyüköztürk, 2010). With this analysis, the outlier values, which could create a threat for the normality and linearity assumption of the data, were checked. In the analysis, 11 values for these assumptions have been found, which were not included in the analysis. It has been accepted that the loss to data ratio does not have a significant effect on the results, due to the fact that it was smaller than 5% (Tabachnick & Fidell, 2013).
After the removal of those students from the data set, the number of samples dropped to 591 students.
Parametric statistical techniques were used because of the fact that the data analysed after these operations have a normal distribution. For the normality test, the skewness and kurtosis values were examined, and the values for each dependent variable were determined to be between -1.00 and +1.00. In addition, for the versatile Analysis of Variance (ANOVA), the Box's test results were used. The parametric analyses used in the analysis are the Pearson Product-Moment Correlation Coefficient, and the versatile variance analysis. The values obtained for the correlation analysis were categorised as follows: between .00-.29 is low; between .30-.69 is average; between .70-1.00 shows a high degree of relation (Büyüköztürk, 2010). In the variance analysis, Eta-square (effect size) values were also calculated. This analysis is conducted to determine at what level the examined variable exists in the research results independently from the samples and the performed tests (Field, 2005). The obtained eta-square value is interpreted according to the classification determined by Cohen (1988). Hereunder, the effect size for η2< .01 is small, for .01 <η2< .06 is average and for 06 < η2< 0.14 is larger. In order to test the way of the difference between the groups in versatile variance analysis, a single factor ANOVA analysis is made, and for the differences between the groups, Scheffé from the post hoc tests are used. For all analysis, the confidence interval is accepted as 95 percent.
Findings
In this section, the analyses of the data obtained from the students regarding dependent and independent values takes place.
According to the Table 1, it was determined that there is a strong positive correlation between the average scores of the two scales and their own subfactors. It has been found that while the relation between the success of students and TAI was negative, the relation between the success of students and IRT was positive. On the contrary, while this relation was found to be significant, it was positive with all subscales of IRT and predictor scales, but the relation was negative regarding the scores of the TAI scale. It is also seen that there is a significantly lower correlation between TAI and its sub-factors and sub-factor of interest directed to science. In addition, it is found that there is a negative and low relation between the worry subfactor of TAI and CSE of IRT. Moreover, it is determined that the scores of TAI and IRT are generally low.
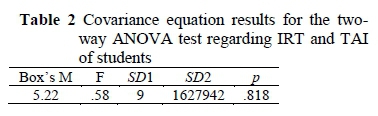
According to the Table 2, the data shows that a multiple variant analysis is possible for the data set regarding dependable variables as to the Box's M test results.
According to the Table 3, IRT scores of the students in different classes show a tendency to decrease as the class level increases. It has also been found that the homogeneity of the scores of the student gets lower as the class level decreases. On the other hand, it is determined that the TAI scores of the students doesn' t show any kind of tendency to fall or rise in a certain way; rising from Fifth Grade to the Sixth Grade, and falling in the seventh and eighth grades.
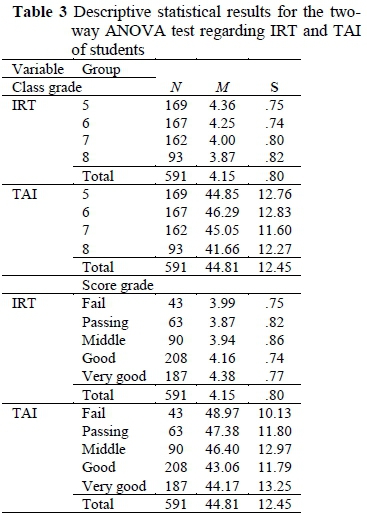
According to Table 3, it was determined that the students, having Pass marks, have the lowest IRT scores, and the students having Very Good marks, have the highest IRT scores according to the levels of SS scores of the students. As the scores of the students increase, risk-taking skills show a tendency to increase from Pass to Very Good. On the other hand, TAI scores show a tendency to fall from Fail to Good and tendency to rise in Very Good. The highest TAI is seen in the students with a Fail grade, and the lowest TAI is seen in the students with Good grade.
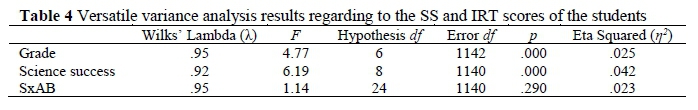
In Table 4, it is specified that the dependent variables show significant differences according to the situation of being in different classes (Wilks' λ = .95; F = 4.77; p < .000; η2=.025). Hereunder, it is determined that there is an important influence of the class levels of the students on changing the SS and IRT scores. The result of η2 shows that the influence has an average effect.
According to the same table, IRT and TAI become significantly different (Wilks' λ = .92; F = 6.19; p < .000; η2= 0.042). This result means that the change in SS has an average effect on both of the dependent variables. On the other hand, it is determined that the interaction between classes and SS score does not cause a significant difference on the dependent variables (p > .05).
When the mutual influence of the class and SS levels of the students on the dependent variables is examined, it is determined that there is no significant difference (p > .05). In addition, these two variables have an average effect on the IRT and TAI scores.
When Table 5 is examined according to the class levels it is seen that the IRT levels of the secondary school students become significantly different (F(3, 571) = 9.20, p < 0.01) and TAI scores do not become different at a significant level (p > 0.05). According to the SS of the students, it is determined that a significant difference occurs, according to their risk taking skills (F(4, 571) = 20.84, p < 0.01) and TAI scores (F(4, 571) = 3.44, p < 0.05). On the other hand, class level and SS scores of the students do not create an important effect on the two dependent variables (p > .05). It is specified that the class level has an average effect (η2= .046) on the IRT skills, and has a minor effect (η2= .003) on TAI. However, score of SS has a major effect (η2 = .060) on IRT and an average effect (η2= .024) on TAI scores. The mutual effect of class level and SS score has an average effect (η2= .034) on IRT and a minor effect (η2 = .013) on TAI scores. The results of multiple comparative tests are given in Table 6.
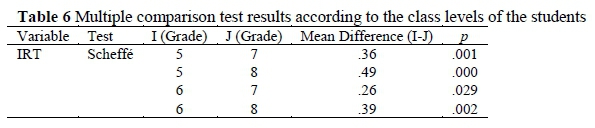
According to the Table 6, it has been found that the differences in IRT skills among classes generally tend to favour lower grades. It is determined that the greatest difference is between the Fifth and Eighth grades; the lowest difference is between the Sixth and Seventh grades.
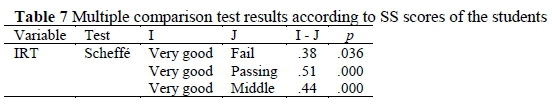
As seen in Table 7, the difference between the IRT skills according to the SS scores of the students are in favour of students with Very Good grades. The greatest difference is between Very Good and Passing grades; the lowest difference is between Very Good and Fail. There is no significant difference between IRT scores of the students having Very Good and Good grades.
Discussion and Conclusion
In this study, when the IRT, TAI and SS scores of the secondary school students were compared according to science learning, it was determined that there has been a low-level relation between TAI and IRT. Another result obtained from the research showed that there was a relation between SS of the students and IRT skills towards science learning and TAI. This relation is negative with TAI, and positive with IRT. IRT and TAI includes both cognitive and affective skills. When the literature is reviewed, it is accepted by many researchers that the cognitive and affective features have an effect on the learning of the students. (Bandura, 1997; Beghetto, 2009). In a study by Capulcuoglu and Gündüz (2013) conducted on high school students, it was found that anxiety affects success negatively, making it difficult to handle. Chin et al. (2017) have noted that fear of failure increases the anxiety level of the students even more. In the research conducted on effects of anxiety on Fourth, Fifth and Sixth grade students, Kogkar, Kilig and §ener (2002) have found that there was a relation between academic success and anxiety and as the anxiety rises, the academic success falls. They also envisaged that more than 50% of the students had high anxiety. Spielberger and Vagg (1995) stated that when the anxiety level of students is high, then they perceive exams to be a threatening process. As a result of this study, the reverse relation between anxiety and SS shows parallels with the results of the above-mentioned research.
Another research finding is that as the class level increases, the IRT levels show a tendency to fall. Beghetto (2009) also found a significant negative relation (β = -0.21) between grade levels and IRT scores of the secondary school students in the study. In the study of Das.ci and Yaman (2014), it was determined that the risk-taking levels of students are higher at younger ages. Stating this situation may have a relation with the decrease of teacher support, where Milner and Khoza (2008) and Oliveira (2010) noted that creating supportive learning environments would be beneficial. The fact that risk-taking is an ability that can be affected by cognitive and affective factors can be considered as an explanation of this situation identified in the study. When the class levels of the students are examined, it is highly remarkable that as adolescence approaches, risk-taking levels decrease. Kiran-Esen (2003) points out that there is a relation between adolescence and level of risk taking. These students demonstrate higher risk taking behaviours than those in later periods of adolescence. The results of the study show certain similarity with the results above.
The findings of the research show that the TAI increases from the Fifth Grade to the Sixth Grade, and decreases from the Sixth Grade to the Eighth Grade. The results of the study conducted by Kayapinar (2006) show that TAI scores do not have a certain tendency, according to the age of the students. In the relevant study, the highest rate of anxiety was seen at the age of 16; while the lowest rate of anxiety was seen at the age of 15; the anxiety level between the ages of 13 and 14 is in-between these mentioned ages. Hembree (1988) found in his study on K12 classes that the anxiety levels of students increase from the First Grade to the Eighth Grade, and decrease from the Eighth Grade to the Twelfth Grade. In related research, it was stated that test anxiety had a complex structure, which was affected by many cognitive and affective factors. Apart from the class level, many factors, such as gender, type of test, attitude, ability level, school environment, are under risk, or have not have an effect on test anxiety. There is a negative relation between SS and test anxiety, as revealed by the results of this research. Similarly to some studies in the literature, test anxiety has a tendency at first to increase, and then to decrease. As stated by Hembree (1988), there are many reasons for this situation, and the class level can be described as the variable with the greatest uncertainty among the variables that has an effect on this feature. The difficulty of fully revealing the effect of class level is almost impossible to fully control all variables such as teaching programme, teacher attitudes and behaviours, physical situation of the school and the classroom, friendships, and test types. Nevertheless, it is believed that it would be useful to consider the reasons for different test anxieties in different grades in other research relying on numerous variables. It has been found that students with an acceptable grade have the lowest IRT scores and students with a Very Good grade have the higher scores in regards to their SS scores. Studies show that there is a relation between academic success in science and IRT (Yaman & Köksal, 2014). As the scores of the students increase, IRT skills decrease, with a certain slope from Pass to Very Good. It is known that students experience TAI (Öner, 1990). When the TAI scores of the students are examined, it has been determined that there is a tendency to decrease from Fail to Good whereas there is tendency to increase at Very Good grades. The highest TAI was seen in the students with the grade of Fail and the lowest level of anxiety was seen in the students with Good grades. Albayrak-Kaymak (1987) obtained findings showing that TAI affects the success level of the students significantly. In addition, Von der Embse and Hasson (2012) have revealed that while the TAI level of students increases, SS scores of the students decrease.
The results of the study show that the interaction between class level and SS has no significant effect on IRT and TAI scores of the students. The main reason for this situation could be that as the class level increases, the scientific success does not show a tendency to decrease or increase. Nevertheless, while increase of the class level causes decrease of the IRT, when it shows an interaction with the increase in scientific successes, it does not cause a significant difference.
Suggestions
According to the research results and considering the reverse relation between the interest in science, which is one of the sub-dimensions of IRT and TAI, it may be suggested that studies could be performed in order to increase the interest of the students in science so that their TAI decreases. One of the outstanding findings of this research is the positive relation between success in science and risk-taking skills and the negative relation between success in science and TAI. Moreover, there is a poor relation between TAI and risk-taking. According to the research results, it could be possible to state that the students need to develop their risk-taking skills, in order to increase their success in science and decrease their TAI.
As the research results show that there are changes in different directions in cognitive and affective skills of the students as their age increases, it would be important to reveal the causes of these changes. In such research, qualitative research methods such as observation or interviews where detailed information could be collected, may be preferred. This detailed information can provide effective evidence for comparison of results of experimental and control groups in experimental studies, which include students at different success levels.
Authors' Contributions
Belgin Bal-incebacak wrote the introduction and findings, Süleyman Yaman conducted the statistical analyses and wrote method and findings, and Asli Sans.an-Tungac wrote method and discussion sections. All authors wrote conclusion and suggestions sections together and reviewed the final manuscript. All suggestions from reviewers were discussed together, and worked on until reaching consensus.
Notes
i. Published under a Creative Commons Attribution Licence.
References
Aksan N 2006. The relationship between epistemological beliefs and the problem solving skills of college students. Master's thesis. Qanakkale, Turkey: Çanakkale Onsekiz Mart University. [ Links ]
Albayrak-Kaymak D 1987. Development and reliability of the Turkish form of test anxiety scale. Turkish Journal of Psychology, 6(21):55-62. [ Links ]
Atkinson JW 1957. Motivational determinants of risk-taking behavior. Psychological Review, 64(6, Pt. 1):359-372. https://doi.org/10.1037/h0043445 [ Links ]
Bandura A 1997. Self-efficacy: The exercise of control. New York, NY: WH Freeman. [ Links ]
Beghetto RA 2009. Correlates of intellectual risk taking in elementary school science [Special issue]. Journal of Research in Science Teaching, 46(2):210-223. https://doi.org/10.1002/tea.20270 [ Links ]
Bilicioğlu A & Yılmaz K 2017. Öğrencilerin sınav kaygısı, fene yönelik ilgi ve ebeveyn desteği değişkenleri üzerine uluslararası bir karşılaştırma: Türkiye - Singapur [An international comparative study about some variables in Turkey and Singapore: Exam aniexty, science field interest and parent support scores of the students]. Abant İzzet Baysal Üniversitesi Eğitim Fakültesi Dergisi, 17(3):1201-1220. Available at http://efdergi.ibu.edu.tr/index.php/efdergi/art icle/view/2493/3434. Accessed 2 February 2019. [ Links ]
Boyer TW 2006. The development of risk-taking: A multi-perspective review. Developmental Review, 26(3):291-345. https://doi.org/10.1016/j.dr.2006.05.002 [ Links ]
Büyüköztürk S 2010. Manual of data analysis for social sciences. Ankara, Turkey: Pegem Publishing. [ Links ]
Çakir E & Yaman S 2015. The relationship between students' intellectual risk-taking skills with metacognitive awareness and academic achievement. Gazi Journal of Educational Sciences, 1(2):163-178. [ Links ]
Çapulcuoğlu U & Gündüz B 2013. Öğrenci tükenmişliğini yordamada stresle başaçıkma, sınav kaygısı, akademik yetkinlik ve anne-baba tutumları [Coping with stress, test anxiety, academic self-efficacy and parental attitudes in predicting student burnout]. Eğitim Bilimleri Araştırmaları Dergisi [Journal of Educational Sciences Research], 3(1):201-218. https://doi.org/10.12973/jesr.2013.3111a [ Links ]
Cassady JC 2004. The influence of cognitive test anxiety across the learning-testing cycle. Learning and Instruction, 14(6):569-592. https://doi.org/10.1016/j.learninstruc.2004.09.002 [ Links ]
Chin ECH, Williams MW, Taylor JE & Harvey ST 2017. The influence of negative affect on test anxiety and academic performance: An examination of the tripartite model of emotions. Learning and Individual Differences, 54:1-8. https://doi.org/10.1016/j.lindif.2017.01.002 [ Links ]
Clifford MM 1988. Failure tolerance and academic risk-taking in ten- to twelve-year-old students. British Journal of Educational Psychology, 58(1):15-27. https://doi.org/10.1.2044-8279.1988.tb00875.x [ Links ]
Clifford MM & Chou FC 1991. Effects of payoff and task context on academic risk taking. Journal of Educational Psychology, 83(4):499-507. https://doi.org/10.1037/0022-0663.83A499 [ Links ]
Cohen J 1988. Statistical power analysis for the behavioral sciences (2nd ed). Hillsdale, NJ: Lawrance Erlbaum Associates. [ Links ]
Coşaner S & Serin O 2012. Effect of anxiety in eight grade student's exam group guidance program. Turkish International Journal of Special Education and Guidance & Counceling, 1(1):44-53. [ Links ]
Daşci AD & Yaman S 2014. Investigation of intellectual risk-taking abilities of students according to Piaget's stages of cognitive development and education grade. Kuramsal Egitimbilim Dergisi [Journal of Theoretical Educational Science], 7(3):271-285. https://doi.org/10.5578/keg.7105 [ Links ]
Dündar S, Yapici Ş & Topfu B 2008. Investigation to test anxiety according to some personality characteristics of university students. Journal of Gazi Education Faculty, 28(1):171-186. [ Links ]
Field AP 2005. Eta and eta squared. In B Everitt & D Howell (eds). Encyclopedia of statistics in behavioral science. Chichester, England: John Wiley & Sons, Ltd. https://doi.org/10.1002/9781118445112.stat06610 [ Links ]
Fraenkel JR & Wallen EN 2000. How to design and evaluate research in education (4th ed). San Francisico, CA: McGraw-Hill. [ Links ]
Hair JF Jr, Anderson RE, Tatham RL & Black WC 1998. Multivariate data analysis (5th ed). Upper Saddle River, NJ: Prentice Hall. [ Links ]
Hembree R 1988. Correlates, causes, effects, and treatment of test anxiety. Review of Educational Research, 58(1):47-77. https://doi.org/10.3102%2F00346543058001047 [ Links ]
Hill KT & Sarason SB 1966. The relation of test anxiety and defensivenes to test and school performance over the elemantary-school years: A further longitudinal study. Monographs of The Society for Research in Child Development, 31(2):1-76. [ Links ]
Kayapinar E 2006. Research into anxiety level of the 8th grade students at primary schools preparing for secondary school student selection and placement examination: The sample of Afyonkarahisar City. Master's thesis. Afyonkarahisar, Turkey: Afyon Kocatepe University. [ Links ]
Kilinçkaya MD 2013. The relationship between test anxiety and students' achievement in Atatürk's principles and revolution course. Hacettepe University Journal of Education, 28(1):235-243. [ Links ]
Kiran-Esen B 2003. High school students' risk-taking behaviour is predicted by peer pressure, achievement and age variables. Hacettepe University Journal of Education, 24:79-85. [ Links ]
Koçkar Aİ, Kılıç BG & Şener Ş 2002. Test anxiety and academic achievement in primary school students. Turkish Journal of Child and Adolescent Mental Health, 9(2):100-105. [ Links ]
Liebert RM & Morris LW 1967. Cognitive and emotional components of test anxiety: A distinction and some initial data. Psychological Reports, 20(3):975-978. https://doi.org/10.2466%2Fpr0.1967.20.3.975 [ Links ]
MEB 2015. Milli Egitim Bakanligi Ortaögretim Kurumlari Yönetmeligi [Ministry of National Education Regulation for Secondary Education Institutions]. Available at https://ogm.meb.gov.tr/meb_iys_dosyalar/2015_07/02121314 _mlletmbakanliiortaretmkurumlariynetm el1.7.201529403.docx. Accessed 6 February 2017. [ Links ]
Milner K & Khoza H 2008. A comparison of teacher stress and school climate across schools with different matric success rates. South African Journal of Education, 28(2):155-173. Available at http://www.sajournalofeducation.co.za/index.php/saje/article/view/38/102. Accessed 22 January 2019. [ Links ]
Neihart M 1999. Systemtatic risk-taking. Roeper Review, 21(4):289-292. Available at https://www.researchgate.net/publication/233258753_Systematic_risk-taking. Accessed 22 January 2019. [ Links ]
Oliveira AW 2010. Improving teacher questioning in science inquiry discussions through professional development. Journal of Research in Science Teaching, 47(4):422-453. https://doi.org/10.1002/tea.20345 [ Links ]
Öner N 1990. Handbook of test anxiety inventory. İstanbul, Turkey: Yüksek Öğrenimde Rehberliği Tanıtma ve Rehber Yetiştirme Vakfı [ Links ].
Öner N & Albayrak-Kaymak D 1990. Sinav kaygisi envanteri elkitabi [The manual of test anxiety inventory]. Istanbul, Turkey: Yöret Publications. [ Links ]
Pekrun R 2004. Test anxiety and academic achievement. In NJ Smelser & PB Baltes (eds). International Encyclopedia of the Social and Behavioral Sciences. Amsterdam, the Netherlands: Elsevier. [ Links ]
Pitan OS & Atiku SO 2017. Structural determinants of students' employability: Influence of career guidance activities [Special issue]. South African Journal of Education, 37(4): Art. # 1424, 13 pages. https://doi.org/10.15700/saje.v37n4a1424 [ Links ]
Spielberger C 1980. Test anxiety inventory: Preliminary professional manual. Palo Alto, CA: Consulting Psychologists Press. [ Links ]
Spielberger CD 1966. Theory and research on anxiety. In CD Spielberger (ed). Anxiety and behavior. New York, NY: Academic Press. [ Links ]
Spielberger CD & Vagg PR (eds.) 1995. Text anxiety: Theory, asssesment, and treatment. Philadelphia, PA: Taylor and Francis. [ Links ]
Strum IS 1971. The relationship of creativity and academic risk-taking among fifth graders (Final report). Available at https://files.eric.ed.gov/fulltext/ED046212.pdf. Accessed 11 February 2019. [ Links ]
Tabachnick BG & Fidell LS 2013. Using multivariate statistics (6th ed). Boston, MA: Pearson. [ Links ]
Totan T & Yavuz Y 2009. The validity and reliability study of the Turkish version of Westside test anxiety scale. MehmetAkifErsoy University Faculty of Education Journal, 9(17):95-109. [ Links ]
Von der Embse N & Hasson R 2012. Test anxiety and high-stakes test performance between school settings: Implications for educators. Preventing School Failure: Alternative Education for Children and Youth, 56(3):180-187. https://doi.org/10.1080/1045988X.2011.633285 [ Links ]
Weiner B 1994. Integrating social and personal theories of achievement striving. Review of Educational Research, 64(4):557-573. https://doi.org/10.3102%2F00346543064004557 [ Links ]
Wine J 1980. Cognitive-attentional theory of test anxiety. In IG Sarason (ed). Test anxiety: Theory, research and applications. Hilldale, NJ: Lawrence Erlbaum Associates. [ Links ]
Yaman S 2011. The optimal number of choices in multiple-choice tests: Some evidence for science and technology education. The New Educational Review, 23(1):227-241. Available at https://s3.amazonaws.com/academia.edu.documents/31097428/tner_1_2011.pdf?AWSAcce ssKeyId=AKIAIWOWYYGZ2Y53UL3A&Expires=154788 7126&Signature=NvEUi%2F8uHE7O%2FzJ527on9dOjYYQ%3D&response-content-disposition=inline%3B%20filename%3DRelationship_between_the_Characteristics.pdf#page=192. Accessed 19 January 2019. [ Links ]
Yaman S 2017. Investigating consistency of questions in primary and middle school science textbooks with objectives in science curriculum. Journal of Education and Training Studies, 5(4):81-89. https://doi.org/10.11114/jets.v5i4.2020 [ Links ]
Yaman S & Köksal MS 2014. Fen ögrenmede zihinsel risk alma ve yordayicilarina ili§kin algi öljegi Türkje formunun uyarlanmasi: Gejerlik ve güvenirlik jalismasi [Adaptation of the Turkish version of the mental scale and predictors of science in science learning: Validity and reliability study]. Turk Fen Egitimi Dergisi [Journal of Turkish Science Education], 11(3):119-142. https://doi.org/10.12973/tused.10122a [ Links ]
Zeidner M 2004. Test anxiety. In C Spielberger (ed).Encyclopedia of applied psychology. Boston, MA: Elsevier Academic Press. [ Links ]
Received: 16 March 2018
Revised: 5 September 2018
Accepted: 15 February 2019
Published: 28 February 2019

