


Serviços Personalizados
Artigo
 Inglês (pdf)
 Artigo em XML
 Referências do artigo
Indicadores

Links relacionados
-
 Citado por Google
 -
 Similares em Google
Compartilhar

 Permalink
South African Journal of Education
versão On-line ISSN 2076-3433
versão impressa ISSN 0256-0100
S. Afr. j. educ. vol.39 no.1 Pretoria Fev. 2019
http://dx.doi.org/10.15700/saje.v39n1a1518
ARTICLES
Science and non-science teachers' interpretation of physics diagrammes
Gulbin OzkanI; Unsal Umdu TopsakalII
IDepartment of Science Education, Faculty of Education, Yildiz Technical University, Istanbul, Turkey
IIDepartment of Science Education, Faculty of Education, Yildiz Technical University, Istanbul, Turkey topsakal@yildiz.edu.tr
ABSTRACT
This paper discusses teachers' interpretations of physics diagrammes. The study based on 55 science and non-science teachers, where a qualitative approach was adopted. First, 12 fundamental physics diagrammes were revealed to the teachers, who were asked to think aloud about them. Science teachers and non-science teachers gave similar answers. It has been observed that only the science teacher cohort extended their explanations. When interpreting the diagrammes, the participants in both groups did not notice certain elements that it was expected they would see. The result of this study can inform how teachers interpret physics diagrammes. This paper contributes to the growing interest in international literature as well as national literature regarding the use of diagrammes for teacher training, because interpreting diagrammes is a comprehensive process, which contains certain elements, such as lines, arrows, curves, colour, and objects with boundaries.
Keywords: diagrammes; physics learning; physics teaching; science education
Introduction
One of the essential teaching tools used in science education is diagrammes, in terms of communicating abstract knowledge (Kragten, Admiraal & Rijlaarsdam, 2015). These diagrammes support student-centered instruction and correct many weaknesses of traditional lecture-demonstration methods (Jackson, Dukerich & Hestenes, 2008). They are ideal for ensuring structural organisation (Tversky, 2001), since they are easily visualised by students (Harrison & Treagust, 2000).
The use of diagrammes is not merely limited to fields such as psychology and mathematics (Cheng, Lowe & Scaife, 2001), but also serve as a teaching tool at all grade levels in Science (Lowe, 1989).
In some science education studies, diagrammes have been used as teaching supporting instruments. For example, Gobert (1994) has reported on students that could not interpret diagrammes sufficiently. Another study was that reported by Uesaka and Manalo (2007), who concluded that, though diagrammes are considered as adequate personal tools for solving problems, applied research in education has identified that interpreting diagrams is a common problem. Uesaka and Manalo (2007) also suggested that diagrammes are transmission tools used to solve problems.
Heckler (2010) found that force diagrammes were effective in solving simple mechanical questions of students. In order to develop a diagramme drawing that facilitates problem-solving, it is important that the diagrams are correctly interpreted.
A study conducted by Mathai and Ramadas (2009) examined the middle school students' understanding of the human body system and their visualisations. They also searched the role of diagrammes. They developed a common framework based on structure and function to assess students' responses across diagramme and verbal modes, finding that students had a high dependence on the verbal mode.
Another study was that reported by Heiser and Tversky (2006), who investigated descriptions and function of diagrammes. In this study, they organised two experiments. In the first experiment they carried out, they investigated the effect of the arrows in the diagrammes on their interpretation. In the second experiment, they investigated the effect of the perspective of the text, structural or functional, diagrammes produce on participants. Experiments have shown that arrows played an important effect in augmenting structural diagrammes to convey dynamic, causal, or functional information.
Gobert and Clement (1999) have searched the beneficial effects of student-generated diagrammes versus student-generated summaries on conceptual understanding. They found that the summaries generated during the reading of the text contained more domain-related information than did the diagrammes generated during the reading of the text.
Davenport, Yaron, Klahr and Koedinger (2008) have suggested that to improve students' learning when teachers design the instructions, they must be careful over the interaction of: 1) the specific learning objectives; 2) how the diagramme is designed; 3) cognitive processing of the learner. The diagramme design is just a start to learning therefore, the interpretation of diagrammes is important. Unfortunately, both students and teachers have deficiencies in interpreting diagrammes (Umdu Topsakal & Oversby, 2012).
Researchers suggest that diagrammes are beneficial tools by means of which to develop mental models. They are external, and often analogical visualisations of information presented in the text (Gyselinck & Tardieu, 1999). Furthermore, connections among concepts in diagrammes enables learners to solve problems by linking thoughts learnt and including diagrammes in cognitive processes in order to contribute to understanding (Fiore, Cuevas & Oser, 2003).
Cromley, Snyder-Hogan and Luciw-Dubas (2010) have stated that although diagrammes can be effective aids to learning, students have difficulty in understanding and abstracting information from them. Sometimes diagrammes are preferred and provide an advantage, while other studies suggest that students can find translating and understanding them very challenging (Cromley et al., 2010). Using scientific diagrammes effectively has been an accurate method for facilitating scientific understanding.
In schools, diagrammes are used in all textbooks and visual representations to communicate ideas on almost every page (Arnold, Woolley & Johnson, 2009). In the literature, research on science diagrammes in textbooks notes that this situation is common to almost every page of any science textbook (Slough, McTigue, Kim & Jennings, 2010). Teachers need to know how to interpret diagrammes in order to increase their effectiveness, which are colored in textbooks. All textbooks in schools are printed in colour in Turkey. In order to make the diagrammes and visuals more meaningful, the textbooks are printed in colour. Considering the printing costs of textbooks, it seems to be an economically costly process. Similarly, economic processes are influential in the printing of textbooks (Apple, 2013). Therefore, an accurate interpretation of the diagrammes and their nature will also indirectly contribute to national economy.
Scientific considerations can be supported by using diagrammes in Physics teaching. If diagrammes are interpreted appropriately, individuals can configure their own mental models (Butcher, 2006). From this point of view, the importance of interpreting the diagrammes can be correctly understood.
Diagrammes have the advantage that they can use components in space and spatial relations to express the elements and relations of students' thought to encourage their learning (Tversky, 2001). Although the purpose of diagrammes is to help facilitate learning, students have difficulty with their interpretation (Schõnbom, Anderson & Grayson, 2002). Van Meter and Garner (2005) reported that studies in this regard tend to focus on constructing diagrammes, rather than on interpreting them, leaving a lacuna in the literature. In addition, on examination, there is a tendency for research on diagrammes only to consider diagramme effects and functions (Larkin & Simon, 1987; Mayer, 2003). In addition, in a review of the literature, many studies were conducted with the students. (e.g. Gobert, 2000; Gobert & Clement, 1999; Lowe, 1989; Mathai & Ramadas, 2009; Uesaka & Manalo, 2007). These studies showed that diagrammes can be an effective aid to learning, but students have difficulty in understanding them. To ensure that students understand the diagrammes correctly, teachers must first correctly interpret them. For this reason, studies on how teachers interpret the diagrammes are of importance, despite their dearth (Umdu Topsakal & Oversby, 2013).
This research aims to explore the interpretation of diagrammes, starting from what they have noticed when the teachers examined the diagrammes. Noticing is different from seeing and it is one essential aspect within the process of reflection that entitles additional attention. Noticing has three dimensions (Van Es & Sherin, 2008). The first dimension of noticing is calling-out, what is critical in a very complicated situation (Frederiksen, 1992). Another dimension of noticing is to use information of context to reason about situations under analysis. The third dimension of noticing is the ability to make connections between certain events (Van Es & Sherin, 2008). In short, everything that is seen is not noticed.
The main objective of this study is to determine perception about the nature of reading teacher diagrammes within the education system. As a result, colleagues and educational instructors can follow the road for the improvement of that system.
Method
Design
A qualitative approach and a grounded theory design were adopted. Grounded theory constitutes the whole of the procedures for producing a theory that is used to describe a concept, as an essential topic. There are three types of grounded theory designs: systematic, emergent, constructivist (Creswell, 2002). In this study, a systematic design was used. This design underlined the use of data analysis stages of open, axial, and selective coding, and development of logical hypotheses (Glaser & Strauss, 1967). This definition includes three phases of coding: 1) open coding, which is the initial step in the data analysis process and all the data concerned to the study must be labelled; 2) axial coding, which is a draft of categories (Merriam, 1998), where a category must be developed, be positioned at the centre of process, and then be related with other categories; and 3) selective coding, wherein multiple relationships are established among the categories, and an abstract description for the process being researched in the study must be provided. A grounded theory study using these phases must end with hypothesis (Creswell, 2002). Hypotheses can be created with arguments that are sufficient for coming up with a proposal; it does not have to involve accumulated arguments to prove the hypothesis (Merriam, 1998).
Sampling
The participants of the present study consisted of 55 (32 female, 23 male) teachers of primary, secondary, and high schools located in 32 different cities in Turkey. Some of the participants are science teachers (n = 28) and the others are non-science teachers (n = 27). Science teachers graduated from the department of science education or physics education, while non-science teachers graduated from other departments. Gender, age, and professional field of teachers are indicated in Figures 1-3, respectively.
Semi-structured interviews were carried out with eight (four science teachers, four non-science teachers) teachers. With regards to gender, there was an equal distribution both in science teachers and non-science teachers. Participants were randomly selected. It was necessary to carry out the interviews with teachers who have different professional fields.
Instrumentation
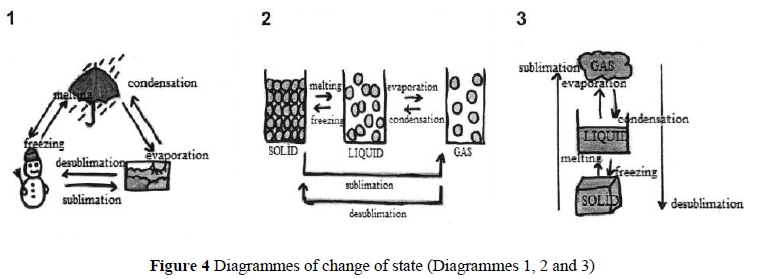
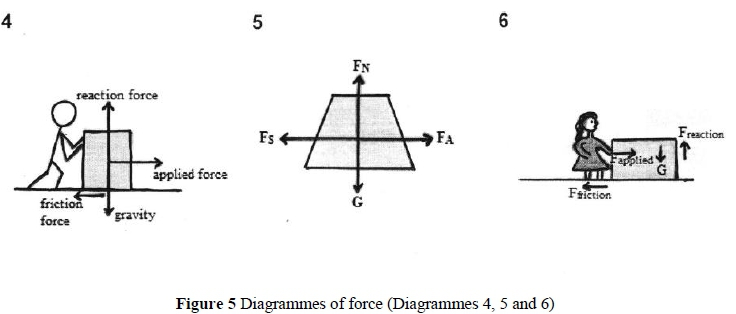
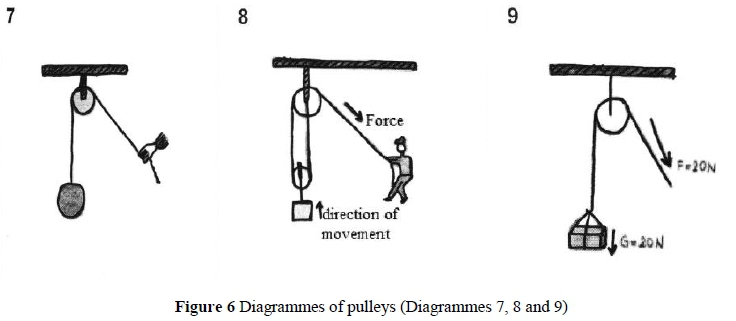
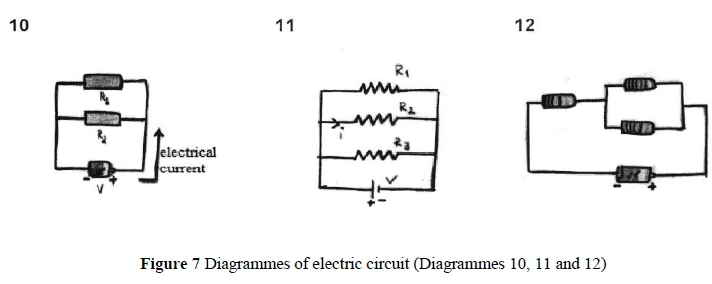
The research was carried out in three steps. In initial step, physics diagrammes from the internet (Google Images) were collected depicting the following topics: change of state (Figure 4); force (Figure 5); pulleys (Figure 6); and the electric circuit (Figure 7). The subjects were chosen to be simple, general, and interpretable by everyone. All labels were used in the diagrammes in Turkish. However, the diagramme labels were translated into English in this article, so that the readers might understand them. We presented sketches for copyright reasons.
In the second stage, when selected diagrammes are shown to the teachers, they are requested to say what they think out loud (Think Aloud). The Think Aloud Protocol is a method by which researchers at least partially understand the thought process of a subject when they use a product, instrument, or handbook (Zuldin, 2014). The researcher observes the participant when trying to finish a user-defined task. During the interviews, researchers rarely remind the subject to "keep talking" (Ericsson & Simon, 1993). Neutral signs such as "keep talking" encourage subjects to think aloud, but do not divert data by adding external ideas to the internal processes of subjects (Johnstone, Bottsford-Miller & Thompson, 2006). Verbal descriptions obtained during think-aloud protocols can cause researchers to observe the cognitive processes of participants, without influencing their thought (Ericsson & Simon, 1993). Participants were told that the researchers were exploring how teachers interpret the diagrammes.
There are two versions of think-aloud protocol, namely live and recalled. We chose to use the live version. Both have their limitations. The live form forces the participant to slow down as they articulate thought processes that may be much quicker than verbalisation. There is the danger that verbalisation misses thinking that is fleeting, hard to express, and embarrassing because it may indicate personal deficiencies or thoughts that the participant may wish to keep private. It is also possible that the Think Aloud Protocol influences what is thought by the participant, becoming more metacognitive of their thinking as the sessions extend. Many of these limitations also apply to recall Think Aloud, where in addition, reflection on the process has had time to take place. Nevertheless, as we seek to explore individual modes of thinking, it is inevitable that the procedure will influence what we find, and it becomes necessary to accept this as part of the protocol, and be constantly aware of these points.
Lastly, semi-structured interviews were carried out to deeply examine the teachers' thoughts on the diagrammes. In the interviews, other questions were asked in parallel to the physics diagramme, in order to allow for more detailed thinking. In all the remaining questions, participants were allowed to express their ideas freely, without interruption. If participants were reluctant to speak or were at a loss for words, the researcher used other questions to provide more information. The responses were recorded by the researcher with written notes. Each teacher interview lasted about 30 minutes.
Data Analysis
One of the fundamental methods of qualitative enquiry is Grounded Theory (Creswell, 2002). Instead of starting with a hypothesis, the first step is to collect data by various methods. From the collected data, the important points are marked with a series of codes extracted from the text. The answers given are written sentence by sentence, manually. Codes are divided into similar concepts, from which concepts based on the creation of a theory or reverse engineering hypothesis are constructed (Allan, 2003). Grounded Theory is used to develop a theory that is consistently gathered and analysed (Strauss & Corbin, 1994:273).
In this study the researchers merely looked at and listened to the recorded responses of the participants, and discussed them. One of the "observations" of the researcher was compared to the participants. Participants who responded to the same kind of opinion and respondents who gave different responses were categorised and noted. Some of the different teachers' expressions are included in the citations presented in the findings belows.
Findings
In the first phase of the grounded theory, open coding is used. It began with looking at diagrammes and based on all the interpretation statements of the teachers. When looking at diagrammes of change of state (see Figure 4), none of the participants noticed details such as: for melting, the arrow direction is from the solid form to the liquid form. None noticed that for sublimation, the arrow direction is from the solid form to the gas form, and none noticed details such as that all molecules are blue (for example, diagram 2). They tried to explain the subject of change of state. Most of them also tried to find wrong sights of the subject (change of state).
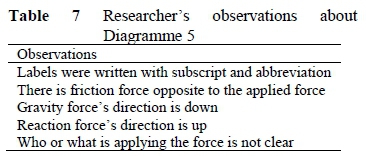
When teachers were shown the force diagrammes (see Figure 5), none of the teachers noticed the arrows' directions. Most of them attempted to find wrong features of these diagrammes. Some only mentioned visual aspects that attracted their attention. Most of the teachers tried to explain this physics topic when Figure 5 was showed. Some of the non-science teachers said that they did not know this subject, and so they could not notice anything. Some of them only wrote one word, such as 'force.'
Most of the teachers wanted to explain the principle of simple machines while looking at Figure 6. Some observations about 'pulleys' were poor, some not. None of them noticed colours or arrows.
When looking at electric circuit diagrammes (see Figure 7), none of the participants noticed the electrical current arrow directions. Science teacher participants didn't mention convential current flow direction of electric current. Some of the non-science teachers said that they were not familiar with this subject and so they could not notice anything. Some of them only wrote one word, viz. 'electric.'
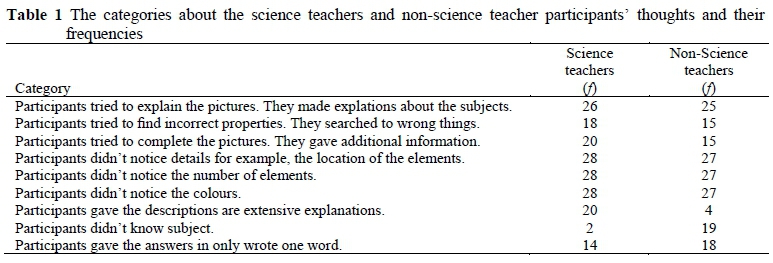
After the open coding phase, axial coding phase was made. This encompasses the process which selects a core category from the open coding possibilities and positioning it at the center of axial coding process as a core category. From among the major categories reproduced from the data, the researchers selected a core category. Participants' thoughts are categorised in Table 1. This table also provides quantitative evidence of the above qualitative data.
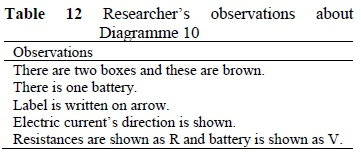
The final process of coding is selective coding, and it includes improving the theory. When looking at physics diagrammes, we can say as a selective code that the science teachers and non-science teachers give similar answers. Though the participants' knowledge changed, what they noticed did not change. For example, for Diagram 10 (see Figure 7), a few science teachers gave answer that the diagramme shows electric current. Some of them explained electric circuit in detail. Non-science teachers gave answer for Diagramme 10 that it shows the electric circuit.
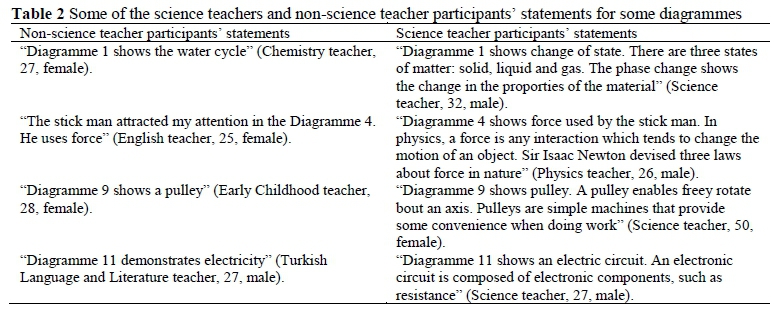
The different and interesting expressions of some science teachers and non-science teachers are also included in the cited images in Table 2.
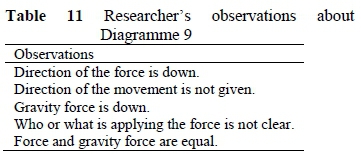
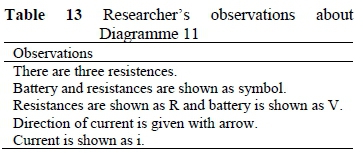
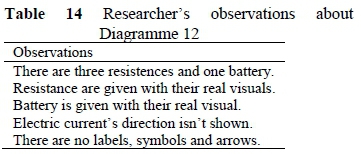
One of the researchers' observations was compared with that of the participants. The researcher's professional field is science education, conducting studies about diagrammes in science education. The researcher focused only on the diagramme features, and not at all on explanations. Some examples of one of the researchers' observations about Diagramme 1 are in Table 3, about Diagramme 2 are in Table 4, and continuing respectively to Diagramme 12 are in Table 14.
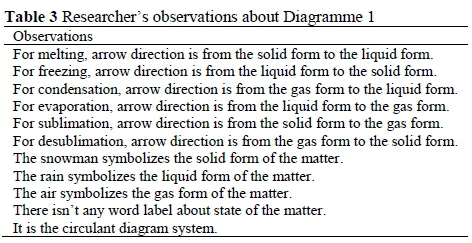
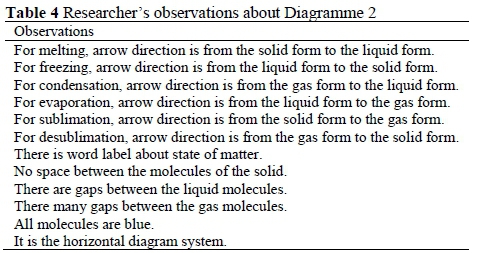
Table 3 indicates the researcher's observations about Diagramme 1. For example, one of the observations is that the snowman symbolises the solid form of matter. None of the participants noticed this point.
Table 4 shows the researcher's observations about Diagramme 2. Neither science teachers nor non-science teachers gave similar responses with the researcher. In this case, the teachers' lack of interpreting diagrammes about basic physics concepts was observed.
The observations of researcher are summarised in Table 5. Both science teachers and non-science teachers did not care Diagramme 3's arrows, labels and colours. The diagrammes provided in this article are black and white. Coloured diagrammes were used during the implementation.
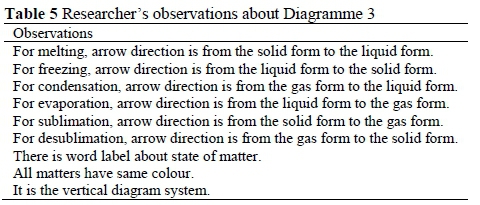
Table 6 indicates researcher's observations about Diagramme 4. In this diagramme gravity force's direction is down and reaction force's direction is up are shown. None of the teachers noticed the directions of the arrows.
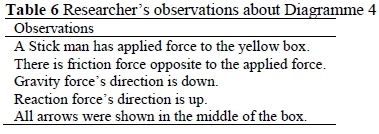
Table 7 has given the researcher's observations. It has emerged that there is no similarity between researcher and teachers' observations. Teachers could not interpret the diagrams as expected.
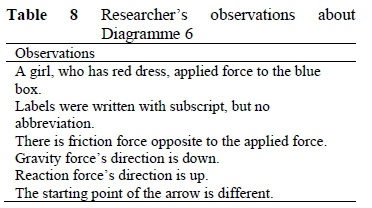
Similarly, Table 8 indicates that researcher's observations about Diagramme 6. In this diagramme, the starting point of the arrow is different but nobody was noticed this point. In addition any teacher was not recognised directions of the arrows.
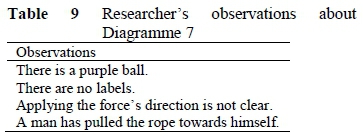
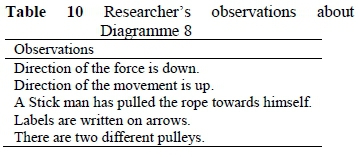
Similar teachers' responses have been encountered during the interpretation of other diagrams. From Table 9 to Table 14 shows researcher's observations.
Discussion and Implications
On examination, science teachers and non-science teachers gave similar answers. It has been observed that only the science teacher cohort provide extended answers. What is important here is that the teachers are aware of the existence of elements necessary for diagramme interpretation. However, when interpreting the diagrammes, the participants in both groups did not notice elements they would have been expected to. Additionally, there are not any differences when it comes to gender and age. Although science teachers and non-science teachers have varied backgrounds about physics subjects, this result is unexpected. This outcome shows that teachers cannot interpret diagrammes correctly. Students generally do not know how to use diagrammes effectively (Gobert, 1994), so it can be inferred that teachers themselves need to know how to read diagrammes properly.
Although there are many diagrammes in textbooks, especially in Turkey, there is no lesson about how diagrammes ought to be interpreted in teacher training faculties. For this reason, teachers may not have paid attention to the elements of diagrammes when encountering them. Another reason may be that teachers do not have the habit of using diagrammes to solve science problems.
One of the most essential tasks of physics diagrams is to generalise various relations between abstract concepts. The use of diagrammes can be a focus of physics, because diagrammes can often connect concepts and inferences in an efficient way (Anzai, 1991). For this reason, interpreting physics diagrammes must be a core subject of physics education. In physics, diagrammes are related to making effective inferences, where the cognitive processing of diagrammes, which is still largely unknown, has been the subject of research (Ericsson & Smith, 1991:86).
Diagrammes serve to create a structural organisation, because they use spatial associations in diagrammatic space, so that people are based on the experience of interpreting spatial relations (Tversky, 2001). They are complex systems, which have simple elements, such as lines, arrows, curves, colour (sometimes), and objects with boundaries (Umdu Topsakal & Oversby, 2013). Interpreting diagrams, in our view, is a comprehensive process, which contains all these elements. This study shows us teachers have problems reading diagrammes. For example, no teachers paid attention to directions of arrows. Arrows are important explanatory diagrammatic elements, viz. lines, boxes, crosses, and circles (Tversky, 2005). Because participants are not careful about such schematic geometric figures, they fail to read diagrams correctly.
Diagrammes are a useful tool for checking and conveying ideas to students. As such, teachers need to know how to read them. Teachers should be given guidance as to how to interpret diagrammes, and how to notice the features of diagrammatic elements. If they have problem with reading diagrammes they can be given in-service training.
Teachers are always at the centre of educational change and teacher professional development is especially important (Esau, 2013; Lau & Yuen, 2013). Indeed, faculties of education have tremendous responsibility to educate teachers. We also recommend that the curriculum ought to contain model-based learning strategies, especially in science education. In this way, pre-service teachers can learn how to use these materials effectively before they graduate. This can benefit them in the future if they learn to work on the understanding of the nature of the diagrammes, and thinking about how these links to explaining the subject knowledge concepts behind them.
This study was conducted with the teachers who were educated in Turkey. International research on this subject is recommended. It is important to identify the shortcomings of the teachers' interpretation of diagrammes. To achieve this, it is first necessary to determine the existence of interpretive deficiencies. This study's findings point to indirect influence on their teacher educators' implementation, contributing to the literature in national and international context.
Diagrammes are frequently used as additional materials in teaching and learning. In this respect, the number of studies in the literature should be increased. In future, surveys ought to be carried out, in other branches of the education, such as chemical, social studies. These ought to relate not only to the effectiveness of diagrammes, but also to the interpretation of pedagogic diagrammes.
Authors' Contributions
Gulbin Ozkan wrote the manuscript and provided data for tables and figures. Unsal Umdu Topsakal conducted the interviews. All authors conducted all qualitative codes and themes and reviewed the final manuscript.
Notes
i. Published under a Creative Commons Attribution Licence.
References
Allan G 2003. A critique of using grounded theory as a research method. Electronic Journal of Business Research Methods, 2(1):1-10. Available at http://citeseerx.ist.psu.edu/viewdoc/download?doi=10.1.1.464.13 84&rep=rep1&type=pdf. Accessed 26 November 2018. [ Links ]
Anzai Y 1991. Learning and use of representations for physics expertise. In KA Ericsson & J Smith (eds). Toward a general theory of expertis: Prospects and limits. New York, NY: Cambridge University Press. [ Links ]
Apple MW 2013. Teachers and texts: A political economy of class and gender relations in education. Oxon, England: Routledge. [ Links ]
Arnold B, Woolley S & Johnson P 2009. Edexcel IGCSE physics. Harlow, England: Pearson Education. [ Links ]
Butcher KR 2006. Learning from text with diagrams: Promoting mental model development and inference generation. Journal of Educational Psychology, 98(1):182-197. https://doi.org/10.1037/0022-0663.98.L182 [ Links ]
Cheng PCH, Lowe RK & Scaife M 2001. Cognitive science approaches to understanding diagrammatic representations. Artificial Intelligence Review, 15:79-94. [ Links ]
Creswell J 2002. Educational research: Planning, conducting, and evaluating quantitative and qualitative research. Upper Saddle River, NJ: Merrill Prentice Hall. [ Links ]
Cromley JG, Snyder-Hogan LE & Luciw-Dubas UA 2010. Cognitive activities in complex science text and diagrams. Contemporary Educational Psychology, 35(1):59-74. https://doi.org/10.1016/j.cedpsych.2009.10.002 [ Links ]
Davenport JL, Yaron D, Klahr D & Koedinger K 2008. When do diagrams enhance learning? A framework for designing relevant representations. In Proceedings of the 2008 International Conference of the Learning Sciences (Vol. 1). Utrecht, The Netherlands: International Society of the Learning Sciences. Available at http://irydium.chem.cmu.edu/pdf/papers/DavenportICLS08_final.pdf. Accessed 29 November 2018. [ Links ]
Ericsson KA & Simon HA 1993. Protocol analysis: Verbal reports as data (2nd ed). Cambridge, MA: MIT Press. [ Links ]
Ericsson KA & Smith J (eds.) 1991. Toward a general theory of expertise: Prospects and limits. New York, NY: Cambridge University Press. [ Links ]
Esau O 2013. Preparing pre-service teachers as emancipatory and participatory action researchers in a teacher education programme [Special issue]. South African Journal of Education, 33(4): Art. #828, 10 pages. https://doi.org/10.15700/201412171327 [ Links ]
Fiore SM, Cuevas HM & Oser RL 2003. A picture is worth a thousand connections: The facilitative effects of diagrams on mental model development and task performance. Computers in Human Behavior, 19(2):185-199. https://doi.org/10.1016/S0747-5632(02)00054-7 [ Links ]
Frederiksen JR 1992. Learning to "see": Scoring video portfolios or "beyond the hunter-gatherer" in performance assessment. Paper presented at the annual meeting of the American Educational Research Association, San Francisco, 20-24 April. [ Links ]
Glaser BS & Strauss AL 1967. The discovery of grounded theory: Strategies for qualitative research. London, England: Weidenfeld and Nicolson. [ Links ]
Gobert JD 1994. Expertise in the comprehension of architectural plans: Contribution of representation and domain knowledge. PhD dissertation. Toronto, Ontario: University of Toronto. [ Links ]
Gobert JD 2000. A typology of causal models for plate tectonics: Inferential power and barriers to understanding. International Journal of Science Education, 22(9):937-977. https://doi.org/10.1080/095006900416857 [ Links ]
Gobert JD & Clement JJ 1999. Effects of student- generated diagrams versus student-generated summaries on conceptual understanding of causal and dynamic knowledge in plate tectonics. Journal of Research in Science Teaching, 36(1):39-53. https://doi.org/10.1002/(SICI)1098-2736(199901)36:1%3C39::AID-TEA4%3E3.0.CO;2-I [ Links ]
Gyselinck V & Tardieu H 1999. The role of illustrations in text comprehension: What, when, for whom, and why? In H van Oostendorp & SR Goldman (eds). The construction of mental representations during reading. Mahwah, NJ: Lawrence Erlbaum Associates. [ Links ]
Harrison AG & Treagust DF 2000. A typology of school science models. International Journal of Science Education, 22(9):1011-1026. https://doi.org/10.1080/095006900416884 [ Links ]
Heckler AF 2010. Some consequences of prompting novice physics students to construct force diagrams. International Journal of Science Education, 32(14):1829-1851. https://doi.org/10.1080/09500690903199556 [ Links ]
Heiser J & Tversky B 2006. Arrows in comprehending and producing mechanical diagrams. Cognitive Science, 30(3):581-592. https://doi.org/10.1207/s15516709cog0000_70 [ Links ]
Jackson J, Dukerich L & Hestenes D 2008. Modeling instruction: An effective model for science education. Science Educator, 17(1):10-17. Available at https://files.eric.ed.gov/fulltext/EJ851867.pdf. Accessed 15 November 2018. [ Links ]
Johnstone CJ, Bottsford-Miller NA & Thompson SJ 2006. Using the think aloud method (cognitive labs) to evaluate test design for students with disabilities and English language learners (Technical Report 44). Minneapolis, MN: University of Minnesota, National Center on Educational Outcomes. Available at https://files.eric.ed.gov/fulltext/ED495909.pdf. Accessed 8 December 2018. [ Links ]
Kragten M, Admiraal W & Rijlaarsdam G 2015. Students' ability to solve process-diagram problems in secondary Biology education. Journal of Biological Education, 49(1):91-103. https://doi.org/10.1080/00219266.2014.888363 [ Links ]
Larkin JH & Simon HA 1987. Why a diagram is (sometimes) worth ten thousand words. Cognitive Science, 11(1):65-100. https://doi.org/10.1016/S0364-0213(87)80026-5 [ Links ]
Lau WWF & Yuen AHK 2013. Learning study in mathematics: It is for students, teachers, and teacher educators. The Asia-Pacific Education Researcher, 22(4):377-388. https://doi.org/10.1007/s40299-012-0034-0 [ Links ]
Lowe RK 1989. Scientific diagrams: How well can students read them? Perth, Australia: Curtin University of Technology. [ Links ]
Mathai S & Ramadas J 2009. Visuals and visualisation of human body systems. International Journal of Science Education, 31(3):439-458. https://doi.org/10.1080/09500690802595821 [ Links ]
Mayer RE 2003. The promise of multimedia learning: Using the same instructional design methods across different media. Learning and Instruction, 13(2):125-139. https://doi.org/10.1016/S0959-4752(02)00016-6 [ Links ]
Merriam SB 1998. Qualitative research and case study applications in education. San Francisco, CA: Jossey-Bass. [ Links ]
Schõnborn KJ, Anderson TR & Grayson DJ 2002. Student difficulties with the interpretation of a textbook diagram of immunoglobulin G (IgG)*. Biochemistry and Molecular Biology Education, 30(2):93-97. https://doi.org/10.1002/bmb.2002.494030020036 [ Links ]
Slough SW, McTigue EM, Kim S & Jennings SK 2010. Science textbooks' use of graphical representation: A descriptive analysis of four sixth grade science texts. Reading Psychology, 31(3):301-325. https://doi.org/10.1080/02702710903256502 [ Links ]
Strauss AL & Corbin J 1994. Grounded theory methodology: An overview. In NK Denzin & YS Lincoln (eds). Handbook of qualitative research. Thousand Oaks, CA: Sage. [ Links ]
Tversky B 2001. Spatial schemas in depictions. In M Gattis (ed). Spatial schemas and abstract thought. Cambridge, MA: The MIT Press. [ Links ]
Tversky B 2005. Visuospatial reasoning. In KJ Holyoak & RG Morrison (eds). The Cambridge handbook of thinking and reasoning. New York, NY: Cambridge University Press. [ Links ]
Uesaka Y & Manalo E 2007. Peer instruction as a way of promoting spontaneous use of diagrams when solving math word problems. In DS McNamara & JG Trafton (eds). Proceedings of the 29th Annual Cognitive Science Society. Austin, TX: Cognitive Science Society. Available at https://cloudfront.escholarship.org/dist/prd/content/qt1xf9q095/qt1xf9q095.pdf. Accessed 8 December 2018. [ Links ]
Umdu Topsakal U & Oversby J 2012. Turkish student teachers' ideas about diagrams of a flower and a plant cell. Journal of Biological Education, 46(2):81-92. https://doi.org/10.1080/00219266.2011.572988 [ Links ]
Umdu Topsakal U & Oversby J 2013. What do scientist and non-scientist teachers notice about biology diagrams? Journal of Biological Education, 47(1):21-28. https://doi.org/10.1080/00219266.2012.753102 [ Links ]
Van Es EA & Sherin MG 2008. Mathematics teachers' "learning to notice" in the context of a video club. Teaching and Teacher Education, 24(2):244-276. https://doi.org/10.1016/j.tate.2006.11.005 [ Links ]
Van Meter P & Garner J 2005. The promise and practice of learner-generated drawing: Literature review and synthesis. Educational Psychology Review, 17(4):285-325. https://doi.org/10.1007/s10648-005-8136-3 [ Links ]
Zuldin NNHM 2014. The effect of activating background knowledge strategy through pre-reading activities on lower secondary students. MAAL thesis. Terengganu, Malaysia: Universiti Malaysia Terengganu. Available at http://umt-ir.umt.edu.my/xmlui/handle/123456789/4778. Accessed 11 November 2018. [ Links ]
Received: 4 May 2017
Revised: 3 July 2018
Accepted: 21 December 2018
Published: 28 February 2019

