


Servicios Personalizados
Articulo
 Inglés (pdf)
 Articulo en XML
 Referencias del artículo
Indicadores

Links relacionados
-
 Citado por Google
 -
 Similares en Google
Compartir

 Permalink
South African Journal of Education
versión On-line ISSN 2076-3433
versión impresa ISSN 0256-0100
S. Afr. j. educ. vol.38 supl.1 Pretoria oct. 2018
http://dx.doi.org/10.15700/saje.v38ns1a1596
CALL FOR PAPERS
Reducing bullying in schools by focusing on school climate and school socio-economic status
Lolita Winnaar; Fabian Arends; Unathi Beku
Education and Skills Development Research Programme, Human Sciences Research Council, Pretoria, South Africa lwinnaar@hsrc.ac.za
ABSTRACT
This paper is a secondary analysis, using data from the South African 2015 cycle of the Trends in International Mathematics and Science Study (TIMSS). TIMSS is a trend study that assesses Mathematics and Science achievement and is designed to measure changes in the education system over time. The participants of the study included 12,514 learners from 292 schools, where a national sample of schools and learners are selected, making the study nationally representative. A multiple regression was conducted to respond to the main aims of the study, which is, firstly, to investigate the association between school climate and the prevalence of bullying in schools. Secondly, to determine if the socioeconomic status of the school is associated with incidences of bullying at the school. The results show that learners are less likely to be bullied when they feel a sense of belonging to the school they attend, they are confident, and when they are constantly engaged in the classroom. A significant gender bias exists where boys are bullied more often than girls. It has also been found that students who are often bullied obtain a significantly lower score in Mathematics than their counterparts. The findings demonstrate the need for schools to monitor the nature and frequency of bullying, so that targeted interventions can be designed, implemented and monitored on a regular basis.
Keywords: bullying; school climate; school factors; school violence, South Africa; TIMSS 2015
Introduction
Burton and Leoschut (2013) argue that to some extent, schools are miniature versions of the surrounding community, and hence that the risk factors experienced in the community increases the schools' predisposition to violence in the school environment. In schools globally, approximately 246 million boys and girls are exposed to some form of bullying annually (Greene, Robles, Stout & Suvilaakso, 2013). More frequently, students are becoming desensitised to issues of crime and violence, because these have become a common social feature (Burton & Leoschut, 2013). This is a trend observed globally (Makota & Leoschut, 2016; Organisation for Economic Co-operation and Development [OECD], 2017). Following evidence of widespread incidences of bullying globally, developed and emerging economies need to look closely at strategies that will ensure building strong partnerships between schools, parents and communities, and reducing the negative and enduring impacts of bullying. Education departments have put measures in place in the hope of reducing levels of bullying in schools, however, a more holistic approach is required, where issues of school climate become the focus, since bullying and school-based violence occur mostly in schools with an unhealthy climate (Waasdorp, Pas, O'Brennan & Bradshaw, 2011).
Literature Review
Bullying is an element of school based violence; it involves aggressive behaviour intended to harm an individual who is less dominant physically or psychologically (Mullis, Martin, Foy & Arora, 2012). It has become a topic of international concern over the last 30 years (Smith, 2011), and in this respect, the occurrence of bullying and violence in South African schools is not isolated. Studies like TIMSS have shown increased levels of bullying in schools (Reddy, Prinsloo, Arends, Visser, Winnaar, Feza, Rogers, Janse van Rensburg, Juan, Mthethwa, Ngema & Maja, 2012) from 16 per cent in 2003 to 28 per cent in 2011 (Mullis et al., 2012), with a slight drop of two percent, seen in 2015 (Zuze, Reddy, Visser, Winnaar & Govender, 2018). TIMSS, being an international study, with a methodology that allows for cross country comparisons, shows that the percent of learners exposed to bullying in South Africa is double that of the international average (Mullis, Martin, Foy & Hooper, 2016). Furthermore, the Council for Justice and Crime Prevention found that not much has changed in terms of bullying in South African schools, since their previous school violence study was completed in 2008 (Burton & Leoschut, 2013).
Studies like the TIMSS found significant associations between bullying and Mathematics achievement (Mullis et al., 2012), with average score differences of 68 more points for those learners who have very little or no exposure to incidences of bullying in school (Reddy, Visser, Winnaar, Arends, Juan, Prinsloo & Isdale, 2016). This is an important finding, since academic achievement is a vital indicator to measure in order to track learners' successful progress through the education system (Frempong, Reddy & Kanjee, 2011).
The relationship between bullying and school climate
Researchers such as Catherine Bradshaw, Clifford Shaw, Henry McKay, Chiaki Konishi and Sara Laftman have noted that school climate is related to bullying (Konishi, Miyazaki, Hymel & Waterhouse, 2017; Laftman, Östberg & Modin, 2017; Mitchell, Bradshaw & Leaf, 2010; O'Brennan Bradshaw & Sawyer, 2009; Shaw & McKay, 1942). Whilst definitions differ across various studies, there is agreement that school climate is a multi-dimensional index of the school's intangible factors that represent the overall social atmosphere of the school. These intangible factors include emphasis on academic success, disciplinary problems, incidences of bullying and challenges faced by teachers (Mullis et al., 2012). Low incidences of bullying are a result of a healthy school climate. In contrast, high incidences of bullying are a result of an unhealthy school climate (Finn, 1989; Mullis et al., 2012; Shaw & McKay, 1942). These results are corroborated by recent research, which found that schools with a healthier school climate (emphasis on academic success, fewer disciplinary problems, fewer incidences of bullying, and fewer challenges faced by teachers) had higher average achievement scores (Zuze et al., 2018). Lower incidences of bullying are also associated with commanding stances to school discipline, a greater sense of belonging, high levels of achievement and peer encouragement (Wang, Vaillancourt, Brittain, Mc-Dougall, Krygsman, Smith, Cunningham, Haltigan & Hymel, 2014).
In analysing the relationship between bullying and school climate, the study operationalises the Social Disorganisation Theory and the Identification and Participation Model. Researchers (Bradshaw, Sawyer & O'Brennan 2009; Konishi et al., 2017) have expanded on how a poor school climate can have an adverse effect on bullying.
According to the Social Disorganisation Theory (Shaw & McKay, 1942) particular school-level factors, such as school discipline and safety and school emphasis on academic success, are important indicators of school climate. Additionally, school climate is inversely related to bullying (Bradshaw et al., 2009). Moreover, a negative school climate is related to high levels of bullying (Laftman et al., 2017; Mitchell et al., 2010; O'Brennan et al., 2009; Shaw & McKay, 1942).
Similarly, the Identification-Participation model (Finn, 1989) suggests that school climate and peer groups facilitate a sense of identification and participation, which in turn results in a positive school climate (Finn, 1989). A positive school climate encourages positive interaction between peers and teachers. According to Finn (1989), students need to identify with the school; feel that they belong to the school; and believe they are welcomed, respected and valued by others.
Conversely, a school with a negative school climate is characterised by fear and intimidation and has harmful implications for student engagement and learning (Finn, 1989). Furthermore, the Identification-Participation model notes that bullying victims often lack a sense of belonging, and they feel unsupported and unwelcomed by both their peers and the teachers. This results in a process of disengagement that is characterised by low self-esteem, social anxiety, social avoidance, absenteeism and academic withdrawal (Finn, 1989). Studies by other researchers found similar results (Brand, Felner, Shim, Seitsinger & Dumas, 2003; Goodenow & Grady, 1993; Ma, 2003; Springer, Cuevas Jaramillo, Ortiz Gómez, Case & Wilkinson, 2016).
In light of these findings, it is not surprising that the TIMSS results found significant associations between bullying and Mathematics achievement (Mullis et al., 2012), with average score differences of 68 points higher for learners who have very little or no exposure to incidences of bullying in school (Reddy et al., 2016).
The relationship between bullying and socioeconomic status (SES)
While bullying across schools is a widespread phenomenon, there is evidence that schools with a low SES experience higher incidences of bullying compared to medium and high SES schools. Studies have documented that schools with a low SES experienced higher incidences of bullying and discipline problems compared to schools with medium and high SES (Jansen, Verlinden, Dommisse-Van Berkel, Mieloo, Van der Ende, Veenstra, Verhulst, Jansen & Tiemeier, 2012; O'Brennan et al., 2009; Wolke, Woods, Stanford & Schulz, 2001).
Low SES schools experience resource scarcity and competing interests thus school leadership has to decide which interests to prioritise amidst these competing interests. As a result, intangible school factors often receive little to no attention (Jansen et al., 2012; O'Brennan et al., 2009; Wolke et al., 2001). A South African study by Zuze, Reddy, Juan, Hannan, Visser and Winnaar (2016) found similar results. They found that more than half of learners attending low SES schools stated some form type of bullying on a weekly basis (Zuze et al., 2016).
In South Africa, the National Norms and Standards for School Funding (NNSSF) policy is used to assign funds to schools to address equity in schools (Dass & Rinquest, 2017). The Department of Basic Education has demarcated all schools in the country into five poverty rankings, based on physical and infrastructural resources of the school and the area surrounding the school, (Dass & Rinquest, 2017) in order to adequately assign public funds to schools (Department of Education, 2006). As part of the government's pro-poor strategy to support education, schools in the first three poverty rankings, referred to as no-fee public schools, receive subsidies that make it possible to exempt learners from paying fees. The fourth and fifth ranking are referred to as fee-paying schools (Dass & Rinquest, 2017). For the purposes of this study, these two Department of Basic Education (DBE) assigned poverty rankings for public schools will be used as a proxy for the socio-economic status of the school (Van der Berg, 2008).
Socio-economic status of the school has been measured by a number of different authors in a number of different ways. The most common way is an aggregated measure of the home SES measure to the school level which is often composed of resources in the home (Lim & Gemici, 2011; Taylor & Yu, 2009), parental education (Lim & Gemici, 2011), and parental income (McKenzie, 2003); to mention a few. Research determining associations between SES and bullying with some findings showing no significant associations (Veenstra, Lindenberg, Oldehinkel, De Winter, Verhulst & Ormel, 2005), and some showing significant relationships (Wolke et al., 2001).
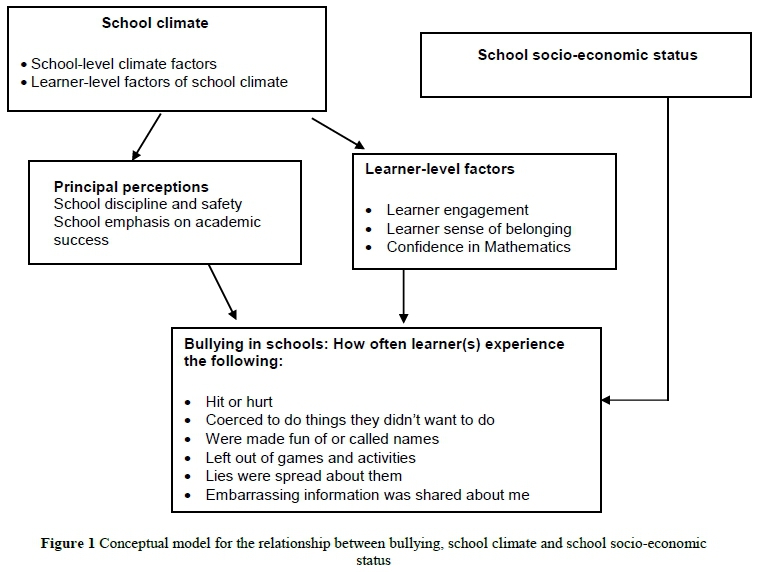
Conceptual Framework for Bullying, School Climate and School Socio-Economic Status
Following the work of Finn (1989), Mullis et al. (2012) and Shaw and McKay (1942), we take into account principal and learner perceptions of school climate as well as the SES of the school as factors that contribute to incidences of bullying in schools. School climate is defined as the intangible factors that make up the health of the schooling environment (Mullis et al., 2012). A school with a healthy climate is characterised by safety and orderliness, and high emphasis on academic success. Learners feel as though they belong to the school, they have confidence in their ability and are engaged within the classroom. As a result, a healthy school climate is characterised by low levels of bullying within the school (Finn, 1989; Mullis et al., 2012; Shaw & McKay, 1942).
Schools that have low levels of bullying are also characterised by a high Socio-Economic Status. They are well resourced, secure and can promote an engaged learning environment. Figure 1 displays the relationship amongst bullying, school climate and school socio-economic status.
Research Question
The aims of the current paper are twofold namely; to determine the school climate factors, from the perceptions of both the learner and principal, that would reduce incidences of bullying in schools. Secondly, to determine if incidences of bullying are higher depending on the socio-economic status of school that learner attend. These aims will be addressed by responding to the following research questions:
1. How are learner perceptions of school climate associated with incidences of bullying in schools?
2. How are principal perceptions of school climate associated with incidences of bullying in schools?
3. How do incidences of bullying vary for schools from different school socio-economic status (SES)?
Method
Data Source and Sample
This paper utilises data extracted from the TIMSS South Africa study which was conducted in 2015 by the International Association for the Evaluation of Educational Achievement (IEA). TIMSS is a trend study that measures Mathematics and Science performance and conducted every four years, with the main purposes being to track the performance of a country's education system over time.
Learner assessment tests, which were closely aligned to the South African curriculum, were administered to the learners for both Mathematics and Science. Contextual questionnaires were administered to learners, class teacher and principals of the sampled schools which served as rich information to describe the context of schooling.
Using IEA-designed software for sampling; TIMSS uses a stratified two-stage random sampling design in which a sample of schools is selected at the first stage. At the second stage an intact Grade Nine class is randomly selected across Grade Nine classes in each of the sampled schools. Intact classes are selected because TIMSS pays close attention to issues of classroom practices and experiences. The realised sample consisted of 292 schools and approximately 12,514 learners were selected and stratified by language of instruction (English, Afrikaans and dual medium schools), province, and type of school (public or independent).
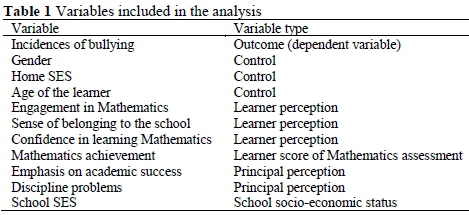
Variables Included
The variables included in the analysis were selected as either controls, or were selected from scales created by the International Association for the Evaluation of Educational Achievement (IEA); which were included in the analysis as continuous variables (see Table 1). Each of the IEA scales were composed of a number of statements that the principals and learners were asked to respond to, and which, when combined, measured a single underlying construct. These scales were created using Item Response Theory (IRT) scaling methods. Details on how the scales were developed is provided in the Methods and Procedures report (Martin, Mullis & Hooper, 2016). The following section mentions the scales considered as part of the analysis, as well as the statements included in each scale.
Outcome variable
Learners were asked to respond to nine statements asking how often they experienced different types of bullying in schools. The set of questions were based on a Likert scale which ranged from 'at least once a week' (Code 1) to 'never' which was assigned a code four. Learners were asked how often they were made fun of, if they were intentionally excluded from games, whether rumours were spread about them, something that they owned was stolen, whether they were hit or hurt, forced to do things they were not comfortable with, etc. Each of these was reverse coded so that a higher value would indicate being bullied more often. When combined, these statements provided a Cronbach's Alpha of 0.78, which is an indication that the scale is reliable. A Principal Component analysis using Statistical Package for the Social Science (SPSS) was performed to create a single indicator that measured incidence of bullying in schools and explained 37% of the variance.
Independent variables
Variables included as controls
The variable extracted from the learner questionnaire was learner gender - a dichotomous variable -with boys coded as 1 and girls coded as zero.
Home Socio-Economic Status (SES) was a scale comprised of various resources in the home. SES was a continuous variable standardised to a mean of zero and a standard deviation of one.
Age was also considered, and a dichotomy was created that compared age appropriate learners to all other learners.
Learner school climate variables
Learners were also asked to respond to statement pertaining to their school environment. Using learners' responses to these statements three scales were created and included in the analysis; the first focused on learner engagement in Mathematics lessons, and included 10 statements that asked learners to what extent they were in agreement with the statement regarding their Mathematics lessons. The responses ranged from a code of one (agree a lot) to a code of four (disagree a lot). The variables included in this scale were reversed coded, so that high values indicate high levels of engagement. The set of statements enquires about teacher classroom practices from the learners' perspective and the construct was reliable with a Cronbach's Alpha of 0.86. Some of the statements included were whether the learner considers the teacher easy to understand, feels that the teacher always ensure that the learners are academic stimulated, the teacher is innovative when assisting learners grasp what is being taught, the teachers listens to what the learner has to say, etc.
The second scale was learners' sense of belonging, which included seven statements, where learners were asked about the extent to which they agreed or disagreed with the statements. The response options ranged from "Agree a lot" coded as 4 to "Disagree a lot" coded as 1. The scale was reliable with a Cronbach's Alpha of 0.72. The statements learners were asked to respond to focused on how they felt about the school they attend, its environment and relationships with other learners and teachers.
The third scale looked at learner confidence in learning Mathematics. It included nine statements and asked students the extent to which they agreed or disagreed with statements like how well they do in Mathematics, whether Mathematics is more difficult for the learner than other learners in their class, how comfortable they are learning Mathematics, etc. The scale was reliable with a Cronbach's Alpha of 0.78
Principal school climate variables
The fourth scale included focused on discipline problems that might occur in schools. A high value indicated a school that had very little or no discipline problems and a low value indicated a school with serious problems with discipline. The scale included statements like late arrival at school, absenteeism, dishonesty, vulgarity and theft, verbal abuse, physical injury, etc. The scale was reliable with a Cronbach's Alpha of 0.91.
The emphasis that schools place on academic success was added to the model and principals were asked to respond to 13 statements, which ranged from low emphasis to very high emphasis. The scale was reliable with a Cronbach's Alpha of 0.89 and included statements that focussed teacher knowledge of the curricular, successful implementation of the curricular, expectation of academic achievement, parental involvement in the academics of their children, learners desire to do well and reach academic goals, etc.
School socio-economic status
In order for the DBE to adequately allocate financial resources to public schools in South Africa, provinces were required to categorise schools into five quintiles, which is defined as the poverty ranking of the school. The poverty ranking that schools received was dependent on the poverty level of the community surrounding the school. Quintile one was assigned to schools that were poor and quintile five referred to wealthier schools.
The department refers to the first three quintiles as no-fee paying schools since parents whose children attend these schools are exempt from paying school fees. Schools categorised as quintile four and five are referred to as fee-paying schools. Learners who attend these schools are expected to pay school fees.
For the current analysis these categorisations will serve as proxies for SES of public schools. No-fee will be referred to as 'low SES public schools' and fee-paying was referred to as 'high SES public schools. ' An additional category was included in the analysis to refer to the independent schools' sector in South Africa which are schools recognised by the DBE but is managed by an independent body.
Data Analysis
To test the association between school climate and students being bullied, a multiple regression analysis was performed using SPSS version 24 and IEA International Database (IDB) Analyzer (version 4.0). IDB Analyser was designed by the IEA to assist with the analysis of large-scale survey data that follows a complex sampling design and employs plausible value techniques when dealing with student achievement the multiple regression assumptions were tested and met. These assumptions included: testing for multicollinearity between independent variables, uncorrelated residuals and that the residuals are normally distributed.
Listwise deletion was used to handle missing data and hence the analysis included 11,785 of the 12,514 learners.
Results
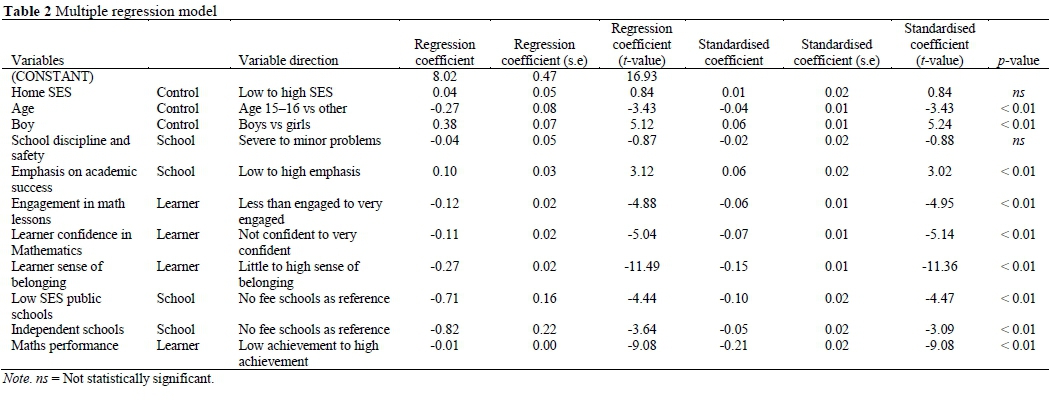
Table 2 presents the results of the multiple regression analysis done on the association between school factors and bullying. The selected learner and school factors explained 13.5% of the variance in the bullying scale.
The column "Standardised Coefficients (t-value)" provides the /-statistics, which refers to the strength of the relationship between the dependent and independent variables. A higher value indicates a stronger association. In order of highest to lowest value, the results show that learner sense of belonging (t = -11.36) has the strongest relationship, followed by: average Mathematics achievement (t = -9.08); learner confidence (t = -5.14); learner engagement (t = -4.95); the type of school that learners attend (t (high SES public schools) = -4.47; t (independent schools) = -3.09); and finally, the emphasis placed on academic success (t = -3.02).
The results show that two of the three control variables considered were significantly associated with learners who are bullied more often. Home SES was not significantly associated with bullying, however, learners who are age appropriate for the grade are bullied less often (β = -0.272, p < 0.01). A significant gender difference with respect to bullying was observed, with boys being bullied more often than girls (β = -0.272, p < 0.01).
High SES Public Schools
Learners are less likely to be bullied if they feel that they belong at the school. The results show that higher levels of belonging are associated with a lower incidence of bullying in schools (β = -0.27, p < 0.01).
A strong association is observed with average Mathematics performance and bullying in schools (β = -0.01, p < 0.01): learners who are bullied often obtain a significantly lower score than that of learners who are bullied less often or never bullied.
Learners who are confident (β = -0.11, p < 0.01), and who are always engaged in their lessons (β = -0.12, p < 0.01), are less likely to be bullied than learners who are neither confident nor engaged in their lessons.
The scale pertaining to the extent to which discipline is a problem in schools is not significantly associated with the occurrence of bullying in schools.
The emphasis that a school places on academic success is also important, as clear academic expectations are set that learners need to achieve.
The results show that schools that place a higher emphasis on academic success have a lower occurrence of bullying in schools (β = -0.10, p < 0.01).
The type of school that learners attend also makes a difference, with learners who attend high SES public schools (β = -0.71, p < 0.01) and independent (β = -0.82, p < 0.01) schools being bullied less often than learners who attend low SES public schools.
Discussion
Schools are an important socialisation force and student-teacher relationships play an important role in affecting both academic and social outcomes (Konishi, Hymel, Zumbo & Li, 2010). The effect of bullying on student peer relationships is inversely associated with school performance, and positively associated with greater school liking, and greater self-direction (Konishi et al., 2010).
The results that will be discussed in this section points to initiatives that need to be established in both the developed and emerging economies to curb the spate of bullying occurring within schools. The aim of this study was to explore the extent to which school level factors explain the prevalence of bullying at schools in South Africa.
The results show that a strong relationship exists between learner sense of belonging and the incidence of bullying at schools. This is in line with findings by Bacchini, Esposito and Affuso (2009) and Waasdorp et al. (2011). Learners who are faced with incidents of bullying often feel like they do not belong at the school and have trouble engaging socially (Thompson, 2018; Underwood & Ehrenreich, 2014). Schools need to make a concerted effort to create an environment where learners and parents feel welcome, and ensure that policies focused on safety and discipline in schools are strongly adhered to.
The adverse association between learner achievement and incidence of bullying at schools has been researched extensively and the results found by many authors (Juvonen, Wang & Espinoza, 2011; Lillis, 2011) concur with the results found in the current paper. Learners who are bullied on a regular basis obtain scores of up to 68 points lower (on average) than learners who are never bullied or almost never bullied (Reddy et al., 2016).
Regarding analysis of learner engagement and confidence, we found results similar to those found by Finn (1989), Goodenow and Grady (1993) and Ma (2003), namely that learners who are more engaged and have confidence in learning Mathematics are less likely to experience bullying. This is also true in terms of learners' sense of belonging.
The SES of the school that a learner attends is strongly associated with the prevalence of bullying at schools. The results show that learners who attend high SES public schools or independent schools experience lower incidences of bullying than learners at low SES schools. This finding concurs with Zuze et al. (2016), who found that the incidence of bullying at public school was higher than at independent schools.
The school is a reflection of the community surrounding it, and that low SES communities are usually higher crime and violence rates which might filter into the schooling environment (Khoury-Kassabri, Benbenishty, Astor & Zeira, 2004; Stewart, 2003). Making it more prone to bullying and school based violence.
Study Limitations
One of the limitations of the study is that it was based solely on self-reported from the learner and the principal contextual questionnaires. The analysis provided some interesting findings that need to be investigated further possibly with an in depth qualitative study. The analysis was limited to the definitions and measures of bullying and school climate included in the TIMSS study. The factors of both bullying and school climate are very broad and it could be possible that the TIMSS measures are not best suited for the South African context. This was however the only data the authors had at their disposal.
Conclusion
In order for learners to have a successful academic career, it is important that they are exposed to environments where emphasis is placed on academic success, where they feel safe, feel like they belong, and are constantly engaged in the classroom. It is in environments like these, often also referred to as schools with a healthy climate, that constructive teaching and learning takes place and issues of bullying are low or non-existent. It is clear from the results that a schools' access to resources also play a role since learners are more likely to be exposed to incidences of bullying in low SES schools than learners who attend higher SES schools. A school is a reflection of the community surrounding the school and strong links have been found between community SES and violent behaviours, in that low SES communities are synonymous with high crime rates. Interventions focused on school climate need to be rolled out in schools with a strong emphasis on creating bully free environments for all learners. However, broader community based changes are important as well so that learners feel safe not just at school, but also in the communities in which they live.
Note
i. Published under a Creative Commons Attribution Licence.
References
Bacchini D, Esposito G & Affuso G 2009. Social experience and school bullying. Journal of Community & Applied Social Psychology, 19(1):17-32. https://doi.org/10.1002/casp.975 [ Links ]
Bradshaw CP, Sawyer AL & O'Brennan LM 2009. A social disorganization perspective on bullying-related attitudes and behaviors: The influence of school context. American Journal of Community Psychology, 43(3-4):204-220. https://doi.org/10.1007/s10464-009-9240-1 [ Links ]
Brand S, Felner R, Shim M, Seitsinger A & Dumas T 2003. Middle school improvement and reform: Development and validation of a school-level assessment of climate, cultural pluralism, and school safety. Journal of Educational Psychology, 95(3):570-588. [ Links ]
Burton P & Leoschut L 2013. School violence in South Africa: Results of the 2012 national school violence study (Monograph Series, No. 12). Cape Town, South Africa: Centre for Justice and Crime Prevention. Available at http://www.cjcp.org.za/uploads/2/7/8/4/27845461/monograph12-school-violence-in-south_africa.pdf. Accessed 4 October 2018. [ Links ]
Dass S & Rinquest A 2017. School fees. In F Veriava, A Thom & TF Hodgson (eds). Basic education rights handbook: Education rights in South Africa. Johannesburg, South Africa: SECTION27. Available at http://section27.org.za/wp-content/uploads/2017/02/Chapter-7.pdf. Accessed 10 March 2018. [ Links ]
Department of Education 2006. Amended national norms and standards for school funding. Government Gazette, (29179), 1-52, August 31. Available at https://www.education.gov.za/Portals/0/Documents/Legislation/Gov%20Not/standards%20for%20school%20funding%20(Gazette%2029179%20Notice%20869).pdf?ver=2008-07-02-142033-727. Accessed 4 October 2018. [ Links ]
Finn JD 1989. Withdrawing from school. Review of Educational Research, 59(2):117-142. https://doi.org/10.3102%2F00346543059002117 [ Links ]
Frempong G, Reddy V & Kanjee A 2011. Exploring equity and quality education in South Africa using multilevel models. Compare: A Journal of Comparative and International Education, 41(6):819-835. https://doi.org/10.1080/03057925.2011.607488 [ Links ]
Greene ME, Robles OJ, Stout K & Suvilaakso T 2013. A girl's right to learn without fear: Working to end gender-based violence at school. Woking, England: Plan International. Available at https://plan-uk.org/file/plan-report-learn-without-fearpdf/download?token=HMORNNVk. Accessed 4 October 2018. [ Links ]
Goodenow C & Grady KE 1993. The relationship of school belonging and friends' values to academic motivation among urban adolescent students. The Journal of Experimental Education, 62(1):60-71. https://doi.org/10.1080/00220973.1993.9943831 [ Links ]
Jansen PW, Verlinden M, Dommisse-Van Berkel A, Mieloo C, Van der Ende J, Veenstra R, Verhulst FC, Jansen W & Tiemeier H 2012. Prevalence of bullying and victimization among children in early elementary school: Do family and school neighbourhood socioeconomic status matter? BMC Public Health, 12:494. https://doi.org/10.1186/1471-2458-12-494 [ Links ]
Juvonen J, Wang Y & Espinoza G 2011. Bullying experiences and compromised academic performance across middle school grades. The Journal of Early Adolescence, 31(1):152-173. https://doi.org/10.1177%2F0272431610379415 [ Links ]
Khoury-Kassabri M, Benbenishty R, Asto RA & Zeira A 2004. The contributions of community, family, and school variables to student victimization. American Journal of Community Psychology, 34(3-4):187204. https://doi.org/10.1007/s10464-004-7414-4 [ Links ]
Konishi C, Hymel S, Zumbo BD & Li Z 2010. Do school bullying and student-teacher relationships matter for academic achievement? A multilevel analysis. Canadian Journal of School Psychology, 25(1):19-39. https://doi.org/10.1177%2F0829573509357550 [ Links ]
Konishi C, Miyazaki Y, Hymel S & Waterhouse T 2017. Investigating associations between school climate and bullying in secondary schools: Multilevel contextual effects modeling. School Psychology International, 38(3):240-263. https://doi.org/10.1177%2F0143034316688730 [ Links ]
Lâftman SB, Östberg V & Modin B 2017. School climate and exposure to bullying: A multilevel study. School Effectiveness and School Improvement, 28(1):153-164. https://doi.org/10.1080/09243453.2016.1253591 [ Links ]
Lillis R 2011. Relationship between bullying and academic achievement and direct and indirect impact of Olweus Bullying Prevention Program: A brief review of literature (Evalumetrics Research Report 2011-2-2). New York, NY: Evalumetrics Research. Available at http://www.evalumetrics.org/files/Olweus_Bullying_Review.pdf. Accessed 20 October 2017. [ Links ]
Lim P & Gemici S 2011. Measuring the socioeconomic status of Australian youth (Technical paper). Adelaide, Australia: National Centre for Vocational Education Research. Available at https://www.ncver.edu.au/data/assets/file/0022/4369/2355.pdf. Accessed 5 October 2018. [ Links ]
Ma X 2003. Sense of belonging to school: Can schools make a difference? The Journal of Educational Research, 96(6):340-349. https://doi.org/10.1080/00220670309596617 [ Links ]
Makota G & Leoschut L 2016. The National School Safety Framework: A framework for preventing violence in South African schools. African Safety Promotion: A Journal of Injury and Violence Prevention, 14(2):18-23. Available at https://www.ajol.info/index.php/asp/article/view/155653/145282. Accessed 1 October 2018. [ Links ]
Martin MO, Mullis IVS & Hooper M (eds.) 2016. Methods and procedures in TIMSS 2015. Chestnut Hill, MA: TIMSS & PIRLS International Study Center, Lynch School of Education, Boston College. Available at https://timssandpirls.bc.edu/publications/timss/2015-methods/T15-Methods-and-Procedures-TIMSS-2015.pdf. Accessed 5 October 2018. [ Links ]
McKenzie DJ 2003. Measuring inequality with asset indicators (BREAD Working Paper No. 042). Cambridge, MA: Bureau for Research and Economic Analysis of Development. Available at http://ibread.org/bread/system/files/bread_wpapers/042.pdf. Accessed 5 October 2018. [ Links ]
Mitchell MM, Bradshaw CP & Leaf PJ 2010. Student and teacher perceptions of school climate: A multilevel exploration of patterns of discrepancy. Journal of School Health, 80(6):271-279. https://doi.org/10.1111/j.1746-1561.2010.00501.x [ Links ]
Mullis IVS, Martin MO, Foy P & Arora A 2012. TIMSS 2011 international results in mathematics. Chestnut Hill, MA: TIMSS & PIRLS International Study Center, Lynch School of Education, Boston College/Amsterdam, The Netherlands: International Association for the Evaluation of Educational Achievement (IEA). Available at https://timssandpirls.bc.edu/timss2011/downloads/T11_IR_Mathematics_FullBook.pdf. Accessed 5 October 2018. [ Links ]
Mullis IVS, Martin MO, Foy P & Hooper M 2016. TIMSS 2015 international results in mathematics. Chestnut Hill, MA: TIMSS & PIRLS International Study Center, Lynch School of Education, Boston College/Amsterdam, The Netherlands: International Association for the Evaluation of Educational Achievement (IEA). Available at http://timssandpirls.bc.edu/timss2015/international-results/wp-content/uploads/filebase/full%20pdfs/T15-International-Results-in-Mathematics.pdf. Accessed 5 October 2018. [ Links ]
O'Brennan LM, Bradshaw CP & Sawyer AL 2009. Examining developmental differences in the social-emotional problems among frequent bullies, victims, and bully/victims. Psychology in the Schools, 46(2):100-115. https://doi.org/10.1002/pits.20357 [ Links ]
OECD 2017. How much of a problem is bullying at school? PISA in Focus, 74:1 -5. Available at https://www.slideshare.net/eraser/how-much-of-a-problem-is-bullying-at-school. Accessed 6 October 2018. [ Links ]
Reddy V, Prinsloo C, Arends F, Visser M, Winnaar L, Feza N, Rogers S, Janse van Rensburg D, Juan A, Mthethwa M, Ngema M & Maja M 2012. Highlights from TIMSS: The South African perspective. Cape Town, South Africa: Human Sciences Research Council. [ Links ]
Reddy V, Visser M, Winnaar L, Arends F, Juan A, Prinsloo C & Isdale K 2016. TIMSS 2015: Highlights of mathematics and science achievement of grade 9 South African learners. Cape Town, South Africa: Human Sciences Research Council. Available at http://repository.hsrc.ac.za/bitstream/handle/20.500.11910/10673/9591.pdf?sequence=1&isAllowed=y . Accessed 6 October 2018. [ Links ]
Shaw CR & McKay HD 1942. Juvenile delinquency and urban areas. Chicago, IL: University of Chicago Press. [ Links ]
Smith PK 2011. Bullying in schools: Thirty years of research. In CP Monks & I Coyne (eds). Bullying in different contexts. Cambridge, England: Cambridge University Press. [ Links ]
Springer AE, Cuevas Jaramillo MC, Ortiz Gómez Y, Case K & Wilkinson A 2016. School social cohesion, student-school connectedness, and bullying in Colombian adolescents. Global Health Promotion, 23(4):37-48. https://doi.org/10.1177%2F1757975915576305 [ Links ]
Stewart EA 2003. School social bonds, school climate, and school misbehavior: A multilevel analysis. Justice Quarterly, 20(3):575-604. https://doi.org/10.1080/07418820300095621 [ Links ]
Taylor S & Yu D 2009. The importance of socioeconomic status in determining educational achievement in South Africa (Stellenbosch Economic Working Papers: 01/09). Stellenbosch, South Africa: Department of Economics and the Bureau for Economic Research. Available at http://www.ekon.sun.ac.za/wpapers/2009/wp012009/wp-01-2009.pdf. Accessed 7 March 2018. [ Links ]
Thompson V 2018. Activities to increase the sense of belonging in middle school. Available at http://education.seattlepi.com/activities-increase-sense-belonging-middle-school-6469.html. Accessed 1 October 2018. [ Links ]
Underwood MK & Ehrenreich SE 2014. Bullying may be fueled by the desperate need to belong. Theory into Practice, 53(4):265-270. https://doi.org/10.1080/00405841.2014.947217 [ Links ]
Van der Berg S 2008. How effective are poor schools? Poverty and educational outcomes in South Africa (Center for European, Governance and Economic Development [CeGE] Discussion Paper, No. 69). Göttingen, Germany: Center for European, Governance and Economic Development Research. Available at https://www.econstor.eu/bitstream/10419/32027/1/558658229.pdf. Accessed 30 September 2018. [ Links ]
Veenstra R, Lindenberg S, Oldehinkel AJ, De Winter AF, Verhulst FC & Ormel J 2005. Bullying and victimization in elementary schools: A comparison of bullies, victims, bully/victims, and uninvolved preadolescents. Developmental Psychology, 41(4):672-682. [ Links ]
Waasdorp TE, Pas ET, O'Brennan LM & Bradshaw CP 2011. A multilevel perspective on the climate of bullying: Discrepancies among students, school staff, and parents. Journal of School Violence, 10(2):115-132. https://doi.org/10.1080/15388220.2010.539164 [ Links ]
Wang W, Vaillancourt T, Brittain HL, McDougall P, Krygsman A, Smith D, Cunningham CE, Haltigan JD & Hymel S 2014. School climate, peer victimization, and academic achievement: Results from a multi-informant study. School Psychology Quarterly, 29(3):360-377. [ Links ]
Wolke D, Woods S, Stanford K & Schulz H 2001. Bullying and victimization of primary school children in England and Germany: Prevalence and school factors. British Journal of Psychology, 92(4):673-696. https://doi.org/10.1348/000712601162419 [ Links ]
Zuze L, Reddy V, Visser M, Winnaar L & Govender A 2018. TIMSS 2015 Grade 9 national report: Understanding mathematics and achievement amongst Grade 9 learners in South Africa. Cape Town, South Africa: HSRC Press. [ Links ]
Zuze TL, Reddy V, Juan A, Hannan S, Visser M & Winnaar L 2016. Safe and sound?: Violence and South African education. HSRC Policy Brief, March. Available at http://repository.hsrc.ac.za/bitstream/handle/20.500.11910/9541/9118.pdf?sequence=1&isAllowed=y. Accessed 9 October 2018. [ Links ]

