


Servicios Personalizados
Articulo
 Inglés (pdf)
 Articulo en XML
 Referencias del artículo
Indicadores

Links relacionados
-
 Citado por Google
 -
 Similares en Google
Compartir

 Permalink
South African Journal of Education
versión On-line ISSN 2076-3433
versión impresa ISSN 0256-0100
S. Afr. j. educ. vol.37 no.1 Pretoria feb. 2017
http://dx.doi.org/10.15700/saje.v37n1a1350
ARTICLES
The National Benchmark Test of quantitative literacy: Does it complement the Grade 12 Mathematical Literacy examination?
Natalie le Roux; Kabelo Sebolai
Centre for Educational Testing for Access and Placement, Centre for Higher Education Development, University of Cape Town, South Africa. natalie.leroux@uct.ac.za
ABSTRACT
The National Senior Certificate (NSC) examination in South Africa is a standardised assessment whose main function is to determine whether Grade 12 learners have mastered subject knowledge at the culmination of their secondary education. Alongside this, the National Benchmark Test Project (NBTP) was introduced to develop the National Benchmark Tests (NBTs) that are aimed at assessing the academic readiness of first time entry students to South African universities. This article explores the relationship between these two standardised assessments in the domain of mathematical/quantitative literacy. This is accomplished through a Pearson correlation analysis of 6,363 test scores obtained by Grade 12 learners on the NSC Mathematical Literacy examination and the Quantitative Literacy test of the NBT in 2012. The results reveal a curvilinear relationship between these two sets of results. This indicates that the two assessments are related but not identical, and the paper argues that their complementarity suggests the value of using performance information generated by both for access and placement.
Keywords: academic readiness; mathematical literacy; national benchmark tests; national senior certificate examination; quantitative literacy
Introduction
Concerns about the levels of academic preparedness among first time entrants to universities have been expressed worldwide, particularly since the massification of higher education, which began three decades or so ago (Wilson-Strydom, 2012). In South Africa, these concerns have been magnified by the problematic history of the racially based and unequal schooling system of the apartheid era. The effect of the massification of higher education is relevant to a universal audience, as other developing or emerging countries have faced similar challenges over the years. The main consequence of this development has been that the majority of first time entrants into higher education are under-prepared for academic education, and that a need has arisen for universities to address this challenge. This has burgeoned over past years, and appeals to a global audience. Responding to the perceived under-preparedness of many high school graduates that are admitted for academic study, a number of universities have set up academic development (AD) interventions of various sorts. Universities have also developed assessments of academic readiness alongside the NSC examination to facilitate decision making for access and placement. The NBTP is one such assessment, which was designed to complement the NSC examination and assess levels of academic readiness. The NBT includes tests of Academic Literacy (AL), Quantitative Literacy (QL), and Mathematics. When used for both access and placement, the AL and QL tests are administered to all examinees, while the Mathematics test is administered only for programmes in which mathematical knowledge is required. The NSC Mathematical Literacy (ML) was introduced into the national curriculum in 2006 at Grade 10 level and by 2008, the first group of Grade 12 learners wrote the NSC ML examination. A total of 263,464 of these learners wrote this examination at the end of that year. On the other hand, the NBT QL test was piloted in 2009, with a total of 12,412 examinees writing it that year.
The aim of this paper is to explore the relationship between the NBT QL and NSC ML as two different standardised assessments in the domain of mathematical/quantitative literacy. More specifically, the results on the NBT in QL and the NSC in ML are compared to illustrate the complementarity and differences between the two sets of tests. The paper proceeds as follows: first, it sets out the context of under-preparedness in education in South Africa and the background to the development of the NBTP. It then provides a description of the constructs used in the NSC ML and NBT QL, followed by a correlation analysis of a sample of 6,363 scores for the year 2012. The paper argues that the constructs assessed and results obtained on the NSC and the NBT are not identical, but complementary, and that both sets of tests have a role to play in assessing academic readiness for university study.
Academic Under Preparedness
A 2013 report by Ndebele, Badsh, Figaji, Gevers, Pityana and Scott explores the reasons for the articulation gap between schools and universities, namely "the discontinuity between the exit level of secondary education and the entry level of higher education" (p. 60). The Report notes the general finding that access to and success in higher education is strongly affected by students' socio-economic background, and points out that this is particularly marked in South Africa, since the majority of black students come from low-income families with few financial resources to support the pursuit of higher education. It notes that the South African basic education system, with its history of inequality, is still in disarray, despite the country having gained democracy more than 20 years ago. It also points out that academic success requires formal learning and depends upon whether or not students are able to cope with the academic tasks they are required to complete at university. According to an earlier report (Scott, Yeld & Hendry, 2007:38-39), "the benefits of well-designed educational interventions can be neutralised by lack of motivation, anxiety about personal or financial circumstances, or alienation from the institution". A number of authors share the concern that the schooling system does not adequately prepare high school leavers for university education (Chokwe, 2013; Nel, Troskie-De Bruin & Bitzer, 2009; Ross, 2010), arguing that subjects that are taught at secondary school do not lay a satisfactory academic foundation for students to have a smooth transition to universities. It is against this background that universities have questioned the adequacy of the NSC results as predictors of success. Thus, Cliff, Yeld and Hanslo ((2003:2) state that:
... school-leaving certification has had a particularly unreliable relationship with Higher Education academic performance especially in cases where this certification intersects with factors such as mother tongue versus medium of instruction differences, inadequate school backgrounds and demographic variables such as race and socio-economic status.
Academic under-preparedness is more evident in some disciplines than it is in others. For instance, Ndebele et al. (2013:5) has found that students studying in science disciplines such as mathematics, engineering, and geography tend to arrive at university more academically underprepared than others. Completion rates have been especially low in Engineering and Science degrees and diplomas as well as professional Commerce degrees, all of which have particular significance for economic development. At the time, statistics showed that the completion rates for these qualifications at all South African universities, except the University of South Africa (UNISA), were as follows: Bachelor of Engineering (BEng) (23%); Bachelor of Science (BSc) (23%); Engineering Diplomas (5%); Science diplomas (14%) and four year Commerce degrees (26%) (Ndebele et al., 2013). Beyond the borders of South Africa, a research study conducted by Bauer and Law (2014) found that nearly 42% of first year students who were studying engineering at the University of Idaho were unprepared in their mathematical literacies and that these students had to complete a maths pre-course before they could continue with their regular programme. Similarly, Hourigan and O'Donoghue (2007) reported that Irish students struggled to make the required transition to tertiary level mathematics, because there was a mismatch between their pre-tertiary mathematical experiences and tertiary level mathematics courses.
Across the South African higher education landscape, low levels of academic readiness have resulted in universities putting foundational support measures for first year students in place to help them complete their tertiary education successfully (Butler, 2013). At some universities, these measures have meant that first year lecturers adapt or revise their teaching strategies in order to meet the needs of underprepared students (Jacobs, 2013). At others, the extra support has resulted in extended degree programmes being introduced so that these students are able to complete their courses over an extended period (Ndebele et al., 2013). At still other institutions, such as the University of Cape Town, for example, the need for foundational academic support has seen the establishment of structures like the Numeracy Centre and Academic Development Programme to help students better cope with the demands of academic education. Concerns about the under-preparedness of high school graduates that are admitted for academic study, as well as the predictive capacity of the NSC, have led to interventions that include the development of forms of assessment for academic readiness.
Background to the National Benchmark Tests Project (NBTP)
In the main, the idea of a National Benchmark Tests Project (NBTP) was mooted against the need to identify high school graduates who could benefit from the kind of support referred to in the previous section. The NBTP was an initiative by Higher Education South Africa (HESA), now known as Universities South Africa (USA) in 2005, and currently operates from the Centre for Educational Testing for Access and Placement (CETAP) at the University of Cape Town. Its primary purpose is to measure the post-Grade 12 academic preparedness levels of high school graduates aiming to apply for admission to university. The project works towards achieving this aim by assessing the levels of academic readiness among first time applicants for admission to university in AL, QL and Mathematics. The essence of the NBTP is, in other words, to respond to the following question:
What are the core academic literacy, quantitative literacy and mathematics levels of proficiencies of the school-leaving population, who wish to continue with higher education, at the point prior to their entry into higher education at which they could realistically be expected to cope with the demands of higher education study? (NBTP, 2015:6).
Based on their performance on these tests, examinees are categorised into three levels of proficiency and readiness for higher education study. This information is aimed at helping South African universities make access and placement decisions and as a matter of course, to inform the teaching and learning provisions for students that fall into these categories. The three levels of readiness, the QL benchmarks separating these levels and the teaching and learning provisions proposed for each level are summarised in Table 1 below:
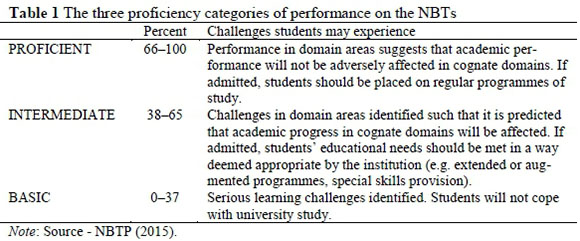
Every three years a standard setting process is conducted in which the benchmarks for the tests are set by academics that are involved in teaching that is related to the QL construct of the NBT from across the South African higher education sector. The benchmarks in Table 1 above are those that were set in May 2009.
The NBTP does not aim to replace the NSC Grade 12 examination. Rather, it is a tool aimed at generating examinee performance in the three domains referred to earlier, against which performance on the NSC examination can be compared and calibrated (NBTP, 2015). The initiative to embark on a national assessment project of this kind suggests that the NSC examination, the tool traditionally used for admitting students to universities, does not provide adequate information about the readiness of these students for academic study and that what the NBTs measure is different from, but in some ways complementary to what is assessed in this examination. Studies (e.g. Dennis & Murray 2012; Marnewick, 2012; Rankin, Schöer, Sebastiao & Van Walbeek, 2012) exploring the relationship between the two assessments already exist. However, questions continue to be raised in the South African Higher Education sector about the relationship between these assessments. This makes peer reviewed studies that justify the use of the NBT as an additional source of information to that generated by the NSC examination an absolute necessity. This paper aims to contribute in this regard. It specifically focuses on demonstrating that the NSC ML examination and the NBT QL test are measures of two constructs that complement rather than duplicate one another. By complementarity, we mean that the two assessments give similar, but additional supporting information to one another. Where the one assessment focuses on achievement at high school, the other assessment looks at the extent to which this achievement equates or does not equate readiness for university education. Investigating whether the two assessments provide different insights with regard to their constructs is the basis for determining whether they support each other. Given the centrality of these two assessments to the present study, a focus on how their constructs have been defined is at first necessary.
The Construct of the NBT QL For the purpose of both measurement and instruction, the NBTP has defined Quantitative Literacy as "the ability to manage situations or solve problems in practice, and involves responding to quantitative (mathematical and statistical) information that may be presented verbally, graphically, in tabular or symbolic form; it requires the activation of a range of enabling knowledge, behaviours and processes and it can be observed when it is expressed in the form of a communication, in written, oral or visual mode" (Griesel, 2006:30). Consistent with this definition, the NBT QL aims to assess examinees' ability to do the following:
• select and use a range of quantitative terms and phrases;
• apply quantitative procedures in various situations;
• formulate and apply simple formulae;
• read and interpret tables, graphs, charts and text and integrate information from different sources;
• accurately do simple calculations involving multiple steps;
• identify trends and patterns in various situations;
• reason logically;
• understand and interpret information that is presented visually (e.g., in graphs, tables, flow-charts);
• understand basic numerical concepts and information used in text, and do basic numerical manipulations;
• competently interpret quantitative information Griesel (2006:30).
The NBT QL test is a criterion-referenced test, which means that it is used to determine whether an examinee has achieved specific mathematical skills. The examinees whose scores were used in the present study wrote different but equated forms of this test on different days between May and December 2012. According to Green (1995), when scores are equated, it does not matter when and which form of a test is written, because the scores would have the same meaning and interpretation. Kolen and Brennan (1995:2) define the equating of scores as "a statistical process that is used to adjust scores on test forms so that scores on the forms can be used interchangeably". The NBT QL test is divided into two sections, each comprising 25 multiple-choice items. Some items are standalone, while others comprise a subset of items, which assess a variety of mathematical/quantitative literacy content. In both sections, the items cover aspects of: 1) quantity, number, and operations; 2) shapes, dimensions and space, 3) patterns, relationships and permutation; 4) rates and change; 5) probability and chance; and 6) data representation and analysis. The QL items cover a range of cognitive levels, through the use of easy to more challenging items. Having presented the NBT QL construct above, the next paragraph presents the NSC ML construct.
The Construct of the NSC ML
The NSC ML was gazetted in November 1998 and became part of the National Curriculum Statement in 2006. Henceforth, all learners who did not take Mathematics as a subject in Grades 10 to 12 were obliged to take ML as a subject. By making ML a compulsory subject, policy makers wanted to ensure that future citizens of South Africa were numerate (Sidiropoulos, 2008). The aim of NSC ML is to assess the school leaver's mastery of this subject for their senior phase of education. To this end, the National Curriculum Statement (Department of Education (DoE), 2003:9) states that
Mathematical literacy provides learners with an awareness and understanding of the role that mathematics plays in the modern world. Mathematical Literacy is a subject driven by life-related applications of mathematics. It enables learners to develop the ability and confidence to think numerically and spatially in order to interpret and critically analyse everyday situations and to solve problems.
The Grade 12 ML examination aims to assess candidates' mastery of specific and basic mathematical literacy skills and the application of these skills in the topics outlined below: Basic Skills
• Interpreting and communicating answers and calculations
• Numbers and calculations with numbers
• Patterns, relationships and representations Application Topics
• Finance
• Measurement
• Maps, plans and other representations of the physical world
• Data handling
• Probability
According to the Department of Basic Education (DBE, Republic of South Africa, 2011) five key elements, underpin ML. These are:
• the use of elementary mathematical content;
• the use of authentic real-life contexts;
• solving familiar and unfamiliar problems;
• decision-making and communication; and
• the use of integrated content and/or skills in solving problems.
The NSC ML examination is norm referenced in that it ranks an examinee in relation to other examinees in terms of their mathematical/ quantitative literacy. The NSC ML is a national examination. All examinees wrote the same test across South Africa in November 2012 as only one form of the test exists. It is a standardised educational test, because the condition in which the test is administered is the same for all examinees. The NSC ML examination is divided into two tests. The first test (Paper 1), also known as the "basic skills" paper, assesses the learner's proficiency in mathematical content and skills. The second test (Paper 2) assesses the learner's ability to apply mathematical and non-mathematical techniques. Both papers cover the same content namely, Finance, Measurement, Maps, Data handling, and Probability at varying taxonomic levels. Paper 1 has five questions, the first four of which address the four content areas while the fifth integrates the five content areas. Paper 2 has between 4 and 5 questions, all of which integrate the content of the 5 content areas. These questions are computational in that they require students to do computations in order to solve a problem to arrive at an answer.
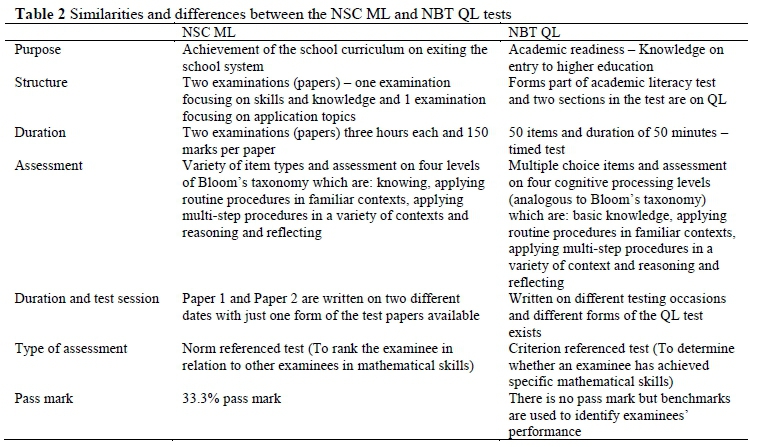
Prior to the analysis intended for this study, a preliminary comparison of characteristic aspects of the NBT QL and NSC ML is in order. This is captured in Table 2 below.
Method
Sample
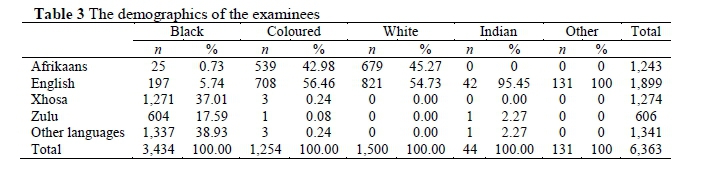
The sample for this study consisted of 6,363 Grade 12 learners that wrote the NBT QL and NSC ML in 2012. Only Grade 12 learners who had scores for the 2012 NSC ML examination and NBT QL were included in the analysis. In other words, a Grade 12 learner who did not have a score on any of the two assessments was excluded from the analysis. Where the examinees had written the NBT QL test more than once, their first test score was used for the analysis. The reason for this was to determine the examinees' quantitative literacy knowledge at first assessment, as subsequent assessment could result in an improvement in performance due to exposure to the first assessment. In addition, examinees who did not indicate their ethnicity/race were placed in the "other" category. The number of Grade 12 learners that wrote the NBT QL (6,363) during the 2012 academic year represents 2.1% of the 291,341 Grade 12 learners who wrote the NSC ML examinations in November 2012. 4,391 (69%) of these examinees were females while 1,972 (31%) were males. The proportion of females in relation to males in the sample was considered unlikely to result in gender bias that could dilute the results of this study, especially because the NBTP annual review processes carried out by panels of experts from South African higher education institutions involves detecting gender bias in the tests, among others.
The demographics of the sample for this study are captured in Table 3 below. The two values in each column represent the number of examinees from a particular race background and the proportion that the group constituted in the total sample.
Data Collection
The data used for the analysis in this study were scores obtained by Grade 12 learners on the NSC ML examination in November 2012 at the culmination of their school career and on the NBT QL between May and December in 2012. The Department of Basic Education in South Africa ensures that the test development process delivers test items for the NSC examinations that are fair, valid and reliable (DBE, Republic of South Africa, 2012). Similarly, the NBTP ensures that its tests are valid and reliable through a similar test development process that involves item development and item review (NBTP, 2015).
Data Analysis
In order to determine whether the NSC ML and the NBT QL tests complement or duplicate each other, the descriptive statistics of the scores obtained by the examinees on the two assessments were first computed. Descriptive statistics provide valuable information about the central tendency, dispersion and distribution of the data and facilitates further interpretation of such data (Neuman, 1997; Pur-pura, Brown & Schoonen, 2015). Secondly, a Pearson correlation analysis of these scores was carried out. Correlation is the conventional way of determining the degree to which performance on two measurement variables associates. The essence of the correlation analysis in the present study, however, was to determine if the two tests classified examinee performance in the same way. In other words, the aim was to determine the degree to which performance on the NSC ML and NBT QL tests classified the same students as Basic, or Intermediate or Proficient, as determined in the NBTP.
Results
The analysis of data was performed using the Statistical Package for Social Sciences (SPSS) version 22. Table 4 shows how the examinees performed on the NSC ML assessment and their corresponding performance on the NBT QL assessment. Examinees can obtain scores between 0% and 100% on the NSC ML assessment. As can be seen from Table 4, of the examinees that scored between 80% and 100% in the NSC ML assessment, only 85 out of a total of 1,452 were classified as Proficient on the NBT QL test. Moreover, 105 of these examinees were classified as Basic by the NBT QL test. It is also worth noting in Table 4, however, that the examinees who performed poorly on the NSC ML examination (< 40%) performed equally poorly on the NBT QL test.
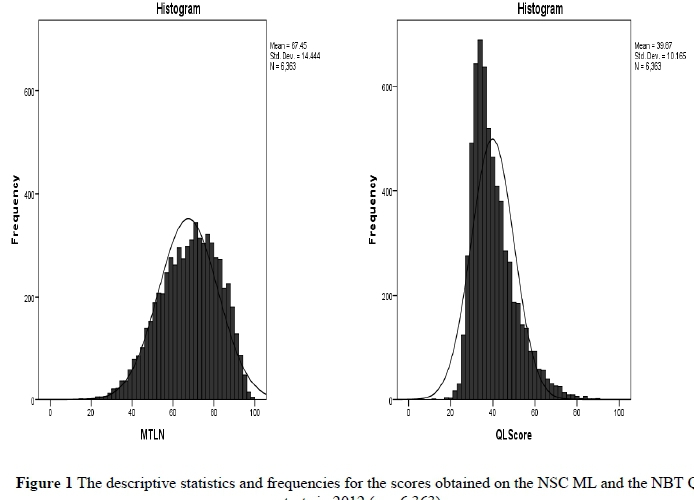
The descriptive statistics and the basic frequencies of the examinees' scores on the NSC ML and NBT QL are depicted in Figure 1.
In Figure 1, the graph on the left represents the examinees' scores and descriptives on the NSC ML examination and the graph on the right represents the examinees' scores and descriptives on the NBT QL test. It is striking how the performance patterns for the two assessments differ. In the NSC ML examination, the examinees performed well, with the mean for this test being 67.5 percent. Most of the scores were between 60% and 85 percent. In contrast, the examinees' scores on the NBT QL test were lower, with a high frequency of examinees scoring between 35% and 45 percent. It is worth noting that the mean for the NBT QL is considerably lower (39.9%) than that of the NSC ML examination (67.5%). The distributions also differ in shape and size. The NBT QL graph is right skewed, with a peaked distribution, whilst the NSC ML graph is left skewed with a flatter distribution. In the discussion section that follows, the reasons for the salient differences between the two assessments will be expanded on further. The results of a correlation analysis of the scores obtained by the examinees on the NSC ML and NBT QL are captured in Table 5.
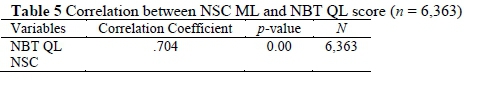
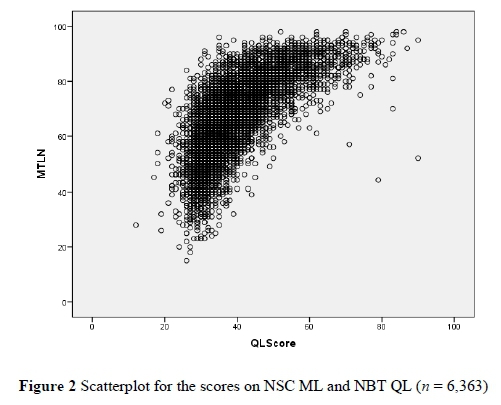
In Table 5, it is clear that the correlation of the scores on the two assessments was high (r = .704) and statistically significant (p = 0.000). As shown in Figure 2, this association was not linear but curvilinear. A curvilinear relationship exists when two variables associate positively up to a certain point, after which their association starts to take a negative turn.
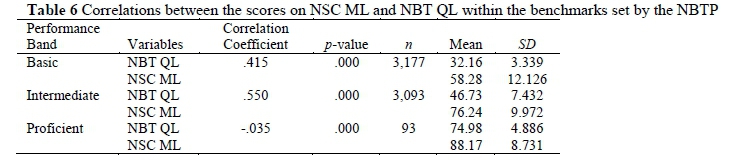
The results of a correlation analysis of the examinees' scores on NSC ML and NBT QL in accordance with the benchmarks that were described earlier in this paper are presented in Table 6.
Based on the examinees' scores on the NBT QL, examinees were placed into one of the three performance categories, namely, Basic, Intermediate and Proficient, as set out by the NBTP. These scores were then matched with the examinees' NSC ML score and three correlational analyses were carried out in SPSS. The results of the correlational analyses are shown in Table 6 and Figure 3.
As pointed out below, in Figure 3, the correlations between NSC ML and NBT QL are depicted for the three NBTP performance categories, namely, Basic, Intermediate, and Proficient. The graph on the left represents the examinees' scores that fell within the Basic performance category on the NBT QL test, and their corresponding scores on the NSC ML examination. The graph in the middle represents the examinees' scores that were in the Intermediate performance category on the NBT QL test, their corresponding scores on the NSC ML examination, and the graph on the right represents the examinees' scores that fell within the Proficient band on the NBT QL test, and their corresponding scores on the NSC ML examination.
As can be seen from Figure 3, the majority of examinees were in the Basic performance category (49.9%), and their NSC ML scores showed large variability, ranging from 20% to 90 percent. As can also be seen from the graph, some examinees performed well on the NSC ML assessment, but performed poorly on the NBT QL assessment, while other examinees performed poorly on both assessments. It is also clear from the graph that the examinees in the Intermediate performance category made up 48.6% of the whole group, and that the variability of the scores was similar to that of those in the Basic performance category. A very small proportion of the examinees (1.5%) were within the Proficient performance category. Of the total number of examinees who scored > 80% in the NSC ML, only 22.8% of these were deemed Proficient in the NBT QL test.
Discussion
As was shown in Figure 1, the mean for the examinees' scores on NSC ML was significantly higher than their mean performance on NBT QL. This means that on average, the latter assessment was more challenging for these examinees than the former. This should be expected for a test like NBT QL, which is more strongly associated with university education, and should logically be more demanding than high school education. As shown in Table 5, the overall correlation of the scores obtained by the examinees on NSC ML and NBT QL was high (r = .704) and statistically significant (p = 0.00). Typically, correlations of above .60 are judged to indicate that two assessments classify examinees in the same way (Dörnyei, 2007). This is not surprising, as it can be accounted for by the evident overlap in the constructs underpinning the two assessments. The scatterplot depicting this correlation shows, however, that the relationship of these variables was curvilinear. A curvilinear relationship means that the two data sets correlated positively up to a certain point in the continuum, after which this relationship begins to move in two opposite directions. Put differently, up to a certain point, the examinees that performed well on one of the assessments tended to perform similarly on the other, where, at some point on the continuum, those who performed well on one assessment started to do the opposite on the other. This curvilinear relationship is depicted in Figure 2 and Table 4. In addition, overall, the mean scores in the three NBT QL performance bands were consistently lower than those of their associated NSC ML scores for the examinees. As can be seen in Table 6, the correlation for the scores on the two assessments falling within the Basic band on the NBT QL was positive (r = .415) and statistically significant (p = .000), but lower than the correlation (r = .704) for all the scores across the three bands. The effect size for the correlation for the scores within that band was medium.
A further look at Table 6 depicts a different picture for the scores in the Intermediate performance band. In this case, too, the mean was high for the scores on NSC ML and lower for those on NBT QL. It is also evident, that the correlation for these scores in the Intermediate band was higher (r = .550) than that for the examinees in the Basic performance band, and that it was also statistically significant (p = 0.00). This means that the majority of the examinees who tended to perform well on one of these assessments tended to do the same on the other, and vice versa. It also means that the two assessments were almost similar in the way they classified the examinees into the Intermediate performance band. The effect size for the correlation of the scores within this band was large.
A final look at Table 6 depicts a different statistical picture for the scores in the Proficient band. In this case, the mean score for NSC ML was slightly higher than that for NBT QL. However, the correlation for these scores was slightly negative (r = -.035) and statistically significant (p = .000). This means that in the main, examinees that performed well on the NSC ML assessment tended to do the opposite on the NBT QL assessment. Thus, for the Proficient band, the two tests tended to classify the examinees differently. This can partly account for the curvilinear shape of the overall relationship of the scores on the two tests depicted in Figure 2. The indication made in Table 2 with regard to the purported similarity of the cognitive levels at which the two assessments are pitched notwithstanding, the differences in the mean scores within all the NBT benchmarks for the participants, as well as the nature and strength of the relationship between their performance on the two assessments within the same performance levels, constitutes evidence of discriminant validity in the constructs underpinning these assessments.
Various reasons can be given for this finding. One possible reason is that Grade 12 learners are encouraged by their teachers to prepare for the NSC ML examination, by using past question papers, which are available in the public domain. The learners are able to prepare themselves for this examination by working through its older versions. By the time they sit for this examination at the end of the year, they are therefore already familiar with the content and format of the NSC ML examination papers. To date, the NBTP does not make any previous QL assessments available to examinees who are consequently not able to practice the type of questions or items that appear in the NBT QL test in advance. Another possible reason is that in the NSC ML examination, a variety of item types are used, and partial credit is awarded. Even though they may not get the item correct, examinees can still obtain marks for the process they have followed to arrive at an answer. The NBT QL test entirely comprises multiple-choice items that must wholly be answered correctly by the examinee for them to receive a point.
The purpose of the two assessments is yet another possible reason for examinees performing well on the NSC ML assessments, and not equally well on the NBT QL test. The NSC ML examination is a norm-referenced test that assesses whether examinees have achieved the objectives of school curriculum and are ranked in relation to their peers, whilst the NBT QL is a criterion referenced test that assesses how well an examinee is ready for academic study. In other words, achievement at high school does not necessarily equate readiness for academic study. Furthermore, NSC ML examinees obtain scores based on their performance in the examination and during the monitoring and quality assurance processes, when such scores may be adjusted upwards or downwards.
Conclusion
The aim of this study was to investigate whether the NSC ML and NBT QL assessments were complementary to one another with regard to determining the quantitative/Mathematical literacy readiness of high school leavers for university education. The development of tests of academic readiness for higher education in South Africa has been a direct response to the under-prepared students (massification of higher education) entering higher education and is a mechanism used to provide additional information to the school leaving examination results.
In particular, the study sought to determine the extent to which the two assessments could classify the examinees into the Basic, Intermediate and Proficient performance levels of the NBTP. The results of the study show that the tests are moderately able to classify examinees whose scores fall in the Basic and Intermediate performance bands in a similar way. In other words, most of the examinees that tended to fall into these bands from their performance on the NBT QL were also classified as such by NSC ML. This implies that in this case, the two tests were moderately measuring almost the same construct to almost the same degree, and that they were therefore complementary with regard to the information they provided. In contrast, a small proportion of examinees (1.3%), 85 examinees out of a total of 1,452, whose performance was 80% or above in NSC ML, were classified as being Proficient by the NBT QL. As revealed by the results of this study, the association between the ways in which the two assessments classified examinees as Proficient was negative. This means that only a small proportion of the NSC ML examinees that obtained > 80% were classified as Proficient, the highest level of quantitative literacy readiness for academic education. From this, one can infer that the two assessments assessed different aspects of mathematical reasoning at the higher end and that the NBT QL was able to provide additional insights about the examinees' mathematical literacy readiness for academic study.
Acknowledgement
We would like to thank Prof. Pam Christie from the School of Education at the University of Cape Town for her valuable advice on this research paper.
Note
i . Published under a Creative Commons Attribution Licence.
References
Bauer DH & Law J 2014. Extended abstract - Developing a first-year engineering supplemental course for students underprepared in Math. Paper presented at the 6th First Year Engineering Experience (FYEE) Conference, Texas, 7-8 August. Available at http://fyee.org/fyee2014/papers/1028.pdf. Accessed 14 December 2016. [ Links ]
Butler G 2013. Discipline-specific versus generic academic literacy intervention for university education: An issue of impact? Journal for Language Teaching, 47(2):71 -88. doi:10.4314/jlt.v47i2.4 [ Links ]
Chokwe JM 2013. Factors impacting academic writing skills of English Second Language students. Mediterranean Journal of Social Sciences, 4(14):377-383. doi: 10.5901/mjss.2013.v4n14p377 [ Links ]
Cliff AF, Yeld N & Hanslo M 2003. Assessing the academic literacy skills of entry-level students, using the Placement Test in English for Educational Purposes (PTEEP). Paper presented at the 10th Biennial Conference of the European Association for Research in Learning and Instruction (EARLI), Italy, 26-30 August. [ Links ]
Department of Basic Education (DBE), Republic of South Africa 2011. National Curriculum Statement (NCS) Curriculum and Assessment Policy Statement. Further Education and Training Phase Grades 10-12: Mathematical Literacy. Pretoria: DBE. Available at http://www.education.gov.za/Portals/0/CD/National%20Curriculum%20Statemen ts%20and%20Vocational/CAPS%20FET%2 0_%20MATHEMATICAL%20LITERACY%20_%20GR%201012%20_%20Web_DDA9. pdf?ver=2015-01-27154330-293. Accessed 21 December 2016. [ Links ]
DBE, Republic of South Africa 2012. National Senior Certificate Examination: Technical report 2012. Pretoria: DBE. Available at http://www.education.gov.za/Portals/0/Documents/Reports/TECHNICAL%20REPO RT%20LQ%2011-01-2013%20-%2012h25.pdf?ver=2013-03-12-225642-000. Accessed 18 December 2016. [ Links ]
Dennis CR & Murray DM 2012. Success in first-year mathematics: School-leaving examinations and first-year performance. South African Journal of Science, 108(7/8): Art. #1325, 3 pages. doi:10.4102/sajs.v108i7/8.1325 [ Links ]
Department of Education (DoE) 2003. National Curriculum Statement Grades 10-12 (General): Mathematical Literacy. Pretoria, South Africa: DoE. Available at http://academic.sun.ac za/mathed/174/NCSML1012.pdf. Accessed 18 December 2016. [ Links ]
Dörnyei Z 2007. Research methods in applied linguistics. Oxford, UK: Oxford University Press [ Links ]
Green BF 1995. Comparability of scores from performance assessments. Educational Measurement: Issues and Practice, 14(4):13-15. doi: 10.1111/j.1745-3992.1995.tb00883.x [ Links ]
Griesel H (ed.) 2006. Access and entry level benchmarks: the national benchmark tests project. Pretoria: Higher Education South Africa. [ Links ]
Hourigan M & O'Donoghue J 2007. Mathematical under-preparedness: the influence of the pre- tertiary mathematics experience on students' ability to make a successful transition to tertiary level mathematics courses in Ireland. International Journal of Mathematical Education in Science and Technology, 38(4):461-476. doi: 10.1080/00207390601129279 [ Links ]
Jacobs C 2013. Academic literacies and the question of knowledge. Journal for Language Teaching, 47(2):127-139. [ Links ]
Kolen MJ & Brennan RL 1995. Test equating: Methods and practices. New York, NY: Springer-Verlag. [ Links ]
Marnewick C 2012. The mystery of student selection: are there any selection criteria? Educational Studies, 38(2):123-137. doi: 10.1080/03055698.2011.567041 [ Links ]
National Benchmark Tests Project (NBTP) 2015. NBTP national report: 2015 intake cycle. CETAP report number 1/2015. Cape Town, South Africa: Centre for Educational Testing for Access and Placement (CETAP), Centre for Higher Educational Development (CHED), University of Cape Town. Available at http://webcms.uct.ac.za/sites/default/files/image_tool/images/216/NBTPReport_2015.pdf. Accessed 18 December 2016. [ Links ]
Ndebele N, Badsha N, Figaji B, Gevers W, Pityana B & Scott I 2013. A proposal for undergraduate curriculum reform in South Africa: The case for a flexible curriculum structure. Report of the task team on undergraduate curriculum structure. Pretoria, South Africa: Council on Higher Education (CHE). Available at http://www.che.ac.za/sites/default/files/publications/Full_Report.pdf. Accessed 16 December 2016. [ Links ]
Nel C, Troskie-De Bruin C & Bitzer E 2009. Students' transition from school to university: Possibilities for a pre-university intervention. South African Journal of Higher Education, 23(5):974-991. [ Links ]
Neuman WL 1997. Social research methods: Qualitative and quantitative approaches (3rd ed). Needham Heights, MA: Allyn & Bacon. [ Links ]
Purpura JE, Brown JD & Schoonen R 2015. Improving the validity of quantitative measures in applied linguistics research [Special issue]. Language Learning: A Journal of Research in Language Studies, 65(S1):37-75. doi: 10.1111/lang.12112 [ Links ]
Rankin N, Schöer V, Sebastiao C & Van Walbeek C 2012. Predictors of academic performance: National Senior Certificate versus National Benchmark Test. South African Journal of Higher Education, 26(3):564-585. [ Links ]
Ross E 2010. Selection tests and social justice: A profile of applicants seeking admission to the social work undergraduate degree at a South African University. Social Work Education: The International Journal, 29(5):459-174. doi:10.1080/02615470903177630 [ Links ]
Scott I, Yeld N & Hendry J 2007. Higher education monitor no. 6: A case for improving teaching and learning in South African higher education. Pretoria, South Africa: Council on Higher Education (CHE). Available at http://www.che.ac.za/sites/default/files/publications/HE_Monitor_6_ITLS_Oct2007_0.pdf. Accessed 16 December 2016. [ Links ]
Sidiropoulos H 2008. The implementation of a mandatory mathematics curriculum in South Africa: The case of mathematical literacy. PhD thesis. Pretoria, South Africa: University of Pretoria. [ Links ]
Wilson-Strydom M 2012. Using the NBTs to inform institutional understandings of 'under- preparedness': Implications for admissions criteria. South African Journal of Higher Education, 26(1):136-152. Available at https://www.researchgate.net/profile/Merridy_Wilson-Strydom/publication/256462233_Using_the_NBTs_to_inform_institutiona l_understandings_of_'under preparedness'_Implications_for_admissions_criteria/links/00463535bce9a7d8b4000000.pdf. Accessed 14 December 2016. [ Links ]

