


Services on Demand
Article
 English (pdf)
 Article in xml format
 Article references
Indicators

Related links
-
 Cited by Google
 -
 Similars in Google
Share

 Permalink
South African Journal of Education
On-line version ISSN 2076-3433
Print version ISSN 0256-0100
S. Afr. j. educ. vol.36 n.1 Pretoria Feb. 2016
http://dx.doi.org/10.15700/saje.v36n1a1142
Non-hierarchical clustering as a method to analyse an open-ended questionnaire on algebraic thinking
Benedetto Di PaolaI; Onofrio Rosario BattagliaII; Claudio FazioII
IDepartment of Mathematics and Informatics, University of Palermo, Italy
IIDepartment of Physics and Chemistry, University of Palermo, Italy onofriorosario.battaglia@unipa.it
ABSTRACT
The problem of taking a data set and separating it into subgroups, where the members of each subgroup are more similar to each other than they are to members outside the subgroup, has been extensively studied in science and mathematics education research. Student responses to written questions and multiple-choice tests have been characterised and studied using several qualitative and/or quantitative analysis methods. However, there are inherent difficulties in the categorisation of student responses in the case of open-ended questionnaires. Very often, researcher bias means that the categories picked out tend to find the groups of students that the researcher is seeking out. In this paper, we discuss an example of application of a quantitative, non-hierarchical analysis method to interpret the answers given by 118 Tenth Grade students in Palermo (Italy), to six open-ended questions about algebraic thinking. We show that the use of non-hierarchical analysis allows us to interpret the reasoning of students solving different mathematical problems using Algebra, and to separate them into different groups, that can be recognised and characterised by common traits in their answers, without any prior knowledge on the part of the researcher of what form those groups would take (unbiased classification).
Keywords: algebraic thinking; cluster analysis; mathematics education; quantitative analysis
Introduction
Extensive qualitative research involving open-answer questionnaires, as well as standardised multiple-choice tests, provide instructors with tools to probe students' conceptual knowledge of various fields of science and mathematics. In recent years, some papers have tried to develop detailed models of the reasoning competences of the student populations tested, or to subdivide a sample of students into intellectually similar subgroups, by using quantitative or qualitative analysis methods (Ayene, Kriek & Damtie, 2011; Bao & Redish, 2006; Cohen, Manion & Morrison, 2000; Fazio & Spagnolo, 2008; Prediger, Bikner-Ahsbahs & Arzarello, 2008; Springuel, Wittmann & Thompson, 2007; Walsh, Howard & Bowe, 2007). In this paper, we discuss the application of a quantitative non-hierarchical clustering analysis method known as k-means (Everitt, Landau, Leese & Stahl, 2011), to make sense of answers given by 118 Tenth Grade students (14-15 years old) from Palermo, Italy, to six open-ended questions on algebraic thinking. It is worth noting that research papers using quantitative analysis methods to study student responses to open-ended questionnaire can be found in physics education (Springuel et al., 2007; Wittmann & Scherr, 2002), but the same cannot be said for research in mathematics education, with some notable exceptions (Gras, Suzuki, Guillet & Spagnolo, 2008).
In this paper, we chose to discuss the use of quantitative analysis methods in the specific domain of Algebra, because, as it is well known, the problem of studying the reasoning of students tackling mathematics problems in algebraic contexts, is relevant in mathematics education. There are many results in the literature devoted to this subject that are obtained by means of qualitative analysis methods (e.g. Arzarello, Bazzini & Chiappini, 2002; Kieran, 2004; Sfard, 1995). They can be compared with our results, in order to verify the real efficacy of the quantitative, non-hierarchical clustering analysis methods we propose.
In particular, we discuss here the results of an empirical study aimed at quantitatively finding the typical behaviours of students in tackling the algebraic resolution of word problems (Bednarz & Janvier, 1996; Boero, 2001; Clement, 1982) and, at the same time, at understanding how the student semantically and syntactically control questions containing symbolici algebraic expressions (Filloy & Rojano, 1989; Radford & Puig, 2007).
Our decision to refer to word problems, according to the Programme for International Student Assessment (PISA), can allow us to study student literacy (PISA) in using algebra (Bohlmann, Straehler-Pohl & Gellert, 2014) and in the transition from arithmetic to the modelling of problems expressed in a not-symbolic language, that, according to Arzarello et al. (2002), we call natural language.
In the next section, we discuss some of the research results obtained in this field. These results will be, then, useful to understanding the results of our quantitative analysis. The main hypothesis of our research is that an analysis of student answers based on the k-means method allows the researcher to safely partition students into groups that can be characterised by common traits in their answers, without any prior researcher knowledge of what form those groups would take. For this reason, we did not perform an a-priori analysis of the student behaviour as is done in other types of research (Brousseau, 1987). Rather, we conducted an a-posteriori analysis that was based on the answering strategies actually used by the students when tackling the problems proposed by the researchers.
The choice to specifically use the k-means method is also due to the fact that this method allows the researcher to visualise the student behaviour in a Cartesian graph that can be quickly and easily read and discussed.
Theoretical Framework on Algebraic Thinking
The complexity in defining the meaning of algebraic thinking is evident. Although many studies done by mathematics educators and historians (Bagni, 2000; Rogers, 2002) have made important contributions to this question (e.g. Arzarello, Robutti & Bazzini, 2005; Boero, 2001; Carraher, Schliemann, Brizuela & Earnest, 2006; Lins & Kaput, 2004; Ursini & Trigueros, 2001), we still don't have a sharp, concise and shared definition of the concept of algebraic thinking. For example, according to (Schoenfeld & Arcavi, 1988) algebraic thinking is a particular form of mathematical reflection. In the following, we briefly report some related literature results.
Some research studies concerning the didactics of algebra discuss how learning to solve problems using symbolic algebraic language problems can be hard for students (Bohlmann et al., 2014; Palm, 2009). Students often have difficulty in working with algebraic equations, and it is hard for them to learn the ways in which the symbols should be manipulated to reach solutions, even in simple equations.
Considering as well the cognitive process used by students in order to solve types of problems containing symbolic expressions, some other researches underline a student's lack of awareness of both the structural and operational aspects (Meyer, 2013) related to this kind of algebraic symbolisation. In this sense, Arzarello et al. (2002) have shown that symbolising is a game of interpretation, where, through a continuous and lengthy process more sophisticated conceptual structures are activated, until the student's stream of thought defines its temporal, spatial and logical features into an act of autonomous thought. A key aspect of this process is the relationship between the signs and terms of an algebraic expression (Radford, 2010).
According to the results reported in the literature, solving a non-algebraic problem with the help of algebra requires a student to represent and re-code this problem with algebraic symbols, and this implies the activation of different paths of reasoning with respect to the resolution of the problem itself (Arzarello et al., 2002).
Some other researchers showed, in fact, that in case of problems expressed into not-symbolic language like, for example, word problems, students often have difficulty presenting the information given in word problems using symbolic language.
Many factors have been found to contribute to these difficulties. Several research studies have identified contextual and grammatical features of word problems that affect students' success in solving them (Bednarz & Janvier, 1996; Chiappini & Lemut, 1991).
According to our specific mathematics subject, related to algebraic thinking, we finally referred to literature results related to the problematic of the transition between arithmetic and algebra, and all the potential errors that may emerge from this crucial mathematical binomial. The passage between arithmetic and algebra is, in fact, another problematic aspect of algebraic thinking (Kieran, 1992). According to Sfard, the content of an algebraic expression is often a generalisation of an arithmetical narrative (Caspi & Sfard, 2012; Sfard, 1995). Thus, the strength of symbolic language not only lies in being able to address arithmetic generalisations, but also in being able to address a pattern or structure, by which one can solve types of problems. This forms the core of the algebraic thinking, but often it isn't mastered by secondary school students, especially in the resolution of problems that are not expressed in symbolic way, as, for example, word problems.
Sample and Questionnaire
The research we describe here is based on the analysis of the answers given by 118 Tenth Grade students from Palermo, Italy, to six open-ended questions on the use of algebraic thinking. The questionnaire, already validated in a previous re-searchii (Benfanti, Di Paola & Raimondi, 2005) was answered by students in a maximum of 45 minutes. It was administered to the students at the beginning of the school year, before any discussion about algebra had taken place. The questionnaire is shown in Appendix A.
Following Clement (1982), as well as Franco de Sá and Fossa (2012), the questionnaire is composed by problems expressed in two different languages, namely natural language and the symbolic language, as typified by algebra.
The first four problems are expressed in natural language, i.e. they present a succession of information given in informal, common life language. Their aim is to evaluate the skills of students in translating a word problem into a symbolic language (Arzarello et al., 2002; Bednarz & Janvier, 1996; Boero, 2001). More specifically, the first two problems have a narrative structure. The third and fourth problem are still expressed in natural language, but are synthetically and explicitly stated.
According to Arzarello et al. (2002), this kind of question could lead the students to not use algebra at all, persisting in the exclusive use of arithmetic methods (i.e. to solve the problems with trial-and-error, numeric methods).
The last two problems are expressed in symbolic language. They are two rather classic algebraic problems, used to study student semantic and syntactic control (Radford & Puig, 2007).
Quantitative Analysis
The quantitative analysis methods that we use in this study are based on clustering techniques. They allow us to partition the students in sub-groups on the basis of their typical behaviour, with respect to the way they tackle the questionnaire.
Cluster Analysis (Everitt et al., 2011) aims at classifying subject behaviours in different groups, or clusters. These can be analysed in order to deduct their distinctive characteristics and to point out similarities and differences between them. The clustering techniques can be divided in two main families, namely hierarchic and non-hierarchic (Everitt et al., 2011). Here, we will discuss only the use of a specific non-hierarchic clustering method, called k-means. We start from the definition of a parameter that can be used to define the "likeness" (or the unlikeness) of the elements in the sample we want to analyse, in our case, the students. As the k-means method is based on geometric considerations, it is natural to use a definition of metric to give a measure of the likeness between two elements. In the next sections we will discuss how to build a correlation coefficient between the elements, and how it can be used to define a distance between students.
Many other techniques are used in the literature to study the likeness of elements in a set. We cite here the likelihood index, first proposed by Lerman (Lerman, 1993), which is at the basis of the Likelihood Linkage Analysis, as well as of the Statistical Implicative Analysis, better known as SIA (Gras et al., 2008). In a way similar to ours, this analysis method allows the researcher to define the likeness of students when answering the questionnaire, and also to build implications between the different answering strategies used by the students.
Categorisation and Codification of Student's Answers
Due to the open-ended nature of the questions, the researchers separately analysed the answers given by each student, trying to examine patterns and trends so as to find common themes emerging from them. Each researcher found typical "answering strategies" used by students when responding to the questions. Then the researchers compared and contrasted their findings, and reached a consensus on a common table of student answering strategies to be used for the subsequent analysis.
As a result of coding and categorisation, a set of M data (the answering strategies) was produced for each of the sample subjects (the N students answering to the questionnaire). As a consequence, each subject, i, can be identified by an array, a, composed by M components 1 and 0, where 1 means that the subject used a given answering strategy to respond to a question, and 0 means that he/she did not use it. Then, a M x N binary matrix (matrix of answers) modelled on the one shown in Table 1, is built. In it, the columns report the N student arrays, ai, and the rows represent the M components of each array, i.e. the M answering strategies.
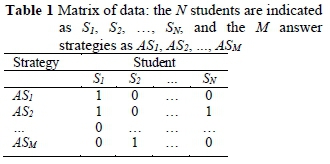
For example, let us say that student S1 used answering strategies AS1, AS2and AS5to respond to the questionnaire questions. The result of this will be that the Si column in Table 1 will contain the binary digit 1 in the three cells corresponding to these strategies, while all the other cells will be filled with 0.
The matrix depicted in Table 1 contains all the information to describe the sample behaviour with respect to the questionnaire. In our case, M = 43 answering strategies were found for the whole set of answers given to the six questions (see Appendix B).
The answers of each student were coded in a 43-dimension array, showing the specific answering strategies used by each student. In order to indicate whether a student used a given strategy to answer a question or not, 1s, or 0s, were respectively placed in the array cells.
Distance Index
In order to analyse the data, we correlated the student answers by means of a modified Pearson coefficient, Rm, and calculated a 'distance' between each student and all the others by using Gower metrics (Gower, 1966).
If we want to deal with two elements identified by non-numerical variables (for example, the arrays atand aj containing the binary coding of the answers of students i and j, respectively), we can use a modified form of the Pearson coefficient, Rm, defined in terms of the properties of the elements (i.e. the numbers of 1s and 0s in the array). A possible definition that we have put forward on the basis of the one used in the field of Econophysics (Tumminello, Micciché, Dominguez, Lamura, Melchiorre, Barbagallo & Mantegna, 2011) is as follows:
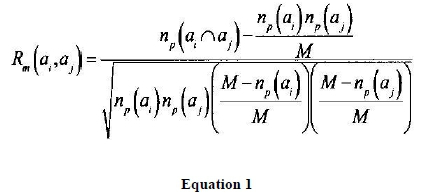
where np(at), nv(aj) are the number of properties of at and aj that we want to take into account, respectively (the numbers of 1s or 0s in the arrays at and aj, respectively), M is the total number of properties to be studied (in our case, the M possible answering strategies) and np( ) is the number of properties common to both ai and aj(the common number of 1s or 0s in the arrays ai and aj).
The choice of the type of metrics to use for the distance calculations is often complex, and depends on many factors. If we want two negatively correlated elements at and aj to be more dissimilar than two elements that are positively correlated (as is often advisable in research in education), a possible definition for the distance between at and aj, making use of the modified correlation coefficient, Rm, between them, is:
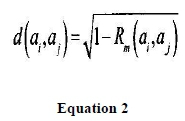
We chose to use this because it is an Euclidean metric (Gower, 1966), as required by the k-means method.
By following Equation 2 we can, then build a new N x N matrix containing all the mutual distances between the students. The main diagonal of this matrix is composed of 0s (the distance between a student and him/herself is zero). Moreover, it is symmetrical with respect to the main diagonal. In fact, our subjects can be represented as points in an N-dimensional space, and each subject, j, is represented as a point whose coordinates are related through Equation 2 to the values in the array, aj.
Not Hierarchical Cluster Analysis The k-means clustering method was used to study the clusters that can be originated from the data space. This method was first proposed by Mac-Queen in 1963 (MacQueen, 1967). In this method, the starting point is the choice of the number of clusters one wants to populate and of an equal number of 'seed points', randomly selected in the two-dimensional space representing the data. It is then necessary to define a procedure to find two Cartesian coordinates for each student, starting from these N distances between them (considering also the distance from him/herself). This procedure consists of a linear transformation between an N-dimensional vector space and a two-dimensional one, and it is well known in the specialised literature as multidimensional scaling (Borg & Groenen, 1997). The subjects are then grouped on the basis of the minimum distance between students and the seed points.
Starting from an initial classification, subjects are transferred from one cluster to another, or are swapped with subjects from other clusters, until no further improvement can be made. The subjects belonging to a given cluster are used to find a new point, representing the average position of their spatial distribution. This is done for each cluster and the resulting points are defined as the cluster centroids. This process is repeated, and ends when the new centroids coincide with the old ones. The spatial distribution of the set elements is represented in a two-dimensional space.
The k-means method needs, at the beginning of the procedure, to arbitrarily define the number of clusters. A specifically designed function, the Silhouette Function (Rousseeuw, 1987) was used to solve this issue. The values of this function allow us to decide whether the partition of our sample subjects in q clusters was adequate, how dense a cluster was, and how well it was differentiated from the others. In other words, this function allows to understand how well each student array lies within a cluster, and, therefore, to decide the number of clusters best fitted to the data distribution. This particular number of clusters corresponds to the maximum of the average value of the silhouette function for the given data distribution.
It is also well known (Stewart, Mille, Audo & Stewart, 2012) that in cluster analysis, the initial position of the centroids critically influences the final results. Different values of a centroid's initial position could lead to different cluster populations.
For this reason, we repeated the cluster calculations for several values of the initial position of each centroid, selecting the configuration that gave the absolute minimum of the sums of the distances between the centroid and its cluster points. One-hundred thousand iterations were performed for each cluster configuration, each with different initial conditions, where the best one can be chosen. In other words, we obtained an absolute minimum of the sums of the distances between the centroid and its cluster points, for each iteration, and chose the minimum value amongst them.
At the end of the calculations, each cluster can be defined by a point representing the centre of the spatial distribution of the elements in the cluster, called the cluster centroid (Leisch, 2006). Our analysis allowed us to find an array for each cen-troid, of the same form as the ones describing the students' answering strategies. We used these arrays to characterise the clusters, as it can be demonstrated that they contained the answering strategies recurring with the maximum frequency in the cluster elements (the students). In fact, we can start from the consideration that the centroid is a geometrical point in our data space that minimises the sum of its distances from all the points (the student profiles) included into the cluster defined by the centroid itself. Minimising this sum means maximising the correlation coefficients between the centroid and the student points (see Equation 2). As a consequence of the definition of the correlation coefficient, this happens when the centroid array is made up of the answering strategies recurring with the maximum frequency in the cluster.
Results
All calculations were performed by using custom software written in C language. The graphical representations were obtained by using the MATLAB software.
By using the method described above, we calculated the values of the silhouette function (see Figure 1), and found that the maximum of its mean value (0.71) is obtained for a partition of our sample in three clusters. For this reason, our data set can be best partitioned, in our analysis, into three clusters.
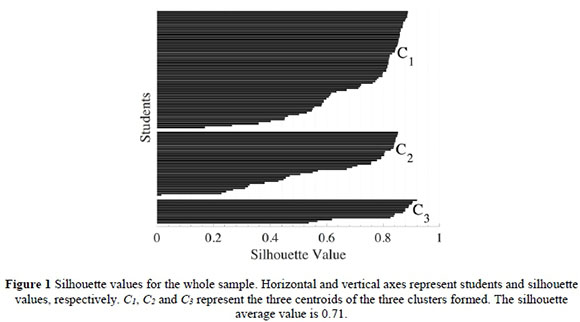
In the graph, each horizontal bar represents a student and the values of the silhouette function are reported on the horizontal axis.
Figure 2 shows the three clusters that best partition our data set and the related centroids. Each point in the Cartesian plane represents a student. Each point is placed according to the calculated mutual distances between the students and by using the multidimensional scaling procedure.
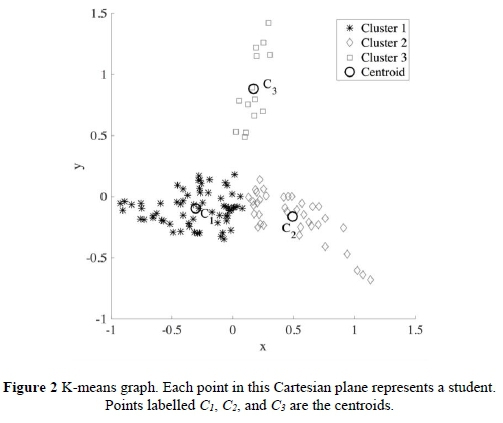
The axes' only function is to show the scale used to place each point in the Cartesian plane, taking into account all the mutual distances between them. In other words, the Cartesian coordinates (x, y) depend on the mutual distance between the students, and do not have a particular meaning. It is worth noting that some points may be placed in the vicinity of different clusters, and may actually represent students that exhibit mixed behaviours. In particular, this happens for some points in Ci cluster and some other in C2 cluster. However, the k-means method anyway classifies these students in a specific cluster and associates them to the general, typical behaviour of the cluster elements. The k-means method should, therefore, be understood as giving global-type information, and must not be considered as a way to study the characteristics of each student in detail.
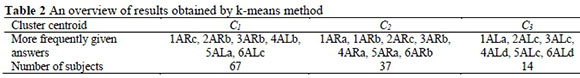
As previously mentioned, the three clusters can be characterised by their related centroids, Ck, (k = 1, 3), which are the three points in the graph. If we connected to each centroid Ck to an array ck, it contains (as demonstrated in the previous section) the answering strategies most frequently applied by subjects in the related clusters (see Table 2). The codes used refer to the answering strategies for the questionnaire described in Appendix B.
We will discuss the pedagogical meaning of these results in the next section.
Discussion and Conclusion
The k-means analysis allowed us to find three clusters that are represented by the three centroids, which describe the average behaviour of the students of the clusters. In the following, we discuss the analysis of the typical behaviour of the students on the basis of the answering strategies found in the centroid arrays. As previously noted, these strategies were not defined a-priori, and are not to be considered as the ideal profiles of students (Fazio, Battaglia & Di Paola, 2013), but are obtained as a consequence of the analysis performed by means of the k-means method.
The cluster represented by centroid C2 is characterised by the following array of answering strategies: 1ARa, 1ARb; 2ARc; 3ARb; 4ARa; 5ARa, 6ARb, found as described above. Upon examination, it appears that they represent a student consistent use of 'low-level' strategies, marked as "a" and "b", respectively. The 37 students in the C2 cluster could be defined as purely arithmetic (Di Paola & Spagnolo, 2010; Malisani, 1992). They appear to be ' weak' students, that use the tools and methods of arithmetic even when these are not well fitted to the question or are formally not correct, as can be seen from the use of strategies 1ARa, 1ARb, 2ARc, 3ARb and 4ARa. This student behaviour, found here by means of quantitative analysis, is in good accordance with the results qualitatively found by Arzarello et al. (2002) and Meyer (2013) and discussed in the theoretical framework Section. Particularly, with reference to Meyer (2013), we find a lack of student awareness with respect to the procedures used, which mainly remain arithmetical. We also find aspects related to the difficulty to translate natural language into a symbolic one, as reported by Arzarello et al. (2002). Another example of this behaviour is the use of arithmetic strategies (5ARa, 6ARb) for the last two questions of the questionnaire, namely the ones posed in symbolic form. These students appear to stay hooked to an arithmetic trial-and-error approach, even when they must solve algebraic expressions. This result is also well described by Sfard (1995) by means of a qualitative analysis, and is typical of algebraic thinking.
The centroid strategies of C2, all arithmetical ones, show that for the students in the cluster, the transition from arithmetic to algebra is difficult. In their qualitative-type research, Benfanti et al. (2005), Cusi, Malara and Navarra (2011) and Malara and Navarra (2003) find this kind of behaviour, and define these students as students that have not even reached a pre-algebraic thinking.
The cluster represented by centroid C3 is the smallest of the three we found (14 students). It groups the few students that demonstrate well-defined algebraic thinking. The centroid is characterised by the following array of answering strategies: 1ALa; 2ALc; 3ALc; 4ALd; 5ALc; 6ALd. All these strategies are algebraic and 'high-level' (marked as "c" or "d"). The students in this cluster make use of algebra in order to model the proposed word problems. Strategies 1ALa, 2ALc, 3ALc, 4ALd show that these students appear to be able to translate natural language into a symbolic one (Arzarello et al., 2002; Caspi & Sfard, 2012).
These strategies show that students in cluster C3 seem to not have too many difficulties in controlling, unlike the results reported by Chiappini and Lemut (1991).
The students also show some confidence when answering Questions 5 and 6. Strategies 5ALc, 6ALd are the proof of this behaviour. According to (Caspi & Sfard, 2012) we can say that the students in this cluster show a good mastery of algebra. Strategies 5ALc and 6ALd highlight the absence of the difficulties found by Bohlmann et al. (2014) and Palm (2009), in students manipulating algebraic symbols.
Finally, the array defining the Ci centroid has the following components: 1ARc; 2ARb; 3ARb; 4ALb; 5ALa; 6ALc. This is the largest students cluster (67 students), and it groups students that put into action mixed arithmetic and algebraic answering strategies. This can be seen by analysing the components described above, which include the use of arithmetic strategies to deal with the first three questions, and the use of algebraic ones for the last two (an example of this is the use of strategies 5ALa and 6ALc) that should suggest an algebraic solution, due to their algebraic formulation. Strategies 5ALa and 6ALc highlight a good accordance with the results of Bohlmann et al. (2014) and Palm (2009), as discussed in the Theoretical framework.
The fourth problem is solved by using an algebraic strategy, although a low-level, and wrong one (4ALb). In fact, these students symbolically write the expression, but then go on by numerically solving it with a trial-and-error procedure, and do not arrive to the correct solution. This can be due to imperfect mastering of the skills required to translate between natural and symbolic language, as also observed in the literature (Bednarz & Janvier, 1996; Benfanti et al., 2005; Boero, 2001).
We also note a coherence in the use of strategies (1ARc, 2ARb) in centroid Ci with respect to questions 1 and 2 (that are similar), and a lack of coherence in the strategies (3ARb and 4ALb) used to answer problems 3 and 4. In fact, the third question, although having the same form as the fourth, was tackled in a completely different way, with the use of arithmetic-type strategies. This last result seems to not be in good accordance with the results discussed in the literature by Arzarello et al. (2002) on the transition from natural language to an algebraic one. An interpretation of these results should call for a deeper analysis, which might take into account simultaneous qualitative and quantitative analysis.
It is worth noting that the cardinality of the cluster defined by C2, is not negligible. This is a result that can underline the complexity, largely discussed in literature (Arzarello et al., 2002; Sfard, 1995), of the didactical aspects related to teaching /learning algebra at this school grade.
In conclusion, we want to underline that the k-means method we used here allowed us to characterise the common traits in the student answers, giving us the opportunity to safely partition them into groups. These groups are characterised by centroids that, as we said before, represent the answering strategies given with maximum frequency by the students who are part of the cluster.
The results we reported here were obtained without any prior researcher knowledge of what form those groups would take, are largely coherent with the ones already reported in the literature, and were obtained by means of qualitative methods. For this reason we can, at least, consider the use of not-hierarchical cluster analysis a valid tool to complement the use of qualitative analysis to study the way of a set of students can be partitioned with respect to the way they answer a questionnaire.
References
Arzarello F, Bazzini L & Chiappini G 2002. A model for analysing algebraic processes of thinking. In R Sutherland, T Rojano, A Bell & R Lins (eds). Perspectives on school algebra (Vol. 22). Netherlands: Springer. doi: 10.1007/0-306-47223-6
Arzarello F, Robutti O & Bazzini L 2005. Acting is learning: focus on the construction of mathematical concepts. Cambridge Journal of Education, 35(1):55-67. doi: 10.1080/0305764042000332498 [ Links ]
Ayene M, Kriek J & Damtie B 2011. Wave-particle duality and uncertainty principle: Phenomenographic categories of description of tertiary physics students' depictions. Physical Review St Physics Education Research, 7(2):020113. doi: http://dx.doi.org/10.1103/PhysRevSTPER.7.020113 [ Links ]
Bagni GT 2000. Dalla storia alla didattica dell'Algebra: il gruppo moltiplicativo di Bombelli. In A Gagatsis, CP Constantinou & L Kyriakides (eds). Learning and assessment in Mathematics and Science. Nicosia: Department of Education, University of Cyprus. Available at http://www.syllogismos.it/history/Bombelli.pdf. Accessed 3 November 2015. [ Links ]
Bao L & Redish EF 2006. Model analysis: Representing and assessing the dynamics of student learning. Physical Review St Physics Education Research, 2(1):010103. doi:10.1103/PhysRevSTPER.2.010103 [ Links ]
Bednarz N & Janvier B 1996. Emergence and development of algebra as a problem-solving tool: Continuities and discontinuities with arithmetic. In N Bednarz, C Kieran & L Lee (eds). Approaches to algebra: Perspectives for research and training. Netherlands: Springer. doi: 10.1007/978-94-0091732-3 [ Links ]
Benfanti D, Di Paola B & Raimondi S 2005. Arithmetical and algebraical approach to the second degree equations (age: 15-19 years). Acta Didactica Universitatis Comenianea. Mathematics, 5:37-52. Available at http://www.researchgate.net/publication/237254525_ARITHMETICAL_AND_ALGEBRAICAL_APPROACH_TO_THE_SECOND_DEGREE_EQUATIONS1_%28AGE_15_19_YEARS%29. Accessed 4 November 2015. [ Links ]
Boero P 2001. Transformation and anticipation as key processes in algebraic problem solving. In R Sutherland, T Rojano, A Bell & R Lins (eds). Perspectives on school algebra (Vol. 22). Netherlands: Springer. doi: 10.1007/0-306-47223-6
Bohlmann N, Straehler-Pohl H & Gellert U 2014. Deconstructing the filtration of reality in word problems. Quaderni di Ricerca in Didattica, 24(Supplement 1: Proceedings of CIEAEM 66):142-145. Available at http://math.unipa.it/~grim/CIEAEM%2066_Pproceedings_QRDM_Issue%2024,%20Suppl.1_WG2.pdf. Accessed 4 November 2015. [ Links ]
Borg I & Groenen PJF 1997. Modern multidimensional scaling: Theory and applications. New York: Springer Verlag. [ Links ]
Brousseau G 1987. Fondements et méthodes de la didactique des mathématiques. Talence: Institut de recherche sur l'enseignement des mathématiques de Bordeaux. [ Links ]
Carraher DW, Schliemann AD, Brizuela BM & Earnest D 2006. Arithmetic and algebra in early Mathematics education. Journal for Research in Mathematics Education, 37(2):87-115. [ Links ]
Caspi S & Sfard A 2012. Spontaneous meta-arithmetic as a first step toward school algebra. International Journal of Educational Research, 51-52:45-65. doi: 10.1016/j.ijer.2011.12.006 [ Links ]
Chiappini G & Lemut E 1991. Construction and interpretation of algebraic models. In Proceedings of the 15th PME Conference. Assisi, Italy. [ Links ]
Clement J 1982. Algebra word problem solutions: Thought processes underlying a common misconception. Journal for Research in Mathematics Education, 13(1):16-30. [ Links ]
Cohen L, Manion L & Morrison K 2000. Research methods in education (5th ed). London: Routledge/Falmer. [ Links ]
Cusi A, Malara NA & Navarra G 2011. Theoretical issues and educational strategies for encouraging teachers to promote a linguistic and metacognitive approach to early algebra. In J Cai & E Knuth (eds). Early algebraization: A global dialogue from multiple perspectives. Berlin, Heidelberg: Springer-Verlag. doi: 10.1007/978-3-642-17735-4 [ Links ]
Di Paola B & Spagnolo F 2010. European and Chinese cognitive styles and their impact on teaching/learning Mathematics. Journal of Mathematics Education, 3(2):139-153. Available at http://www.educationforatoz.org/images/11.Benedetto_Di_Paola_Filippo_Spagnolo.pdf. Accessed 7 November 2015. [ Links ]
Everitt BS, Landau S, Leese M & Stahl D 2011. Cluster analysis (5th ed). New York: John Wiley & Sons, Ltd. [ Links ]
Fazio C, Battaglia OR & Di Paola B 2013. Investigating the quality of mental models deployed by undergraduate engineering students in creating explanations: The case of thermally activated phenomena. Physical Review St Physics Education Research, 9(2):020101. doi:http://dx.doi.org/10.1103/PhysRevSTPER.9.020101 [ Links ]
Fazio C & Spagnolo F 2008. Conceptions on modelling processes in Italian high-school prospective mathematics and physics teachers. South African Journal of Education, 28(4):469-487. Available at http://sajournalofeducation.co.za/index.php/saje/article/view/12/133. Accessed 7 November 2015. [ Links ]
Filloy E & Rojano T 1989. Solving equations: The transition from arithmetic to algebra. For the Learning of Mathematics, 9(2):19-25. [ Links ]
Franco de Sá P & Fossa JA 2012. Arithmetic word problems and algebra word problems. Jornal Internacional de Estudos em Educação Matemática, 5(1):38-53. Available at http://pgsskroton.com.br/seer//index.php/jieem/article/view/113/102. Accessed 8 November 2015. [ Links ]
Gower JC 1966. Some distance properties of latent root and vector methods used in multivariate analysis. Biometrika, 53(3/4):325-338. doi: 10.2307/2333639 [ Links ]
Gras R, Suzuki E, Guillet F & Spagnolo F (eds.) 2008. Statistical implicative analysis: Theory and applications. New York: Springer. [ Links ]
Gravetter FJ & Forzano LA 2012. Research methods for the behavioral sciences (4th ed). Belmont, CA: Wadsworth. [ Links ]
Holden RB 2010. Face validity. In IB Weiner & WE Craighead (eds). The Corsini Encyclopedia of Psychology (4th ed). Hoboken, NJ: Wiley. [ Links ]
Kieran C 1992. The learning and teaching of school algebra. In DA Gouws (ed). Handbook of research on mathematics teaching and learning. New York: Macmillan. [ Links ]
Kieran C 2004. Algebraic thinking in the early grades: What is it? The Mathematics Educator, 8(1):139-151. Available at http://citeseerx.ist.psu.edu/viewdoc/download?doi=10.1.1.513.5908&rep=rep1&type=pdf. Accessed 10 November 2015. [ Links ]
Lawshe CH 1975. A quantitative approach to content validity. Personnel Psychology, 28(4):563-575. doi: 10.1111/j.1744-6570.1975 .tb01393.x [ Links ]
Leisch F 2006. A toolbox for K-centroids cluster analysis. Computational Statistics & Data Analysis, 51(2):526-544. doi:10.1016/j.csda.2005.10.006 [ Links ]
Lerman IC 1993. Likelihood linkage analysis (LLA) classification method: An example treated by hand. Biochimie, 75(5):379-397. doi: 10.1016/0300-9084(93)90172-0 [ Links ]
Lins R & Kaput J 2004. The early development of algebraic reasoning: The current state of the field. In K Stacey, H Chick & M Kendal (eds). The future of the teaching and learning of algebra: The i2th ICMI Study. Netherlands: Springer. doi:10.1007/1-4020-8131-6 [ Links ]
MacQueen J 1967. Some methods for classification and analysis of multivariate observations. In LM LeCam & J Neyman (eds). Proceedings of the Fifth Berkeley Symposium on Mathemtical Statististics and Probability (Vol. 1). Berkeley, CA: University of California Press. Available at https://projecteuclid.org/download/pdf_1/euclid.bsmsp/1200512992. Accessed 12 November 2015. [ Links ]
Malara N & Navarra G 2003. ArAl Project: Arithmetic pathways towards favouring pre- algebraic thinking. Bologna, Italy: Pitagora Editrice. [ Links ]
Malisani E 1992. Incidenza di diversi tipi di struttura logica di un problema sulla condotta di risoluzione. "Quaderni di Ricerca in Didattica " del "Gruppo di Ricerca sull 'Insegnamento delle Matematiche " di Palermo, 3:65-86. Available at http://math.unipa.it/~grim/Risoluzione.pdf. Accessed 12 November 2015. [ Links ]
Meyer A 2013. Algebraic thinking and formalized mathematics-formal reasoning and the contextual. Paper presented at CERME8, Manavgat-Side, Antalya, Turkey, 6-10 February. Available at http://www.cerme8.metu.edu.tr/wgpapers/WG3/WG3_Meyer.pdf. Accessed 12 November 2015. [ Links ]
Palm T 2009. Theory of authentic task situations. In L Verschaffel, B Greer, W Van Dooren & S Mukhopadhyay (eds). Words and worlds: Modelling verbal descriptions of situations. Rotterdam: Sense Publishers. [ Links ]
Prediger S, Bikner-Ahsbahs A & Arzarello F 2008. Networking strategies and methods for connecting theoretical approaches: first steps towards a conceptual framework. ZDM: The International Journal on Mathematics Education, 40(2):165-178. doi: 10.1007/s11858-008-0086-z [ Links ]
Radford L 2010. Elementary forms of algebraic thinking in young students. In MF Pinto & TF Kawasaki. Proceedings of the 34th Conference of the International Group for the Psychology of Mathematics Education (PME), Bela Horozonte, Brazil, 18-23 July. Belo Horizonte: PME. [ Links ]
Radford L & Puig L 2007. Syntax and meaning as sensuous, visual, historical forms of algebraic thinking. Educational Studies in Mathematics, 66(2):145-164. doi: 10.1007/s10649-006-9024-6 [ Links ]
Rogers L 2002. From icons to symbols: Reflections on the historical development of the language of algebra. In J Novotná (ed). European Research in Mathematics Education II. Prague: Charles University Prague. Available at http://www.mathematik.uni-dortmund.de/~erme/doc/CERME2_proceedings.pdf. Accessed 14 November 2015. [ Links ]
Rousseeuw PJ 1987. Silhouettes: A graphical aid to the interpretation and validation of cluster analysis. Journal of Computational and Applied Mathematics, 20:53-65. doi: 10.1016/0377-0427(87)90125-7 [ Links ]
Schoenfeld AH & Arcavi A 1988. 0n the meaning of variable. The Mathematics Teacher, 81(6):420-427. [ Links ]
Sfard A 1995. The development of algebra: Confronting historical and psychological perspectives. Journal of Mathematical Behavior, 14:15-39. doi:10.1016/0732-3123(95)90022-5 [ Links ]
Springuel RP, Wittmann MC & Thompson JR 2007. Applying clustering to statistical analysis of student reasoning about two-dimensional kinematics. Physical Review Special Topics - Physics Education Research, 3:020107. Available at http://journals.aps.org/prstper/pdf/10.1103/PhysRevSTPER.3.020107. Accessed 17 November 2015. [ Links ]
Stewart J, Miller M, Audo C & Stewart G 2012. Using cluster analysis to identify patterns in students' responses to contextually different conceptual problems. Physical Review St Physics Education Research, 8:020112. doi: http://dx.doi.org/10.1103/PhysRevSTPER.8.020112 [ Links ]
Tumminello M, Micciché S, Dominguez LJ, Lamura G, Melchiorre MG, Barbagallo M & Mantegna RN 2011. Happy aged people are all alike, while every unhappy aged operson is unhappy in its own wayu. PLOS ONE, 6(9):e23377. doi:10.1371/journal.pone.0023377 [ Links ]
Ursini S & Trigueros M 2001. A model of the uses of variable in elementary algebra. In ProceedingsPME 25 (Vol. 4). [ Links ]
Walsh LN, Howard RG & Bowe B 2007. Phenomenographic study of students' problem solving approaches in physics. Physical Review St Physics Education Research, 3:020108. doi:http://dx.doi.org/10.1103/PhysRevSTPER. 3.020108 [ Links ]
Wittmann MC & Scherr RE 2002. Student epistemological mode constraining researcher access to student thinking: An example from an interview on charge flow. In KC Cummings, J Marx & S Franklin (eds). Marx & S Franklin (eds). Physics Education Research Conference Proceedings 2002. Boise, USA: PERC Publishing. [ Links ]
i. In our use of the term "symbolic", we understand expressions containing equations, inequations, simultaneous equations, etc.
ii. The questionnaire was first content validated (Lawshe, 1975) by a group of four lecturers and professors at the Mathematics and Informatics Departments of the University of Palermo and of the Univerzita Komenského (Comenius University) of Bratislava, Slovakia and then face validated (Gravetter & Forzano, 2012; Holden, 2010) with a restrict sample of 10 students (five from Palermo and five from Bratislava), of the same level as the students taking part to the survey.
Appendix A
Questionnaire
Name:.......................
Question 1:
Please read the following text and give your answers:
A man was aged 26 when his son was born. If we multiply the current ages of father and son, we obtain 456. How old is the father today? And how old is the son? Explain your answer.
Question 2:
Please read the following text and give your answers:
A football club bought some soccer balls for € 25 each. They were given a discount of €10.00 on the total price. If the club paid a grand total of €240.00, how many soccer balls did they buy? Explain your answer
Question 3:
Please read the following text and give your answers:
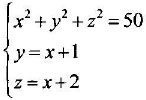
Please find three integer and consecutive numbers such that the sum of their squares is 50. Explain your answer.
Question 4:
Please read the following text and give your answers:
Is it true that if we sum 4 to a number, and then we multiply the result by 80, we obtain 2360? Explain your answer.
Question 5:
Please solve the following algebraic expression: 2x (x - 10) + 5 (3x2 - 4x) = 5x (3x - 4) -2x (4x - 5)
Question 6:
Please solve the following algebraic expression:
x2/4 = x/32
Appendix B
Typical answering strategies used by the students when dealing with the questions:
The first code element is the question number; the following two elements define the type of answering strategy (AR = Arithmetic-type strategies; AL = Algebraic-type strategies). The fourth code element distinguishes the specific strategy used (a, b, c, ... )
1ARa. The student performs a repeated series of multiplications, choosing the values by chance. The student has difficulty finding the correct answers to the question.
1ARb. The student performs a repeated series of multiplications:
27 * 1; 28 * 2; 29 * 3; 30 * 4; 31 * 5; ...... ; 36 * 10; 37 * 11; 38 * 12 = 456
The student starts from the product 27 x 1, where 27 is the father's age and 1 is the son's age, and continues this procedure until he/she obtains 456. At the end, the result is the product of 38 times 12.
This answering strategy is only made up of elementary operations, without any evidence of symbolism and abstraction
1ARc. This strategy is based on arithmetic, which is a geometrical approach. The student draws a rectangle with dimensions (x; (x + 26)) and, in order to find the requested result, calculates the rectangle's area. He/she still proceeds by trial and error:
(1 + 26) * 1; (2 + 26) *2; (3 + 26) * 3; .....; (11 + 26) * 11; (12 + 26) * 12 = 456
When he/she obtains the 456 value, he/she finds that the value of x, i.e. the son's age, is 12.
1ALa. The student formalises the question in algebraic language and writes the formula representing it: (x + 26) * x = 456, where x represents the son's age. He/she solves this equation by using one of the algebraic methods he/she knows. This strategy highlights some understanding of symbolism and abstraction, and the explicit use of the x variable could suggest the presence of some form of algebraic thought.
1ALb. The student formalises the question in algebraic language. He/she writes a system of equations representing the question and solves it by using one of the algebraic methods he/she knows:
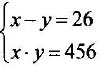
The x variable is the father's age, the y variable is the son's. This strategy highlights the presence of algebraic thought and good abstraction skills in the student.
2ARa. The student tries to answer the question with a series of approximations: 25 * 1; 25 * 2; 25 * 3; ... ; 25 * 8; 25 * 9; 25 * 10 = 250
Once he/she has arrived at this result, he/she reads the question again and performs the subtraction 250 - 10 = 240. This is the actual cost of the football balls in the exercise. The student therefore decides that the number of balls actually bought by the football club is 10. In fact, (€25 * 10) - €10 = €240.
2ARb. The student tries to repeatedly add the cost of the soccer balls: 25 + 25 = 50; 25 + 25 + 25 = 75; ... ; ... ; 25 + 25 + 25 + 25 + 25 + 25 + 25 + 25 + 25 + 25 = 250 With a €10 discount on the total price, the football club was able to buy 10 soccer balls.
2ARc. The student tries to repeatedly subtract the cost of a ball from the total amount spent. 240 - 25 = 215; 240 - 25 - 25 = 190; ........ ; 240 - 25 - 25 - 25 - 25 - 25 - 25 - 25 - 25 - 25 = 15
Once he/she has arrived at this result, the student thinks about the discount: with a €10 discount on the total price, the football club is able to buy one more soccer ball. In fact, €15 + €10 discount = €25, i.e. the cost of a soccer ball. Therefore, the football club can buy 10 soccer balls.
2ARd. The student solves the problem by thinking about 'unitary cost', 'total cost' and 'discount'. He/she takes into consideration the arithmetic expression (240 + 10), involving the total cost (€240), plus the discount (€10), and divides the result by the unitary cost of the balls (€25). Therefore, with the calculation (240 + 10) / 25 = 10 he/she finds the total number of soccer balls bought by the team.
2ARe. The student formalises the problem, and obtains the equation 25x - 10 = 240. However, he/she solves it by a trial and error procedure on the x value, following an arithmetic procedure.
2ALa. The student formalises the problem, and obtains the equation 25x - 10 = 240. He/she solves it by using one of the algebraic methods he/she knows and finds x, representing the number of soccer ball bought.
2ALb. The student formalises the problem and writes an algebraic proportion, highlighting the cost of a single soccer ball and the total cost. He/she, therefore, writes:
25 (cost of one soccer ball): 1 (one soccer ball) = T (total cost): x (number of bought ball). However, the student is not able to properly find the right value of T and so he/she cannot find x.
2ALc. The student formalises the problem and writes an algebraic proportion, highlighting the cost of a single soccer ball and the total cost. He/she, therefore, writes:
25 (cost of one soccer ball): 1 (one soccer ball) = T (total cost): x (number of bought ball).
In order to find T, the student adds €240.00 to the discount (€10.00). He/she, therefore, calculates x by using the proportion rules.
3ARa. The student does not follow a specific logical line in choosing the triad of numbers required by the question. In particular, he/she does not choose three consecutive numbers and goes on more or less by chance, eventually finding the right result.
3ARb. The student tries to answer the question by several attempts. He/she first tries the triad 1, 2, 3 and verifies if they fit with the requirements of the question. As this is not the case, he/she tries again with 2, 3, 4 and, then 3, 4, 5. In this last case, the sum of the squares is 50, so the student finds his/her answer. After this, he/she does not care to verify if other triads of numbers satisfy to the question requirements.
3ARc. The student follows the steps described in strategy 3ARb, but chooses negative, consecutive numbers. So, he/she first tries the triad (-3, -2, -1). Then (-4, -3, -2) and he/she finds a result (-5, -4, -3) that fits the question requirements. After this, he/she does not care to verify if other triads of numbers satisfy to the question requirements.
3ALa. The student formalises the problem and writes the formula: x2 + y2 + z2 = 50. However, no relationships between x, y and z are found, and so he/she is not able to solve the problem.
3ALb. The student formalises the problem and writes the formula: x2 + (x + 1) 2 + (x + 2) 2 = 50. In order to solve it he/she uses a trial and error, arithmetic procedure.
3ALc. The student formalises the problem and writes the formula: x2 + (x + 1) 2 + (x + 2) 2 = 50. He/she solves it by using one of the algebraic methods he/she knows. By following this procedure, the student finds all the possible triads of integer, consecutive numbers that solve the problem: (3, 4, 5) and (-5, -4, -3).
3ALd. The student formalises the problem and writes a system of 3 equations with 3 variables and solves it by using one of the algebraic methods he/she knows:
4ARa. The student answers "no", without further explanation.
4ARb. The student tries to solve the problem by a trial and error, arithmetic procedure, randomly searching numbers.
4ARc. The student decides to proceed by successive approximations. He/she starts from 1 and performs the calculations described in the text: he/she adds 1 to 4 and then multiplies the result by 80, verifying that the obtained value is less than 2360. He/she continues with numbers greater than 1 until he/she finds that, by using 25, the result is 2320 (25 + 4) * 80 = 2320, but by using 26, the result is 2400, that is greater than the required value (2360). As there are no other integers between 25 and 26, the student concludes that the answer to the question is "no".
4ARd. The student draws a rectangle ((x+4); 80) and bases his/her reasoning on the fact that the area of such rectangle, according to the question data, is to be 2360. He/she goes on by a trial and error, arithmetic procedure:
(1 + 4) * 80; (2 + 4) * 80; (3 + 4) * 80; .....; (24 + 4) * 80; (25 + 4) * 80 = 2.320; (26 + 4) * 80 = 2.400 > 2.360.
As there are no other integers between 25 and 26 the student concludes that the answer to the question is "no".
4ALa. The student formalises the problem and writes the equation: x + 4 * 80 = 2.360. He solves it, but finds the wrong result.
4ALb. The student formalises the problem and writes the equation: (x + 4) * 80 = 2.360. He tries to solve it by a trial and error procedure but does not find a result.
4ALc. The student formalises the problem and writes the equation: (x + 4) * 80 = 2.360. He solves it, but does not properly use the distributive property of multiplication on the addiction.
4ALd. The student formalises the problem and writes the equation: (x + 4) * 80 = 2.360. He solves it by using one of the algebraic methods he/she knows.
5ARa. The student tries to solve the algebraic expression by successive approximations on the x variable. He/she proceeds by trial and error, randomly choosing values. In this way, after many calculations, the student finds the value 0, and considers it the only correct solution.
5ARb. The student tries to solve the algebraic expression by successive approximations on the x variable. He/she proceeds by trial and error, randomly choosing values. In this way, after many calculations, he/she finds both solutions.
5ARc. The student tries to solve the algebraic expression by successive approximations on the x variable. He/she proceeds by trial and error, choosing values in ascending order (0, 2, 7, ...). In this way the student finds the value 0 and considers it the only correct solution.
5ARd. The student tries to solve the algebraic expression by successive approximations on the x variable. He/she proceeds by choosing values in ascending order (0, 1, 2, 3, ...). In this way the student finds both the solutions.
5ALa. The student tries to simplify the algebraic expression, but fails to do so. He/she, then, uses an arithmetic approach and solves the problem.
5ALb. The student solves the algebraic expression, blindly performing all the calculations.
5ALc. The student sees that it is possible to rewrite the expression in a more synthetic way. He/she does so, and therefore easily solves the equation.
6ARa. The student tries to solve the algebraic expression by successive approximations on the x variable. He/she proceeds by trial and error, randomly choosing values. In this way, after many calculations the student finds the value 0, and considers it the only correct solution.
6ARb. The student tries to solve the algebraic expression by successive approximations on the x variable. He/she proceeds by trial and error, randomly choosing values. In this way, after many calculations, he/she finds both the solutions.
6ARc. The student tries to solve the algebraic expression by successive approximations on the x variable. He/she proceeds by trial and error, choosing values in ascending order (0, 2, 7, ...). In this way the student finds the value 0 and considers it the only correct solution.
6ARd. The student tries to solve the algebraic expression by successive approximations on the x variable. He/she proceeds by choosing values in ascending order (0, 1, 2, 3, ...). In this way the student finds both the solutions.
6ALa. The student tries to simplify the algebraic expression, but fails to do so. He/she, then, uses an arithmetic approach and solves the problem.
6ALb. The student solves the algebraic expression, blindly performing all the calculations.
6ALc. The student sees that it is possible to rewrite the expression in a more synthetic way. He/she does so and solves it, but finds only one of the two solutions.
6ALd. The student sees that it is possible to rewrite the expression in a more synthetic way. He/she does so and solves it, finding both the solutions.

