


Servicios Personalizados
Articulo
 Inglés (pdf)
 Articulo en XML
 Referencias del artículo
Indicadores

Links relacionados
-
 Citado por Google
 -
 Similares en Google
Compartir

 Permalink
South African Journal of Education
versión On-line ISSN 2076-3433
versión impresa ISSN 0256-0100
S. Afr. j. educ. vol.35 no.4 Pretoria nov. 2015
http://dx.doi.org/10.15700/saje.v35n4a1202
Are e-books effective tools for learning? Reading speed and comprehension: iPad® vs. paper
Suzanne Sackstein; Linda Spark; Amy Jenkins
Information Systems, Faculty of Commerce, Law and Management, University of the Witwatersrand, South Africa Suzanne. Sackstein@wits.ac.za
ABSTRACT
Recently, electronic books (e-books) have become prevalent amongst the general population, as well as students, owing to their advantages over traditional books. In South Africa, a number of schools have integrated tablets into the classroom with the promise of replacing traditional books. In order to realise the potential of e-books and their associated devices within an academic context, where reading speed and comprehension are critical for academic performance and personal growth, the effectiveness of reading from a tablet screen should be evaluated. To achieve this objective, a quasi-experimental within-subjects design was employed in order to compare the reading speed and comprehension performance of 68 students. The results of this study indicate the majority of participants read faster on an iPad, which is in contrast to previous studies that have found reading from tablets to be slower. It was also found that comprehension scores did not differ significantly between the two media. For students, these results provide evidence that tablets and e-books are suitable tools for reading and learning, and therefore, can be used for academic work. For educators, e-books can be introduced without concern that reading performance and comprehension will be hindered.
Keywords: comprehension; electronic books; reading; speed
Introduction
Electronic books (e-books) were introduced in the late 1970s with Project Gutenberg, the original source for ebooks on the internet (Hart, 1992). At the time, e-books were meant to be read from computers, as this was the only device with the capability to do so (Kossey & Brown, 2011). Upon the arrival of personal computers in the 1980s, the differences between reading from paper and from computer screens became a popular area of research, and in particular, whether people were able to comprehend information effectively and read text with adequate speed from digital media (Ball & Hourcade, 2011).
The limitation of reading e-books from computers, according to Foasberg (2011), Gibson and Gibb (2011) and Kossey and Brown (2011), only ended when electronic readers (e-readers), such as SoftBook and the Rocket™ e-book, were introduced in the 1990s. Electronic readers (e-readers) are mobile devices, which are optimised for reading e-books, and present several benefits over reading e-books from a computer. Lemken (1999) states that e-readers are lighter and more portable than computers are, and possess higher resolution displays. According to Kossey and Brown (2011), notwithstanding the benefits of e-readers, these devices only really began to gain popularity in the mid-2000s, with the introduction of Sony's Librié, Amazon's Kindle™, Barnes and Noble's Nook™, and Apple's iPad.
As a result of improvements in the technology of e-books and e-readers, students began to use them, as they offered a number of advantages over traditional books, such as online access, searchability, cost benefits, and portability (Jamali, Nicholas & Rowlands, 2009). Consequently, e-books have become so prevalent that publishers now offer e-book alternatives for most of their textbooks (Woody, Daniel & Baker, 2010) and therefore, many students are beginning to replace their traditional textbooks with e-books.ii The increased use and widespread popularity of e-books within education, requires much research, claim Child (2012) and Grace (2011). As students move from paper-based to digital text, Grace (2011) contends that it is of primary importance to research the way in which they read from these new media. In addition, within South Africa, a number of schools are in the process of introducing tablets, with the intention of evaluating their effectiveness within education (Child, 2012) or investigating the factors that affect their adoption (Eicker-Nel & Matthee, 2014; Liebenberg, 2012). However, before educators decide to implement these new technologies, it is important for them to obtain evidence that doing so will benefit their students (Grace, 2011). This is particularly important in developing economies, where it is anticipated that less costly e-textbooks could replace paper textbooks (Eicker-Nel & Matthee, 2014). Thus, it is imperative to determine whether students are able to read the distributed static digital text as effectively as they are able to read text on paper. As a result, the following research questions were formulated for this study:
-
Question 1 : are students able to comprehend information read from the screen of an iPad as effectively as they are able to from paper?
-
Question 2: are students able to read as quickly from an iPad screen as they are able to from paper?
The effectiveness of e-books as tools for learning can be assessed by studying whether reading from a tablet affects reading comprehension and speed (Grace, 2011), that is, are students able to comprehend information read from the screen of a tablet as effectively as they are able to when reading from paper, and/ or are they able to read as quickly from a tablet screen as they are able to read from paper?
Literature Review
Students have read and studied from paper-based text for the last hundred years, and this is therefore the medium they are accustomed to when learning (Grace, 2011). Miller, Blackstock and Miller (1994 :187) suggest reading is very important because "few abilities have such an impact on students' overall achievement in the education process". Furthermore, Jones and Brown (2011) state that reading skills are critical for academic and personal growth. Matthew (1997) and Woody et al. (2010) suggest that the move from print to electronic text affects the way in which students read, as well as their reading comprehension, because students may not read the same way on different media.
Although many students are utilising e-books, a number of studies have found that students still prefer paper-based course materials and textbooks (Buzzetto-More, Sweat-Guy & Elobaid, 2007; Mc-Gowan, Stephens & West, 2009; Shepperd, Grace & Koch, 2008; Woody et al., 2010). One of the reasons for this preference could be that students find it difficult to read from a screen (Baker, 2010; Jamali et al., 2009; Lam, P, Lam, SL, Lam, J & McNaught, 2009).
There has been extensive debate around numerous aspects of reading. However, one fact that has emerged is that the purpose of reading is comprehension (Farr & Carey, 1986). Comprehension is defined by Alonzo, Basaraba, Tindal and Carriveau (2009:34) as "the ability to obtain information from [...] text". The current study used the levels of comprehension theory, which posits that there are three different levels at which people comprehend: first, and most basic, is the literal level, which concerns the understanding of words; the second level is the inferential level where the reader accesses background knowledge; and the third, and highest level, is the evaluative level, where readers critically judge text, while accessing their beliefs and experiences (Alonzo et al., 2009).
The following sections will provide a review of theories regarding reading, reading speed, and comprehension, and will explore how these theories were incorporated into this study.
Reading
Reading is a complex, two-stage process involving the way in which a text is perceived (text-based process), followed by how the reader processes the information (knowledge-based process) (Church, 2002). When reading digitally, the text-based process deals with typography and the human-computer interface, including issues such as: contrast, resolution, fonts, flicker, luminance, letter case, and eye fatigue; while the knowledge-based process involves the measure of a reader' s comprehension (Church, 2002). Dillon (1992) asserts that reading is evaluated from the aspects of process and outcome. The process aspect of reading is concerned with the physical, including eye movement, navigation of the physical medium, and manipulation of the text. The outcome aspect, on the other hand, involves the mental processing of the reading medium and includes proof-reading, accuracy, fatigue, comprehension, preference, and speed (Baker, 2010). Thus, as this study examined reading speed and comprehension, it was concerned with the knowledge-based process and outcome aspects of reading.
General reading theory
According to Just and Carpenter (1980), reading is about processing and encoding words and relating these to previous sentences and knowledge. It is also generally accepted that reading starts with identifying words, moves to integrating and interpreting these, and then to comprehension that takes place at the end of sentences (Verhoeven & Per-fetti, 2008). The general theory underlying reading was utilised in the selection of the comprehension material used to assess students. The material had to be set at an appropriate instructional level at which students were able to recognise and interpret all words used and the material had to be readable with fluency. If the reading material did not adhere to these two requirements, it would have been difficult to attribute poor comprehension results to the reading medium, as basic word understanding and fluency could have been to blame (Klingner, 2004).
Reading speed
Fry (1963, cited in Bell, 2001) contends that good readers read at 350 words per minute, fair readers achieve 250 words in the same time, and slow readers attain 150 words per minute. In contrast, Berkoff (1979) asserts that a fast reader is not necessarily an efficient reader, nor can it be said that a slow reader is an inefficient reader. It is worth noting that students have an immense amount of reading to cope with whilst they complete their studies, and therefore cannot afford to be slow readers (Berkoff, 1979). It is thus important to evaluate whether a digital medium, from which a student might choose to read and learn, is conducive to an adequate reading speed.
Comprehension
Farr and Carey (1986) remark that there is widespread research focused upon the understanding of reading comprehension, but that there is much disagreement concerning each aspect of the reading process. Nevertheless they posit that one common proposition has emerged from the discord, which is that "the purpose of reading is comprehension" (Farr & Carey, 1986:37). Comprehension occurs when meaning is acquired as a result of the reader's interaction with a text (McNeil, 1984, cited in Matthew, 1997). Various types of tasks are used to measure reading comprehension, including multiple choice tests, oral reading, recall, true-false judgements, sentence completion, and open question-answer tasks (Farr & Carey, 1986; Snowling, Cain, Nation & Oakhill, 2009).
Levels of comprehension theory
Assessing reading comprehension is very complex as there are a number of cognitive processes that are involved, many of which are hidden and cannot be directly measured (Snowling et al., 2009). A useful theory that can assist is the levels of comprehension theory, which alludes to the different levels of comprehension, namely literal, inferential, and evaluative. Consequently, reading assessments have been based on this theory for many years. The first level refers to information that will provide answers for literal questions that can be found directly stated in the text (Alonzo et al., 2009). Kintsch (2005:53) refers to this as "superficial, text-level comprehension" and states that it is only sufficient if the task is to recall the content. Secondly, inferential questions "require readers to access their background knowledge in conjunction with their understanding of the text" (Dewitz & Dewitz, 2003, cited in Alonzo et al., 2009:35). Finally, the evaluative level requires readers to critically judge the text while taking their own beliefs and experiences into account (Alonzo et al., 2009). In the current study, this theory was used to select comprehension assessments that would measure students' comprehension accurately, while questions in the comprehension tests attempted to evaluate all three levels of comprehension.
Reading speed and comprehension Gates (1921) discovered that reading speed and comprehension are two distinct, but related factors, and that both should be included in any reading program. Similarly, Bell (2001) relates that while it is generally accepted that reading speed and comprehension are closely related, there is still debate about the link between them. Despite this on-going debate, it has been recognised that a very slow reader is more likely to have little understanding of a passage of text, as this person's memory is under duress to retain information in chunks large enough to gain a holistic understanding of the text (Bell, 2001). This study ensured that the material used was readable with fluency, and that students participating in the study had an adequate level of reading affinity. In order to assess the link between reading speed and comprehension, the study made use of Rauding Theory.
Rauding theory
'Rauding' is a word derived from the words 'reading' and 'auding', where reading involves looking at words and constructing their meaning, auding refers to listening to words and determining their meaning. ' Rauding' emphasises the fact that the comprehension processes fundamental to typical reading and auding are the same (Carver, 1992).
According to Carver (1992), there are five basic reading processes referred to as 'Gears': Gear 1 is memorizing, Gear 2 is learning, Gear 3 is raud-ing, Gear 4 is skimming, and Gear 5 is scanning. It is argued that the Gear used most frequently by readers is Rauding, with the reading component occurring at approximately 300 words per minute (WPM). The importance of Rauding Theory is twofold: firstly, it provides benchmark rates at which students generally read for each Gear, which made it useful for analysing the reading speed results obtained in the study. Carver (1992) states that for scanning, the typical rate is 600 WPM, for skimming 450 WPM, for rauding 300 WPM, for learning 200 WPM, and for memorizing 138 WPM. These rates were utilised from Rauding Theory to enable the researchers to identify the Gear in which a student was reading, i.e., the probable reading speed. Secondly, Rauding is the Gear in which most comprehension takes place (Carver, 1992). However, Nielsen (1997) contends that people reading digitally scan instead of read. Scanning (Gear 5) takes place when individuals only need to locate a certain word in a passage of text and therefore do not comprehend all the thoughts within each sentence (Carver, 1992). As Scanning does not involve the same level of comprehension that Rauding does, it was possible that students reading from tablets were comprehending less and therefore obtaining lower test scores. It is likely that students could have been scanning the digital text at 600 WPM, rather than reading at the Rauding Gear 3 of 300 WPM.
This theory is further reinforced by a study conducted by Dyson and Haselgrove (2000), in which comprehension after reading from a screen at both normal and fast reading speeds was measured. They concluded that faster reading results in an overall decline in comprehension (Dyson & Haselgrove, 2000).
Paper-based versus digital text
Since the 1980s, researchers have studied the differences between reading from paper and from computer screens (Ball & Hourcade, 2011). Dillon (1992) reviewed all of the paper versus screen studies to date, and noted that reading from a screen is usually much slower than reading from paper (Gould & Grischkowsky, 1984, cited in Dillon, 1992; Kak, 1981, cited in Dillon, 1992; Muter, Latremouille, Treurniet & Beam, 1982, cited in Dillon, 1992; Smedshammar, Frenckner, Nordquist & Romberger, 1989, cited in Dillon, 1992; Wright & Lickorish, 1983, cited in Dillon, 1992). However, Gould, Alfaro, Finn, Haupt and Minuto (1987, cited in Ball & Hourcade, 2011) contend that the findings of poor digital reading speeds in that era were due to the poor quality of the Cathode Ray Tube (CRT) monitor used at the time, particularly due to negative polarity (light characters on a dark background). McKnight (1996, cited in Schcolnik, 2001) contends that, as displays nowadays present dark text on a white background (positive polarity), the digital reading experience is of greater similarity to that of reading from paper, and the human eye is able to distinguish with greater ease between letters and words. Nevertheless, studies conducted after the era of the CRT discovered that paper is still the fastest reading medium (Grimshaw, Dungworth, McKnight & Morris, 2007; Nielsen, 1997, 2010).
Nielsen (1997) found that 79% of people reading websites scan instead of read, and proceeds to list plausible reasons as to why this could be so, such as that reading from screens leads to eye fatigue. As recently as 2010, Nielsen investigated reading speeds on an iPad, Kindle™, and printed book, and discovered that people still read faster from printed books, despite the fact that display technology has improved. In terms of comprehension, Dillon's (1992) review of the literature revealed that comprehension is not negatively affected by a digital reading medium (Cushman, 1986, cited in Dillon, 1992; Kak, 1981, cited in Dillon, 1992; Muter et al., 1982 cited in Dillon, 1992; Muter & Maurutto, 1991, cited in Dillon, 1992). Grimshaw et al. (2007) had similar findings and concluded that children's comprehension was not negatively affected by the computer screen. Moreover, a recent study by Grace (2011) also determined that the comprehension of third grade students reading on an iPad was not positively or negatively affected by the digital reading medium.
Having examined the literature around this study's research questions, the following hypotheses were derived:
-
H1: Students reading from paper will comprehend the material better than those reading from iPads, which will be reflected in their test scores.
-
H2: Students reading from paper will read significantly faster than those reading from iPads, which will be reflected in their reading times.
-
H3: Reading speed and comprehension will be significantly and negatively correlated.
Research Method
Design
This study used a field or quasi-experimental with-in-subjects research design (Cohen, Manion & Morrison, 2007) in order to answer the research question: are students able to comprehend information read from the screen of an iPad as effectively as they are able to from paper? According to Pietersen and Maree (2007), experimental designs are used to answer cause-and-effect questions in which the researcher makes a change in the input or independent variable, in order to observe the effect of that change on the output or dependent variable (Cohen et al., 2007).
In this study, a quasi-experimental design was followed, as the students were tested in their natural school setting and not in an artificial laboratory environment, where the input variable, i.e., the mode of delivery (iPad or paper) was manipulated and controlled by the researchers in order to assess whether the output variable (reading speed and comprehension) would be affected (Cohen et al., 2007). The choice of a within-subject experiment was made, in which "each individual is exposed to more than one of the treatments being tested", as it allows "causal estimates to be obtained by examining how individual behaviour changed when circumstances or variables of the experiment are changed" (Charness, Gneezy & Kuhn, 2012:1). In this study, all students were exposed to both modes of delivery. According to Charness et al. (2012), a limitation of this type of research design is that biases may exist and complexity of the experimental variables may not be fully explored, and results may be confounded. In order to address these concerns and attain an independent assessment of each treatment (Char-ness et al., 2012), the research study was conducted in two parts, on two different days, in order to allow students to 'reset' themselves and, in addition, the mode of delivery was switched in a controlled manner between groups in each sample. This was done in order to counterbalance the order of the delivery of the medium (Lane, n.d.). The text content on Day 1 and Day 2 was different, to ensure that there was no familiarity with the text on Day 2, which would have confounded the results.
In order to answer the first research question as to whether students are able to comprehend information read from the screen of an iPad as effectively as they are able from paper, a set of multiple choice questions for each comprehension text was given to the students after they had completed reading. These answers were marked and each student's scores were then recorded for each mode of delivery and then compared. To answer the second research question as to whether students are able to read as quickly from an iPad screen as they are from paper, students were required to start their embedded mobile stopwatch as they started reading and to stop it when they had completed reading the comprehension text. These times were then compared between the different modes of delivery.
Population
According to Lai and Chang (2011), students comprise one of the largest reading groups, and often spend large amounts of money on expensive textbooks, which are both cumbersome, and promptly discarded once they have fulfilled their academie purpose. Furthermore, students generally embrace new technologies (Simon, 2001) and therefore, serve as ideal indicators in the adoption of e-books. Consequently the population selected for this study consisted of high school students from advantaged private secondary schools, as well as undergraduate and postgraduate university students. Both schools and the university are located in urban areas within the Gauteng Province of South Africa. Students within this population were between the ages of 15 and 23.
Sample
The sample for this study consisted of 16 students enrolled at a university, and 55 senior high school students from School A and School B. The university, School A and School B were selected due to prior research contact, their willingness to participate, and relatively easy access to the students.
Students from the University were ethnically and culturally diverse, and possessed varying levels of reading ability and technology exposure. University students were invited to participate through flyers posted and participation letters handed out to potential participants, around the university campus. This group consisted of 10 males and six females aged between 20 to 23 years, 10 of whom speak English as a first language. While all respondents within this group owned a computer, only 28.6% owned a tablet, and 7.1% owned an e-reader. Over 50% of these students had used someone else's tablet, 7.1% had not used a tablet, but had seen one being used, and 14.3% had never seen or even used a tablet. Exposure to e-readers was lower than computers and tablets, with 28.6% of students indicating that they had never used an e-reader, 28.6% having seen an e-reader being used, and only 35.7% having made use of someone else's e-reader.
Students from School A and School B were ethnically and culturally similar, as the ethos of both schools is in accordance within certain religious beliefs. In addition, students that attend these schools are generally from advantaged communities and have access to technology. Grade 10 students were sampled, as the data was collected during final exams, and Grade 11 and 12 students could not participate due to timing constraints. To increase the variability of the results so that the study's findings would be more generalizable (Murphy, Long, Holleran & Esterly, 2003), students in both schools had a large range of abilities. For School A, as there were only 19 students in the grade, all Grade 10 students were invited to participate. For School B, 36 students of mixed ability who had volunteered to participate, were randomly selected from 160 Grade 10 students by the academic head of the school. It is important to note that the students from School B had prior exposure to using iPads in an educational setting, as the school had introduced iPads to all Grade 10s in a pilot project. However, all students from both schools and the university were randomly selected to prevent bias within the sample.
School A consisted of 11 males and eight females, all of whom speak English as a first language. Ninety-four point seven percent of the respondents within this group owned a computer, 47.4% owned a tablet and 15.8% owned an e-reader. Exposure to e-readers was lower than to computers and tablets, with 21.1% of students indicating that they had never used an e-reader, 31.6% had seen an e-reader being used, and only 31.6% had made use of someone else's e-reader. School B consisted of 19 males and 17 females all of whom speak English as a first language. Ninety-seven point one percent of the respondents within this group owned a computer, 77.1% owned a tablet and 20% owned an e-reader. Exposure to e-readers was lower than to computers and tablets, with 25.7% of students indicating that they had never used an e-reader, 17.1% had seen an e-reader being used, and only 37.1% had made use of someone else's e-reader.
Different comprehension tests were used to assess the different groups at their appropriate grade level, due to the differences in reading ability between the Grade 10 and university students. Although there were three experimental groups from which data was collected, all groups were dealt with in the same way.
Research Instruments
Comprehension text
For the comprehension content, informational text was selected, as it is the type of text found in textbooks, and because its purpose is to "convey content or information to the reader" (Elish-Piper, 2010:1).
Both sets of comprehension assessments for the Grade 10 and university students were chosen for their interesting content in the hope that they would be appealing to students. In answering the multiple choice questions, neither sets of students had the comprehension material to refer back to, so the results they achieved were likely to be affected by memory and their ability to guess the answers. However, "this method is widely employed as a comparatively effective means of testing reading comprehension" (Maynard & McKnight, 2001:35). Although all four of the comprehension texts differed slightly in word count, this did not affect the comparison of reading speed results, as the reading rate (WPM) was calculated and used for analysis using the stopwatch applications on mobile phones. The only alterations made to the comprehension assessments included removing questions that required reference to the text, and changing spelling from American to South African English. As the experiment required students to read and comprehend on Paper and on the iPad at two different sessions, it was necessary to have two different texts to control for familiarity with the content on Day 2.
To eliminate further confounding variables, both the electronic and the paper-based comprehension texts were presented in identical ways, with the same fonts (Arial) and sizes (12), and with 1.5 point line spacing. In order to ensure the appropriate readability of each comprehension text, the Flesch-Kincaid readability tests (the Flesch Reading Ease Test indicates the level of difficulty of a reading text and the Flesch-Kincaid Grade Level Test measures the grade level at which the text would be understandable) were run (Burke & Greenberg, 2010). All comprehension texts were sourced from reliable and credible sources.iii
Grade 10 students
Two different comprehension assessments were obtained from a website that creates practice materials for the Florida Comprehensive Assessment Test (FCAT) in the United States of America. This test is administered to students in Grades 3-11 to measure their progress against the state's standards.iv It was ensured that the texts were both within the same grade level for the two groups. The texts were Death Valley (Text 1: at grade level 9.5, with a reading ease score of 60.6) and The Virtues of Venom (Text 2: at grade level 9.9, with a reading ease score of 56.1). The FCAT comprehension tests are designed to assess comprehension at the literal, inferential, and evaluative levelsv and a number of multiple choice questions were asked in order to assess these different levels.
University students
Two different comprehension tests were sourced from an Asset Test practice website and the English for everyone website. The Asset test is a college placement test that is administered across the United States, and is designed to measure a student's ability in basic academic skills, including reading.vi The English for Everyone website specialises in the development of comprehension assessments.vii Although not sourced from the same website, the tests are similar with respect to grade level and reading ease. The tests that were completed by the university students were Mount Rushmore in the Black Hills (Text 1: at grade level 13.0, with a reading ease score of 39.2) and Hubble (Text 2: at grade level 12.8, with a reading ease score of 39.8). The multiple-choice questions that were developed by the respective websites assess students at the three levels of comprehension.
Questionnaire
Following the experiment, students were asked to complete a paper-based questionnaire to assess the difficulty perceived between the different texts in order to ensure that the change from Text 1 to Text 2 did not influence their Reading Speed and Comprehension Score.
Devices
Ten iPads constituted the electronic medium from which the students read, using the iBooks application to display the comprehension text. All iPads were set at 100% screen brightness and the screen orientation was locked in portrait mode. Further to this, access to the electronic dictionary was disabled to prevent the distortion of reading speed times and comprehension scores.viii
Setting
The experiment was conducted in a typical classroom setting for all three student groups. Timing of student reading times was measured through embedded stopwatch applications on a variety of mobile phones. Consent forms describing the conditions of the study in detail and highlighting the ethical considerations, were given to each participant. Furthermore, participants from the university population, as well as the Grade 10 participants and their parents, signed consent forms in order to take part in this study.ix
Data Collection
The experiment was conducted over two days for each sample group. On the first day, students in each sample group were randomly divided into two groups. Before commencing the experiment on the first day, it was made clear to the students that the study was intended to examine the differences between reading on paper and on an iPad, and was not in any way meant to judge their personal academic performance. Students were asked to read through the text at a pace that was comfortable for them, with the knowledge that would need to answer questions on what they had read. The same comprehension text, appropriate for their grade level, was given to each group with a different mode of delivery. One group read from the iPad and the other group read from paper. Students who were given iPads were also given time to familiarise themselves with the devices and with the iBook' s application. On the second day of the experiment, the mode of delivery was switched for the groups and a different comprehension text at the appropriate grade level, to counter the carry over effect due to familiarity (Charness et al., 2012), was then given to the students with the same instructions.
As the same group of students was assessed using both media, confounding variables such as general intelligence, reading ability, and technology ability were accounted for in analysis (McMillan, 2007). Following each test on the two days, students were asked to record their reading times using the embedded stopwatch applications on their mobile phones, fill in the multiple choice questions on the text, and rate the difficulty of the comprehension text. The data obtained in this process was then statistically analysed to measure the differences in students' reading speed and comprehension between the two media.
Data Analysis
In order to determine whether the Reading Speed and Comprehension Scores of all students differed due to medium, i.e. on paper or on the iPad, paired sample t-tests were run on the full sample, as well as for each of the experimental groups. This allowed for a comparison to be made between students' mean reading speeds and comprehension scores (Archambault, 2000). To provide a more complete description of the treatment and to determine whether the order in which the medium was presented, i.e., on Day 1 or Day 2, did not confound the results, a Hotelling's Trace was conducted (Pillai, 1983). Finally, to establish whether a relationship existed between Reading Speed and Comprehension, Pearson's Correlation Analysis (PCA) was run (Pietersen & Maree, 2007).
Results
In total, 71 students (55 Grade 10 and 16 university students) participated in this study. As facilitators were present during the data collection process, any questions or misunderstandings relating to the instructions and questions were dealt with and thus no data entry errors or missing values were found. Data was then screened for outliers on the basis of both reading rate and comprehension score. One participant from Grade 10 and two participants from the university were removed, as their scores distorted the means of both groups. As a result, the analysis was carried out on 54 Grade 10 students and 14 university students, a total sample of 68. As the three experiments were conducted with the same procedures, it was decided to pool the data. Of the participants, 54% were male and the remaining 46% were female. No significant differences were found when comparing the results of males and females and therefore the results were not analysed according to gender.
Comprehension Texts
In order to ensure that the change in text from Day 1 to Day 2 did not confound the findings, students were asked to rate the perceived difficulty of each text. The means of the perceived difficulty responses for Text 1 and Text 2 were compared using a Paired Samples t-test.
Across all three experimental groups, students did not perceive either text to be at a greater level of difficulty, and therefore, it can be seen that the texts and their respective questions were well matched in terms of difficulty and can thus be used for the comparison of reading speed and comprehension scores. For School A there was no significant difference in perceived difficulty of Text 1 (M = 3.00, SD = .882) and Text 2 (M = 2.63, SD = .684); t = -1.681, p = .110 (where the test-statistic (t-value) indicates whether the means of the two scores are different and the p-value indicates whether the result of the t-test is statistically significant (Cohen et al., 2007). In School B, the paired sample t-tests also revealed no significant differences in Text 1 (Mean (M) = 2.77, standard deviation (SD) = .690) and Text 2 (M = 2.69, SD = .676); t = .620, p = .539 Similarly, for the University students, paired sample t-tests also revealed no significant differences in the perceived difficultyof Text 1 (M = 2.57, SD = .938) and Text 2 (M = 2.93, SD = .829); t = -1.099, p = .292.
Reading Speed
Medium
To determine whether the medium was significant for reading speed, paired sample t-tests were conducted to determine the differences between all students' paper reading speed versus all students' iPad reading speed, regardless of the day on which the medium was administered. This was done for the full sample, and for each of the three experimental groups. Table 1 shows the results of these paired sample t-tests.
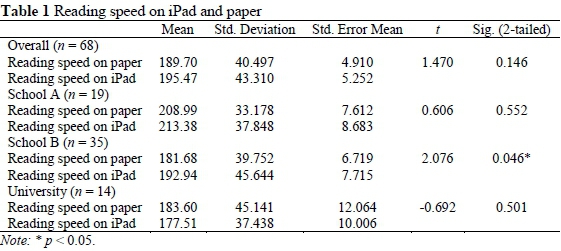
Full sample
Although statistically non-significant (t = 1.470, p = .146), the students read from the iPad read only marginally faster on average than on paper.
Experimental groups
For School A, although statistically non-significant (t = .606, p = .552), the students read from the iPad only marginally faster than they did from paper. The students at School B read from the iPad statistically significantly faster (t = 2.076, p = .046) than they did from paper. For the University students, although statistically non-significant (t = -0.692, p = .501), the students read from the iPad marginally slower on average than from paper.
Treatment order
Given that the texts on paper and iPad were administered to the students on different days as described above, it is necessary to determine whether the order of treatment was significant for reading speed. Paired sample t-tests were conducted to determine the differences between all students' Day 1 reading speed versus the same students' Day 2 reading speed, regardless of the medium from which they were reading. In addition, a Multivariate Analysis of Variance (MANOVA), which tests the analysis of variance on two or more variables (Mayers, 2013), tested Day 1 and Day 2 reading speeds as a function of treatment order assignment. This was done for the full sample and for each of the three experimental groups. Table 2 shows the results of the paired sample t-tests and Table 3 shows the results of the MANOVA.
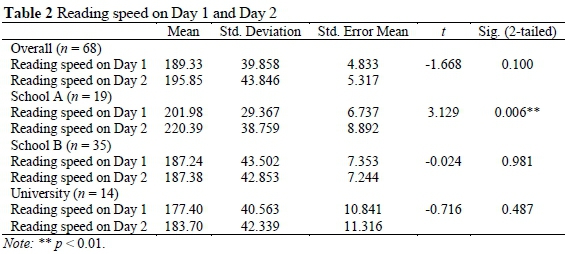
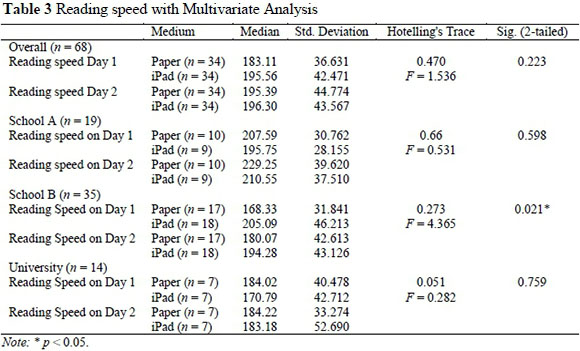
Table 2 shows that the reading speed for the full sample and for two of the three experimental groups was not significantly different from Day 1 to Day 2. However, for School A, the Day 2 reading speed was statistically significantly faster (t = 3.129, p = .006) than on Day 1.
Table 3 probes the effect of the treatment order further. The results reveal that the treatment for School B had a statistically significant effect on reading speed (Hotelling's Trace = .273, p < 0.05). The students who moved from paper on Day 1 to iPad on Day 2 read faster, and the students who moved from iPad on Day 1 to paper on Day 2 read slower; thus regardless of the day, the iPad reading speed was faster. For the other two experimental groups, the movement from paper to iPad, or iPad to paper had no effect.
Comprehension
Results pertaining to the levels of comprehension theory reveal that Grade 10 students from both Schools answered correctly 60% of all literal questions on paper, and 51% of the same type of questions on the iPad. Furthermore, 51% of inferential questions were answered correctly on paper, whilst 53% were answered correctly on the iPad. Lastly, 83% of evaluative questions were answered correctly on paper, and 81% were answered correctly on the iPad. The results for the university students revealed that 47% of literal questions were answered correctly on paper, and 36% were answered correctly on the iPad. For the inferential level, 77% of the questions were answered correctly on paper, and 76% on the iPad. Finally, 62% of evaluative questions were answered correctly on paper, and 50% on the iPad. These results suggest that students are able to comprehend material adequately from paper and the iPad at all three levels of comprehension.
Medium
To determine whether the medium was significant for comprehension score, paired sample t-tests were conducted to determine the differences between all students on both days reading from paper, versus all students on both days reading from the iPad. This was done for the full sample and for each of the three experimental groups. Table 4 shows the results of the paired samples t-tests.
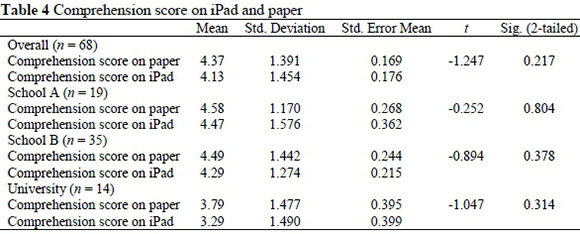
Full Sample
Although statistically non-significant (t = -1.247, p = .217) students comprehension scores from the iPad were only marginally lower on average than those on paper.
Experimental Groups
In School A, although statistically non-significant (t = -.252, p = .804) the students comprehended from paper slightly better than they did on the iPad. For School B, the results were statistically nonsignificant (t = -.894, p = .378) and for the university students, the results were also statistically non-significant (t = -1.047, p = .314).
Treatment Order
Given that the texts on paper and iPad were administered to the students on different days as described above, it is necessary to determine whe- ther the order of treatment was significant for comprehension score. Paired sample t-tests were conducted to determine the differences between all students' Day 1 comprehension score versus those same students' Day 2 comprehension score, regardless of the medium from which they were reading. In addition, a MANOVA tested Day 1 and Day 2 comprehension scores as a function of treatment order assignment. This was done for the full sample and for each of the three experimental groups. Table 5 shows the results of the paired samples t-tests and Table 6 shows results of the MANOVA.
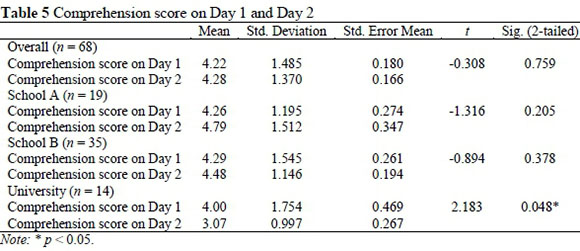
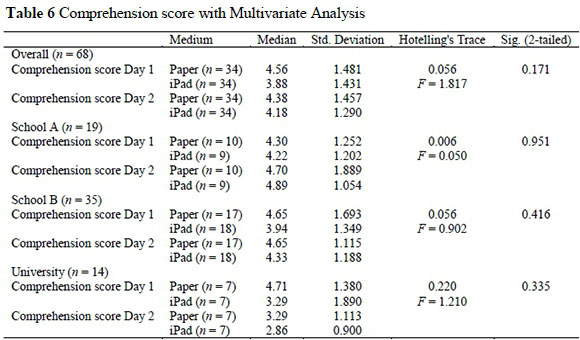
Table 5 shows that comprehension score for the full sample and two of three experimental groups were not significantly different from Day 1 to Day 2. However, for the university students, the comprehension score on Day 2 was statistically, significantly lower (t = 2.183, p = .048) than on Day 1.
Table 6 probes the effect of the treatment order further. Results reveal that the movement from paper to iPad, or iPad to paper had no effect on the full sample and all three experimental groups.
Relationship between Comprehension and Reading Speed
The study made use of Pearson's Correlation Analysis (PCA) (Pietersen & Maree, 2007) to investigate the strength of the relationship between the average comprehension score and reading speed for all students. The correlation between the variables was found to be statistically non-significant (r = .024) (where r indicates the correlation, i.e. the relationship (Pietersen & Maree, 2007)).
Discussion
The intention of this study was to determine whether students are able to read as effectively from the screen of an iPad as they are able to from paper, in terms of reading speed and comprehension. Results from this study indicate that actual reading speed and comprehension are not hindered by the use of digital media. These results are particularly significant for those involved within educational environments in emerging economies where the cost of academic material and constant textbooks changes are major issues (Eicker-Nel & Matthee, 2014).
Reading Speed
At the outset, it was hypothesised that students' reading times would be significantly faster when reading from paper as opposed to reading from an iPad (H2). However, the results revealed that students from School B read significantly faster on the iPads, while students from School A and the university students did not read significantly faster on either medium. A possible reason for School B's students reading faster on iPads could be due to the school's introduction of iPads in a pilot project, resulting in their prior exposure to using iPads in an educational setting. These results are in contrast to the findings of previous research in which reading on screens was found to be significantly slower than reading from paper (Dillon, 1992; Grimshaw et al., 2007; Nielsen, 1997, 2010). A possible reason for this difference may be that the majority of previous studies that have examined reading differences between paper and screen have been conducted with adult populations and may not be applicable to students, since younger people are more likely to be familiar with electronic devices and in particular with reading text from them (Kerr & Symons, 2006).
These results are encouraging, because they reveal that reading from screens is not slower for all populations, and may even be faster for certain student groups. Therefore, e-books can be used by students as their reading speed may not be significantly hindered. This is particularly valuable for university students as they have vast amounts of reading to do and cannot afford to read slowly (Berkoff, 1979). In addition, e-books offer several advantages in emerging economies, as students and educators are able to broaden their access to resources at less cost (Eicker-Nel & Matthee, 2014).
Comprehension
As with reading speed, it was hypothesised that students' test scores would reflect that those reading from paper would comprehend the material better than those reading from iPads (H1). However, comparisons of the test scores across the media revealed no significant differences in comprehension scores between the iPad and paper for any of the experimental groups. These results are supported by the literature that has found no differences in reading comprehension between electronic and paper-based media (Cushman, 1986, cited in Dillon, 1992; Grace, 2011; Grimshaw et al., 2007; Kak, 1981, cited in Dillon, 1992; Muter et al., 1982, cited in Dillon, 1992; Muter & Maurut-to, 1991, cited in Dillon, 1992). This is an encouraging finding, as it suggests that the use of iPads in classrooms, and in other educational settings, will not be a hindrance to students' reading comprehension. This does not imply that all students' reading comprehension will be unimpeded by an electronic reading device, and therefore educators must still make an effort to assess whether each individual student comprehends effectively from an electronic medium, as not all students comprehend in the same way (Grace, 2011).
The results for levels of comprehension suggest that students are able to comprehend material adequately from paper and the iPad at all three levels of comprehension. In their study, Dyson and Haselgrove (2001) found that main factual questions were easier to answer than questions requiring the recall of details. This also seems to be the case in this study, since a large number of students were not able to recall the specific details required for the literal questions. It appears that the university students, in particular, struggled with the literal questions. It can also be seen that more literal questions on the iPad were answered incorrectly in comparison to paper. The Grade 10s answered 60% of all literal questions correctly on paper, and 51% correctly on the iPad, whilst the university students answered 47% of the literal questions correctly on paper and 36% correctly on the iPad. This brings into question the effectiveness of an electronic medium when dealing with the comprehension of specific details. This is an issue that future research could address.
Relationship between Comprehension and Reading Speed
It was hypothesised that students' reading speed and comprehension would be negatively and significantly related (H3). However, no such relationship between reading speed and comprehension was found. This hypothesis was tested on the basis of Rauding Theory, which suggests that a slower reading rate is used for learning and memorising, while a faster reading rate is used for skimming and scanning (Carver, 1992). From the results of this study, it appears that students who read at faster rates comprehended the material as effectively as those who read at slower rates. This result is not altogether surprising, considering the number of contradictory theories regarding reading speed and comprehension. Carver (1992) and Dyson and Haselgrove (2000) contend that comprehension levels are higher at a slower reading rate, however there is also support for the fact that faster readers comprehend material better than slower readers (Bell, 2001).
Summary of Results
For comprehension of text, the analysis of the data reveals that students reading from paper do not necessarily comprehend the material better than those reading from iPads. Similarly, for reading speed it was found that students reading from paper do not read significantly faster than those reading from iPads. In addition, it was found that reading speed does not necessarily affect comprehension.
Limitations of the Study
Firstly, students had different prior levels of exposure to using iPads in an educational context, which may have influenced their Reading Speed and Comprehension Scores on the different mediums. Secondly, although every effort was made to ensure the similarity of the comprehension assessments, it was not possible to ascertain that they would be exactly the same difficulty for all students. Thirdly, the study was conducted with a group of culturally similar and privileged Grade 10 students, which might threaten the study's external validity (Trochim & Donnelly, 2006). Fourthly, a fairly small sample was used for this study, which may decrease the generalisability of the results. Finally, although all feasible measures were taken to mitigate against any confounding of the variables, this could not be ruled out entirely as there were different groups, with different texts and different media, on different days. Nevertheless, this threat does not change the implications of the reported results, namely that iPads can be used in the classroom for academic purposes.
Conclusion
Due to the prevalence of e-books and tablets amongst students and the implementation of tablet devices into school classrooms, this study evaluated the effectiveness of using an iPad for reading with regards to the constructs of speed and comprehension. The results of this study provide evidence that e-books do not compromise either reading speed or comprehension of students within their academic environment, but may in fact be effective tools for reading and learning. This is an encouraging finding, as it suggests that the inclusion of tablet devices and e-books will be beneficial to students in secondary schooling and tertiary institutions.
Notes
i. The use of ® is dropped hereafter, due to the liberal use of iPad throughout.
ii. Richards R 2012. eBooks and student learning. Available at http://www.pcc.edu/library/about/library-learning/ebooks-and-student-learning. Accessed 28 November 2015.
iii. Reliability and validity studies of the comprehension texts can be found at http://www.palomar.edu/irp/briefs/Microsoft%20Word%20-%20Research%20in%20Brief%20Consequential%20Validity%20Study%202002.pdf; http://fcat.fldoe.org/pdf/fcataabb.pdf
iv. The Florida Comprehensive Assessment Test (FCAT) can be found at http://fcat.fldoe.org/fcat/
v. Details of the FCAT assessment levels can be found at http://fcat.fldoe.org/pdf/fcataabb.pdf
vi. The Asset Test can be found at http://www.asset-test-practice.com/
vii. English for Everyone n.d. Your resource for English worksheets. Available at http://www.englishforeveryone.org/. Accessed 04 August 2012.
viii. This study only examined e-books containing static electronic text as opposed to interactive e-books, as these are the types of e-books that currently dominate the market (Nelson, 2008).
ix. Full ethical clearance for this study was granted by the University of the Witwatersrand - Protocol number CINFO/1027.
References
Alonzo J, Basaraba D, Tindal G & Caniveau RS 2009. They read, but how well do they understand? An empirical look at the nuances of measuring reading comprehension. Assessment for Effective Intervention, 35(1):34-44. doi:10.1177/1534508408330082 [ Links ]
Archambault S 2000. Paired samples t test. Available at http://academics.wellesley.edu/Psychology/Psych205/pairttest.html. Accessed 3 November 2015. [ Links ]
Baker RD 2010. Comparing the readability of text displays on paper, e-book readers, and small screen devices. Ph.D. dissertation. Denton: University of North Texas. [ Links ]
Ball R & Hourcade JP 2011. Rethinking reading for age from paper and computers. International Journal of Human-Computer Interaction, 27(11):1066-1082. doi: 10.1080/10447318.2011.555319 [ Links ]
Bell T 2001. Extensive reading: Speed and comprehension. The Reading Matrix, 1(1). Available at http://www.readingmatrix.com/articles/bell/. Accessed 26 November 2015. [ Links ]
Berkoff NA 1979. Reading skills in extended discourse in English as a foreign language. Journal of Research in Reading, 2(2):95-107. doi:10.1111/j.1467-9817.1979.tb00197.x [ Links ]
Burke V & Greenberg D 2010. Determining readability: How to select and apply easy-to-use readability formulas to assess the difficulty of adult literacy materials. Adult Basic Education and Literacy Journal, 4(1):34-42. [ Links ]
Buzzetto-More N, Sweat-Guy R & Elobaid M 2007. Reading in a digital age: e-books are students reading for this learning object? Interdisciplinary Journal of Knowledge and Learning Objects, 3:239-250. Available at http://www.ijklo.org/Volume3/IJKLOv3p239-250Buzzetto.pdf. Accessed 26 November 2015. [ Links ]
Carver RP 1992. Reading rate: Theory, research, and practical implications. Journal of Reading, 36(2):84-95. [ Links ]
Charness G, Gneezy U & Kuhn MA 2012. Experimental methods: Between-subject and within-subject design. Journal of Economic Behavior & Organization, 81(1):1-8. doi:10.1016/jjebo.2011.08.009 [ Links ]
Child K 2012. iPads for elite schools. Times Live, 26 January. Available at http://www.timeslive.co.za/scitech/2012/01/26/ipads-for-elite-schools. Accessed 17 April 2014. [ Links ]
Church JW 2002. Relationship between text display method and college student short term knowledge retention during self-study. Ph.D. dissertation. Johnson City, USA: East Tennessee State University. Available at http://dc.etsu.edu/cgi/viewcontent.cgi?article=1884&context=etd. Accessed 26 November 2015. [ Links ]
Cohen L, Manion L & Morrison K 2007. Research methods in education (6th ed). Abingdon: Routledge. [ Links ]
Dillon A 1992. Reading from paper versus screens: a critical review of the empirical literature. Ergonomics, 35(10):1297-1326. Available at https://www.ischool.utexas.edu/~adillon/Journals/Reading.htm. Accessed 26 November 2015. [ Links ]
Dyson MC & Haselgrove M 2000. The effects of reading speed and reading patterns on the understanding of text read from screen. Journal of Research in Reading, 23(2):210-223. doi: 10.1111/14679817.00115 [ Links ]
Dyson MC & Haselgrove M 2001. The influence of reading speed and line length on the effectiveness of reading from screen. International Journal of Human-Computer Studies, 54:585-612. doi:10.1006/ijhc.2001.0458 [ Links ]
Eicker-Nel S & Matthee M 2014. The adoption of tablet based e-textbooks in a South African private school. In Proceedings of the e-skills for knowledge production and innovation conference 2014. Cape [ Links ]
Town, South Africa. Available at http://proceedings.e-skillsconference.org/2014/e-skills109-123EickerMatthee715.pdf. Accessed 26 November 2015. [ Links ]
Elish-Piper L 2010. Understanding reading comprehension: Information and ideas for parents about reading comprehension. Illinois Reading Council Journal, 38(3):49-52. [ Links ]
Farr R & Carey RF 1986. Reading: What can be measured? (2nd ed). Newark: International Reading Association. [ Links ]
Foasberg NM 2011. Adoption of e-book readers among college students: A survey. Information Technology and Libraries, 30(3):108-128. doi: http://dx.doi.org/10.6017/ital.v30i3.1769 [ Links ]
Gates AI 1921. An experimental and statistical study of reading and reading tests. Journal of Educational Psychology, 12(7):378-391. [ Links ]
Gibson C & Gibb F 2011. An evaluation of second-generation ebook readers. The Electronic Library, 29(3):303-319. [ Links ]
Grace KE 2011. Comparing the iPad to paper: Increasing reading comprehension in the digital age. MEd thesis. Bowling Green, OH: Bowling Green State University. [ Links ]
Grimshaw S, Dungworth N, McKnight C & Morris A 2007. Electronic books: children's reading and comprehension. British Journal of Educational Technology, 38(4):583-599. doi: 10.1111/J.1467-8535.2006.00640.x [ Links ]
Hart M 1992. The history and philosophy of Project Gutenberg. Available at http://www.gutenberg.org/wiki/Gutenberg:The_History_and_Philosophy_of_Project_ Gutenberg_by_Michael_Hart. Accessed 22 April 2014. [ Links ]
Jamali HR, Nicholas D & Rowlands I 2009. Scholarly ebooks: the views of 16,000 academics: Results from the JISC national e-book observatory. In Aslib Proceedings (Volume 61, Issue 1). Emerald Group Publishing Limited. [ Links ]
Jones T & Brown C 2011. Reading engagement: A comparison between e-books and traditional print books in an elementary classroom. International Journal of Instruction, 4(2):5-22. [ Links ]
Just MA & Carpenter PA 1980. A theory of reading: From eye fixations to comprehension. Psychological Review, 87(4):329-354. Available at http://repository.cmu.edu/cgi/viewcontent.cgi7article=1731&context=psychology. Accessed 26 November 2015. [ Links ]
Kerr MA & Symons SE 2006. Computerized presentation of text: Effects on children's reading of informational material. Reading and Writing, 19(1):1-19. doi: 10.1007/s11145-003-8128-y [ Links ]
Kintsch E 2005. Comprehension theory as a guide for the design of thoughtful questions. Topics in Language Disorders, 25(1):51-64. [ Links ]
Klingner JK 2004. Assessing reading comprehension. Assessment for Effective Intervention, 29(4):59-70. doi: 10.1177/073724770402900408 [ Links ]
Kossey J & Brown V 2011. Digital readers: An emerging technology in education. In M Koehler & P Mishra (eds). Proceedings of Society for Information Technology & Teacher Education International Conference 2011. Chesapeake, VA: Association for the Advancement of Computing in Education (AACE). [ Links ]
Lai JY & Chang CY 2011. User attitudes toward dedicated e-book readers for reading: The effects of convenience, compatibility and media richness. Online Information Review, 35(4):558-580. doi: 10.1108/14684521111161936 [ Links ]
Lam P, Lam SL, Lam J & McNaught C 2009. Usability and usefulness of eBooks on PPCs: How students' opinions vary over time. Australasian Journal of Educational Technology, 25(1):30-44. [ Links ]
Lane D n.d. Online statistics education: An interactive multimedia course of study. Available at http://onlinestatbook.com. Accessed 3 November 2015. [ Links ]
Lemken B 1999. Ebook - the missing link between paper and screen. In Proceedings of Conference on Human Factors in Computing Systems (CHI 99 Workshop on Designing Electronic Books). Available at http://citeseerx.ist.psu.edu/viewdoc/download?doi=10.1.1.46.5481&rep=rep1&type=pdf. Accessed 18 August 2014. [ Links ]
Liebenberg J 2012. Unravelling the text book as embodied curriculum: An actor-network theory view of an Android-based ebook implementation in a South African secondary school. In M Specht, M Sharples & J Multisilta (eds). mLearn 2012: Proceedings of the 11th International Conference on Mobile and Contextual Learning, Helsinki, Finland, 16-18 October. Available at http://ceur-ws.org/Vol-955/AllPapersAndDC.pdf. Accessed 18 August 2014. [ Links ]
Matthew K 1997. A comparison of the influence of interactive CD-ROM storybooks and traditional print storybooks on reading comprehension. Journal of Research on Computing in Education, 29(3):263-275. doi: 10.1080/08886504.1997.10782198 [ Links ]
Mayers A 2013. Introduction to statistics and SPSS in psychology. New York: Pearson Education Limited. [ Links ]
Maynard S & McKnight C 2001. Children's comprehension of electronic books: On empirical study. New Review of Children's Literature and Librarianship, 7(1):29-53. doi: 10.1080/13614540109510643 [ Links ]
McGowan MK, Stephens PR & West C 2009. Student perceptions of electronic textbooks. Issues in Information Systems, X(2):459-465. Available at http://www.iacis.org/iis/2009/P2009_1299.pdf. Accessed 27 November 2015. [ Links ]
McMillan JH 2007. Randomized field trials and internal validity: Not so fast my friend. Practical Assessment, Research & Evaluation, 12(15). [ Links ]
Miller L, Blackstock J & Miller R 1994. An exploratory study into the use of CD-ROM storybooks. Computers & Education, 22(1-2):187-204. doi: 10.1016/0360-1315(94)90087-6 [ Links ]
Murphy PK, Long JF, Holleran TA & Esterly E 2003. Persuasion online or on paper: a new take on an old issue. Learning and Instruction, 13(5):511-532. doi: 10.1016/S0959-4752(02)00041-5 [ Links ]
Nelson MR 2008. E-books in higher education: Nearingthe end of the era of hype? EDUCAUSE Review, 43(2):40-42. [ Links ]
Nielsen J 1997. Why users scan instead of read. Available at http://www.useit.com/alertbox/whyscanning.html. Accessed 22 April 2014. [ Links ]
Nielsen J 2010. iPad and Kindle reading speeds. Available at http://www.useit.com/alertbox/ipad-kindle-reading.html. Accessed 22 April 2014. [ Links ]
Pietersen J & Maree K 2007. Overview of statistical techniques. In K Maree (ed). First steps in research. Pretoria: Van Schaik. [ Links ]
Pillai KCS 1983. Hotelling's trace. Encyclopedia of Statistical Sciences. [ Links ]
Schcolnik M 2001. A study of reading with dedicated e- readers. Ph.D. dissertation. Fort Lauderdale: Nova Southeastern University. Available at http://www.researchgate.net/publication/245088802_A_Study_of_Reading_with_Dedicated_E-Readers. Accessed 27 November 2015. [ Links ]
Shepperd JA, Grace JL & Koch EJ 2008. Evaluating the electronic textbook: Is it time to dispense with the paper text? Teaching of Psychology, 35(1):2-5. doi:10.1080/00986280701818532 [ Links ]
Simon EJ 2001. Electronic textbooks: A pilot study of student e-reading habits. Future of Print Media Journal, Winter:1-5. Available at http://ppintaal.home.xs4all.nl/e_documentatie/e-textbooks-01.pdf. Accessed 27 November 2015. [ Links ]
Snowling MJ, Cain K, Nation K & Oakhill J 2009. Reading comprehension: Nature assessment and teaching. Available at http://eprints.lancs.ac.uk/50134/1/ESRCcomprehensionbooklet.pdf. Accessed 27 November 2015. [ Links ]
Trochim WMK & Donnelly JP 2006. Research methods knowledge base (3rd ed). Cincinnati, OH: Atomic Dog. [ Links ]
Verhoeven L & Perfetti C 2008. Advances in text comprehension: model, process and development. Applied Cognitive Psychology, 22(3):293-301. doi:10.1002/acp.1417 [ Links ]
Woody WD, Daniel DB & Baker CA 2010. E-books or textbooks: Students prefer textbooks. Computers & Education, 55(3):945-948. doi:10.1016/j.compedu.2010.04.005 [ Links ]

