


Servicios Personalizados
Articulo
 Inglés (pdf)
 Articulo en XML
 Referencias del artículo
Indicadores

Links relacionados
-
 Citado por Google
 -
 Similares en Google
Compartir

 Permalink
South African Journal of Education
versión On-line ISSN 2076-3433
versión impresa ISSN 0256-0100
S. Afr. j. educ. vol.34 no.2 Pretoria jun. 2014
Pass rates in primary school leaving examination in Tanzania: implication for efficient allocation of resources
Telemu Kassile
Department of Biometry and Mathematics, Sokoine University of Agriculture, Tanzania telemuk@yahoo.com
ABSTRACT
This paper examines regional differentials in pass rates in Primary School Leaving Examination (PSLE) in Mainland Tanzania. In particular, the paper investigates the effects of pupil-teacher ratio (PTR), pupil-latrine ratio (PLR), pupil-classroom ratio (PCR), availability of electricity in schools, and secondary school and above education of women and men aged 15-49 years on the percentage of students passing the PSLE. The paper employs a multilevel framework using aggregate regional data from Basic Education Statistics in Tanzania (BEST) and Tanzania Demographic and Health Survey (TDHS). The results indicate that regional pass rates in PSLE are negatively associated with regional PTR and PLR, and that there are regional differences in these education resources. However, their effects were found to be statistically insignificant. Education of women on the other hand, was positively and significantly related to the pass rate in the PSLE. Accordingly, there is a need for formulating education policies that would promote the enrolment of women in higher education in Tanzania so as to ensure that children achieve progress in education and social economic development later in life. In addition, measures to ensure efficient allocation of resources are needed in order to address apparent regional disparities regarding access to essential education resources.
Keywords: contextual analysis; efficient allocation; pass rates; primary school leaving examination; Tanzania
Introduction
Educational attainment of the population is an important component of human capital accumulation and one that is fundamental for economic growth and development (Birdsall, Ross & Sabot, 1995; Barro & Lee, 2001; Mungai, 2012). In many countries in Africa, like elsewhere in the Third World, education is the most important public policy agenda, with a significant proportion of the annual national budgets as well as international support being allotted to it (Samoff, 1987). To promote people's access to education and ensure that boys and girls are able to complete primary school, various measures including elimination of fee have been introduced by some countries in sub-Saharan Africa. Malawi, Uganda and Tanzania abolished school fees in government/public schools in 1994, 1997 and 2000, respectively, while Burundi, Cameroon, Ghana, Kenya and Rwanda did the same in 2003 (Grogan, 2008).
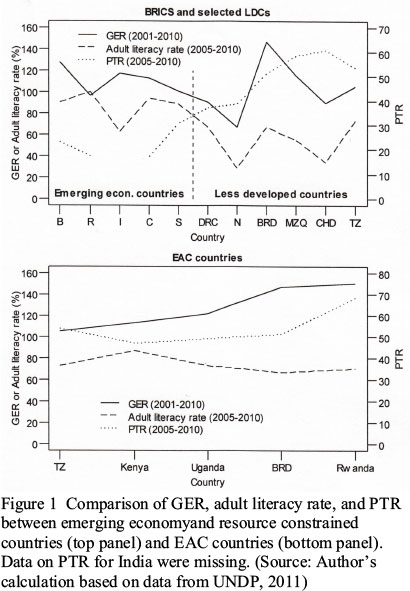
There is enough evidence in literature of the existence of inter-country or inter-state/regional differences in various aspects of primary education. Education statistics from the United Nations Development Programme (UNDP, 2011), reveal the existence of some variations across a range of education dimensions both within and between countries which are considered comparable in terms of development, as Figure 1 exemplifies. For example, in a category of countries in Brazil, Russia, India, China, and South Africa (the BRICS) grouping, while China had the PTR of 17.2 during the period 2005-2010, South Africa had the PTR of 30.7 during the same period. Among the five least developed countries (LDCs), (based on the Human Development Index (HDI)-score), while the Democratic Republic of Congo (DRC) had the PTR of 37.3, Chad had the PTR of 60.9.1 Considerable variations also exist, especially among the LDCs, in terms of gross enrolment ratio (GER) in primary schools and in the adult literacy rate.2 For example, among countries in the East African Community (EAC), Tanzania ranks the lowest in terms of GER and Rwanda ranking the highest (Figure 1). Benavot and Riddle (1988) explore the expansion of primary school in 126 countries during the period 1870-1940. They show that the extension of mass schooling was significantly associated with socio-economic, political, and religious situations in the studied countries. Asadullah and Yalonetzky (2012) and Shindler and Fleisch (2007) among others, provide detailed analysis of inter-state/province disparity in terms of access to primary education vis-à-vis state/province development in India and South Africa.
In the United Republic of Tanzania (URT), investment in education is acknowledged as essential to improving the quality of life of Tanzanians. According to Research and Analysis Working Group (RAWG, MKUKUTA Monitoring System & Ministry of Finance and Economic Affairs, 2009), over 70% of the annual budget of education in Mainland Tanzania is allocated to basic education activities, of which more than 50% is spent on primary education.
Education statistics of the Ministry of Education and Vocational Training (MoEVT) show that pass rate in the PSLE has been varying significantly on an annual basis in the past decade. Between 2001 and 2006, the percentage of children passing the PSLE increased from 28.6% in 2001 to 70.5% in 2006 (MoEVT, 2008). However, the pass rate dropped from 70.5% in 2006 to 54.2% in 2007, and it dropped further to 49.4% in 2009, but it improved slightly to 53.5% in 2010 (MoEVT, 2011). Broad regional inequalities in the pass rate in the PSLE are well documented in Tanzania. For example, in the 2008 examinations, the highest pass rate was just below 74% in Dar es Salaam region, in eastern Tanzania, while the lowest pass rate stood at 34% in Shinyanga region, in western Tanzania. Moreover, the pass rates varied between boys and girls with 82% versus 66% respectively in Dar es Salaam and 46% against 22% in Shinyanga (RAWG et al., 2009).
Investigating the relationship between school characteristics or students' socio-economic status (SES) and students' education achievement is one of the areas that have attracted the attention of researchers across the world (see, for example, Malmberg & Sumra, 1998-2001 and the references therein). At micro-level, studies on the SES-students' achievement relationship, reveal that students from affluent SES households have better educational outcomes. They are also more likely to progress to higher levels of education than their counterparts from low SES households (Malmberg & Sumra, 1998-2001). The authors (Malmberg & Sumra, 1998-2001) note that parents' education level has also an impact on their children's education attainment. Parents' education level would determine the type of school the students are likely to be enrolled in, that is, whether government or non-government; additional assistance the students are likely to receive outside the school framework, such as tuition after normal school hours, or assistance in doing homework.
On the one hand, studies at micro-level are also essential in elucidating our understanding of the link between educational achievement and students' socio-economic background, and the mechanisms through which intergenerational transmission of poverty within communities in the context of developing economy like Tanzania can take place. On the other hand, there have been restricted attempts in analyzing educational outcomes from a general perspective. Furthermore, as noted by Foster (1980), progress in school is not only linked to the socio-economic background of the students, but it is also linked to the aggregate social and economic milieu of the regions in which students live. Glick and Sahn (2010) note for example, that grade repetition among primary school students was 20% in Francophone Africa as opposed to 10% and 2% in Anglophone Africa and in the Organization for Economic Co-operation and Development (OECD) countries, respectively. In India, poor quality of schooling has been found to be a major contributing factor in student retention in primary schools (Kaul, 2001). However, the author notes that most of the studies focused on classroom settings, ignoring contextual differences across societies.
This paper provides an analysis that aims at understanding regional school and student's contexts on educational outcomes with reference to pass rates in the PSLE in the setting of Mainland Tanzania. A summary of Tanzania's education system and an overview of regional differences in selected socioeconomic and demographic indicators are first given in the next two sections.
The Tanzania Education System
The education system in Tanzania is described in detail in the Education and Training Policy (ETP) of the then Ministry of Education and Culture (MoEC, 1995). Briefly, the education system in Tanzania consists of two years of pre-primary education; seven years of primary education; four years of secondary ordinary level education; two years of secondary advanced level education, and at least three years of university education. The end of primary education cycle is marked by the PSLE, which is used as a basis for the selection of students into the first cycle of the two cycles of secondary education. Scores in the PSLE are categorized into five distinct grades, that is, A through E. A student is considered to have passed the PSLE if he/she scores an overall of at least C grade, which ranges from 85 to 120 marks. The scores in grades B and A range from 121 to160 marks and from 161 to 200 marks respectively (MoEVT, 2008).
Over the past decade, the major focus of the education sector has been on promoting and increasing access to education and promoting equity in access to education across geographical areas and groups with special requirements and gender, among others (MoEVT, 2011). The Primary Education Development Programme (PEDP), beginning in January 2002 is one of the Government's attempts geared at the realization of the vision of Universal Primary Education (UPE) within the wider Tanzanian policy contexts.
Regional differentials in selected indicators in Tanzania
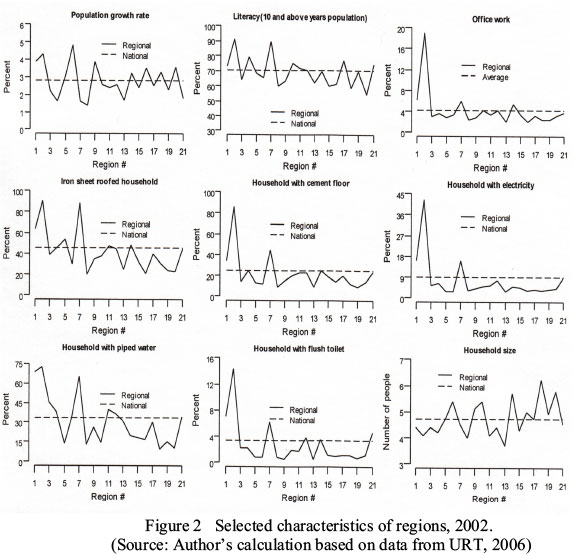
Figure 2 provides a distribution of selected characteristics across regions contrasted with the national average as per the 2002 Population and Housing Census (URT, 2006). Numbers on the horizontal axis are the 21 regions of Mainland Tanzania.3 Wider regional inequalities are noticeable within and between indicators. Arusha, Dar es Salaam, and Kilimanjaro regions in general, seem to be better off in many aspects of socioeconomic indicators as opposed to the rest of the regions. For instance, these regions were the only ones that recorded the above national average percent of cement-floored households and which had electricity in the year 2002. They were also among the regions with the highest and the above average percentage of literacy of the population aged 10 years and above, households roofed with iron sheets, households that used piped water and had flush toilets. The three regions referred to were also above the overall average in terms of members of households with office work employment.4 Concerning household size, the three regions were among those whose household sizes were below the national average of 4.7 persons per household in the 2002 census while Shinyanga, Tabora, and Mwanza regions, had the highest household sizes of 6.2, 5.8, and 5.7 persons, respectively.
Method
Data
The data for analysis in this paper are in the form of aggregate (averages or percentages) and were obtained from the 2011 BEST publication series (MoEVT, 2011) and the 2010 TDHS (TDHS, 2011). MoEVT (2011) gives national data on various aspects pertaining to the education sector covering a five-year period from 2007 to 2011 for all regions5 in Mainland Tanzania. However, of relevance in this paper are regional pass rates in the 2010 National PSLE. The pass rates for the 2010 National PSLE were used primarily because they were the most recent statistics on pass rates available in the MoEVT (2011) at the time of writing this paper. In addition, PTR, PLR, PCR, and the percentage of schools with electricity in 2011 were also used in the analysis. Additional details about the data may be obtained at http://www.moe.go.tz/statistics.
The PTR was considered important since large PTR reflects the inability of teachers to provide the desired level of attention to all individual students in need of teachers' assistance; and this may have an impact on students' overall performance.6 On the other hand, PLR was selected for inclusion in the present analysis because large values may discourage regular attendance of students to schools, the outcome of which may be poor performance. Regarding PCR, the findings from the 2007 Views of the Children study reveal that pupils prefer teachers who like teaching, love students, and who make efforts to teach until students understand. These aspects are more likely to happen in smaller class sizes (RAWG, 2007). For a detailed discussion on the relationship between class size and students' achievement, see Bourke (1986); Glass and Smith (1979); and Nye, Hedges and Konstantopoulos (2000), to mention but a few. In addition, Goldstein and Blatchford (1998) provide an in depth review of methodological issues of studies pertaining to the relationship between class size and educational achievements.
According to Adler, Boyce, Chesney, Cohen, Folkman, Kahn and Syme (1994) and Adler, Boyce, Chesney, Folkman and Syme (1993), the three key components of SES are economic status (measured by income); social status (measured by education); and work status (measured by occupation). Though interrelated, these SES indicators are not totally overlapping variables (Adler et al., 1994). The focus on SES in the present study is based on studies by Sirin (2005) and Roscigno and Ainsworth-Darnell (1999), who have demonstrated that in education research, SES is one of the widely used contextual variables. In the absence of income data or information on household expenditure to mirror the milieu in which students live, we controlled in the analytical model rather crudely by secondary and above education of women and men aged 15-49 years. Of the different variables that are distributed along the SES strata, parental education is regarded as one of the most stable features of SES (Sirin, 2005). Ross and Wu (1995) note that well educated individuals are more likely to be employed and to have permanent and more rewarding jobs. As a result, they are likely to earn high incomes to meet essential goods and services for themselves and their families. Therefore, because of higher participation of men than women in the wage-labour market as observed by Birdsall et al. (1995), men's education was used to surrogate the economic status of households within the respective regions. Moreover, it has long been observed by Khandker (1987) that in the context of developing countries especially in rural African societies (Meeker & Meekers, 1997), women are directly involved in the production of non-market goods such as education, health, and nutrition. In this perspective, women's education was used as a proxy for women's decision-making power within the households.7
Statistical analysis
Numerical and graphical summary measures were carried out first. For numerical summary measures, the arithmetic mean together with the corresponding standard error (SE) was employed to summarize the data. In order to gain more insights about the distribution of variables in the study, the median, minimum, and maximum values were also estimated. Where appropriate, frequencies and corresponding percentages were computed. In addition, in order to understand the direction and strength of the linear association between variables in the study, Pearson's (product moment) correlation coefficients and corresponding probability (p) values were estimated. This involved correlation analysis between each of the independent variables and the outcome measure and between pairs of independent variables. For graphical presentation of the data, bivariate scatterplots were employed. In order to understand the existence of anomaly in the data, each of the variables in the study was standardised. Furthermore, in order to establish the existence of patterns of relationship between the outcome and the explanatory variables, the standardized values for each explanatory variable were concurrently plotted with the outcome variables. For convenience in creating plots and implementation of analytical technique, the 21 regions were grouped into seven geographic zones8 consistent with studies such as TDHS (2011).
Next, a multilevel modelling strategy (Goldstein, 1991) was used to account for intra-units (zones) correlation. Several studies (e.g. Gibbons & Hedeker, 1997; Goldstein, 1991; Guo & Zhao, 2000; Hedeker, 2003; Hedeker & Gibbons, 1994; Rodriguez & Goldman, 2001; Subramanian, Nandy, Kelly, Gordon & Smith, 2004) have noted that the analysis that assumes independence of observations in clustered structured data is inclined to underestimate the variance of the estimated regression coefficients. The outcome of this inappropriate analysis is overestimation of the significance of the effects of the explanatory variables. In other words, such analyses as ordinary linear regression yield biased parameter estimates. This results into misleading inferences and conclusions concerning overall significance of the factors that influence the response variables of interest in the study.
Four models were fitted through the multilevel modelling technique. Model one was fitted without any exploratory variables or the intercept-only model (Wang, Xie & Fisher, 2012), which acts as a baseline model. Models two and three were fitted with school-level variables (PTR, PLR, PCR, and electricity) only and with student-level contextual proxy (secondary education and above of men and women 15-49 years, respectively). Model four was fitted including all explanatory variables. The glimmix procedure (SAS Institute Inc., 2009) in SAS version 9.2 (SAS Institute Inc., Cary, NC, USA) was used to carry out the analysis. Besides the multilevel models, for comparison purpose, another model (model five) was fitted through ordinary least square (OLS) regression method.
Results
Descriptive statistics
Table 1 provides selected descriptive statistics of variables. The mean (SE) pass rate was 52.9 (2.1) percent with Arusha, Dar es Salaam, Iringa, Tanga, and Kilimanjaro regions, in that order recording the first five highest PSLE pass rates, that is, 70.7, 65.2, 63.0, 62.5, and 62.4, respectively. Kigoma, Singida, Shinyanga, Mara, and Rukwa regions, in that order recoded the five lowest pass rates of 39.0, 39.3, 40.4, 43.3, and 45.0, respectively. Regarding PTR, the mean (SE) value was 50.1 (1.7) and the median value was 51.0. Of the 21 regions, 47.6% (n =10) had PTR values below the mean value and the remaining 52.4% (n =11) were above the mean value. The official standard value for PTR is 1:40 (RAWG, MKUKUTA Monitoring System & Ministry of Finance, 2012). More than 90% (n =19) of the total regions had PTR values above the standard or recommended value of PTR. Only two regions namely Kilimanjaro and Dar es Salaam had PTR values of 34 and 37, respectively. Other regions with PTR values close to the standard value of 40 were Coast and Arusha with PTR values of 41 and 42, respectively. Regions (zone) with the highest PTR values were Tabora and Kigoma (Western), which had 65, 59, respectively; Rukwa (Southern Highlands) which had 58; Mara and Mwanza (Lake), which had 57 each.
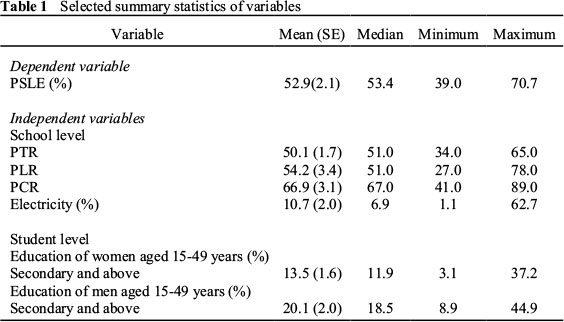
With regard to PLR and PCR, approximately 57.0% (n =12) and 48.0% (n =10) of the regions had PLR and PCR values below the mean values of 54.2 and 66.9, respectively. Regions (value) with extreme five highest observations of PLR were Tabora (78), Shinyanga (78), Mwanza (75), Dar es Salaam (74), and Kigoma (74). On the other hand, Iringa, Kilimanjaro, Rukwa, Manyara, and Tanga regions had the five extreme lowest observations: 27, 28, 36, 37, and 45, respectively. Likewise, Mwanza, Tabora, Rukwa, Kigoma, and Shinyanga had the highest values of PCR: 89, 89, 83, 82, and 80, respectively. Mbeya, Kilimanjaro, Pwani, Lindi, and Ruvuma featured in the category of five lowest observations with PCR values of 41, 43, 49, 53, and 54, respectively. In terms of proportion of schools with electricity, only 1.1% of the schools in Kigoma had electricity as opposed to 62.7 and 22.4% of the schools in Dar es Salaam and Arusha regions, respectively.
Women aged between 15 and 49 years in Dar es Salaam (Eastern zone) were more likely to have at least secondary education and above as opposed to their counterparts in Lindi (Southern zone), as shown by the minimum and maximum values in Table 1. Men in Dar es Salaam were more likely to have at least secondary school education than is the case with their counterparts in Arusha (Northern zone). The corresponding percentages in the two regions are 44.9 and 8.9, respectively represented by the minimum and maximum values in Table 1. Men in Lindi (Southern) followed by those in Singida and Dodoma (Central zone) were also less likely to have at least secondary school education and above with corresponding percentage values of 9.2, 10.9, and 11.8, respectively.
Correlation analysis results reveal that PCR, PLR, and PTR were negatively correlated with the outcome measure (performance in the PSLE). However, only the correlation coefficient between PTR and PSLE was significant at the 5% level (Pearson correlation coefficient = 0.74176, p = 0.0001). The correlation coefficient (p) values between PCR and PSLE and between PLR and PSLE are -0.38471 (0.851) and -0.39644 (0.0851), respectively. On the other hand, the correlations between PSLE and each of the variables availability of electricity in schools, and education of women and men were positive. Their corresponding correlation coefficient (p) values are 0.54226 (0.0111), 0.57169 (0.0068), and 0.22053 (0.3367).
Figure 3 plots (i) through (vi) give standardized values of pass rates in the PSLE contrasted with standardized values of each of the variables PTR, PLR, PCR, availability of electricity, and education of men and women. As shown in the plots, there appears to be close linkages between pass rates in the PSLE and most of the variables. For example, in plot number (i), regions with the above normal (higher) PTR values (e.g. Kigoma, Shinyanga, and Tabora in the Western zone (1)) have pass rates, which are generally below the normal rate. Moreover, there are disparities in terms of the two aspects (pass rate and PTR) both within and between zones. For example, in terms of pass rate, all the regions in the Northern zone (2: Arusha, Kilimanjaro, Manyara, and Tanga, respectively) and Eastern zone (6: Dar es Salaam, Morogoro, and Pwani, respectively) have values above the normal rate with Arusha having the highest value followed by Dar es Salaam (plot number (i)). Overall, plot number (i) indicates uniform distribution of deviation in the pass rates in the PSLE and PTR from the mean.
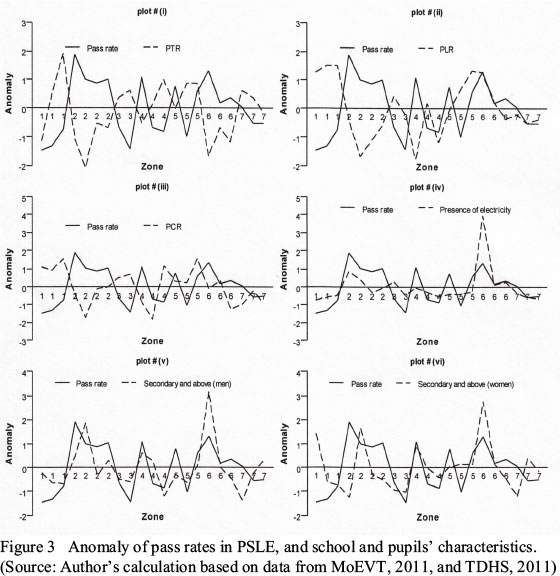
Ten regions have pass rate values below normal while the remaining 11 regions have pass rate values above normal. As for the PTR, 57.1% (n =12) of the regions have positive departure values and the remaining 42.9% (n =9) of the regions have negative departure values. A similar pattern was observed with respect to variables PLR, PCR, electricity, and education as noted previously. Overall, regions in the Western zone (1) have pass rates below average while those in the Eastern zone have pass rates above average and that almost equal numbers of departures from normal are located on both sides of plot numbers (i) to (vi).
Estimation results
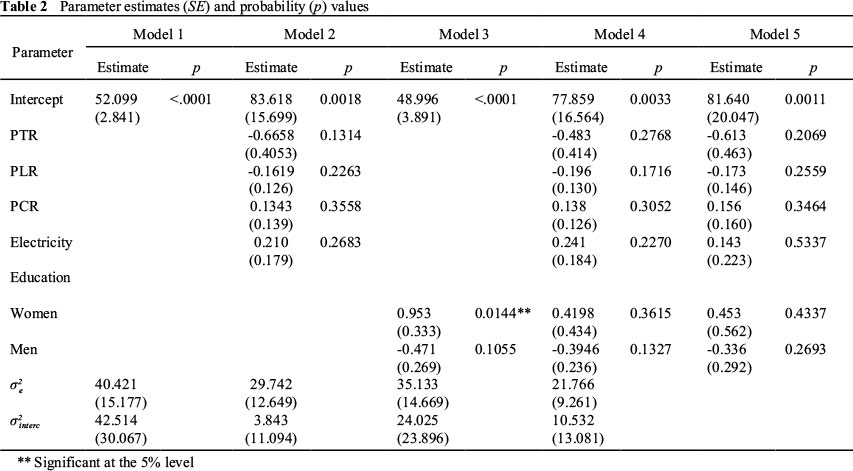
Table 2 presents multilevel (models 1-4) and OLS (model 5) estimation results. The model's estimated overall mean (SE) of the outcome measure (PSLE) for the empty model is 52.099 (2.841). From the estimates of model 1, it is revealed that 40.421 (σ2interc) of the total variation in the pass rates is at the students level; while 42.514 ( ) is at the school level, resulting into an intra-unit correlation (
 /(σ2nterc)) of about 0.49. That is to say, approximately 49.0% of the variance in the outcome measure is at the school level within regions. In other words, about 49.0% of the variance in the pass rates is due to variations between regions nested within zones. Models two through four examine what school-level variables and whether or not the student-level variable explains the between-zone variation in the pass rate in the PSLE.
With the exception of education level of women, which was found to be significant (p <0.05) in model three, all other variables were not significant (p >0.05). However, the effect of education of women became insignificant (p >0.05) in the full model (model four). Of all school level variables, PTR and PLR were found to be negatively associated with PSLE. In other words, higher values of these variables had negative effects on pass rate in the PSLE. Secondary education and above for men was also negatively associated with regional performance in the PSLE. All other variables were positively associated with pass rate in the PSLE. Generally, parameter estimates and standard errors for OLS were on average relatively larger than those of multilevel regression model four in Table 2, but the signs of the parameter estimates are equal in the two models (four and five).
Discussion
This study provides a contextual analysis of pass rates in the PSLE in Mainland Tanzania with 21 regions geographically distributed into seven zones. The findings reveal that differences in pass rates in the PSLE exist both within and between geographic zones. Students in the Northern zone, which includes Arusha, Kilimanjaro, Manyara, and Tanga regions, and those in the Eastern zone, which includes Dar es Salaam, Morogoro, and Pwani regions had, on average, higher pass rates than students in the remaining geographic zones. The high-performing zones (Northern and Eastern) were also observed to have on average, low values of PTR, PLR, and PCR than in the other zones. This association suggests potential effects of school-level resources on pupils' performance in the PSLE. For example, the findings reveal that classes in Tabora region, which is in the Western part of the country, had about double the number of pupils as opposed to classes in Kilimanjaro region, which is in the Northern zone. The corresponding pass rates in these regions were 45.8 and 62.4, respectively. Allocation of teachers to regions, districts, and schools has long been a major challenge in the education sector in Tanzania. RAWG et al. (2012) notes that rural areas experience more difficulties in recruitment and retention of teachers especially females; and this may possibly have an impact on girls' attendance hence their performance. Large gender inequalities in teaching staff have an effect on the quality of education and the demand for education especially among the girls. In Tanzania, more than 50% of primary school teachers are women. However, there are large disparities between districts in the number of female teachers in primary schools in Tanzania. The difference is even more striking between rural and urban schools.
The observed large geographic disparities in indicators of quality in primary education, hence, the differences in education outcome, appear to be largely due to inequalities in the allocation of financial resources. For example, during the 2008/09 fiscal year, the 10 Local Government Authorities (LGAs) with the highest budgets for staffing per child aged 7-13 years received on average about eight times higher than the ten LGAs with the lowest budgets. Moreover, in the 20% of the districts with the highest budgets, the average PTR was 44 compared to 70 in the 20% districts with the smallest budgets (RAWG et al., 2009). It is reported that the amount of funding for primary education has increased at a rate of about 17%. Nevertheless, equity in allocations of funds for primary education activities has not been achieved (RAWG et al., 2009). Distribution impact of resources is also reflected in the mean distances to the nearest primary school across geographic regions. According to the 2007 household budget survey (National Bureau of Statistics, 2011), 71.8% of households in Dar es Salaam region were less than one kilometer away from a primary school as opposed to 60.5 or 33.3% in other urban or rural areas.
The parameter estimates for PTR and PLR had the expected negative signs, suggesting that regions with high values of these variables were more likely to have fewer students passing the PSLE. This finding holds for both models two and four in which the variables under reference were included. This is not surprising since in situations where there is less authoritarian monitoring of pupils' progress and/or where teachers are not well remunerated, high classes may dissuade the teacher from providing them (students) with as many exercises as possible; which might improve understanding among students of various aspects of the subject matter. On the other hand, schools with many latrines in relation to pupils may have a positive effect on school attendance rates.
The study revealed a positive coefficient for the input variable PCR. The positive coefficient for this variable reflects (other things remaining the same) greater school performance in the PSLE. This finding is counterintuitive in the right of the wealth of studies, which have revealed positive impacts of smaller class sizes in terms of academic achievement. Bourke (1986) makes similar observations, regarding positive effects of class size on academic achievement. While focusing on the effect of class size on mathematics achievement, the author (Bourke, 1986:558) reports that: smaller classes promote higher achievement, better attitudes, different instructional practices, higher teacher satisfaction and morale than is the case with large classes. The positive sign for the coefficient of PCR in the current study appears to be due to the inclusion of variable PTR in the same model as the two variables were highly significantly correlated (Pearson correlation coefficient = 0.664, p = 0.001). When only the variable PCR was considered, the coefficient for PCR had the desired negative sign, suggesting that schools with smaller class sizes have higher academic achievement. The variable availability of electricity in schools had also the desired positive sign, implying that regions with high availability of electricity had greater performance in the PSLE.
The results of the student-level variable reveal that education of women has a positive effect whereas that of men has a negative effect on the performance of pupils in the PSLE. The former has the expected sign while the latter does not have the expected sign. The finding that education of men was negatively associated with pass rate in the PSLE is not consistent with the findings from studies such as Malmberg and Sumra (1998-2001), which reported a positive impact of parents' education on students' achievements in primary school in Tanzania. We noted earlier that in a study on the relationship between socio-cultural factors and students' achievement in primary school, parents' education level was an important determining factor. One of the reasons for a negative sign of the coefficient for men's education could be due to the fact that both women's as well as men's education were used as proxies of socio-economic background of the environment in which the students found themselves. If we had used the actual education of women from which the students come, the sign would most likely have been different. This is especially true because of the enormous evidence linking the out-of-school socio-economic context and academic development, with children from lower SES lagging behind in achievement levels as opposed to those from higher SES (Alexander, Entwisle & Olson, 2001; Becker, 2003).
The results of the p values for the effects of both school-level variables and student-level variable show that only education of women in model three had a statistical significant effect. All the other variables did not show any significant effects (in statistical terms) on the between-zone (hence regions) variation in pupils' performance in the PSLE. This result could be due to unobserved school-level factors. This is evidenced by a large between-zone variance in models two through four. That is, much of the between-zone variability is not explained by the observable school-level and the student-level variables used in the study. Because of unavailability of any other relevant information, the analysis in this paper considered only the amount not the quality or type of these and other key school-level variables. Information such as teachers' experience and abilities would have shed more light on the true impact of the resource inputs, which were considered in this study. Heyneman and Loxley (1983) analyzed the effect of primary school quality on academic achievement across 29 high-income and low-income countries, and concluded that the quality of schools and teachers is an important predictor of students' achievement.
It is argued (Hall, 1984) that regional disparities in resources is a development process in most third world countries since in these countries capital for investment is meagre; thus there is a tendency for key infrastructures, economic activities and services to be concentrated in a few core regions, which are endowed with resources. As development steadily increases, the benefits gained are diffused to regions initially disadvantaged, leading to a balanced development structure across regions. However, as Roden (1974) notes, continued and unregulated expansion in one region will adversely affect development in other regions. The author observes specifically that once a particular region manages to advance in terms of development because of some initial benefits, the "backwash effect" (Roden, 1974:498) or "polarization effect" (Roden, 1974:498) that arises as productive resources such as labour, capital, and commodities, which are drawn into the developed area, will significantly limit the chances for development in the remaining parts of the country. This is particularly the case since in poor countries the "spread" (Roden, 1974:498) effects or "trickling down" (Roden, 1974:498) effects from the privileged regions are usually too weak to correct the imbalance, a consequence that leads to an increase in regional inequalities. In the context of Tanzania, after five decades since independence, there are glaring regional inequalities in education resources such as PTR, which is probably a direct effect of the differences in socio-economic development across regions. In some regions, especially in rural areas, the working environment is still not conducive. Thus, retention of qualified staff including teachers in the public schools is one of the challenges that face the education sector (MoEVT, 2011). We observed for example, that while PTR in Kilimanjaro and Dar es Salaam regions were 34 and 37 respectively, the corresponding value in Tabora region was 65. This is consistent with the observation from a recent comprehensive analysis (URT, 2012) of the education sector in Tanzania, which reveals the provenance of regional disparities in education resources.
Resource allocation to regions and local governments (the implementers of sectoral plans at the regional and local government levels) in Tanzania is through strategic budget allocation system and formula-based allocation (FBA), respectively (URT, 2011). However, the former system has not been guaranteed. Thus, measures are necessary in order to enhance efficacy in resource allocation (Mashindano & Maro, 2011). Equally, FBA endures several challenges that need to be addressed in order to ensure equitable distributions of funds as noted in URT (2010).
Retrospectively, Tanzania's focus of attention on rural development began as early as the second half of the first decade after independence with much emphasis during the second (1969-74) development plan (Collins, 1974). Nevertheless, rural-urban migration especially to regions like Dar es Salaam is still a challenge. In 2004, the annual influx rate for people seeking permanent residence in Dar es Salaam was estimated to be about 10 percent, majority of whom were from the rural areas, according to Dar es Salaam City Council (DCC, 2004).
Inequitable distribution of resources is a major challenge in both emerging economies and resource constrained countries. In Brazil, for example, while access to basic education is universal, unequal distribution of key educational resources, including computers, is a significant policy challenge (Fidalgo-Neto, Tornaghi, Meirelles, Berçot, Xavier, Castro & Alves, 2009). In Uganda, the northern region features poorly in education quality and performance in primary schools mainly because of being resource depleted area relative to other regions in the country (Higgins, 2009).
Conclusion
Regional pass rates in PSLE are found to be negatively associated with regional PTR and PLR. Additionally, large disparities in education resources exist across geographic zones. The study revealed the existence of discernible patterns of performance between geographic zones that appear to be advantaged and others that seem to be disadvantaged. Regions with high performance in the PSLE also appear to be better off in terms of school-level educational resource inputs and social-economic background in which the pupils reside compared to those with low performance. Specifically, regions in the Northern and in the Eastern zones generally seem to have on average, better school-level resource inputs, hence, better pupils' performance in the PSLE compared to the remaining geographic zones. With regard to women, secondary education and above shows a significant effect on between-zone, hence, region variation in the performance in the PSLE in Tanzania. Thus, there is need to formulate policies geared towards promoting enrolment of women in higher education in Tanzania to ensure that children realise their potential in education, hence, in their socio-economic achievement later in life. This is particularly true because of a strong linkage that exists between education and women's autonomy as revealed in Sujatha and Reddy (2009) and Moursund and Kravdal (2003). Investment in higher education of women, especially in rural areas, would increase their decision-making power and control over resources. Hence, as previously noted, become much better in decision making regarding resources allocation and which are useful to their children. This observation is consistent with that noted earlier from Khandker (1987) and Meeker and Meekers (1997), in the section on data, that women are often directly involved in the production of non-market goods including education. In this connection, measures that will ensure efficient allocation of resources across regions are needed in order to address large regional differentials in key educational and socio-economic resources. In particular, as also recommended in RAWG et al. (2012), policies and motivation schemes that will attract teachers to work in rural areas need to be set up.
Acknowledgements
The author acknowledges the valuable comments and suggestions provided by two anonymous reviewers on the previous versions of the paper.
Notes
1 According to UNDP (2011), bottom five countries based on HDI score were DRC, Niger (N), Burundi (BRD), Mozambique (MZQ), and Chadi (CHD). Tanzania (TZ) was not ranked among the bottom countries in terms of HDI score, however was included in Figure 1 for reference purpose.
2 UNDP (2011:161) defines adult literacy rate, GER and PTR as "percentage of the population ages 15 and older who can, with understanding, both read and write a short simple statement on their everyday life, total enrolment in a given level of education (primary, secondary or tertiary), regardless of age, expressed as a percentage of the official school-age population for the same level of education, and average number of pupils (students) per teacher in primary education in a given school year".
3 Regions are: 1=Arusha; 2=Dar es Salaam; 3=Dodoma; 4=Iringa; 5=Kagera; 6=Kigoma; 7=Kilimanjaro; 8=Lindi; 9=Manyara; 10=Mara; 11=Mbeya; 12=Morogoro; 13=Mtwara; 14=Mwanza; 15=Pwani; 16=Rukwa; 17=Ruvuma; 18=Shinyanga; 19=Singida; 20=Tabora; and 21=Tanga.
4 National average estimate on members of households with office work employment was not available, thus regional percentages were compared with average (computed as the total percentage divided by 21).
5 At the time of preparation of the manuscript of this paper, Mainland Tanzania had 21 administrative regions.
6 In this paper, the abbreviation PTR was used for consistency purposes, values used in the analysis on this aspect were those of Pupil per Qualified Teacher Ratio in MoEVT (2011). According to the 1995 ETP (MoEC, 1995), the minimum qualification for a primary school teacher is a Grade A (Form 4 education plus two years teacher education) certificate.
7 In the context of health, for example, it has been noted (for example e.g., Allendorf, 2007) that women with greater decision-making power and control over resources are better positioned to make resources allocation decisions that are beneficial to their children.
8 Zones (regions) are: 1: Western (Tabora, Shinyanga, Kigoma); 2: Northern (Kilimanjaro, Tanga, Arusha, and Manyara); 3: Central (Dodoma, Singida); 4: Southern Highlands (Mbeya, Iringa, and Rukwa); 5: Lake (Kagera, Mwanza, and Mara); 6: Eastern (Dar es Salaam, Pwani, and Morogoro); and 7: Southern (Lindi, Mtwara, Ruvuma).
References
Adler NE, Boyce T, Chesney MA, Cohen S, Folkman S, Kahn RL & Syme SL 1994. Socioeconomic status and health: The challenge of the Gradient. American Psychologist, 49(1):15-24. Available at http://www.psy.cmu.edu/~scohen/Adler,%20N.%20E.,%20Boyce,%20T.,%20Chesney,%20M.%20A.,%20Cohen,%20S.,%20Folkman,.pdf. Accessed 7 March 2014. [ Links ]
Adler NE, Boyce WT, Chesney MA, Folkman S & Syme SL 1993. Socioeconomic Inequalities in Health: No Easy Solution. JAMA, 269(24):3140-3145. doi:10.1001/jama.1993.03500240084031 [ Links ]
Alexander KL, Entwisle DR & Olson LS 2001. Schools, Achievement, and Inequality: A Seasonal Perspective. Educational Evaluation and Policy Analysis, 23(2):171-191. doi: 10.3102/01623737023002171 [ Links ]
Allendorf A 2007. Couples' reports of women's autonomy and health-care use in Nepal. Studies in Family Planning, 38(1):35-46. doi: 10.1111/j.1728-4465.2007.00114.x [ Links ]
Asadullah MN & Yalonetzky G 2012. Inequality of Educational Opportunity in India: Changes Over Time and Across States. World Development, 40(6):1151-1163. http://dx.doi.org/10.1016/j.worlddev.2011.11.008 [ Links ]
Barro RJ & Lee J-W 2001. International data on educational attainment: updates and implications. Oxford Economic Papers, 53(3):541-563. doi: 10.1093/oep/53.3.541 [ Links ]
Becker R 2003. Educational Expansion and Persistent Inequalities of Education: Utilizing Subjective Expected Utility Theory to Explain Increasing Participation Rates in Upper Secondary School in the Federal Republic of Germany. European Sociological Review, 19(1):1-24. doi: 10.1093/esr/19.1.1 [ Links ]
Benavot A & Riddle P 1988. The Expansion of Primary Education, 1870-1940: Trends and Issues. Sociology of Education, 61(3):191-210. doi: 10.2307/2112627 [ Links ]
Birdsall N, Ross D & Sabot R 1995. Inequality and Growth Reconsidered: Lessons from East Asia. The World Bank Economic Review, 9(3):477-508. Available at http://www.jstor.org/stable/3989851. Accessed 7 March 2014. [ Links ]
Bourke S 1986. How Smaller Is Better: Some Relationships between Class Size, Teaching Practices, and Student Achievement. American Educational Research Journal, 23(4):558-571. doi: 10.3102/00028312023004558 [ Links ]
Collins P 1974. Decentralisation and Local Administration for Development in Tanzania. Africa Today, 21(3):15-25. Available at http://www.jstor.org/stable/4185422. Accessed 7 March 2014. [ Links ]
Dar es Salaam City Council (DCC) 2004. Dar es Salaam City Profile. Available at http://www.google.co.za/url?sa=t&rct=j&q=&esrc=s&source=web&cd=7&ved=0CEIQFjAG&url=http%3A%2F%2Fjp1.estis.net%2Fincludes%2Ffile.asp%3Fsite%3Dchip%26file%3D12C88AF9-65B0-4C84-B3AD-E2642199873F&ei=NJ4ZU7_1KYWqhAecl4GYBw&usg=AFQjCNEv5YllGaa-z8wnQh-1SXp9gZr65g&bvm=bv.62578216,d.ZG4. Accessed 18 August 2011. [ Links ]
Fidalgo-Neto AA, Tornaghi AJC, Meirelles RMS, Berçot FF, Xavier LL, Castro MFA & Alves LA 2009. The use of computers in Brazilian primary and secondary schools. Computers & Education, 53(3):677-685. http://dx.doi.org/10.1016Zj.compedu.2009.04.005 [ Links ]
Foster P 1980. Education and Social Inequality in Sub-Saharan Africa. The Journal of Modern African Studies, 18(2):201-236. Available at http://www.jstor.org/stable/160278. Accessed 7 March 2014. [ Links ]
Gibbons RD & Hedeker D 1997. Random Effects Probit and Logistic Regression Models for Three-Level Data. Biometrics, 53(4):1527-1537. doi: 10.2307/2533520 [ Links ]
Glass GV & Smith ML 1979. Meta-Analysis of Research on Class Size and Achievement. Educational Evaluation and Policy Analysis, 1(1):2-16. Available at http://www.jstor.org/stable/1164099. Accessed 7 March 2014. [ Links ]
Glick P & Sahn DE 2010. Early Academic Performance, Grade Repetition, and School Attainment in Senegal: A Panel Data Analysis. The World Bank Economic Review, 24(1):93-120. doi: 10.1093/wber/lhp023 [ Links ]
Goldstein H 1991. Multilevel Modelling of Survey Data. Journal of the Royal Statistical Society. Series D (The Statistician), 40(2):235-244. doi: 10.2307/2348496 [ Links ]
Goldstein H & Blatchford P 1998. Class Size and Educational Achievement: A Review of Methodology with Particular Reference to Study Design. British Educational Research Journal, 24(3):255-268. doi: 10.1080/0141192980240302 [ Links ]
Grogan L 2008. Universal Primary Education and School Entry in Uganda. Journal of African Economies, 18(2):183-211. [ Links ]
Guo G & Zhao H 2000. Multilevel Modelling for Binary Data. Annual Review of Sociology, 26:441-462. Available at http://www.jstor.org/stable/223452. Accessed 10 March 2014. [ Links ]
Hall C 1984. Regional Inequalities in Well-Being in Costa Rica. Geographical Review, 74(1):48-62. doi: 10.2307/214760 [ Links ]
Hedeker D 2003. A mixed-effects multinomial logistic regression model. Statistics in Medicine, 22:1433-1446. [ Links ]
Hedeker D & Gibbons RD 1994. A Random-Effects Ordinal Regression Model for Multilevel Analysis. Biometrics, 50(4):933-944. Available at http://www.uic.edu/classes/bstt/bstt513/rrmord.pdf. Accessed 10 March 2014. [ Links ]
Heyneman SP & Loxley WA 1983. The Effect of Primary-School Quality on Academic Achievement Across Twenty-nine High- and Low-Income Countries. American Journal of Sociology, 88(6):1162-1194. Available at http://www.jstor.org/stable/2778968. Accessed 26 March 2014. [ Links ]
Higgins K 2009. Regional Inequality and Primary Education in Northern Uganda (Policy Brief No 2). Prepared for the World Development Report 2009. Available at http://www.odi.org.uk/sites/odi.org.uk/files/odi-assets/publications-opinion-files/3377.pdf. Accessed 10 February 2013. [ Links ]
Kaul R 2001. Accessing Primary Education: Going beyond the Classroom. Economic and Political Weekly, 36(2):155-162. Available at http://www.jstor.org/stable/4410171. Accessed 10 March 2014. [ Links ]
Khandker SR 1987. Women's time allocation and household nonmarket production in rural Bangladesh. The Journal of Developing Areas, 22(1):85-102. Available at http://www.jstor.org/stable/4191620. Accessed 10 March 2014. [ Links ]
Malmberg L-E & Sumra S 1998-2001. Socio-cultural Factors and Tanzanian Primary School Students' Achievements and School Experience. UTAFITI [New Series] Special Issue, 4:207-219. Available at http://archive.lib.msu.edu/DMC/African%20Journals/pdfs/Utafiti/s4NS/aejps004NS013.pdf. Accessed 10 March 2014. [ Links ]
Mashindano O & Maro F 2011. Growth without poverty reduction in Tanzania: Reasons for the mismatch. Chronic Poverty Research Centre Working Paper No. 207. Available at http://www.chronicpoverty.org/uploads/publication_files/WP207%20Mashindano%20Maro.pdf. Accessed 15 November 2012. [ Links ]
Meeker J & Meekers D 1997. The Precarious Socio-Economic Position of Women in Rural Africa: The Case of the Kaguru of Tanzania. African Studies Review, 40(1):35-58. doi: 10.2307/525032 [ Links ]
Ministry of Education and Culture (MoEC) 1995. Education and Training Policy. The United Republic of Tanzania: The Ministry of Education and Culture Dar es Salaam. Available at http://www.moe.go.tz/index.php?option=com_docman&task=doc_view&gid=108&Itemid=617. Accessed 10 March 2014. [ Links ]
Ministry of Education and Vocational Training (MoEVT) 2011. Basic Education Statistics in Tanzania 2007-2011. United Republic of Tanzania: Ministry of Education and Vocational Training. [ Links ]
MoEVT 2008. Basic Education Statistics in Tanzania 2004-2008. United Republic of Tanzania: Ministry of Education and Vocational Training. [ Links ]
Moursund A & Kravdal 0 2003. Individual and Community Effects of Women's Education and Autonomy on Contraceptive Use in India. Population Studies, 57(3):85-301. doi: 10.1080/0032472032000137817 [ Links ]
Mungai AM 2012. Academic achievement of girls in rural schools in Kenya. Africa Education Review, 9:63-85. [ Links ]
National Bureau of Statistics 2011. National Household Budget Survey 2007. United Republic of Tanzania. Available at http://www.nbs.go.tz/tnada/index.php/catalog/27reports. Accessed 10 January 2013. [ Links ]
Nye B, Hedges LV & Konstantopoulos S 2000. The Effects of Small Classes on Academic Achievement: The Results of the Tennessee Class Size Experiment. American Educational Research Journal, 37(1):123-151. doi: 10.3102/00028312037001123 [ Links ]
Research and Analysis Working Group (RAWG), MKUKUTA Monitoring System & Ministry of Finance 2012. Poverty and Human Development Report 2011. United Republic of Tanzania: Research on Poverty Alleviation (REPOA). Available at http ://www.repoa.or.tz/documents/Poverty_and_Human_Development_Report_2011.pdf. Accessed 13 March 2014. [ Links ]
RAWG, MKUKUTA Monitoring System & Ministry of Finance and Economic Affairs 2009. Poverty and Human Development Report 2009. United Republic of Tanzania: Research on Poverty Alleviation (REPOA). Available at http://www.povertymonitoring.go.tz/WhatisNew/PHDR%202009%20text.pdf. Accessed 13 March 2014. [ Links ]
RAWG, MKUKUTA Monitoring System & Ministry of Planning, Economy & Empowerment 2007. Poverty and Human Development Report 2007. United Republic of Tanzania: Research on Poverty Alleviation (REPOA). Available at http://www.repoa.or.tz/documents_storage/Preliminaries.pdf. Accessed 13 March 2014. [ Links ]
Roden D 1974. Regional Inequality and Rebellion in the Sudan. Geographical Review, 64(4):498-516. doi: 10.2307/213706 [ Links ]
Rodriguez G & Goldman N 2001. Improved estimation procedures for multilevel models with binary response: a case-study. Journal of the Royal Statistical Society: Series A (Statistics in Society), 164(2):339-355. doi: 10.1111/1467-985X.00206 [ Links ]
Roscigno VJ & Ainsworth-Darnell JW 1999. Race, Cultural Capital, and Educational Resources: Persistent Inequalities and Achievement Returns. Sociology of Education, 72(3):158-178. doi: 10.2307/2673227 [ Links ]
Ross CE & Wu C 1995. The Links Between Education and Health. American Sociological Review, 60(5):719-745. Available at http://www.jstor.org/stable/2096319. Accessed 17 March 2014. [ Links ]
Samoff J 1987. School Expansion in Tanzania: Private Initiatives and Public Policy. Comparative Education Review, 31(3):333-360. Available at http://www.jstor.org/stable/1188569. Accessed 17 March 2014. [ Links ]
SAS Institute Inc. 2009. SAS/STAT® 9.2 User's Guide (2nd ed). Cary, NC: SAS Institute Inc. Available at https://support.sas.com/documentation/cdl/en/statug/63033/PDF/default/statug.pdf. Accessed 20 January 2014. [ Links ]
Shindler J & Fleisch B 2007. Schooling for All in South Africa: Closing the Gap. Review of Education, 53:135-157. doi: 10.1007/s11159-007-9038-z [ Links ]
Sirin SR 2005. Socioeconomic Status and Academic Achievement: A Meta-Analytic Review of Research. Review of Educational Research, 75(3):417-453. doi: 10.3102/00346543075003417 [ Links ]
Subramanian SV, Nandy S, Kelly M, Gordon D & Smith GD 2004. Health Behaviour in Context: Exploratory Multi-Level Analysis of Smoking, Drinking and Tobacco Chewing in Four States. Economic and Political Weekly, 39(7):684-693. Available at http://www.jstor.org/stable/4414644. Accessed 17 March 2014. [ Links ]
Sujatha DS & Reddy GB 2009. Women's Education, Autonomy, and Fertility Behaviour. Asia-Pacific Journal of Social Sciences, 1(1):35-50. [ Links ]
TDHS 2011. Tanzania Demographic and Health Survey 2010. Tanzania & USA: National Bureau of Statistics & ICF Macro. Available at http://www.measuredhs.com/pubs/pdf/FR243/FR243[24June2011].pdf. Accessed 10 January 2013. [ Links ]
United Nations Development Programme (UNDP) 2011. Human Development Report 2011. Sustainability and Equity: A Better Future for All. New York: UNDP. Available at http://www.undp.org/content/dam/undp/library/corporate/HDR/2011%20Global%20HDR/English/HDR_2011_EN_Complete.pdf. Accessed 19 January 2013. [ Links ]
United Republic of Tanzania (URT) 2012. Tanzania Education Sector Analysis: Beyond Primary Education, the Quest for Balanced and Efficient Policy Choices for Human Development and Economic Growth. United Republic of Tanzania: Ministry of Education and Vocational Training. Available at http://unesdoc.unesco.org/images/0021/002152/215247e.pdf. Accessed 5 January 2013. [ Links ]
URT 2011. Guidelines for the Preparation of Plan and Budget for 2011/12 within the Five Year Development Plan Framework (2011/12 - 2015/16) (Part I & II). United Republic of Tanzania: Ministry of Finance. Available at http ://www.mof.go.tz/mofdocs/budget/Guideline/PBG%202011_12%20TRH%2018_MARCH%20_%20FINAL.pdf. Accessed 5 January 2013. [ Links ]
URT 2010. Assessment of the Effectiveness of Formula Based Budgetary Allocation to Local Government Authorities, Final Report. United Republic of Tanzania: Ministry of Finance and Economic Affairs. Available at http://www.tzdpg.or.tz/index.php?eID=tx_nawsecuredl&u=0&file=uploads/media/Final_Report_FBA_25_JUNE_2010.pdf&t=1458266551&hash=688d6f9fd63ab4fc7102bb3429f49c7087244b97. Accessed 5 January 2013. [ Links ]
URT 2006. Tanzania Census 25th August - 4th September 2002: Analytical Report (Volume X). United Republic of Tanzania: National Bureau of Statistics, Ministry of Planning, Economy and Empowerment. Available at http://www.nbs.go.tz/takwimu/references/2002popcensus.pdf. Accessed 17 November 2012. [ Links ]
Wang J, Xie H & Fisher JH 2012. Multilevel models: Applications using SAS®. Berlin/Boston: Higher Education Press and Walter de Gruyter GmbH & Co. KG. [ Links ]

