


Services on Demand
Article
 English (pdf)
 Article in xml format
 Article references
Indicators

Related links
-
 Cited by Google
 -
 Similars in Google
Share

 Permalink
South African Journal of Education
On-line version ISSN 2076-3433
Print version ISSN 0256-0100
S. Afr. j. educ. vol.34 n.2 Pretoria Jun. 2014
Technical efficiency and primary education in South Africa: evidence from sub-national level analyses
Nana Adowaa Boateng
Collaborative Africa Budget Reform Initiative nanab@alumni.lse.ac.uk
ABSTRACT
The paper examines the extent to which sub-national public officials are efficient in delivering basic education services and argues that technical inefficiencies, especially in the management of public funds for education, could potentially contribute to poor education service delivery in South Africa. A conceptual framework is proposed to show the underlying mechanisms by which these technical inefficiencies can adversely affect education outcomes. The analysis is based on two micro-level surveys that were applied at 175 public primary schools and 13 district education offices (DEOs) in two provinces in South Africa: the North-West Province and Gauteng. The analysis reveals that South Africa has a well-planned decentralised structure to administer education. However, districts have significant human resource constraints. Capacity is often lacking and record-keeping, particularly of financial information, is very poor. Lack of technical efficiency has resulted in misappropriation of funds (leakage) and extensive delays in remitting funds to schools. The paper concludes that these inefficiencies potentially affect education outcomes and therefore should be given due consideration when designing and implementing education policy reforms.
Keywords: education finance, education outcomes, education policy, educational administration, Gauteng province, North-West Province, South Africa, technical efficiency
Introduction
In many emerging economies in Africa and worldwide, sizable investments have been made in primary education with the expectation of a skilled and healthy labour force, increased productivity, higher wages and high employment rates. Despite these investments, the global south continues to trail behind in terms of these desired outcomes. It has been traditionally thought that poor education outcomes are caused by under-spending by governments or high unit costs of schooling, but scholars are increasingly finding that inefficiencies or misappropriation of resources or both potentially explain the dire education outcomes. South Africa is an appropriate case-study because it is an emerging economy with robust infrastructure, impressive growth rates and currently spends about 5.5 per cent of its Gross Domestic Product (GDP) on education. At the same time, the country is burdened with levels of academic achievement that are on par or even worse than other developing countries who spend only a fraction of what South Africa spends on education. This study essentially cautions against the temptation to respond to education deficiencies by increasing expenditure as is done in many developing and emerging countries. It argues that some focus on the technical capacity of governments to manage resources and deliver quality services is an important consideration, though often ignored, in the processes of making spending more efficient and fostering better education outcomes. In doing so, this paper makes a significant contribution to the economics of education literature as well as the education policy space.
The administration of primary education in South Africa needs to be understood in its historical context, where racial inequality was the order of the day before democracy in 1994. At the peak of apartheid, schools serving white students received more than ten times the funding per pupil than schools serving black students (Fiske & Ladd, 2005). Resources were lavished on white schools, while black schools were hugely deprived of resources. Poor education kept black children out of the modern sectors of the economy and ensured a steady supply of cheap labour. The new democratic government that emerged in 1994 was faced with the daunting task of correcting this anomaly by providing equal educational opportunities to all South Africans. The new Constitution guaranteed all South Africans the right to basic education. A Plan of Action was drawn up in 2003 by the then Department of Education (DoE) to improve access to free and quality basic education for all. The emphasis in this Plan of Action was on ensuring that the poorest 40 per cent of learners in South Africa continued to experience improvements in the quality of the schooling they received, and that all barriers to access were removed (DoE, 2003).
The reforms also required provincial and district education departments to be responsible for implementing educational policies established by the central government. District offices would be responsible specifically for the management of a category of schools known as 'non-Section 21 schools', which had not been granted approval to procure their own goods and services and, therefore, had to procure these through departmental arrangements. In addition, districts, through their Institutional Development and Support Officers (IDSOs), would promote the implementation of policies by way of overall institutional development, support and training programmes. The specific responsibilities of district offices include: facilitating school governing bodies, monitoring and assessing school performance; collecting and maintaining information on institutional and district demographics; helping to establish financial and administrative management systems at schools; building and promoting a culture of teaching and learning; and redressing historical imbalances (Aheer, 2006).
In analysing the effectiveness of the decentralised management of education, the paper delves into the following questions. Are the current, decentralised education structures optimally designed to promote sound education outcomes? Is there adequate financial management capacity at the local government level? Are district offices properly equipped to enable officials to fully perform their functions? Are local education authorities provided with an enabling environment that incentivises optimal delivery of social services? Are government officials efficient in delivering good quality education services?
The paper begins with a conceptual framework that unpacks the relationship between technical efficiency and education outcomes. It then presents the research methodology. This is followed by an analysis of the decentralised education structure in the two provinces and how the structural design hinders or promotes effective service delivery. The subsequent sections focus on financial management, an analysis of human resource capacity and the evidence of technical inefficiency as indicated by delays in disbursements of funds and incidents of financial misappropriations (leakages). The paper concludes with a summary and policy recommendations.
Conceptual framework
Technical efficiency pertains to the effectiveness with which inputs are used to produce outputs. It refers to the capacity of line agencies to use allocated resources in a manner that ensures the efficient and effective delivery of public goods and services (World Bank, 1998). Technical efficiency should result in reliable and predictable delivery of budgetary resources to spending units, as well as in timely external auditing. Therefore, a technically efficient government should, inter alia : be performance-orientated; be able to remit funds to schools on time; ensure that all funds leaving central government reach the intended beneficiaries; schedule supervisory visits to schools; and ensure that schools remain accountable by publishing and regularly auditing their accounts. The question, thus, is how these public expenditure management (PEM) qualities theoretically influence education outcomes. This is considered below with a focus on leakage/corruption, delays and accountability.
Leakage and education outcomes
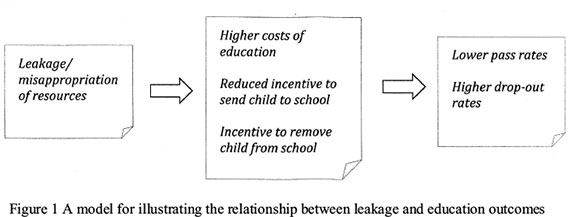
In the ideal flow chain,100 per cent of funds leaving the central government would reach the intended beneficiaries - schools. In the absence of proper checks and balances or sound public financial management, money is leaked at various levels (for instance, at the provincial DoE or the district education office). The remainder reaches the schools, many of which are not aware of the amount they are supposed to receive in the first place. The question then is how leakage adversely impacts on education outcomes? Education outcomes in this context, broadly refers not only to cognitive learning, but to other indicators that reflect poor quality and inefficiencies in the education system such as repetition and dropout rates. Despite some controversies around the usefulness of these indicators especially in the South African context, they have been acknowledged in an influential report as symptomatic of learning abilities and measures of internal inefficiencies (Ministerial Committee on Learner Retention in the South African Schooling System, 2008).
In addressing the central question posed above, there are two issues to keep in mind. Firstly, leakage could impact on education outcomes simply through reduced spending or through insufficient resources for educational development. Therefore, mechanisms explaining this link would focus on the effect of total public education resources on education and the effect of allocative decisions on education outcomes. Fewer resources, as a result of leakages, could mean less teaching and learning materials afforded to schools. The second aspect pertains to corruption and the mechanisms by which corruption potentially affects the provision of quality education.
Several studies have examined the impact of corruption on social services (see, for instance, Kaufmann, Montorriol-Garriga & Recanatini, 2008; Mauro, 1998). These studies offer insights into the underlying mechanisms by which leakage (corruption) impacts on education outcomes. Gupta, Davoodi and Tiongson (2000) argue, on the basis of a review of available studies, that there are three channels through which corruption adversely impacts on social service delivery. Firstly, it can drive up the price and lower the level of government outputs and services; secondly, it can reduce investment in human capital; and, thirdly, it reduces government revenue, which, in turn, can lower the quality of publicly provided services. Misappropriation of education funds by government officials, therefore, can drive up the price of education. This could result in a transfer of costs to parents, as fee-charging schools may have to raise their fees, given the shortage of funds. For low-income parents, this would be a form of regressive tax, which absorbs a greater share of poorer parents' income than that of wealthier parents. Furthermore, parents who cannot afford to pay may become discouraged and remove their children from the school (see, for instance, Kaufmann et al., 2008, who confirm this occurrence in their research finding that corruption, in the form of bribery, discourages low-income users from seeking public services). These linkages are captured in Figure 1.
Leakage of public funds can be an additional burden on school governing bodies (SGBs), which have to intensify fund-raising efforts, possibly at the expense of other functions. Consequently, leakage has potentially serious implications for the process of administrating quality education in South Africa.
Delays, accountability and education outcomes
Technical inefficiency that results in delays in remitting funds to schools potentially affects the school's ability to plan effectively for the academic year. Delays and bottlenecks in the allocation of public resources (for example, salaries, allowances, financing and materials) have been identified in tracking surveys as serious problems affecting quality of service and staff morale (Gauthier, 2006). In the case of South Africa, SGBs may not be able to hire extra teachers at the start of the year due to lack of funds. The school management might not be able to invest in additional resources, such as textbooks, if the materials allocated fall short of the required needs. A technically efficient DEO should be able to provide time and technical support to all schools within the district. Inadequate staff members or vehicles could impede technical efficiency, in which case some schools would not receive the necessary technical support.
Accountability implies that the government has a duty to explain and justify how it has used the public resources at its disposal (Heald, 1983). This demands positive behaviour; for instance, it should ensure that DEOs use their resources effectively and efficiently, knowing that there will be consequences, if they do not. Figure 2 illustrates the mechanisms by which the various components of technical efficiency are converted into education outcomes.
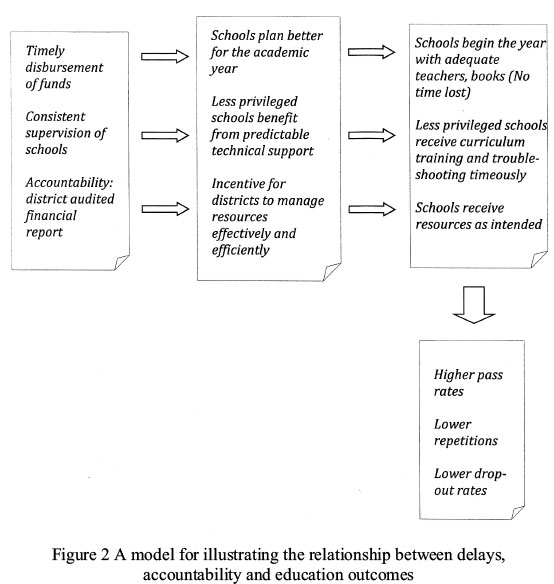
The conceptual framework provides the theoretical basis for the analysis. It shows that elements of technical efficiency potentially affect outcomes, and it clarifies the channels through which this happens. The following sections present the research framework and the findings from the analysis of the institutional arrangements and technical processes needed for good education outcomes.
Research framework and methodology
The study uses two micro-level surveys: a public expenditure tracking survey (PETS) and a quantitative service delivery survey (QSDS) to systematically analyse the effectiveness of public expenditure management systems in improving education in South Africa. It is the preferred instrument in this study because of the precision with which it "tracks" the flow of resources from the source to the end-user. The PETS and QSDS go beyond normal public expenditure reviews, which examine the composition of spending and sectoral allocations. They are tools that measure, quantitatively, provider incentives and behaviours and also allow lessons to be learned about the way spending is transformed into services (Dehn, Reinikka & Svensson, 2003). In this study, the surveys were applied at two levels: public primary schools and district education offices. For the primary schools survey, the head teacher/school principal was the main respondent. The district offices surveys were designed to have the district director as the main respondent with allowance for the heads of various units to fill in relevant parts of the questionnaire. All data were collected in the year 2007. Sensitivity and reliability analyses for checking consistency (e.g. whether the same result occurs regardless of the timing or assessor) and validity (e.g. whether the instrument actually measures what it is supposed to measure) was not undertaken. However, pre-testing of the surveys was done before the implementation of the full survey. This allowed for some minor adjustments to be made to survey.
District Education Office Surveys
Ten district education offices out of 15 were surveyed in Gauteng. While all 15 were targeted, five districts (Tshwane West, Ekurhuleni South, Ekurhuleni North, Sedibeng West and Johannesburg South) declined to participate. In North-West Province, the subnational administrative units are referred to as regions. There are only four in total. Of these, all but one region (Bojanala) which declined to participate, were surveyed. The survey collected data on human resource capacity, adequacy of facilities, travelling distance to schools, number of official cars, financial contributions to schools and adherence to the public financial management act of South Africa.
Primary schools survey
The study used a stratification technique. All schools were stratified according to district or region. This was to ensure that each school in a particular region or district had an equal chance of being selected. The stratification was followed by a simple random sampling method, also referred to as "epsem sampling" (equal probability of selection method) - a tool that is widely used in applied educational research because it usually leads to self-weighting in which a simple arithmetic mean obtained from the sample data is an unbiased estimation of the sample mean (Ross, 2005). A Statistical Package for the Social Sciences (SPSS) software was used to randomly select 8.5 per cent of schools from each strata, which would total 207 schools. The 8.5 per cent was guided by the fact that nationally and internationally comparable studies on education have used samples ranging from three to 18 per cent. Responses were, however, received from 175 schools. Of these, 96 were schools located in Gauteng and 79 were located in North-West Province. This represented 7.3 per cent and 7.1 per cent, respectively, with minor variations, percentage-wise, at district levels. Table 1 shows the sample allocation by region and district.
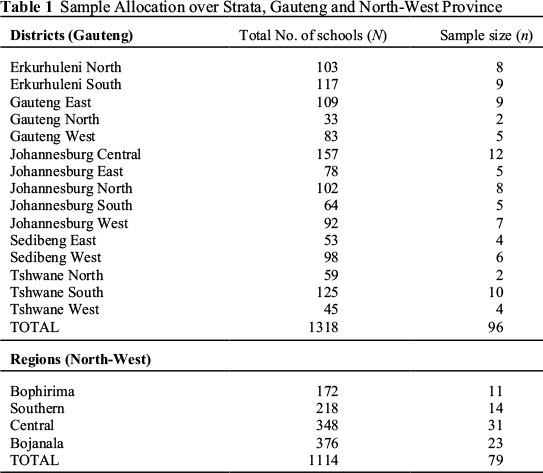
It is important to emphasise that sampling procedure did not take school size into account and, therefore, in the random selection some schools would have more pupils than others. This does not bias the study as the unit of analysis is at the school level and not the pupil level. Conclusions must also be interpreted as such.
The sample of 175 schools mirrored the actual population in the reflection of their poverty quintiles. Quintiles, in South Africa, are categories in which public schools are classified based on rates of unemployment, income and illiteracy within a school catchment area. Therefore, schools that are ranked within a lower quintile (between 1 and 3) would receive more subsidies as opposed to schools that are ranked in the fourth or fifth quintile, which are seen as privileged. There were about 20 per cent of schools in quintile 1; 15 per cent in quintile 2; 36 per cent in quintile 3; 17 per cent in quintile 4 and 12 per cent in quintile 5. Therefore, the majority of the schools fell in the low to medium poverty spectrum. All the schools were mixed gender schools. The student population ranged from 33 to 1,644 students with a median school population of 562 and an average of 633 students. In the survey, questions were asked about the characteristics of the school and the financial flows between government and schools. The findings are discussed in subsequent sections, starting with the district education offices surveys.
Findings on decentralisation and effective service delivery
Overview of decentralised education structures in Gauteng and North-West Province The administration of education in South Africa is decentralised, with the highest decision-making authority being the National DoE, followed by the Provincial Education Departments (PEDs). The PEDs are headed by Members of the Executive Council (MECs) for Education. The next position in the hierarchy at the provincial level is the Superintendent-General, who ensures that the PED is properly managed. A Deputy Director-General (DDG) or Head of Department (HoD) oversees the operations of the executive managers in charge of the district/regional levels. Below the provincial level, the structure varies by province. In Gauteng, there are DEOs in all districts, but in the North-West, clusters of districts are governed by Regional Education Offices (REOs), of which there are four. The decentralised structure at the provincial level is a devolution of power. PEDs have full authority and discretion over most of their own affairs. Beyond that level, it becomes a deconcentration of power, with districts and regions remaining under the hierarchal authority of the provinces.
At the time of the study, there were 15 DEOs governing a total of 1,880 public ordinary schools, 1,617,124 learners and 47,990 educators in Gauteng (National Treasury, 2007). In North-West Province, there were four REOs, supported by 21 Area Project Offices (APOs), governing 2,115 public ordinary schools, 894,249 learners and 30,388 educators (National Treasury, 2007). Due to resource constraints, the APOs are not fully established offices like the DEOs. They are smaller offices headed by a Chief Education Specialist (who serves at the level of a Deputy Director), assisted by managers and subject specialists offering direct support to schools. An APO generally provides support to a cluster of schools within a demarcated area (comprising several districts).
Effectiveness of sub-national education structures in providing advisory support to primary schools
The main purpose of DEOs is to support the delivery of the curriculum and ensure that all learners are afforded good educational opportunities (Roberts, 2001). District officials periodically visit schools for the following reasons, inter alia: inspection of the premises; assessment of students/teachers; evaluation of the quality of education; attending to specific problems that have been reported by the school principal; training of teachers on new curricula; school governance and management/conflict issues. While there is no theory as to the acceptable quantity of on-site visits to schools per term or per year, one can assume that at least one visit per term to each public school would be expected, and that it would appear irregular if some schools did not receive a single visit from a district official per school term for a quality assessment or any other reason.
The survey revealed that some schools did not have a single district official visit in a term. As there are four terms in a year, one would expect at least four visits per year. In Gauteng, however, there were instances of only one visit in a year. Some North-West schools did not see a district inspector at all during the year. Given that some schools in both provinces scarcely interact with district officials on the school premises, it was important to examine those schools. One would expect these schools to fall within the top quintiles, which is also a signal of a school performing well and, hence, needing fewer advisory/supervisory visits. Of the 175 schools surveyed, 44 schools (25 per cent) emerged with less than four visits over the school year, as reported by the school principals. The majority of these (64 per cent) were from North-West Province, especially from the Central Region. An explanation for this potentially lies in the province's sparsely populated areas and the considerable distances between schools and the REOs. This would pose some difficulties for the district inspectors. Nonetheless, it is worrying that up to five schools in the North-West did not receive a single visit from a district official in the entire academic year.
The study was further interested in determining the relationship between the number of supervisory visits received by a school and the socio-economic status of that school. From the group that received fewer than four visits in a year, 78 per cent fell within the high-poverty quintiles (quintiles 1 and 2). Contrary to expectations, therefore, a sizeable number of disadvantaged schools, which should require more technical assistance from the districts (be it by way of proactive or reactive visits), did not receive the required support, unless these schools were perceived by the districts to be efficient despite their disadvantages.
Financial management at the sub-national level
To a large extent, the management of education funds is tasked to provincial authorities. Some of this burden has been shifted to the districts/regions and schools. DEOs and REOs manage the funds for non-Section 21 schools (for example, paying their utility bills), while SGBs of Section 21 schools manage the funds received from the government. In the light of the fiscal responsibilities given to sub-national structures, it is important for local education offices to adhere to budgetary controls and other fiscal mechanisms observed at the national level.
The study found that all the DEOs and REOs surveyed had an accounting unit to handle financial and procurement matters for the office. In spite of this, it was observed that record-keeping in the finance offices was highly problematic in most districts. These challenges were more pronounced in North-West, where the regional offices frequently deferred questions on expenditure and finance issues to the province. When asked whether there was regular auditing of the district/regional accounts, eight districts/regions said 'yes' and three district/regions said 'no'. Upon further investigation, it was clarified that the visit by auditors to the district/regional offices as part of the audit exercise of the provincial audit was understood by district/regional officials to be an audit of their own office's accounts. Therefore, strictly speaking, the lower levels of the sub-national offices are not audited. The lack of auditing of the district and regional offices may be rationalised by the fact that these decentralised structures are simply deconcentrated structures with no distinct powers. However, as these offices manage not only their own accounts, but also those of non-Section 21 schools, one could question the practice of district/regional accounts going unaudited.
The study found further that district and regional education offices are not mandated to publish their financial accounts. Nevertheless, all 13 offices indicated that they operate within the regulations of the Public Finance Management Act 1 of 1999 (PFMA), which provide punitive measures for overspending or under-spending. Regardless, some of the districts and regions admitted that overspending and underspending had occurred in the past under certain budgetary items, but since the accounts are balanced at the provincial level, these anomalies are corrected at that level. This indicates that any mismanagement of funds at the district and regional level would be known only by provincial authorities and not by the public at large.
In terms of procurement, DEOs in Gauteng province procure goods and services through a centralised system known as the Gauteng Shared Services Centre (GSSC). The rationale for the GSSC is to harness the collective buying power of the Gauteng Provincial Government (GPG), thereby reducing the cost of goods and services. Consolidating and outsourcing office support functions would enable the decentralised education offices to focus on and excel in service delivery. Therefore, there is a strong justification for this system of procurement. There are, however, drawbacks according to some district officials. The predominant concern is that of delays. As the GSSC has to service 11 departments in the province, delays may be unavoidable. Some districts also feel that due to local knowledge, it would be more efficient and cost-effective for districts to procure their own goods and services. In North-West Province, REOs procure directly from the service providers. As explained by one chief director, REOs have to source three quotations before procuring goods or services, and the turnaround time is usually a month. Evidently, the two provinces have different procurement systems. Given that both provinces experience constraints in areas like infrastructure and maintenance, it is difficult to say which system is more effective and efficient.
Findings on district/regional education office human resource capacity The study found that none of the surveyed district and regional offices in Gauteng and North-West Province was fully staffed. The education sector tends to experience substantial horizontal and vertical movement of staff. It is common for teachers to leave schools and take up employment at DEOs/REOs, and for education officials to move from one DEO to another or from a DEO to an REO. Of the 13 education offices surveyed, seven provided complete information on the staff complement. The results showed that vacancy rates ranged from 13 per cent (Tshwane North district in Gauteng) to 43 per cent (Johannesburg West district in Gauteng), with significant variations within provinces (although it is not clear why there was so much intra-provincial variation). With the exception of the Gauteng North and Gauteng West districts, the remaining 11 DEOs/REOs surveyed admitted to experiencing staff shortages in 2007 and had notified the DoE. Of the ten DEOs/REOs that provided further information as to whether requests for posts to be filled were successful or not, only two DEOs indicated that requests were fully successful. For the others, the requests were either partially successful (3), not successful (2) or pending (3).
These responses show some level of dissatisfaction with the manner in which the department responds to human resource needs at the district and regional levels. One North-West REO indicated that staff shortages continue to be a problem because the advertisement of staff vacancies is centralised and advertisements are not budgeted for at the regional level, which explains why vacancies were not advertised for three years. It is not clear why the regions would neglect to budget for advertisements. Furthermore, six out of the 13 DEOs and REOs surveyed indicated that they had experienced a problem of late payment of staff in 2007. Although this problem was resolved in four of those cases, one DEO indicated that it was only partially resolved; in the case of another district, the issue of staff payment was still pending. District officials did mention, however, that late payment of staff may be the result of late submission of paperwork by the staff concerned and delays in opening bank accounts. Thus, the issue may not be related to technical inefficiency at the district offices. While the study was unable to verify this, observations during the fieldwork showed that inefficiencies are likely to be the dominant cause in the district offices.1
A high level of staff turnovers and dismissals in any institution is a sign of technical inefficiency and may stem from weak recruitment or appointment policies and practices, or a lack of solid management/leadership. These, in turn, affect the stability of the working environment and can affect output. The district of Gauteng West stood out by virtue of having had seven district directors in five years. Tshwane South and Sedibeng East had three district directors, while the rest had either one or two. Gauteng West was also the only district that had the experience of dismissing senior staff on the grounds of irregularities or non-performance. This shows that the district may have fundamental problems in the area of technical efficiency - a finding that could compound the problems of educational quality in that district. One could attribute the finding for Gauteng West to the rigour that is applied to service delivery; high turnover, thus, could be seen as a reflection of low tolerance for non-performance. The fact remains, however, that high turnover in any organisation is perceived negatively and often is symptomatic of internal organisational/efficiency problems.
For this reason, it is useful to examine the indicators of education outcomes in the Gauteng West district in comparison with other districts in the province. Table 2 compares the education outcomes in Gauteng West with the averaged education statistics for the other 14 districts in the province.
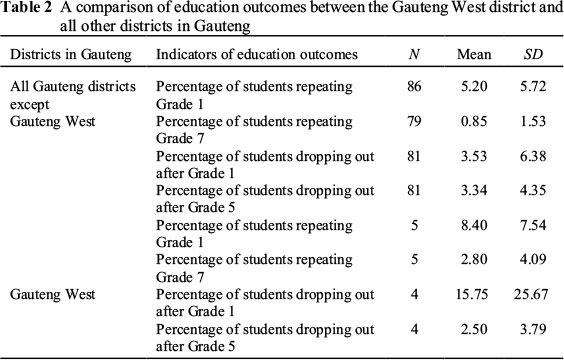
The results show that with the exception of one indicator (Grade 5 drop-out), schools in the Gauteng West district performed comparatively worse than other districts in the province. Gauteng West schools had higher repetition rates for Grades 1 and 7, and significantly higher Grade 1 drop-out rates. The data for Grade 1 drop-out are particularly alarming, as Gauteng West schools experience an average drop-out rate of nearly 16 per cent, compared to about an average of about four per cent in the other districts. However, it must be acknowledged that the standard deviations, especially for Grade 1 dropout rates, are comparatively larger than the mean, suggesting large variations and/or outliers in the outcomes data. In other words, one school with an unusually large dropout rates could drive the overall statistical finding. The sample sizes, though statistically representative of the universal population, are also fairly small and therefore subject to influence by outliers.
Notwithstanding, these potential limitations, there may be several reasons why schools in Gauteng West generally appear to be underperforming, and this is a potential area for future research. One of those reasons could be higher incidences of poverty. This could be verified by only comparing the low quintile schools in both groups. However, all the four Gauteng West schools that are examined in Table 2, rank between quintiles 3 and 4. Therefore, poverty is not likely to be an explanatory factor. A potential factor is the lack of technical efficiency at the district office, as evidenced by its high staff turnover and accounts of dismissals.
Findings on leakage
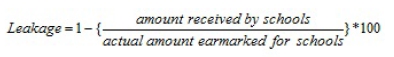
Leakage is defined as the allocated spending that does not reach intended beneficiaries and either is used by local government officials for purposes unrelated to education or is captured for private gain (Reinikka & Svensson, 2004). The study relied on data obtained from the schools by asking the principals how much they expected to receive from the government and how much they actually received. In an effort to triangulate data collection, district officials were also asked to provide information on the amount that schools were supposed to receive. These two sources of information were consolidated to derive the amount schools were meant to receive (intended amount). Where information lacked from district officials, only school records were used. Receipts obtained from school records were captured as amounts actually received. In total, 21 schools from the 175 schools surveyed reported incidents of leakage. Thirteen of these were in Gauteng province and eight were in North-West Province. To derive leakage, the original amount earmarked by the central government was compared with the amounts actually reaching the schools. The following formula (modified from Reinikka & Svennson, 2004) was used to derive the extent of leakage:
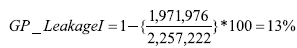
Taking figures from the PET survey and placing into the equation, I find that 13 per cent of funds earmarked for the 96 public schools sampled in Gauteng were leaked; therefore, only 87 per cent of the allocated funds reached the schools as per the following equation.
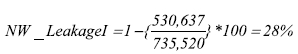
In the North-West sample of 79 schools, a considerably higher 28 per cent of funds were leaked, meaning that only 72 per cent of funds reached the schools.
The fact that 28% of leakage in North West province could occur from only 8 of the 79 schools, deserves further explanation. A summary data of the 8 schools is presented in Table 3.
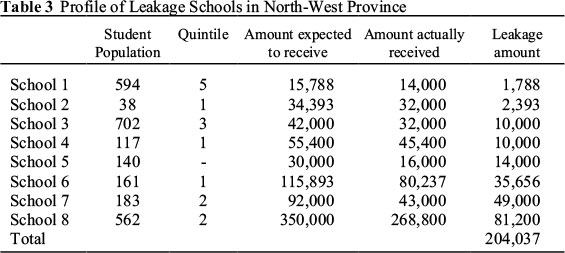
The data show the majority of the schools in the poorer quintiles; some were fairly large schools and therefore quite dependent on subsidies. While all schools received some funding, there was a shortfall, which fell below 50 per cent for some schools.
Leaked funds (according to Reinikka & Svennson's 2004 definition) may be the result of misappropriation. It could also be that these funds cannot be accounted for simply because of poor record-keeping (by schools or the government). Both of these are governance concerns. It is important to recall the provisions made by the government for underprivileged schools (non-Section 21 schools). The DoE manages these schools' finances and, as indicated by district officials during the interviews, the department at times makes payment for certain categories of spending, such as utilities and maintenance, on behalf of such schools. One might argue that this explains the discrepancies in funding. Thus, one would have to examine whether the district offices made payments for utilities and maintenance for these schools that are equivalent to the leaked amount. In perusing the expenditure statements of the 21 schools, it was observed that only five of these schools did not make utility payments in 2007, and one could infer that payments were made on their behalf by the district authorities. Ultimately, questions remain about the missing funds for the schools that did make utility and maintenance payments.
Findings on release of funds (delays)
For schools that depend primarily on state resources (subsidies), one could argue that significant delays can adversely impact on education outcomes. Schools were asked to indicate the schedule in terms of which funds were disbursed. Four options were presented: (i) no delay; (ii) a delay of less than two weeks; (iii) a delay of between two weeks and two months and (iv) a delay of more than two months. The findings are captured in Figure 3.
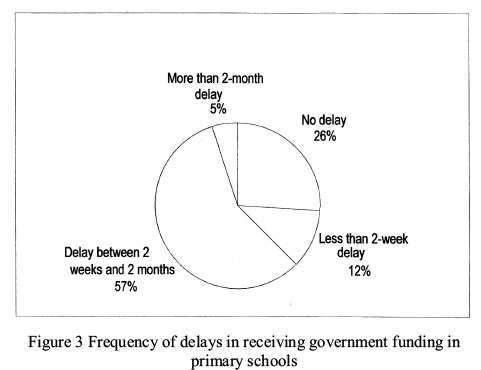
As the figure shows, the majority of schools experienced a delay of between two weeks and two months in receiving their funding from the government. Schools rarely experienced a delay of more than two months, and a sizeable proportion experienced no delay or a delay of less than two weeks. One can conclude that delays are not very extensive. Empirical analysis would be required to determine whether even a delay between two weeks and two months can adversely impact education outcomes. The same applies on the question of leakages.
Conclusion
This paper has focused largely on a qualitative analysis of the efficiency and effectiveness of sub-national government. On a positive note, there was a strong element of decentralisation in education services in an attempt to be closer to the end users. All local departments had accounting offices, although record-keeping was fairly poor, especially in North-West Province. The evidence of poor record-keeping raises questions about how some DEOs and REOs manage the accounts of Section 21 (highly disadvantaged) schools, given their own lack of financial management capacity. Human resource capacity is also a major challenge, as none of the DEOs/REOs was fully staffed. Indeed, some of the vacancy rates were very high. Gauteng West was singled out for unusually high staff turnover rates. It was also the only district with a record of recent dismissals of senior staff for irregularities. Thus, it was no surprise that schools in Gauteng West performed worse than schools in other districts in the province. The study also found problems in school supervision, with poorer and underachieving schools receiving fewer supervisory visits than better-off schools. Weaknesses in operational management manifested in leakages of public funds and delays in disbursements.
To derive the extent to which leakages and delays affect education outcomes, a regression analysis conditioning for other effects that may possibly drive the relationship between efficiency and education outcomes, is needed. Notwithstanding the absence of the econometric results, the key contribution that this paper tries to make is to introduce the concept of technical efficiency in the economics of education literature and to advise policymakers and practitioners to consider governance dimensions when designing and implementing education reforms.
Note
1 It was observed in one district in Gauteng that there were problems with either overlapping duties or lack of clarity as to certain responsibilities. While the author was in the process of conducting an interview with the finance director at a DEO, a teacher came in to complain that her salary had been paid to a closed bank account. She recalled that she had previously informed the district of her new banking details in writing. The finance director referred her to the human resources office, but the teacher returned moments later stating that the human resources office had indicated that it was the finance office's responsibility. The finance director was adamant that the matter was outside his jurisdiction. In the end, it was not clear if or how the matter was resolved, but the incident revealed a serious level of technical inefficiency - one that had a distressing effect on a teacher and which indirectly could affect the quality of teaching.
References
Aheer PCJ 2006. The perceptions of the school management team regarding the institutional development and support officials. MEd dissertation. Johannesburg: University of Johannesburg. Available at https://ujdigispace.uj.ac.za/bitstream/handle/10210/671/PRANEETA.pdf?sequence=1. Accessed 1 April 2014. [ Links ]
Dehn J, Reinikka R & Svensson J 2003. Survey tools for assessing performance in service delivery. In F Bourguignon & LA Pereira da Silva (eds). The impact of economic policies on poverty and income distribution: Evaluation techniques and tools. New York: Oxford University Press. Available at: http://www1.worldbank.org/publicsector/pe/PETS1.pdf. Accessed 1 April 2014. [ Links ]
Department of Education (DoE) 2003. Plan of action: Improving access to free and quality basic education for all. Available at http://www.education.gov.za/LinkClick.aspx?fileticket=IBMz%2FjGelkc%3D&tabid=390&mid=1124. Accessed 22 June 2013. [ Links ]
Fiske EB & Ladd HF 2005. Racial inequality in education: How far has South Africa come? Background paper for the special issue of International Journal of Educational Development. Available at http://files.eric.ed.gov/fulltext/ED493386.pdf. Accessed 1 April 2014. [ Links ]
Gauthier B 2006. PETS-QSDS in sub-Saharan Africa: A stocktaking study. Available at http://siteresources.worldbank.org/INTPUBSERV/Resources/477250-1165937779670/Gauthier.PETS.QSDS.Africa.STOCKTAKING.7Sept06.pdf. Accessed 22 June 2013. [ Links ]
Gupta S, Davoodi H & Tiongson E 2000. Corruption and the provision of health care and education services. IMF Working Paper WP/00/116. Washington, DC: International Monetary Fund. Available at http://www.imf.org/external/pubs/ft/wp/2000/wp00116.pdf. Accessed 1 April 2014. [ Links ]
Heald D 1983. Public expenditure: Its defence and reform. Oxford: Martin Robertson. [ Links ]
Kaufmann D, Montorriol-Garriga J & Recanatini F 2008. How does bribery affect public service delivery: Micro-evidence from service users and public officials in Peru. Policy Research Working Paper 4492. Washington DC: World Bank. Available at http://elibrary.worldbank.org/doi/pdf/10.1596/1813-9450-4492. Accessed 1 April 2014. [ Links ]
Mauro P 1998. Corruption and the composition of government expenditure. Journal of Public Economics, 69:263-279. Available at http://www1.worldbank.org/publicsector/anticorrupt/CoreCourse2005/Mauro.pdf. Accessed 1 April 2014. [ Links ]
Ministerial Committee on Learner Retention in the South African Schooling System 2008. Learner retention report. Available at http://resep.sun.ac.za/wp-content/uploads/2012/07/DOe-2008-Learner-Retention-report.pdf. Accessed 1 April 2014. [ Links ]
National Treasury 2007. Provincial budgets and expenditure review: 2003/04-2009/10. Pretoria: National Treasury. Available at http://www.treasury.gov.za/publications/igfr/2007/prov/00.%20Front%20Pages%20and%20Contents.pdf. Accessed 1 April 2014. [ Links ]
Reinikka R & Svensson J 2004. Local capture: Evidence from a central government transfer programme in Uganda. The Quarterly Journal of Economics, 119(2):678-704. Available at http://www1.worldbank.org/publicsector/anticorrupt/FlagshipCourse2003/ReinikkaSvensson.pdf. Accessed 1 April 2014. [ Links ]
Roberts J 2001. District development: The new hope for educational reform. Johannesburg: Joint Education Trust. [ Links ]
Ross KN 2005. Sample design for educational survey research. Paris: UNESCO. Available at http://www.iiep.unesco.org/fileadmin/user_upload/Cap_Dev_Training/Training_Materials/Quality/Qu_Mod3.pdf. Accessed 1 April 2014. [ Links ]
World Bank 1998. Public expenditure management handbook. Washington DC: World Bank. [ Links ]

