


Serviços Personalizados
Artigo
 Inglês (pdf)
 Artigo em XML
 Referências do artigo
Indicadores

Links relacionados
-
 Citado por Google
 -
 Similares em Google
Compartilhar

 Permalink
South African Journal of Education
versão On-line ISSN 2076-3433
versão impressa ISSN 0256-0100
S. Afr. j. educ. vol.33 no.1 Pretoria Jan. 2013
ARTICLES
An investigation into the opportunity to learn that is available to Grade 12 mathematics learners
Gerrit Stols
Department of Science, Mathematics and Technology Education, University of Pretoria, South Africa. Gerrit.Stols@up.ac.za
ABSTRACT
This study investigated the opportunity to learn (OTL) that is available to Grade 12 mathematics learners. Learner workbooks were analysed in terms of time on task, curriculum coverage, curriculum coherence, and cognitive demand. Based on these elements, experienced mathematics teachers judged the opportunity that the learners have to achieve more than 60% for each topic. According to the workbooks, the average number of active learning days in this sample was 54.1 days per annum. This resulted in limited curriculum coverage in almost all sections in 16 of the 18 under-performing schools. In these schools, learners spent most of their time practising routine procedures. The high correlation of 0.95 (p < 0.001) between the experts'prediction about the opportunity to learn in the different schools (based on the learner workbooks) and learners' actual performance in the Grade 12 exam shows that the number, the coverage, the cognitive level, and the coherence of activities play a major role in understanding learner performance.
Keywords: coherence, curriculum coverage, mathematics, opportunity to learn, OTL, time-on-task
Background and purpose of the study
Learners in different classes and different schools do not have equal opportunities to learn: some learners may have unqualified teachers, be in schools with limited resources, or possibly in poorly managed schools. These factors may contribute towards poor academic performance by learners. In fact Kilpatrick, Swafford and Findell (2001) are of the opinion that opportunity to learn is the most important predictor of learner achievement. Opportunity to learn has also been used to explain differences between countries in international comparative studies in mathematics learning (Hiebert & Grouws, 2007). Based on their review of relevant literature, these authors concluded that opportunity to learn remains the best explanation of the relationship between teaching and learning.
But what is opportunity to learn (OTL) and why does it influence learner achievement? The concept of OTL is used in different studies to determine or to quantify conditions within a school or classroom that promote or hamper learning. Some studies that measure OTL include factors like teacher qualification, curriculum and materials, teachers' professional development, safety and security of the learning environment, non-discriminatory policies, school financing, instructional practices, etc. (Gillies & Quijada, 2008). Some factors play a more important role in terms of academic achievement than others. In South Africa, there are schools that look very similar in terms of these factors, yet their academic achievements in mathematics are vastly different; there may even be large disparities in achievement between different classes in the same school. Hanushek and WoBmann (2007) looked at different studies and found that the single most important factor that influences the quality of teaching and learning is teacher quality. According to a World Bank report of 2007, good teachers are able to make a significant difference in their learners' performance. Kilpatrick et al. (2001:31) also explain that opportunity to learn is determined by several school factors, but emphasise the importance of teaching: "In addition, and of primary importance, it is through teaching that students encounter the mathematical content afforded by the curriculum". In terms of improving education, Gates (2010) notes that "after decades of diffuse reform efforts, they all zero in on the most important ingredient of a great education: effective teachers. The key to helping students learn is making sure that every child has an effective teacher every single year." Although not every influencing factor of OTL is dependent on the teacher, the teacher plays a major role in shaping and creating OTL. For this reason the current study focuses only on the OTL factors that are directly under the control of teachers in their own classrooms.
Conceptual framework
How can a teacher influence the quality of learning in his or her own class? Hiebert and Grouws (2007:379) shed some light on the role of a teacher in creating OTLs:
The emphasis teachers place on different learning goals and different topics, the expectations for learning that they set, the time they allocate for particular topics, the kinds of tasks they pose, the kinds of questions they ask and responses they accept, the nature of the discussions they lead - all are part of teaching and all influence the opportunities students have to learn.
Some of these influences are not easy to measure, such as the nature of the discussions led by teachers, while other influences are more measurable. This is why Winfield (1987:439) suggests that opportunity to learn may be measured by "time spent in reviewing, practising, or applying a particular concept or by the amount and depth of content covered with particular groups of students". This study therefore focuses on four measurable elements of OTL, namely, time-on-task, curriculum coverage, curriculum coherence, and cognitive demand, so that OTL in this study is a way of measuring the time that learners spend on mathematical tasks, as well as the extent and coherency of curriculum coverage and the cognitive demand of the learning tasks.
Time-on-task
A study by the World Bank (Abadzi, 2007:3) reveals that successful learning outcomes should not be expected without sufficient teaching and practice opportunities. Gillies and Quijada (2008:3) explain that learning depends to some degree on time and effort, and warn that "without adequate time on task, no learning is possible". This is one of the problems in South Africa. The Minister of Basic Education, Angie Motshekga (2009), warned that in some instances schools lose valuable teaching time because of the absence of teachers, and incompetent principals. In a local pilot study done by Carnoy, Chisholm & Baloyi (2008) it was found that teacher absenteeism is a significant problem in more than 70% of South African schools and that teachers devote on average 3.2 hours to teaching during a school day. The problem is not only the lack of time, but to a greater extent, the effective use of time for teaching and learning. A teacher is responsible for classroom organisation and the effective use of time inside the classroom. Some researchers use the term 'time-on-task', which refers to the amount of time that learners are actively engaged in learning (Gillies & Quijada, 2008). Abadzi (2007:33) warns that:
... even modest time wastage may result in significant student losses and that this can result in teachers just lecture in a hurry rather than analyze the content and use the teaching aids provided to schools, or they may omit parts of the curricula.
The South African NCS Grades 10-12 (DoE, 2003), Mathematics Assessment Guidelines Grades 10-12 (DoE, 2009), Mathematics Examination Guidelines (DoE, 2008a) and the Gauteng Province Mathematics Work Schedule for Grade 10 to 12 explain in detail what is required from Grade 1 0 to 12 mathematics learners in terms of number of periods and days, content coverage, content depth and the progress between and within grades. These documents were therefore used to identify the Grade 12 topics and subtopics to be included in this study.
Curriculum coverage
Wastage and inefficient use of time will result in less teaching time and will make it impossible for teachers and learners to cover the curriculum. In his reanalysis of the results of the First International Study of Mathematics achievement, Fletcher (1971: 145) concludes that achievement "is virtually synonymous with 'coverage' across countries". Taylor (2008) identified curriculum coverage as the biggest problem in South Africa and is of the opinion that this, together with teachers' poor content knowledge, must be addressed to improve the results. The South African NCS Grades 10-12 (Department of Education, 2003) was used to identify the Grade 12 topics and subtopics to be included in this study.
Coherence
One of the key findings of the project of the US National Science Foundation about how people learn (Bransford, Brown & Cocking, 2000:14) states that if the learners' "initial understanding is not engaged, they may fail to grasp the new concepts and information that are taught". Learners build their understanding on pre-knowledge. Thus the starting point of each topic in a grade should build on pre-knowledge from the previous grade level. The activities must also be selected in such a way that they will help the learner to form connections between concepts. A coherent approach within the topics in a grade level, and progressive and sequenced development within a topic, will enhance understanding.
Cognitive demand
Closely related to the understanding of mathematics are the levels of content complexity of the activities that the learners engage in (Carnoy et al., 2008). The question is not only how much time is spent on learning activities and whether the curriculum was covered, but what the quality of the coverage was. To develop a deep understanding of mathematics, enough work must be done on an appropriate level. According to Webb (2010) there is general agreement that learners need to engage in and experience mathematics and mathematical activities in a range of levels of cognitive demand. In fact, the TIMSS classroom video study illustrated that the learners of higher performing countries engage more frequently in activities that require higher levels of cognitive demand (Stigler & Hiebert, 2004). Webb (2010) concludes that content complexity has been shown to relate to learner performance. The Subject Assessment Guidelines use the 1 999 TIMSS Mathematics survey taxonomy of categories of mathematical demand to classify assessment tasks into different levels. The level of complexity of the mathematical questions is divided into four categories, namely, knowledge (25%), routine procedures (30%), complex procedures (30%) and problem solving (15%). The knowledge category includes the use of algorithms, recall, using simple mathematical facts, and formulae. The Subject Assessment Guidelines for Mathematics (DoE, 2008a) explain and describe routine procedures as simple applications and calculations that require many steps. A complex procedure involves problems that are mainly unfamiliar to the learners. These problems do not have a direct route to the solution. The fourth category about solving problems is mainly about "solving non- routine, unseen problems by demonstrating higher level understanding and cognitive processes" (DoE, 2008a:13).
Research question
The question then is: Do the South African Grades 1 0 to 12 learners have a fair opportunity to learn mathematics? To answer this question this study investigated four elements of OTL, namely, time-on-task, curriculum coverage, curriculum coherence, and cognitive demand.
Research design and method
This ws a quantitative study that involved document analysis to measure and quantify OTL. The best workbook(s), as selected by the teacher, of Grade 12 learners in each of the participating schools were copied and analysed towards the end of the last quarter, before the final examinations. The assumption was that the best books, as selected by the teacher, would contain all the class work and homework activities that the teachers gave their learners. The best workbooks are supposed to reflect the learning opportunities in terms of time-on-task, curriculum coverage, coherence, and level of cognitive demand as established by the teacher. Eight expert mathematics teachers were selected to capture the data from the workbooks. These teachers were selected based on their experience and the achievement in the Senior Certificate of their Grade 12 learners in their own class.
This study focused on the core mathematics curriculums that are tested in Papers 1 and 2. The content that should be covered is explained in the National Curriculum Statement.
Instruments
A data collection instrument was designed to collect the data from the learners' workbooks:
- Time-on-task was measured by considering
- the number of days that the learner actually spent working on a topic compared to the number of days suggested by the Department of Education. The Gauteng Department of Education provides a detailed Work Schedule in which they suggest what topics to do, when to do them, and in what order. From this document teachers can determine the number of days that they are supposed to spend on the different topics; and
- the number of exercises done in the workbook on the different levels of cognitive demand.
The extent of curriculum coverage was measured by the number of exercises done on the different levels of cognitive demand in every topic and subtopic as suggested by the NCS.
- In order to determine the level of cognitive demand, the number of exercises done on different levels of cognitive demand (knowledge, routine procedures, complex procedures, problem solving) from each section was recorded from the learners' workbooks.
- To determine the degree of coherence, the following aspects were considered:
- Is the starting point realistic in terms of the pre-knowledge from previous grades according to the NCS?
- Are the exercises within a topic selected in a logical and sequential order to make sense and enhance the making of connections?
- Do the selection, order and number of exercises develop conceptual understanding?
Having captured the above data, each expert teacher used a 3-point scale to rate the opportunity to learn of the learners in a particular classroom: 'A learner in this class will not pass this section ', 'A learner in this class can pass this section but will get less than 60% ', and 'A learner in this class can get 60% or more for this topic'.
Participants
A sample of 18 schools in Gauteng, stratified by district and quintile, was randomly selected. For referencing purposes the sample schools will be referred to as schools A to R. Schools are divided in quintiles according to their socio-economic status, with the poorest schools in Quintile 1 and the wealthier schools in Quintile 5.
Results
We only managed to make copies of the workbooks of learners in 1 3 of the 18 schools. By the time we had collected and copied these workbooks, some schools had already started with their exams and it was not possible to remove the books for copying purposes. The workbooks that we received included four workbooks from Q1 schools, three from Q2, one from Q3, two from Q4, and three from Q5 schools. We also were given the opportunity of analysing the Grade 1 0 and 11 workbooks and assessment portfolios in schools I, K, and O of Quintiles 3 and 4.
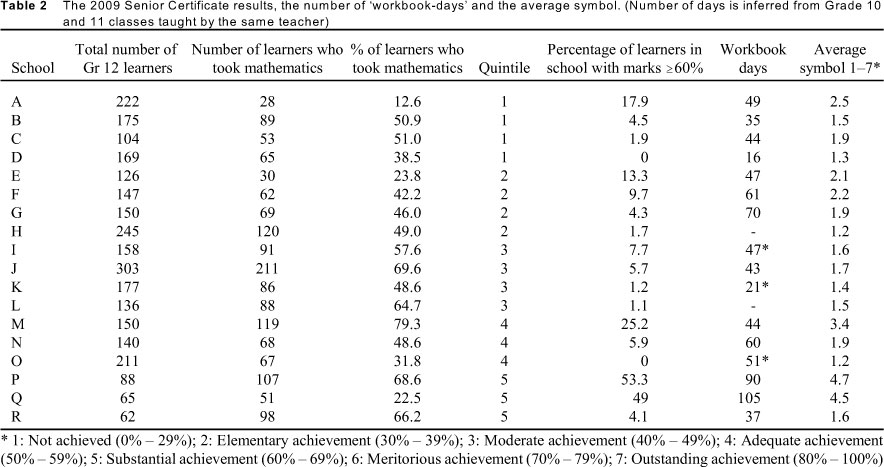
Table 2 indicates the very low percentage of learners who scored at least 60% in the 2009 Senior Certificate examination. Only in schools P and Q about half the learners managed to pass with marks higher than 60%. In fact, of the 3,144 Grade 12 learners in the 18 sample schools, 1,502 learners wrote mathematics and only 166 passed the final examination with more than 60%. It is even more worrying to note that 112 (67.4%) of these 166 learners came from only three schools (M, P and Q) in the sample of 1 8 schools.
The results in Table 2 do not show a direct correlation between the quintile in which a school fell and actual performance in the exam. The learners in school A (Quintile 1: a very poor school) and school E (Quintile 2: poor school) for example, outperformed the learners in school R (Quintile 5: a rich school).
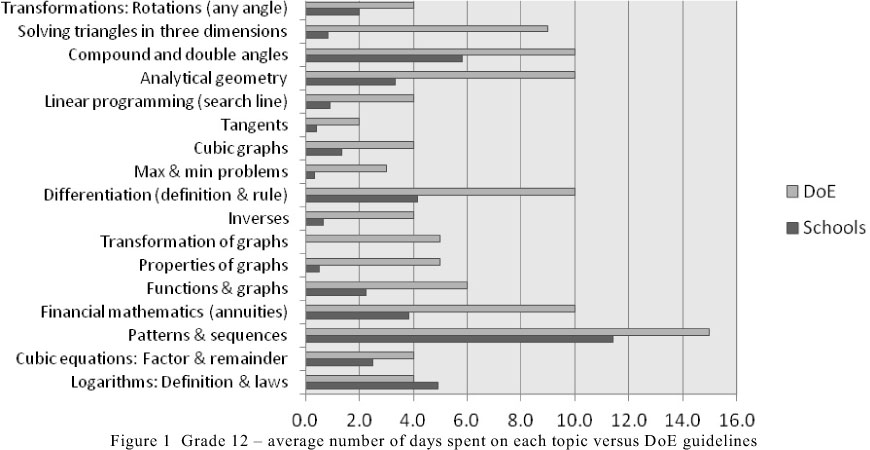
The team of expert teachers that analysed the workbooks were only able to identify an average of 51.3 active 'workbook-days' in the entire school year from the sample schools (compared to the close to 150 school days available for teaching in an average school year). The second last column in Table 2 illustrates the number of days that the learners actually worked in their books in each of the schools. The lowest number of workbook-days (days learners worked in their workbooks) that was calculated is 16 and the highest number is 105 days per annum. Figure 1 compares the average number of days that schools spent on each mathematics topic to the approximate suggested number by the Gauteng Department of Education. The average number of days spent on a topic generally equals half the suggested number of days, except for one topic, namely logarithms. The correlation between the number of workbook-days and the average score of each school is 0.79 (p < 0.001) and the correlation between the number of workbook-days and the percentage of learners with a score of at least 60% is 0.78 (p < 0.001).
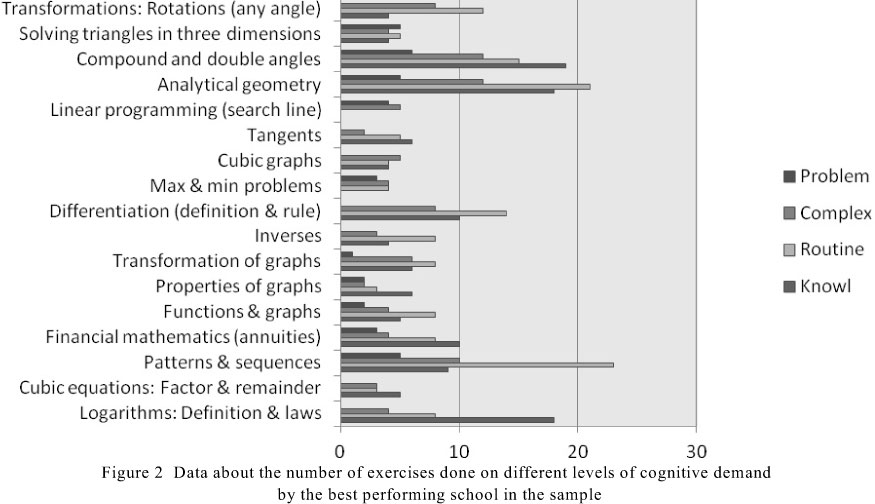
Figures 1 and 2, as well as Table 1 all tell the same story - the fewer days spent on a topic, the fewer exercises about the topic can be done. Table 3 gives us an indication of the width and depth of curriculum coverage and it illustrates the limited number of exercises done on a higher level of cognitive demand in all topics. The most neglected topics on all levels of cognitive demand in the Grade 12 curriculum are functions (graphs, properties of graphs, and transformation of graphs), applications of differentiation (maximum and minimum problems, graphs of cubic functions, tangents), linear programming, and solving triangles in three dimensions.
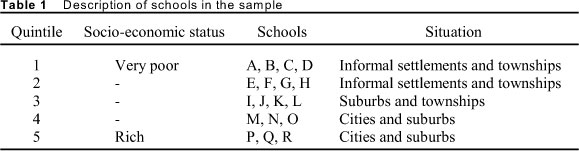
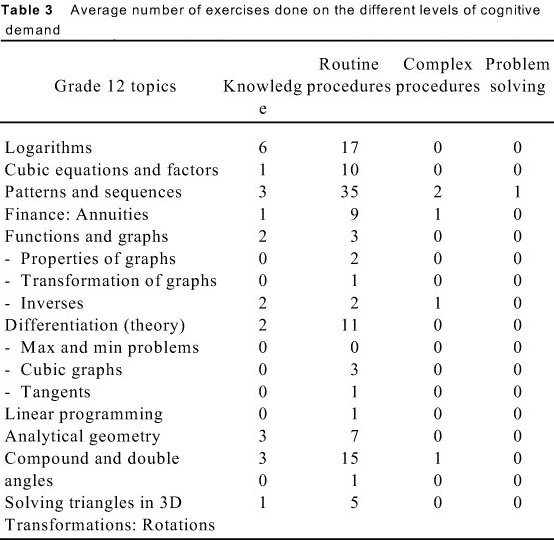
Figure 2 shows the number of exercises done on different levels of cognitive demand by the best performing school in the sample. There is a balance between the number of exercises done on all the levels, especially on the problem-solving and complex procedure levels. It is easy to understand why 53.3% of the learners in this school achieved a final score in the exams of above 60%.
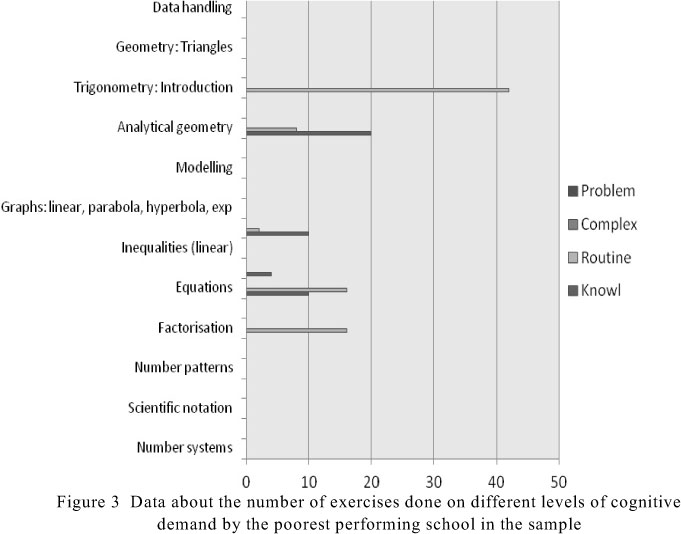
It is not only the limited amount of work done that was problematic in the worst performing school (see Figure 3), but also the absence of exercises done on higher-order levels of cognitive demand. In fact, none of the learners in this school managed to get more than 60% in the exam and only 9.2% of them passed with a mark of 40% or more.
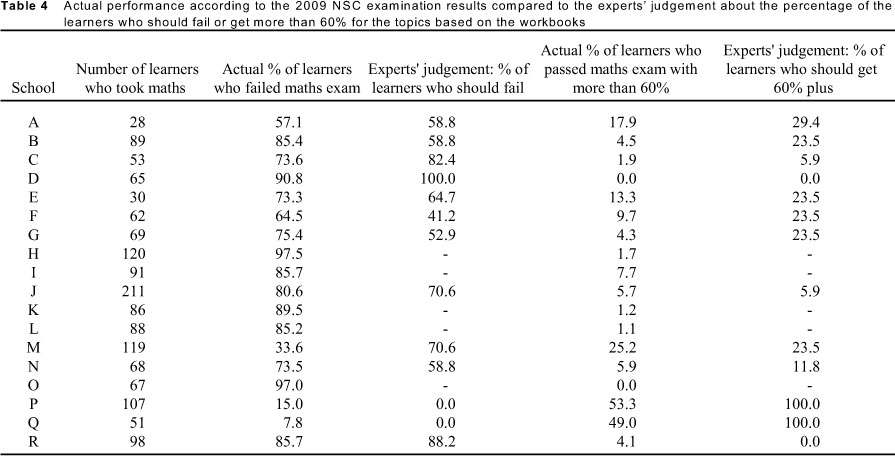
The Pearson correlation coefficient of 0.95 (p < 0.01) and R squared = 0.91 between the actual Grade 12 results and the experts' judgement based on the quality of workbooks indicate the accuracy and validity of these judgements in terms of the percentage of learners who should get more than 60%. A high Pearson correlation coefficient of 0.82 (p < 0.01) was found between the actual Grade 12 results and the experts' judgement about the mathematics topics that learners could be expected to fail.
General comments made by the expert teachers about the Grade 12 learners' workbooks included that teachers were wasting time on subtopics that had been in the old curriculum. A number of teachers still taught logarithms in detail, including how to solve logarithmic equations and inequalities. They also wasted time on doing technical questions about the remainder and factor theorems. Some of the teachers did not appear to understand the spirit of the curriculum in which understanding and application are emphasised, not long technical calculations.
Discussion of results
This study investigated the OTL of Grade 12 learners in schools in Gauteng (South Africa) and its influence on learner performance. For the economic development of a country it is essential that a large number of learners have access to science-related careers. In order to enrol for a Bachelor of Science degree in a South African higher education institution, a learner requires a minimum of 60% in mathematics. In our research, we worked on the assumption that in a school that provides a basic OTL, at least 30% of the learners would have access to science-related careers. Using this definition, the study shows that many schools do not provide an adequate OTL for their learners. In fact, only two of the 18 schools (P and Q) managed to prepare more that 30% of their learners for science-related careers. Only 197 (5.4%) of the 3,631 Grade 1 2 learners in this study passed mathematics with more than 60%. A total of 138 of these 197 learners came from only three schools (M, P and Q). It is however important to note that school A, which is in Quintile 1 (low economic status), managed to prepare 1 7.9% of its learners for science-related careers. In contrast, in school R which is in Quintile 5 (high economic status), only 4.1% of the learners gained access to science-related careers.
In order to get a better understanding of these results, the study investigated time-on-task in the different schools. The number of official school days in a year in South Africa is 199 including examination time. If we subtract 49 days for assessment activities, 150 days are left for learners to work in their workbooks. In terms of time that the learners spent on practising or applying newly learned concepts or procedures, only 3 of the 13 schools worked in their workbooks on more than 60 days. We were only able to identify an average of 54.1 active days in the learner workbooks of the 13 participating schools.
This low number of days resulted in very limited curriculum coverage in almost all of the individual Grade 12 topics. The average number of days spent on a topic was generally half the number of days suggested by the DoE, except for logarithms (see Figures 2 and 3). The most neglected topics and subtopics involved the application of mathematics in real life (modelling), which is a key skill needed for the 21 st century. Different factors may have contributed to this extremely low number of workbook- days and curriculum coverage, for example teachers' absence, teachers not in classes, time spent on assessment tasks and ineffective teaching methods. Ngoepe and Treagust (2003) found that the teachers in the South African schools that they visited wasted much time writing down solutions to problems on the chalkboard for learners to copy. Also, instead of referring to textbooks, teachers wrote all the class work on the chalkboard and give homework exercises orally. This way of teaching is not only ineffective in terms of conceptual development, but also wastes valuable learning time.
Figure 4 demonstrates the absence of higher-order questions and shows that the majority of teachers and learners rarely engaged in problem-solving activities. The main focus in the classrooms was on procedural fluency and there was almost no evidence of adaptive reasoning and strategic competence, except for the best performing schools (M, P and Q). This study confirmed the idea of Webb (201 0) that learners need to engage in and do exercises on a range of levels of cognitive demand in order to improve learner performance. The actual performance of the learners from the participating schools (see bottom of Figure 4) clearly suggests such a relationship. The absence or limited number of activities done in the workbooks of the poor performing schools is also noticeable. In fact, only the three best performing schools (M, P, and Q) did a reasonable number of activities at all the levels of cognitive demand. Figure 4 demonstrates, in general, the lack of opportunity for learners to work on more demanding activities.
Eight expert teachers were asked to use the learners' workbooks to judge their performance in each Grade 12 maths topic. The experts based their judgements on the number of active workbook-days, the number of activities done on different levels of cognitive demand, the starting point in terms of pre-knowledge in terms of the NCS, and the sequence of activities in terms of the development of conceptual understanding. The results are recorded in Table 5 and show that experts can make an accurate judgement about learners' actual performance based on the work done in their workbooks. In fact, the correlation between the experts' judgements and learners' actual performance in the NCS exam (for the performance level of 60% plus) is 0.95 (p < 0.01) and for the 'fail category' it is 0.82 (p < 0.01). This finding also supports the notion of the importance of the basic elements of OTL (time-on-task, curriculum courage, coherence and cognitive demand) as suggested by the conceptual framework.
The teacher in the classroom is the only person who can directly create and shape the basic elements of OTL (time-on-task, curriculum courage, coherence, and cognitive demand). According to the Gauteng Department of Education (2010) there is overwhelming evidence that a quality teacher is the most critical factor. The level of teachers' knowledge determines not only what they teach but also how they teach. Possible reasons for this lack of OTL in South African classrooms may be teachers' lack of content knowledge. Teachers were found to spend more time on topics that tend to be procedural, for example logarithms, sequences and series, and the remainder and factor theorems. They avoided the topics that required understanding and problem solving, for example graphs, properties of graphs, transformation of graphs, applications of differentiation (maximum and minimum problems, graphs of cubic functions, tangents), linear programming, and solving triangles in three dimensions.
Conclusion
This study demonstrates that many learners are being denied the opportunity to learn in some Gauteng schools. South African learners, in general, achieve poorly in international comparative studies and in national assessment because they are not afforded an adequate opportunity to learn mathematics in their classrooms. The actual Grade 12 exam results suggest that only two of the schools in the sample provided an appropriate opportunity to learn (in terms of access to science-related careers, i.e. 60% plus for mathematics) to their Grade 12 learners. This was confirmed by the learner workbook analyses conducted by eight subject experts. The learners in the poor performing schools did not spend enough time doing activities on different levels of cognitive demand to consolidate and master concepts and to develop mathematically. The selection, sequencing and order of the activities did not enhance conceptual development. This is the responsibility of the teacher and can be done in the classroom even with only basic physical resources. It does, however, require a teacher whose focus is learners' understanding and performance.
Future interventions to improve the achievement of South African learners should focus on the effective use of time, efficient teaching methods, and on the selection of learning activities. As long as time is wasted and not valued as an important and scarce resource by the school management, teachers and learners, investments in schools, classrooms, learning materials and computer equipment are wasted. The President of South Africa, Jacob Zuma, as quoted at a National Council of Provinces meeting on 19 November 2010, emphasised: "Teachers must be in class, on time, teaching for seven hours a day". A report of the African National Congress (ANC) also decided on a 10-point plan of action to improve education, the first principle being: "Teachers to be in class, on time, teaching using the textbooks" (as cited by Gauteng Department of Education, 2010:22). However, we need more than this. The school day and classroom activities must be also be organised "to maximize time-on-task - the effective use of time for educational purposes" (Gillies & Quijada, 2008:5).
The South African Minister of Basic Education, Angie Motshekga (2009), admitted in Parliament that "[t]he culture of teaching and learning has, for all intents and purposes, disappeared in most rural and township schools". To change this culture is an enormous task. Based on the results of the TIMMS Video Study, Stigler and Hiebert (2004:13) concluded that "teaching is a cultural activity: learned implicitly, hard to see from within the culture, and hard to change". South Africa needs radical, drastic and practical interventions to establish a professional teaching culture marked by efficiency and accountability. It is important to measure OTL and to hold teachers accountable for it. Since underperformance in Grade 12 is often related to underper-formance in previous grades, it is unwise to focus only on the Grade 12 teachers. The opportunity that teachers create for their learners across all grades must be measured and improved. The present study suggests a way to measure OTL using the learners' workbooks in terms of time-on-task, curriculum coverage, coherence, and the level of cognitive demand. Policy makers and governments may use learner workbooks to determine the quality of OTL and to make an early diagnosis of possible problems.
Acknowledgements
This study formed part of a larger study carried out at the Centre for Evaluation and Assessment (CEA) in the Faculty of Education of the University of Pretoria. I thank all the teachers, fieldworkers and colleagues for their participation and contributions.
References
Abadzi H 2007. Absenteeism and beyond: instructional time loss and consequences. World Bank Policy Research Working Paper No. 4376. [ Links ]
Bransford JD, Brown AL & Cocking RR (eds) 2000. How people learn: Brain, mind, experience, and school. Washington, DC: National Academy Press. [ Links ]
Carnoy M, Chisholm L & Baloyi H 2008. Uprooting bad mathematical performance: pilot study into roots of problems. HSRCReview, 6:13-14. [ Links ]
Department of Education 2003. National Curriculum Statement: Grades 10-12 Mathematics. Pretoria: Government Printer. [ Links ]
Department of Education 2008a. National Curriculum Statement: Grades 10-12 Mathematics Subject Assessment Guidelines. Pretoria: Government Printer. [ Links ]
Department of Education 2008b. National Curriculum Statement: Grades 10-12 Learning Programmes Guidelines Mathematics. Pretoria: Government Printer. [ Links ]
Department of Education 2009. Mathematics Examination Guidelines Grade 12 for 2009. Pretoria: Government Printer. [ Links ]
Fletcher HJ 1971. An efficiency reanalysis of the results. Journal for Research in Mathematics Education, 2:143-156. [ Links ]
Gates MF 2010. Education reform, one classroom at a time. The Washington Post, Friday, February 19. Available at http://www.washingtonpost.com/wpdyn/content/article/2010/02/18/ AR2010021802919.html. Accessed 1 May 2011. [ Links ]
Gauteng Department of Education 2010. GautengMathematics, Science & Technology Education Improvement Strategy: 2009-2014. Available at http://www.nstf.org.za/ShowProperty?nodePath=/NSTF%20Repository/NSTF/files/Home/ Newsletter/MSTStrategy.pdf. Accessed 5 May 2011. [ Links ]
Gillies J & Quijada JJ 2008. Opportunity to Learn: a high impact strategy for improving educational outcomes in developing countries. Washington, DC: USAID. [ Links ]
Hanushek EA & WoBmann L 2007. Education Quality and Economic Growth. Washington: World Bank. [ Links ]
Hiebert J & Grouws DA 2007. The effects of classroom mathematics teaching on students' learning. In FK Lester (ed.). Second handbook of research on mathematics teaching and learning. Charlotte, NC: Information Age Publishing. [ Links ]
Kilpatrick J, Swafford J & Findell B (eds) 2001. Adding it up: Helping children learn mathematics. Washington, DC: National Academy Press. [ Links ]
Motshekga A 2009. Minister of Basic Education, Education Budget Speech. 30 June. Available at http://www.politicsweb.co.za. Accessed 12 May 2011. [ Links ]
Ngoepe MG & Treagust D 2003. Investigating the classroom practices of secondary mathematics teachers in the township schools of South Africa. AARE Conference Papers Abstracts. Available at http://www.aare.edu.au/03pap/ngo03582.pdf. Accessed 21 June 2011. [ Links ]
Stigler JW & Hiebert J 2004. Improving mathematics teaching. Educational Leadership, 61:12-17. [ Links ]
Taylor N 2008. What's wrong with South African schools? Available at www.jet.org.za. Accessed 11 May 2011. [ Links ]
Webb N 2010. Content complexity and depth of knowledge as applicable to research and practice. Paper delivered at the ISTE International Conference on Mathematics, Science and Technology Education, Kruger National Park, South Africa, 18-21 October. Pretoria: UNISA Printers. [ Links ]
Winfield LF 1987. Teachers' estimates of test content covered in class and first-grade students' reading achievement. Elementary School Journal, 87:438-445. [ Links ]
Zuma J 2010. Address by His Excellency, President Jacob Zuma to the NCOP sitting at Maluti a Phofung Municipality in the Free State Province, 19 November. Available at http://www.thepresidency.gov.za/pebble.asp?relid=2524. Accessed 23 August 2012. [ Links ]

