


Services on Demand
Article
 English (pdf)
 Article in xml format
 Article references
Indicators

Related links
-
 Cited by Google
 -
 Similars in Google
Share

 Permalink
South African Journal of Education
On-line version ISSN 2076-3433
Print version ISSN 0256-0100
S. Afr. j. educ. vol.30 n.4 Pretoria Jan. 2010
ARTICLES
Contextualizing South Africa's participation in the SITES 2006 module
Seugnet Blignaut*; Christo Els; Sarah Howie
ABSTRACT
The International Association for the Evaluation of Educational Achievement (IEA) initiated the Second International Technology in Education Study (SITES 2006) - a large-scale comparative survey on the use of Information and Communication Technologies (ICTs) in schools. The goal was to understand the pedagogical use of ICTs in schools in 22 education systems. We aim to contextualize South Africa's participation in SITES 2006 on four levels: (i) the nature and structure of the South African education system, (ii) a review of South Africa's participation in SITES 2006, (iii) ICT infrastructure, facilities and equipment, and (iv) teachers' use of ICTs for teaching and learning. SITES 2006 administered three questionnaires to school principals, technology coordinators, and mathematics and science teachers. The final sample consisted of 666 mathematics and 622 science teachers. Although most education systems collected data via the internet, South Africa was the only country that used only a paper-and-pencil data collection strategy with an average return rate of 90%. South Africa scored low on most variables, e.g. ICT infrastructure, facilities, and equipment. A large percentage of South African teachers reported their ICT incompetence. South Africa's inability to cross the boundaries of traditional learning towards the development of 21st century teaching and learning skills inhibits social and economic growth for the development of human capital.
Keywords: developing context; e-Education; ICT in education; large-scale study; mathematics education; science education; SITES 2006; South Africa
Orientation
In the 1990s, the International Association for the Evaluation of Educational Achievement (IEA) initiated comparative research on the use of Information and Communication Technologies (ICTs). The Second International Technology in Education Studies (SITES) aims to uncover how ICTs influence teaching and learning processes in schools. Up to now, three international SITES modules (studies) contribute to understanding how ICTs affect teaching and learning in schools. The 1997 module (Module 1) was a school-based survey, while the second module (Module 2) comprised a comprehensive study on how teachers use ICTs, and included comparative case studies of innovative pedagogical practices supported by ICTs.
SITES 2006 (Module 3), an international longitudinal comparative large-scale survey, started in October 2004. The main data collection took place during 2006. SITES 2006 investigated how school and system level factors influence teachers' pedagogical adoption of ICTs (Pelgrum & Law, 2008). Law et al. (2008a:5) maintain that "SITES 2006 aims to provide an overall picture of the status of pedagogical practice and ICT use in the participating countries and systems. Therefore, survey methodology is considered to be appropriate". The main research questions were: What pedagogical practices do schools adopt and how do they use ICTs to implement their goals? In schools that use ICTs extensively, what ICTs do they use and how is it used? What teacher, school, community and system factors are associated with complementary pedagogical approaches and ICT use? Can an explanatory model be identified? SITES 2006 administered three questionnaires: (i) a questionnaire for school principals, (ii) a questionnaire for technology coordinators, and (iii) a questionnaire for mathematics and science teachers. While the Teacher Questionnaire addressed research questions one and three, the Principal and Technical questionnaires generated data on school-levelled policy, school context and technical ICT issues (Law et al., 2008b).
The international school population was defined as all schools with students enrolled in the target grade, i.e. schools with students studying in the grade that represents eight years of schooling. The main study targeted two teacher populations in SITES 2006: (i) the population of all teachers of the target grade mathematics, and (ii) the population of the target grade science teachers (or, depending of the educational systems, biology, physics, chemistry or earth science if appropriate) (Law et al., 2008a:12). The school sample size per education system was fixed at a minimum of 400 schools. The teacher of one of the classes in the target grade (Grade 8 mathematics or science) had to be randomly selected. The teacher questionnaire required the teacher, while completing the questionnaire, to refer to a particular class of the target grade they taught (Law et al., 2008a:13). The SITES 2006 sample design featured a stratified two-stage sample where schools constituted the first level and teachers the second level.
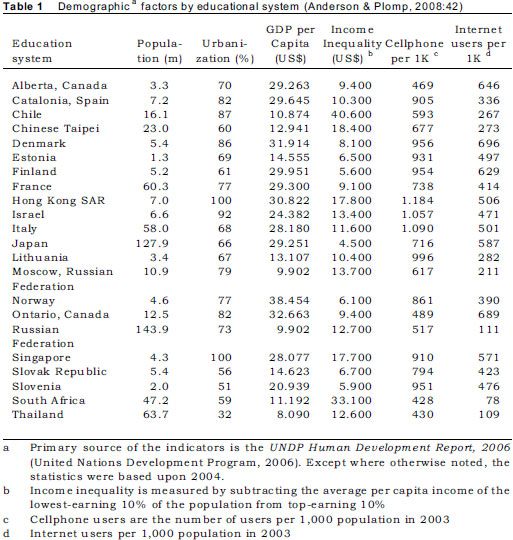
The SITES 2006 participation investigated education systems, rather than countries. In 2005, the 22 participating countries and education systems adapted, translated and piloted the three survey instruments and trained their local project personnel and supplementary fieldworkers. Researchers from the University of Twente, the Hong Kong University, and the IEA Data Processing Centre in Hamburg, Germany, coordinated the main study. The National Research Coordinators (NRCs) of each country managed local data collection and data capturing (Pelgrum & Law, 2008) (Table 1). The SITES 2006 module aimed at producing international comparisons of multitude indicators, recommendations for policies on ICTs in education, as well as in-depth analyses of how ICTs impact teaching and learning processes.
The Constitution of South Africa guarantees access to basic education for all. Consequently, legislative mandates aim to increase access to education, to distribute resources equitably, and to redress past discrimination (Department of Education, 2006a). Since the advent of democracy in South Africa in 1994, the Department of Education, in collaboration with other stakeholders, has launched initiatives to promote ICTs in schools. The Ministry of Education published the White Paper on e-Education: Transforming Learning and Teaching through Information and CommunicationTechnologies during August 2004 to consolidate and guide diverse initiatives towards the educational transformation (Republic of South Africa, 2004). Although publishing a policy document on e-Education represents a major step into the information era, no one knows to what extent these policies make a difference in practice. The SITES 2006 study provides baseline information close to halfway into the lifespan of the e-Education policy.
This initial, and up to date the only, ICT policy for South African education, presents a framework for the strategic, political, pedagogical and developmental facets of implementing e-Education in South Africa. The strategic objective of this e-Education policy states: "Every South African manager, teacher and student in the general and further education and training bands will be ICT capable, that is, use ICTs confidently and creatively to help develop the skills and knowledge they need as lifelong learners to achieve personal goals and to fully participate in the global community by 2013" (Republic of South Africa, 2004:17). The policy intends students to enhance their learning through the use of ICTs. Teachers are encouraged to make use of ICTs to improve effective teaching and learning practices, to enhance their management and administration with the help of ICTs, to access ICT resources that support curriculum delivery, and to connect with other teachers and students through ICT infrastructure. The policy envisions the realisation of its strategic goals according to a multi-year implementation plan comprising of three phases:
• Phase 1: Enhancing system-wide and institutional readiness to use ICTs for learning, teaching and administration
• Phase 2: Integrating system-wide ICTs into teaching and learning
• Phase 3: Integrating ICTs at all levels of the education (management, teaching and learning and administration) (Republic of South Africa, 2004:39-41).
The e-Education policy framework supports four key elements of ICT use in teaching and learning: (i) equity, (ii) access to ICT infrastructure, (iii) capacity building, and (iv) norms and standards. Equal access and equal competence require the development of a technology baseline for using ICTs in education. Stable, reliable and regular access propels the effectiveness of ICTs, as well as the extent to which students, teachers, managers and administrators can access the infrastructure and build inclusive competencies. ICTs also require extensive staff development and support, as well as the professional development of practising teachers. Revision of the Norms and Standards for Educators and of the in-service training policies and programmes intends to ensure that teachers understand and use ICTs competently.
The policy on e-Education acknowledges the massive investment required to attain its strategic goals. Although the current budget provides for inherent costs, the technology component of the roll-out plan requires sustainable and predictable resources. Also, the ongoing and often escalating costs involved in providing access to technology, teacher development, pedagogical and technical support, digital content, telecommunication, as well as maintenance, upgrades and repairs to infrastructure, are all expenses not yet acknowledged in the national educational budget. This commitment will require significant commitment from both public and private partnerships.
In order to put the expectation of exponential growth of ICTs in South African schools into perspective it is necessary to review the five-year broad national priorities of the Department of Education. These list the government's commitment in dealing with poverty through establishing zero-fee schools, accomplishing a national schools nutrition programme, developing skills relating to FET, ABET and human development, improving the quality of education in schools, improving the health of teachers and students, as well as developing FET colleges and Higher Educational institutions (Department of Education, 2005). In spite of the absence of a definite commitment to ICT in the Department of Education's five year broad priorities, the Minister of Education, Naledi Pandor, acknowledged ICT in her pledge: "Bringing ICT connectivity to our schools and education institutions will and must happen ... alongside the provision of basic educational infrastructure. The pace of delivery has to be accelerated" (Pandor, 2007a). However, in December 2008, Duncan Hindle, the former Director-General of Education, published new educational priorities for 2009 (Hindle, 2008). The only reference to ICT relates to support for the national education portal, Thutong, listed in the 20th position of national priorities.
Aim
As yet, no integrated report on South Africa's participation in SITES 2006 is available. Components of ICT use in Mathematics and Science pedagogical practices in South Africa have been reported (Blignaut & Els, 2009; Blignaut et al., 2009; Howie & Blignaut, 2009). We describe here the South African participation in SITES 2006 module against the backdrop of the South African educational context and demographics, with special reference to the areas in which South Africa scored low, and in conclusion, speculate on South Africa's participation in future modules. Under the auspices of the Centre for Evaluation and Assessment at the University of Pretoria, South Africa has participated in the three SITES modules. Consequently, South Africa was one of 15 education systems that participated in all three modules.
Although most education systems collected their data via an online data collection (ODC) system specially developed for this research, some countries and education systems followed a combination of ODC and paper-and-pencil responses. South Africa was the only country to follow an unadulterated paper-based data collection strategy (Pelgrum & Law, 2008). The South African NRCs obtained, on average, an instrument return rate of a little more than 90% - far more than the IEA required return rate of 85%. The IEA commended the South African team for the milestone of a first time listing on all the main tables of the international report. The IEA acknowledged the quality of the extensive fieldworker training and data integrity. They recommended the South African NRC's approach to large-scale survey research to other future participating developing contexts. In spite of this effort and the major achievement of a developing country being fully reflected in an international report, for the most part, South Africa scored disappointingly low when compared to the other 21 participating countries and educational contexts.
Discussion of South Africa's participation in SITES 2006 takes place according to four levels: the nature and structure of the educational system, a review of the South African participation in SITES 2006, ICT infrastructure, facilities and equipment, and teachers' use of ICTs for teaching and learning.
Attributes of the South African participation in SITES 2006
Nature and structure of the South African education system
Nearly a third (29.7%) of South Africa's population are younger than 14. More than 90% of South Africa's over 12.3 million potential students attend school, which is a higher enrolment rate than most developing countries (South Africa.Info, 2006). In 2005, South Africa had about 26,592 ordinary schools made up of 19,260 primary schools with 7,681,324 students and 228,957 teachers, 5,851 secondary schools with 3,828,705 students and 123,947 teachers, and 1,481 combined schools (Grades 1 to 12) and intermediate schools (both primary and secondary grades, but not all twelve grades) with 707,736 students and 29,229 teachers. In government-funded public schools, the average ratio of students per teacher is 31.8, while independent schools generally have one teacher for every 17.5 students. In reality, many classes regularly exceed 40 students (Department of Education, 2006b). In 2006, the gender ratio for primary and secondary students was roughly equal (males 5,913,189 and females 5,895,188). Since 1994, national expenditure on education has risen from ZAR 31.8-billion to ZAR 105.5-billion in 2007. Although education is the single largest category of government spending (about 24%), poverty-related educational challenges remain central. Approximately 40% of schools are classified as poor or very poor. About half of these students are exempted from school fees. About 60% of schools have electricity and 67% have telephone lines. Although many schools have sub-standard facilities, "schools-under-trees" have greatly diminished (Department of Education, 2006c). A consolidation of these statistics indicates that approximately 20% of schools meet the three basic telecommunications connectivity prerequisites, i.e. grid electricity, exchange telephone lines, and two or more computers connected to the internet per school (Holcroft, 2004).
Review of the South African participation in SITES 2006
Demographics of the South African education context
Table 1 illustrates the diversity and variation among the different education systems that participated in SITES 2006. In Africa, only one in every 700 people has internet access, versus one in four in Europe. However, in South Africa the proportional ownership of cellular phones to Internet access is high and until issues regarding African access to the internet have been fully resolved, it seems wise to focus on the development of 21st century skills via cellular networks (Worldpress.Org, 2004). More recent figures indicate that mobile phone use comprises 961.4 per 1,000 people compared to the listing of the 428 in 2004 (Nationmaster.Com, 2009).
National research coordination
Sarah Howie, Centre for Evaluation and Assessment (CEA), University of Pretoria, and Seugnet Blignaut, formerly Tshwane University of Technology, shared project management responsibilities as National Research Coordinators (NRCs) for the SITES 2006 module of the South African participation.1
They assumed the roles of survey research specialist and specialist in the use of ICTs in education, respectively.
The NRCs obtained permission from the national, as well as provincial, Departments of Education to administer the battery of survey instruments to sampled schools in the nine South African provinces. During the national pilot study, the NRCs and a team of co-researchers administered the instruments to 15 suburban, inner-city, semi-rural and deep-rural schools in the public, as well as private, educational sector in Tshwane and Pretoria. The NRCs encountered minimal problems with the instruments in terms of local language or comprehensibility. However, they determined that submitting the survey instruments as a personal interview schedule would be the most suitable, if not the only viable, strategy for the South African context. Although this strategy posed a disadvantage - submission of a single survey instrument took about an hour; it also offered a decisive advantage in that it precluded missing data and fostered a high completed survey return rate. After consultation with the IEA and the Data Processing Centre in Hamburg Germany, the South African NRCs proceeded to train fieldworkers and execute the main South African study in September 2006.
Due to insufficient internet access, the ODC option was at best unreliable and often unavailable for most schools in the South African sample. The NRCs consequently invited 384 TUT Masters' students to full-day workshops on quantitative research and fieldworker training. The NRCs conducted these workshops in all nine provinces, in order to prepare TUT students throughout the country to act as proficient fieldworkers for the South African SITES 2006 participation. In addition to a thorough theoretical grounding in quantitative research, the aspirant fieldworkers were trained for challenging situations by practising role playing sequences. The student fieldworkers received a course pack comprising high quality information on survey research, data collection and analysis, and fieldwork strategies. Before distribution, the NRCs obtained formal permission from the Dramatic Artistic and Literary Rights Organisation (DALRO) to copy and distribute these materials to the fieldworkers.
Using a Geographical Information System (GIS), the NRCs matched the sampled schools to either the homes or the work places of the 102 field-workers who participated in the South African data collection phase. As TUT attracted very few students in the Kwa-Zulu Natal and Northern Cape provinces, a team of specifically trained research assistants performed fieldwork in these areas. Administrative personnel contacted each school to determine the school's location, to ensure the school taught Grade 8 mathematics and science, to make appointments with the headmaster, to identify teachers for the survey interviews, and to reconfirm the fieldworker appointments at the schools. They also liaised with the fieldworkers to coordinate the school appointments and managed the allocation of bursaries and travelling costs of the fieldworkers on acceptance of the completed survey instruments.
The fieldworkers completed an additional observation schedule on the contextual variables for each school they visited. They couriered these, as well as their completed survey instruments, to the data capturing centre at UP. The NRCs remunerated the fieldworkers who presented fully completed survey instruments for their effort and travelling costs as a modest bursary paid into their TUT student accounts. Depending on their preference, students could use these funds toward their study fees or claim the cash. The studentfieldworkers experienced their training as valuable and pre-operational for the many challenging situations they encountered during their fieldwork:
I never knew so much can go wrong, and that you have to prepare so well. I have learnt so much about research ... and how to deal with difficult headmasters. I am now trained as a fieldworker ... I think I can handle my own project much better now. (Fieldworker)
The additional administration and management of the survey instruments to ensure integrity of the data, as well as the physical and financial management of the large number of fieldworkers, created an enormous administrative and managerial load on the research team. These responsibilities did not form part of the ODC mode most other NRCs followed. Complicating matters further, as the two NRCs were connected to two different higher education institutions (HEIs) with no formal mutual agreements, settlement of invoices across the financial systems became almost impossible. Effective management of research processes lagged. Only the mutual respect amongst the researchers and their perseverance saved the project from failure.
Sampling
The requirements of the IEA Data Processing Centre guided the South African SITES 2006 sampling process. The Higher Education Management Information System (HEMIS) database identified South African schools with Grade 8 learners. In the South African case, sampling was not straightforward as ICTs are significantly used in only two provinces - Gauteng and the Western Cape. The population of qualifying schools comprised four categories of computer usage: high ICT usage expected, low ICT usage expected, no computers available, and unknown. The unknown strata resulted into a further stratification, region to accommodate Gauteng and Western Cape, and other regions of unknown usage. Within these five strata, a further stratification according to school size afforded a total of 25 explicit strata. Prescriptive SITES procedures assigned 400 schools to the explicit strata. During the next phase, we doubled the school sample size in the high ICT usage stratum, and increased the school sample size by 40% in the low ICT usage and the Gauteng and Western Cape stratum. This strategy resulted in a sample size of 500 schools, with the 100 additional schools from schools where computer usage was expected. One or two mathematics teachers and one or two science teachers were sampled per school, dependent on the number of mathematics or science students in the target grade. The final sample afforded 666 mathematics teachers and 622 science teachers (Howie & Blignaut, 2009).
To protect the integrity of the data, the school sample included two replacement schools for each sub-stratum for cases where the survey instruments could not be submitted due to circumstances beyond the control of the NRCs. In spite of meticulous sampling, management, and monitoring, the NRCs encountered seven schools where the survey instruments could not be administered. These included sampled schools that did not exist ("ghost schools"), cases where fieldworkers were prohibited access to their assigned schools, and schools that did not honour appointments with the fieldworkers.
Data collection
During the international pilot phase of SITES 2006, the IEA employed a split-sample design to identify, investigate and statistically control possible measurement problems in different data-collection methods. The two data collection modes yielded comparable data, thus allowing the implementation of both modes within and across countries. The International Research Coordinators (IRCs) could indicate no substantial differences between the data from the paper-and-pencil mode and those from the ODC. NRCs were responsible for selecting a feasible mode of data collection for their countries or education systems. While 17 of the 22 education systems opted to implement ODC as the default data collection mode, four followed a hybrid approach of an ODC strategy augmented with paper-and-pencil schedules (Law et al., 2008a). South Africa was the only country to follow only a paper-and-pencil mode of data collection. The South African data collection commenced late in 2007 due to extensive delays in research funding.
Although the South African NRCs faced many challenges during SITES 2006, their approach to participation in the main study paid off: South Africa obtained on average an instrument return rate of more than 90% - far more than the IEA required return rate of 85% to be reflected on all main tables in the international report. The IEA commended the South African team for this milestone and recommended this approach to other developing contexts. The IEA also acknowledged NRCs for the quality of fieldworker training and data integrity.
Data capturing, analysis and reporting
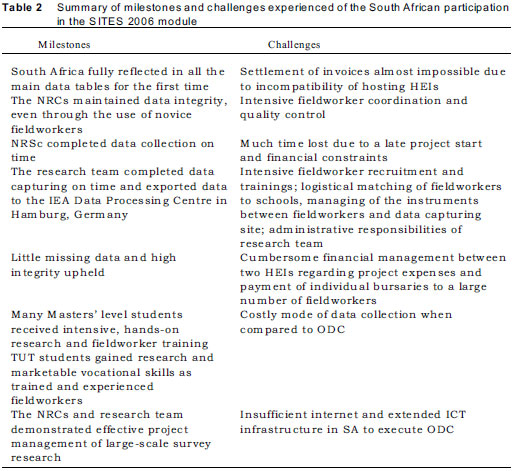
WINDEM, an IEA software package for large scale surveys captured data from all participating countries and education systems across the world from November 2006 to January 2007. During February and March 2007, the IEA Data Processing Centre, performed data cleaning, processing and weighting. The IRCs analysed the data of the 22 participating countries and compiled an initial draft report by April 2007. The NRCs of the participating countries thereafter discussed the initial comparative findings at the third NRCs meeting in Frascati, Italy. The IRCs released the final international SITES 2006 report (Law et al., 2008b) in 2008. The South African report will follow. Table 2 summarises the milestones and challenges of the South African participation in the SITES 2006 module.
ICT infrastructure, facilities and equipment
On the school level, infrastructure, facilities, and provision and maintenance of equipment support ICT for teaching and learning (Pelgrum, 2008). South Africa faces considerable education challenges, particularly the integration of ICT into schools. Class sizes have increased, but resourcing of classrooms has not followed. The National Education Infrastructure Management System (NEIMS) quantifies the physical infrastructure for education in all schools in South Africa. The NEIMS 2007 report (Department of Education, 2007:online) indicates that in 56% of 1,972 listed schools, more than 10% of students were without desks, and in 58% of schools, more than 10% of students were without chairs. Under such conditions, teachers cannot realise 21st century pedagogical goals unless basic infrastructure, facilities and ICT equipment and tools are available.
South Africa was the only country in the SITES 2006 study that could not provide students with full access to computers. The majority of available computers in schools are located in computer laboratories (49.3%). While 69% of schools in the Hong Kong education system reported on computers available for teaching and learning in classrooms, only 0.8% of South African schools complied. The percentage of South African schools with access to computers for Grade 8 increased from 18% during the 1998 SITES Module 1 to about 38% during the SITES 2006 - in spite of an enormous development leap during this period (Pelgrum, 2008:74). South African schools' overall computer access (38%) remains dismally low when compared to other education systems in developing countries such as Estonia (100%), Chile (96%), and Israel (96%). Huge ICT infrastructure differences exist among the participating education systems. In other developing contexts such as Italy, Russian Federation, Slovak Republic, and Thailand, hardly any schools have a student -computer ratio more than 10. However, in South Africa the majority of schools have a student-computer ratio of more than 40 (Pelgrum, 2008:76).
To achieve education goals such as fostering collaborative skills and teamwork and preparing students for responsible internet use, internet connectivity becomes increasingly important. South African schools with internet access have increased from 52% in 1998 (SITES Module 1) to 67% in 2006. South African schools have the second lowest internet access of all education systems that participated in SITES 2006, with the Russian Federation education system having the lowest internet access (49%). Again South Africa lags behind in internet access compared to other developing countries such as Chile (92%), Israel (98%), Lithuania (100%) and Estonia (100%).
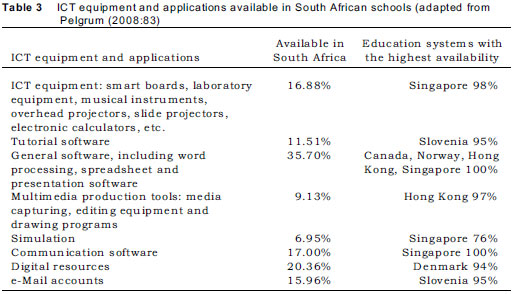
Table 3 lists South Africa's availability of ICT equipment and applications reported in SITES 2006 compared to some other participating countries and education systems. South Africa trails in terms of ICT equipment, tutorial software, general software, multimedia production tools, simulations, communication software, digital resources and e-mail accounts. The biggest contrasts in terms of ICT equipment and applications for all other education systems that participated in SITES 2006 are listed in Table 3. When compared to other developing countries, South Africa also performs poorly: South Africa reported only 17% ICT equipment available in schools compared to 47% ICT equipment available in Chilli, 70% in Israel, 72% in Lithuania, 98% in Singapore, 92% in Slovenia and 66% in Estonia (Pelgrum, 2008:80). These figures reflect the generally low and poor and unbalanced resources of South African schools, especially in rural areas. However, to meet the expectation of the e-Education White Paper of full ICT integration by 2013 (Pelgrum, 2008; Republic of South Africa, 2004), schools can only deliver through appropriate and sufficient infrastructure.
Teachers' use of ICTs for teaching and learning
Across the study teachers believed traditional curriculum goals (Van Der Walt & Maree, 2007:225) are more important than 21st century learning skills. Factor analysis indicated that preparing learners for upper secondary education and beyond, improving students' performance in examinations, and satisfying parents' and community expectations were perceived to be more important than preparing students for competent ICT use, preparing learners across different cultures (Meier, 2007: 660) for responsible internet behaviour, and fostering communication skills on-line and off-line. In addition, teachers were asked to indicate how often they adopted each of the listed teacher practices, as well as whether they used ICT for conducting any of those practices (Law & Chow, 2008:19). South Africa's mathematics and science teachers' use of ICTs remains persistently low (Table 4). Table 4 implies that teachers' preference for traditional learning has thwarted the development of students' 21st century skills, such as their ability to undertake independent learning, to search for, process and present information, and to take control of their own learning.
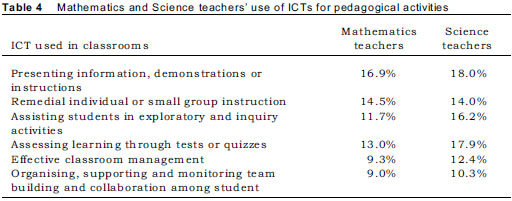
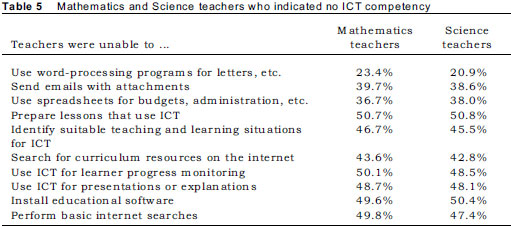
Table 5 links the low ICT use of mathematics and science teachers. A substantial portion of teachers reported their lack of ICT competency in terms of basic ICT pedagogical practice. The e-Education White Paper (Republic of South Africa, 2004) aims to address system-wide and institutional readiness to use ICTs for learning, teaching and administration (Phase 1). Until such readiness is reached, South Africa will not be able to achieve more substantial pedagogical use of ICTs in mathematics and science.
Conclusion
The conclusion of South Africa's participation in the SITES 2006 project touches on two issues: (i) the role of ICTs in realising South Africa's commit ment to better education; (ii) South Africa's participation in future SITES modules.
South Africa is rich in diversity in terms of income, culture, languages, and technology. On the one hand, South Africa is renowned for its technological innovation and development; and on the other hand, the majority of South Africa's learners do not share in the expectations of the information age. These inequalities are obvious in educational delivery. In the light of South Africa's less than adequate performance in the recent International Mathematics and Science Study (TIMMS) (Gonzales et al., 2004), the Progress in Reading Literacy Study (PIRLS) (Edac Wowe, 2008), and now the results of SITES 2006 (Law et al., 2008b), strategic policies should demand and provide equal access and opportunities for all. "It is time to declare war on the failure of foundational learning in our schools" (Pandor, 2007b). Cutting edge technology will have to come to the rescue, or "... if the current pace is maintained we will lose the gains made thus far" (Pandor, 2007a). South Africa's inability to cross the boundaries of traditional learning towards the development of 21st century teaching and learning skills in the information age inhibits social and economic growth for the development of human capital.
Our second conclusion concerns the data collection during SITES 2006 in South Africa. For the first time in the history of the SITES modules, South Africa reflected on all the main tables. While the South African study was more time, logistic and cost intensive, the quality of the paper-based data collection strategy resulted in a high survey return rate and few missing data. This strategy also led to the development of a large number of student field-workers with a marketable skill.
Collecting large amounts of data in international surveys over the internet offers substantial cost and time benefits. However, these advantages do not provide enough grounds to implement online questionnaires unless one can prove quality in terms of high participation rates and comparable data. SITES 2006 provided an opportunity for the IEA to explore the feasibility of collecting data over the internet in addition to the traditional paper-and-pencil questionnaires (Law et al., 2008a). However, if the IEA should follow up on the successful implementation of ODC in SITES 2006 and use ODC as default data collection strategy for future SITES modules, it could lead to South Africa's exclusion from forthcoming SITES studies. Such a decision will deter South Africa's participation in the series of SITES modules after participation in three successive modules. It remains important that South Africa should continue its participation of the SITES studies to measure the success of the e-Education strategic goals in terms of the implementation of the three phases. South Africa's theoretical framework for ICT benchmarking is fundamentally connected to the theoretical frameworks of the SITES studies to identify trends in the use of ICTs in Education.
To summarise our SITES 2006 expectations, the words of the former Minister of Education, Naledi Pandor, ring true. South Africa is "Not yet where we want to be" (Pandor, 2007a).
Note
1 SITES 2006 was run by the CEA. Sarah Howie was involved in initiating SITES M1 and M2, which were managed by the HSRC under the auspices of the IEA.
References
Anderson R & Plomp T 2008. National contexts. In: Anderson R & Plomp T (eds). Pedagogy and ICT use in schools around the world: Findings from the IEA SITES 2006 study. Hong Kong: Springer. [ Links ]
Blignaut AS & Els CJ 2009. The Hare and the Tortoise: A Comparison of Northern and Southern Hemisphere Findings of the SITES 2006. In: Bradley G & Kommers P (eds). IADIS International Conference ICT, Society and Human Beings 2009 organised by Algarve, Portugal. IADIS Press. [ Links ]
Blignaut AS, Hinostroza JE, Els CJ & Brun M 2009. ICT in education policy and practice in developing countries: South Africa and Chile compared through SITES 2006. Computers & Education. Department of Education 2005. http://www.education.gov.za/dynamic/dynamic.aspx?pageid=329&catid=10&category=Reports&legtype=null. Accessed 15 April 2008. [ Links ]
Department of Education 2006a. Annual Report 2005/2006. Available at http://www.education.gov.za/dynamic/dynamic.aspx?pageid=329&catid=10&category=Reports&legtype=null. Accessed 15 April 2008. [ Links ]
Department of Education 2006b. Education Statistics in South Africa at a Glance in 2005. Available at http://www.education.gov.za/emis/emisweb/05stats/DoE%20Stat%20at%20a%20Glance%202005.pdf. [ Links ]
Department of Education 2006c. South African Country Paper. Paper presented at the 16th Conference of Commonwealth Education Ministers: Access to Education for the Good of All. Available at http://www.16ccem.com/. Accessed 20 June 2007. [ Links ]
Department of Education 2007. National Education Infrastructure Management System. Available at www.education.gov.za. Accessed 20 July 2007. [ Links ]
EDAC wowe 2008. Progress in Reading Literacy Study. Available at http://www.edacwowe.eu/en/frmShowGIW_SES?v_id=14. Accessed 15 May 2009. [ Links ]
Gonzales P, Guzmán JC, Partelow L, Pahlke E, Jocelyn L, Kastberg D et al. 2004. Highlights From the Trends in International Mathematics and Science Study (TIMSS) 2003. Available at http://www.colorado.edu/physics/phys4810/phys4810_fa08/refs/TIMMS_2003.pdf. Accessed 2 February 2009. [ Links ]
Hindle D 2008. Director General, Duncan Hindle and Department of Education Officials Briefing to the Media regarding Department of Education Programmes, Priorities and State of Readiness for 2009. Available at http://www.info.gov.za/speeches/2008/08120514151001.htm. Accessed 9 February 2009. [ Links ]
Holcroft E 2004. SchoolNet South Africa. Information and Communication Technologies for Development in Africa: Networking Institutions of Learning. Available at http://www.idrc.ca/en/ev-71274-201-1-DO_TOPIC.html. Accessed 20 March 2007. [ Links ]
Howie SJ & Blignaut AS 2009. South Africa's readiness to integrate ICT into mathematics and science pedagogy in secondary schools. Education and Information Technologies, 14:345-363. [ Links ]
Law N & Chow A 2008. Pedagogical Orientations in Mathematics and Science and the Use of ICT. In: Law N & Chow A (eds). Pedagogical Practices and ICT Use Around the World: Findings from the IEA International Comparative Study SITES 2006. Hong Kong: Springer. [ Links ]
Law N, Pelgrum W, Monseur C, Brese F, Carstens R, Voogt J et al. 2008a. Study Design and Methodology. In: Law N, Pelgrum W, Monseur C, Brese F, Carstens R, Voogt J et al. (eds). Pedagogy and ICT Use in Schools Around the World: Findings from the IEA SITES 2006 Study. Hong Kong: Springer and Comparative Education Research Centre, The University of Hong Kong. [ Links ]
Law N, Pelgrum WJ & Plomp T (eds) 2008b. Pedagogy and ICT Use in Schools around the World: Findings from the IEA SITES 2006 Study. Hong Kong: Springer and Comparative Education Research Centre, Universities of Hong Kong. [ Links ]
Meier C 2007. Enhancing intercultural understanding using e-learning strategies. South African Journal of Education, 27:655-671. [ Links ]
NationMaster.com 2009. Mobile cellular per capita most recent by country. Available at http://www.nationmaster.com/graph/med_tel_mob_cel_percaptelephones-mobile-cellular-per-capita. Accessed 13 May 2009. [ Links ]
Pandor N 2007a. E-learning in South Africa. Address by the Minister of Education, Naledi Pandor MP, at the World Ministerial Seminar on Technology in Education Moving Young Minds Available at http://www.education.gov.za/dynamic/dynamic.aspx?pageid=306&id=2471. Accessed 14 February 2007. [ Links ]
Pandor N 2007b. A "foundation for learning" strategy to be gazetted. Available at http://www.education.gov.za/dynamic/dynamic.aspx?pageid=310&id=6931. Accessed 12 December 2007. [ Links ]
Pelgrum W 2008. School Practices and Conditions for Pedagogy and ICT. In: Pelgrum W (ed.). Pedagogy and ICT Use in Schools Around the World: Findings from the IEA SITES 2006 Study. Hong Kong: Springer and Comparative Education Research Centre, The University of Hong Kong. [ Links ]
Pelgrum W & Law N 2008. Introduction to SITES 2006. In: Pelgrum W & Law N (eds). Pedagogy and ICT Use in Schools Around the World: Findings from the IEA SITES 2006 Study. Hong Kong: Springer and Comparative Education Research Centre, The University of Hong Kong. [ Links ]
Republic of South Africa 2004. White Paper on e-Education: Transforming Learning and Teaching through Information and Communication Technologies (ICTs). Available at http://www.info.gov.za/whitepapers/2003/e-education.pdf. Accessed August 470. [ Links ]
South Africa.info 2006. South Africa: Fast Facts. Available at http://www.southafrica.info/ess_info/sa_glance/facts.htm. Accessed 14 February 2007. [ Links ]
United Nations Development Program 2006. Human Development Report 2006. Available at http://hdr.undp.org/hdr2006/. Accessed 12 December 2008. [ Links ]
Van der Walt M & Maree K 2007. Do mathematics learning facilitators implement metacognitive strategies? South African Journal of Education, 27:223-241. [ Links ]
WorldPress.org 2004. Bridging the Digital Divide: Africa's Poor Connection. Available at http://www.worldpress.org/Africa/1744.cfm. Accessed 12 December 2007. [ Links ]
Authors
Seugnet Blignaut is Research Professor at the School of Continuing Teacher Education at the North-West University, Potchefstroom Campus. She is a widely published researcher and her research focus is on the interaction in virtual learning communities, as well as ICT for development.
Christo Els is Research Projects Coordinator at the School of Continuing Teacher Education at the North-West University, Potchefstroom Campus. His research focuses on archetypal psychological types, teaching and learning styles, development of educational and psychometric web-based applications, and use of ICTs in education.
Sarah Howie is Director of the Centre for Evaluation and Assessment and Professor in the Department of Science and Mathematics Education at the University of Pretoria. She is an award-winning, recognised researcher and focuses on large-scale assessments, international comparative education, and student achievement.

