


Services on Demand
Article
 English (pdf)
 Article in xml format
 Article references
Indicators

Related links
-
 Cited by Google
 -
 Similars in Google
Share

 Permalink
Koedoe
On-line version ISSN 2071-0771
Print version ISSN 0075-6458
Koedoe vol.62 n.2 Pretoria 2020
http://dx.doi.org/10.4102/koedoe.v62i2.1592
ORIGINAL RESEARCH
Variation in mammal diversity and habitat affect heterogeneity and processes of a granite catena
Beanelri B. JaneckeI; Jeremy G. BoltonII
IDepartment of Animal, Wildlife and Grassland Sciences, Faculty of Natural and Agricultural Sciences, University of the Free State, Bloemfontein, South Africa
IIBushcam Consulting, Stonehurst Mountain Estate, Lakeside, Cape Town, South Africa
ABSTRACT
A higher variety of habitats normally result in higher diversity of species. The granite catenas near Skukuza, Kruger National Park (KNP), consist of different soil types along the hillslope, creating different habitats. Objectives were to determine the mammal species present on a catena and surrounding areas; to indicate their main period of activity; and to indicate human visibility in each catenal zone to explain landscape of fear principles. Camera trap surveys were conducted for short periods and repeated over three years. In total, 31 mammal species were observed on the catena, and its nearest waterholes. Small to mega-sized mammals were present, but some species were only observed during one survey period. Small changes were noticed in activity periods between survey periods, probably due to the drought. A severe drought changed vegetation structure and visibility, but the study area appeared to act as a drought forage refuge. The lowest visibility was found at the sodic patch upper-midslope ecotone, and shrub veld. This can possibly explain the lower number of mammal observations in these areas. Different habitats and habitat features were described which can affect the presence of mammals, i.e. the mud wallows that were created and maintained by the mammals. Future studies can focus on the impact of seasonal changes in mammal presence and on mammal diversity during a normal rainfall year.
CONSERVATION IMPLICATIONS: To understand the mechanisms of herbivores as ecosystem drivers, aspects such as vegetation, soil and mammals should be combined. Better understanding of mammals, their habitats and associated processes can lead to better conservation actions
Keywords: Animal presence; Ecosystem functioning; Herbivores and predators; Landscape of fear; Stevenson-Hamilton Supersite.
Introduction
Acceptable habitat conditions are one of the most important requirements for successful maintenance of animal populations. Resources in the habitat are exploited differently in order for animals to fulfil their requirements for survival, reproduction and growth (Owen-Smith 2002). Hall, Krausman and Morrison (1997) define habitat as follows:
[T]he resources and conditions present in an area that produce occupancy - including survival and reproduction - by a given organism. Habitat is organism-specific; it relates the presence of a species, population or individual (animal or plant) to an area's physical and biological characteristics. Habitat implies more than vegetation or vegetation structure; it is the sum of the specific resources that are needed by organisms. (p. 175)
Habitat is thus any area where an animal has the necessary resources that allow it to survive, including migration paths, dispersal corridors and areas occupied during breeding times (Hall et al. 1997; Krausman & Morrison 2016).
Habitat selection refers to a process where an animal selects a specific set of environmental factors that can provide all the essential resources it needs to survive and reproduce (Bonyongo 2005; Johnson 1980; Krausman & Morrison 2016). The basic habitat requirements of animals in general are food, water, cover (i.e. thermal cover, shade, shelter, escape cover and cover for new-borns) and space to perform normal daily activities (i.e. resting, feeding, rumination, reproduction, socialising, avoiding competition, etc.) (Hansen et al. 2009; Janecke 2011). Other features that are included when an animal selects a habitat are the vegetation structure of the area, certain geomorphological features, topography, seasonal availability of resources, distance from resources (such as water and grazing), presence of predators and the landscape of fear principle, to name but a few. The specific animal species, their social structure, age, sex, physiological condition (gestation and lactation) and behavioural aspects play a role in the needs of the animal when selecting a habitat (Bonyongo 2005; Grant et al. 2011; Joubert 2016; Owen-Smith 2002). The presence or absence of an animal species is determined by how well the species' own special, or general habitat requirements and basic needs are met in that specific area, amongst other reasons, and probably also what its niche role is in maintaining ecosystem processes of the area. A variety of available habitats in an area will usually result in a variety of animals in that area (Joubert 2016). It is essential for long-term management and conservation of species to relate the distribution patterns of animals to certain characteristics of their chosen habitat (Ben-Shahar & Skinner 1988; Pieterse 2018).
This study forms part of a larger multidisciplinary study on the Stevenson-Hamilton Southern Granite Supersite of the Kruger National Park (KNP), with the main aim of determining specific abiotic processes and some biotic diversity that may play a role in the functioning of the catena ecosystem. Weil and Brady (2016) define a catena as a soil sequence (soilscape) where each soil type occurs on the same parent material, but in different arrays from the crest down to the footslope. This hillslope facilitates the transfer of solutes, colloids or other particles from upslope areas downhill along an increasing environmental gradient, resulting in a variation of soil properties and associated vegetation in different catenal zones (Khomo et al. 2011). The focus of this current study was on whether specific mammal species use certain catenal zones more frequently than others; the specific objectives of this study were to:
1. determine the mammal species present in the study area, at the nearest waterholes and granite outcrops with a snapshot approach
2. indicate the main period of activity of these mammals during three different survey periods
3. establish human visibility (based on density of vegetation) in each catenal zone in order to explain the landscape of fear principle usually connected to the absence or presence of mammals in the area.
Methods
Study area
The supersite concept was established formally in 2013 to try and focus research effort geographically in KNP, and to allow data integration over long periods and across different research themes. One of the four research supersites is located in a specific area on the wetter, southern granite landscape in the Stevenson-Hamilton area (Smit et al. 2013).
This study was conducted on a hillslope in the Southern Granite Supersite, located between 25°06'28.6 S, 31°34'41.9 E and 25°06'25.7 S, 31°34'33.7 E, approximately 10 km from Skukuza, KNP. The study area falls in the Renosterkoppies land type, described as an ecotonal area between land types that are associated with the Sabie River catchment (Smit et al. 2013). The average herbivore biomass on the supersite is 2.1 kg grazers/ha, 3.0 kg browsers/ha and 9.9 kg mixed feeders/ha (Smit et al. 2013).
This study focused on one catena or hillslope from the crest to third-order watercourse or drainage line. The vegetation in this area is described as moderately dense bush savanna on midslopes and as shrub savanna with a dense riverine forest at the footslope and valley bottom (Smit et al. 2013). As part of the effort to focus different research fields together on the supersites, the following research was conducted on one specific study area: Bouwer, Le Roux and Van Tol (2020) described the soil types and properties, Theron, Van Aardt and Du Preez (2020) did a detailed vegetation classification and Janecke (2020) provided a description of the vegetation structure. Four catenal zones were identified along the slope based on their position on the catena and associated vegetation, namely, crest and upper-midslope, lower midslope or sodic patch, footslope shrub veld and a riparian area around the dry drainage line. A seepline defines the transition between the upper and lower-midslope. To give an indication of the size of each zone, a linear measurement was done from crest to drainage line (but that does not indicate the surface area of each zone): upper-midslope is 140 m in width, lower midslope is 220 m, footslope is 70 m (on its shortest end) and the riparian area is roughly 50 m but more difficult to indicate because of the winding of the drainage line. The study area was approximately 1.5 km in length. A visual illustration of the catena studied is provided by Janecke et al. (2020).
Camera trapping
The location of each camera trap was determined after a visual survey of the study area in order to represent the four identified catenal zones. The three nearest permanent waterholes (De La Porte, Kwaggaspan and Renosterkoppiesdam) and two rocky outcrops with granite boulders close to the study area, as well as two large mud wallows inside the study area (sodic patch and riparian zone), were also surveyed through cameras. In total, 30 camera traps were deployed during each of the three survey periods, which lasted for approximately a fortnight each during September 2015, March 2016 and March-April 2017.
Of the 30 cameras used, 23 were Bushnell models, 4 were Cuddeback, 2 were Scoutguard and 1 was Little Acorn model. Cameras were selected with similar attributes in terms of trigger response time (between 0.25 s and 0.9 s) and field of view ranges, and all utilised infrared flashes. A camera trap positioned to monitor a game trail was required to have a faster trigger response time than one monitoring a wide clearing. The same locations were used in all three surveys unless the camera-holding tree had been damaged or vegetation conditions dictated that a better (nearby) location was essential to obtain good results. The majority of cameras were set up to monitor mammals passing at close range, while four were set up to monitor on a time-lapse basis from a distance as follows:
1. Passing mammals (26 cameras). Cameras were positioned between 50 cm and 170 cm height to give the best uninterrupted view of the area around a well-used game trail, termite mound or an open clearing where there was evidence of the presence of mammals. Where possible, cameras were orientated in a southerly direction to optimise the quality of images obtained (sunlight). Cameras were installed as low as possible, provided that the camera's field of view was not obstructed by vegetation, to also capture small mammals. Cameras were programmed to take two photographs per trigger event, with a rest interval of 5 s between image pairs.
2. Time lapse (four cameras). These cameras were installed between 1.5 m and 3 m height so as to give a clear view of the entire waterhole or sodic patch and were programmed to take one image every 5 min. This was deemed an appropriate interval to ensure that any mammal drinking at the waterhole or crossing the sodic patch would likely be recorded. In addition to the camera taking time lapse images, it was also programmed to record the movement of mammals passing the camera at close range.
Visibility
During the vegetation sampling of the study area in 2015, a visibility index was determined. The distance of 20 m was used after testing different possible distances - in many of the plant communities, the vegetation was too dense to see much further than 20 m or 30 m. A 100-m measuring tape was used as a transect line in the different catenal zones. Transects were placed on a horizontal plane in each zone (in other words, not running from top to bottom down the slope) at approximately 20 m intervals but excluding the transition areas (Janecke 2020). A 1 m2 cloth with a checkerboard pattern of 10 cm blocks and dowel sticks on the edges was used. The method was slightly adjusted from that of Bissett and Bernard (2007). The field assistant held this apparatus at ground level, 20 m from the observer and at 90°, 180° and 270° angles, respectively, from the observer standing on the transect line. The observer then counted the number of blocks visible at an observing height of 70 cm and 170 cm from the ground level to imitate different sized animals. These observations were repeated at 20 m intervals along the 100 m transect line (0 m, 20 m, 40 m, 60 m, 80 m and 100 m) for each catenal zone. The average in the bar graph illustrating the results was calculated from all the values on the 100 m line (20 m intervals) for each angle (90°, 180° and 270°) observed, respectively.
Data and statistical analyses
Camera trapping images were analysed as follows. For the purpose of this study, an independent trigger event is defined as an image or a series of images that record the passing of an individual or group of individuals at a specific time. For example, an event could include the movement of a herd of impala, or a single hyena, passing the camera. The number of events thus represents the number of observations of an animal species. No specific interval was used to determine the independence of consecutive events. However, every effort was made to determine whether the individual or individuals were different from those in preceding sequences of images to prevent double-counting. If an animal species could not be identified, for example, because of badly blurred photos usually taken at night, it was indicated as Unknown. From these, the following data per independent trigger event were extracted: date and time, animal species, number of individuals in the view of the camera and the primary activity of the animals.
Data from the camera traps were grouped according to the catenal zone that the camera was located in, with all three waterholes combined together as one zone. There were five cameras per catenal zone, five at waterholes and surrounds (the two larger waterholes had two cameras each pointing in different directions), and five at special locations (granite outcrops and mud wallows). The number of trigger events (or observations of each species) was totalled for each mammal species per catenal zone and graphically presented as a grayscale gradient of increasing number of events for each survey period (year) of research. A Pareto graph was used to indicate the total number of events of that species in the study area in descending order of frequency and its percentage of the total as a cumulative line. Only mammal species were indicated in the results, but all information on the two rhinoceros species was excluded (for security reasons).
The minimum to maximum range in general group size of individuals visible in the cameras' view and the median value of typical group sizes observed were tabulated per survey period. The Excel median function was used to determine a median value of those records of group sizes greater than 1. This was verified by a visual observation of the data to ensure that the median value looked reasonable. The sum total of all mammals observed per species in each survey period was also indicated in a table (this is the total number of all individuals captured on the cameras and not the number of times/events that they were observed). Other information calculated from photographs included the percentage of the total number of events that a species was observed on the cameras to be active (grouped into day, night and civil twilight) and species that utilised the catena was also indicated.
Utilisation of the catena was described as mammals captured on the cameras doing one or more of these activities:
-
Feeding: obvious feeding activity, or a species moving slowly across the camera's field of view in a feeding position, for example, head down for grazers and head near vegetation for browsers.
-
Socialising: chasing each other, making body contact, locking horns.
-
Resting: lying down for long periods, usually at night for diurnal animals.
-
Wallowing: lying in the mud holes on the catena and a mammal next to the wallow that showed mud on its body were included.
-
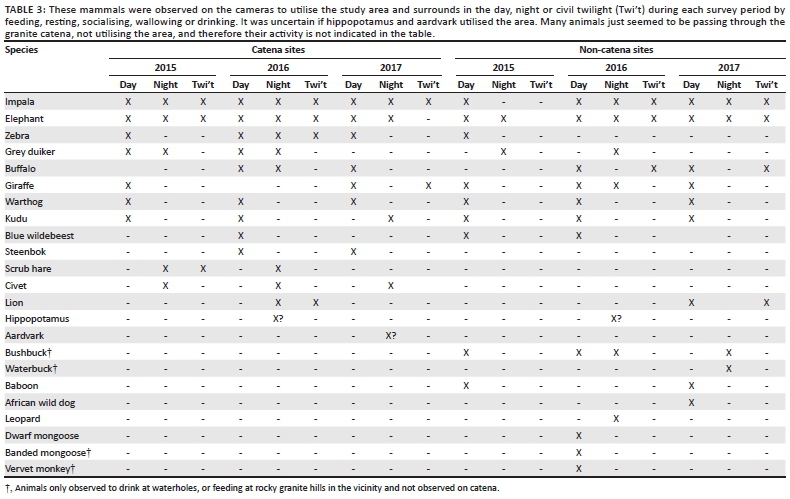
Drinking: some animals were drinking from the mud wallows, but mostly mammals standing at the edge of a waterhole were presumed to be drinking. If mammals were just in the vicinity, although it can be assumed that they might have been drinking, these mammals are not listed in Table 3 (but are indicated in Figure 1).
The normal distribution of data was determined by the Shapiro-Wilk test. As it was not normally distributed, the Kruskal-Wallis test (https://www.socscistatistics.com/) for non-parametric data was used to determine significant differences in number of animal species observations per catenal zone between the three different survey periods. A 5% level of significance was used. Variability in sample means of the number of blocks visible on the checkerboard was measured through standard errors. Error bars were included for standard error of the mean (SEM) in the visibility graph and were calculated by Excel using the following formula: SEM = standard deviation/square root of total number of samples.
Ethical considerations
Ethical approval for the multidisciplinary project as a whole, with specific mention to the camera trapping, was obtained from the Interfaculty Animal Ethics Committee at the University of the Free State (UFS-AED2019/0121).
Results
A snapshot approach was followed to give an idea of the mammal species that frequent the study area - in other words, the cameras were only left in the veld for short periods during each survey period. A total of 31 mammal species were observed during the study (Table 1). Tortoises, terrapins, (large) millipedes and several bird species (including ground birds and smaller birds) were also observed on the cameras but are not included in the species list which focuses only on mammals. All data on the black and white rhinoceroses have been removed from the figures because of the sensitive nature of this data (i.e. poaching concerns). Although exclusion of these two threatened species affects the results, we decided to remove such data as a precaution.
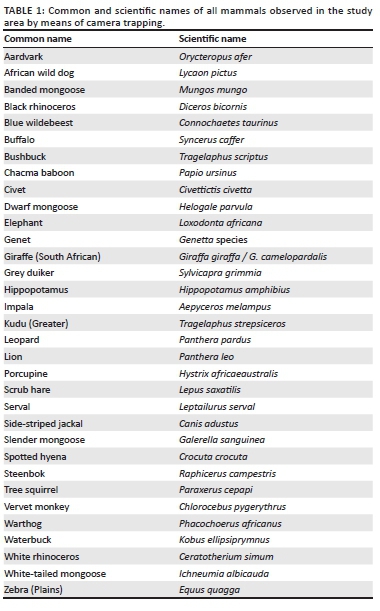
Figure 1 indicates the events (or in other words, the number of independent observations) of each mammal species observed during the three survey periods, divided into catenal zones (determined from its position on the catena and associated vegetation). Herbivores (16 species), carnivores (11 species), insectivores (2 species: aardvark and civet) and primates (2 species) were recorded. Of these, seven species are small mammals, such as the mongoose species, genet, scrub hare and tree squirrel. Figure 2 presents the total number of events that each species was observed and its percentage of the total number of events (including all species). This graph clearly shows the species that were observed more frequently than others, in contrast to species that were recorded the least or were completely absent during all the survey periods. The order of species also changes through the survey periods (Figure 2). The more common species during all three survey periods were impala (603 events in total), elephant (289), spotted hyena (74), kudu (76), giraffe (72), buffalo (54), zebra (51), warthog (48) and grey duiker (43). Blue wildebeest (28 events in total), lion and steenbok (approximately 20 events each) were also observed more than the remainder of the species.
The general group sizes of each species observed are shown in Table 2. It is noted that some individuals may have passed outside the view of the cameras; thus, the totals are just an indication and not the true possible numbers of herds or groups in the area. The sum total of all animals of each species that were observed during a survey period (Table 2) clearly shows the following: the rise and fall of total elephant numbers observed during the three surveys, the increasing total number of impalas observed and the declining total number of kudu recorded over the three periods, to mention but a few. These totals are not herd sizes but all the individuals in total observed during the survey period, which can be the same individuals seen repeatedly. If these totals are compared to herd sizes and the number of events (Table 2), it may be interpreted that individuals of these specific species are probably resident in the study area and will therefore utilise the area more than other species just passing through the area and are not observed so frequently.
The total number of mammal species observed during each survey period (24, 25 and 24 species, respectively) seem very similar, but they include some species that were only observed during one survey period but were absent from other periods (Figure 1). This was confirmed by significant statistical differences between the number of observations of each animal species in a catenal zone between the three different survey periods (n = 122 per survey period; H = 7.295; p = 0.026 < 0.05). The total number of mammal species in each catenal zone was as follows: crest and upper-midslope (19); sodic patch on lower midslope (17); shrub veld on footslope (14); riparian area close to the drainage line (15); permanent waterholes (22); rocky hills (16); and mud wallows, temporarily filled with water (13). Many of these mammal species were present in more than one catenal zone. The highest species diversity was found on the upper-midslope and sodic patch, and as was expected, at the waterholes (Figure 1).
The period of a 24-h day when the mammals were observed on the cameras is indicated in Table 2. The obvious assumption was made that animals engaging in activities such as feeding, resting, wallowing, drinking and socialising were spending more time in the study area than animals just passing the cameras. These results may differ seasonally, but there is insufficient data from this study to confirm that, and it is possible that more mammal species may utilise the area than that found from the short duration of camera surveys (Table 3). The duiker was included, as they are territorial and not water-dependent animals (meaning that their presence indicates utilisation of the area and not just moving through the area to perhaps reach waterholes), and the civet was included because of the presence of active civetories (i.e. locations of frequent civet defecation) on the catena.
Figure 3 indicates the human visibility (average of six distances in one direction) in the different directions (or angles from the transect line) in each catenal zone surveyed. Because of the vegetation structure, the sodic patch had the highest average visibility, while the transition zone between the upper-midslope and sodic patch had the lowest average visibility, followed by the shrub veld on the footslope. There were differences observed in Figure 3 between the 70 cm and 170 cm observation heights, especially in the riparian zone (T7). Tall, dense grasses, clumps of shrubs, large trees and the presence of the drainage line (with its relatively higher banks than the surrounding area) contributed to lowered visibility in this zone.
During the initial vegetation sampling as part of the large multidisciplinary project, the veld was still in relatively good condition and the vegetation was dense with long grass, especially in the shrub veld and the riparian areas. This changed during 2016, with the extreme drought, not only for the study area, but many other areas in the southern and central KNP were also similarly affected (Malherbe et al. 2020). The visibility changed to an estimated 80% - 100% in different zones of the study area (pers. obs. October 2016) - the grasses that were present were only small tufts grazed down to stubble height. The trees were mostly bare or sparsely leafed and many trees died or were uprooted and damaged by elephants. After the drought in 2016, many of the tall grasses died and were lying flat on the ground (covering the soil - see Janecke 2020). All of this greatly increased the visibility in that area during the last two years of camera data collection.
Discussion
Mammals are usually present in a habitat if their needs and requirements are met or if they move between preferred habitats. With regards to the usual terrestrial mammal habitat requirements, the assumption can be made that the basic needs are most probably accounted for in the study area and surrounds, based on the presence of the listed mammals (Figure 2) as indicated by the definition of habitat (Hall et al. 1997; Krausman & Morrison 2016). There are various reasons why mammal species will be present in or absent from a specific area or catenal zone (see Introduction) and some of these reasons will be focussed on in this section. Food, water, cover (shade, shelter, etc.), space and certain geomorphological characteristics (soil types, topography, geological formations, etc.) are considered to be the basic habitat requirements of most mammals. The medium- to large-sized individual trees (with canopy cover ranging from 10.5% to 33.6%) present on the upper-midslope and in the lower-lying riparian area (Janecke 2020), together with scattered clumps of shrubs and trees, should provide food for herbivores and sufficient shade and shelter from the extreme temperatures associated with savannas. The characteristic granite boulders on small hills or outcrops (geomorphology) in the surrounding area had their own mammal species associated with that habitat which mostly differed from that of the catena (Figure 1).
The nearest drinking water is available to animals at the Sabie River and some of its smaller tributaries, and at three nearby permanent waterholes located in different directions from the study area. The rationale with placing camera traps at the three permanent waterholes was that mammals that were not observed in the study area but were caught at the waterholes are actually present in the local area and might also use the study area from time to time as habitat. Waterbuck, side-striped jackal and banded mongoose were only found at the waterholes and not on the catena or granite hills (Figure 1). There were three large mud wallows in the study area that might have been created by mammals looking for water. It might fill up with rain water, surface run-off, and there is a possibility that water seepage from underground may also play a role (depending on the position of the mud wallow on the catena). Many animals were also observed to drink at these temporary holes when water was present. Water sources are generally crucial components in habitat selection by many water-dependent herbivores, and also for predators like lions. Habitat selection of most herbivores is also influenced by distance to water; hence, predators will have a greater chance of encountering prey in the areas closer to water (Davidson et al. 2012; Gaylard et al. 2003).
The temporary mud wallows contained rain water during the 2015 and 2016 survey periods, but during 2017 no water was present. This might have affected the presence of species on the catena and the number of individuals present during the 2017 observation period. The group numbers of elephant, buffalo, warthog and blue wildebeest were lower in this period (Table 2), possibly as a result of the absence of water in the temporary holes, and also possibly because of obvious food shortages caused by the drought (2015-2017). Mongoose was not observed during 2017, while other smaller-sized mammals like scrub hare, vervet monkey, duiker and steenbok had the lowest number of events (observations). This can be because of various reasons, such as food limitations, the absence of cover (higher visibility to predators) and high temperatures, to name but a few (see Seydack et al. 2012). The number of observations of kudu and giraffe did not change drastically over the survey periods, although it was only a few individuals observed at a time (Table 2).
During the extreme El Niño event of 2015-2017, the study area appeared to be a refuge island of green vegetation surrounded by the desert-like areas around Skukuza and Lower Sabie where mainly bare soil, leafless trees and dead trees were present during the drought (Janecke et al. 2020; Van Aardt et al. 2020). The long-term (76 years) average annual rainfall total for Skukuza is 550.4 mm. During the drought, the cumulative total of rainfall measured at the end of the climatic year (June 2015-July 2016) for the Skukuza area was 194 mm (Skukuza Scientific Services Weather Data). This is lower than the lowest annual rainfall on record (251 mm during 1990-1991 - Zambatis & Biggs 1995) for that area. Staver, Wigley-Coetsee and Botha (2019) concluded that the droughts of 1991-1992 and 2015-2017 were exceptionally severe and that it probably exceeded the tolerance of the grasses. The impact of browsing or grazing across a landscape is differentially affected by the dispersion of herbivores as an agent of heterogeneity, while further controls include the social structure of these animals and their density. Dispersion (and thus the presence or absence in the study area) may also be controlled by the degree of the drought (Pickett et al. 2003). There was still grass available on the catena (although it was grazed to stubble height on most of the sodic patch, but not on the upper-hillslope) and the trees on the catena were alive and full of leaves (pers. obs. April 2016 and visible on the cameras). This can provide an explanation for the presence of the herbivores in the study area at the peak of the drought (Figure 1), where they appeared to be mostly absent from surrounding areas closer to Skukuza.
Hippos were captured on the cameras at the De La Porte and Renosterkoppies waterholes and in the dry drainage line of the study area during 2016, but not during other survey periods (Figure 1). As expected, they seemed to have moved further away from the river in search of food (and possibly other large waterbodies for cooling their body temperature) during the drought period (Table 3). Elephants were observed during the day in 87% of events in 2015, 66% in 2016 and 52% in 2017 (Table 2); giraffe were observed during the day for 73%, 69% and 53% of each of the three survey periods; kudu for 85%, 100% and 55%; and zebra for 86%, 44% and 56% of the survey periods. These changes in their active period might be a way to deal with intensifying heat during the day as the drought progressed, by being more active in cooler periods of the night, or it might be that as more rains were experienced from 2017, the food resources were less scarce and animals could spend less time on feeding and moving in the hot period of the day; however, more long-term research is needed to confirm any of these statements for the catena. White rhino and hippo grazing, together with continuous grazing from other species, and the trampling effect on the soil are important contributors to maintaining the short grass state on grazing lawns. Active dung middens also contribute to the nutrient value of a local area. High-quality forage that is seasonally available on sodic sites may have important consequences for population dynamics and the behaviour of grazers (Grant & Scholes 2006; Jacobs & Naiman 2008; Khomo & Rogers 2005).
Du Toit (2003) stated that grazers concentrate on zones that shift up and down a catenary drainage gradient on a seasonal basis, and they move progressively down the hillslope in the dry season as green grass declines, while they switch back to nutritional swards on the uplands as rains commence. The same pattern is described for browsers, usually resulting in the higher herbivory in riparian areas during the dry season (Du Toit 2003). In the current study, the riparian areas had lower average visibility, and these areas were not frequented by mammals more than other catenal zones at the end of the growing season when the surveys were conducted.
Visibility might affect the presence of herbivores in some of the catenal zones, or parts thereof, because of predation risk and the landscape of fear principles. The presence of carnivores is also affected by visibility in the area because smaller carnivores, as possible prey for larger carnivores, might also experience a landscape of fear in certain areas. Terrain heterogeneity differs over landscapes and a predator is not adapted to hunt skilfully in all types of landscapes. A system can be conceived where the lethality of a predator and predation risk will vary with spatial changes in different habitats. This is described as the landscape of fear: 'a three dimensional landscape whose peaks and valleys are defined by the level of predation risk related to changes in habitat as they affect the lethality of the predator' (Laundre, Hernandez & Ripple 2010:2). The landscape of fear thus reflects the level of fear of predation that a prey will experience in various parts of the area it uses as habitat (Laundre et al. 2010).
Specific areas of the riparian zone proved to have the lowest overall visibility of all the catenal zones, especially for smaller-sized mammals (everything smaller than, and including, a dwarf antelope), because of tall grasses and dense shrubs. Although camera traps were specifically placed on footpaths and open areas where more mammal activity was expected, the lower recorded visibility score (Figure 3) might explain why relatively few observations of mammals were made in the shrub veld and riparian zones (Figure 1). The percentage of the total number of events (observations) in each catenal zone was recorded as follows: 13.3% on the crest and upper-midslope, 19.1% on the sodic patch, 9.0% in the shrub veld on the footslope, 10.7% in the riparian area, 10.5% at mud wallows and the remainder at waterholes (25.2%) and surrounding areas (12.2%). However, these percentages are slightly biased because of different capturing techniques used by the cameras and because of impala that 'camped out' in vicinity of some cameras while feeding and ruminating - increasing the number of events on a single day but spaced out with longer time periods in between (see the definition of 'event' under 'Methods' section).
Lions and leopards are stalk and ambush predators and are expected to be more successful where they can use dense vegetation as concealment for hunting. Lions in Hwange National Park, Zimbabwe, preferred to be located in denser vegetation, next to more open, bushed grassland areas, from where they can observe prey inside the bushed grasslands (Davidson et al. 2012). Trees and bushes are also used by predators when they approach prey, which to a certain extent might counteract a tree's attractiveness to herbivores for feeding and/or resting. Furthermore, areas with high densities in trees, especially trees with low branching heights, are known to be less attractive because of impeded predator visibility (Riginos & Grace 2008; Treydte, Riginos & Jeltsch 2010). In the study area, leopards were observed on the upper-midslope and in the riparian area, while lions were observed on the upper-midslope, sodic patch and riparian area of the catena (Figure 1). They may have similar tendencies in using the denser areas around the sodic patch to observe potential prey, as recorded in the literature, but this assumption has not been researched in the current study and these predators were also observed in other catenal zones.
The vegetation structure and density, together with other factors such as the presence of termite mounds and the higher banks of the drainage line, made visibility poor in certain zones on the catena. This can create a top-down regulation by predators (or their possible presence anticipated by prey) on herbivore numbers and species in these areas, based on landscape of fear principles (see Laundre et al. 2010), especially in riparian areas known to usually have higher grazing value (Du Toit 2003; Naiman & Rogers 1997). Lower observations than expected were made of herbivores in the riparian zone (Figure 1) and only the more open areas were used by animals that were present. Bottom-up controls (vegetation structure, cover and food availability) can also play an equally important role in the presence of mammals. There may be feedbacks present between mammals and vegetation heterogeneity, for example, herbivores selecting open areas in order to reduce exposure to predation risk, which results in them maintaining these areas as open through their grazing and trampling effects (i.e. a positive feedback loop).
Factors that play an important role in controlling species richness on sodic areas specifically are biomass consumption, trampling or hoof action and other activities. To quantify these relationships will enhance the understanding of the mechanistics of herbivores as ecosystem drivers, and also of riparian areas at the bottom of a catena as refuges for biodiversity and as nutrient sinks (Jacobs & Naiman 2008). Localised patches known to have higher nutrient value (sub-canopy habitats, termite mounds and sodic patch), as well as permanent (waterholes) and ephemeral (mud wallows) water sources, were used by herbivores and can also explain their presence in the study area. This article aimed to provide a basic list of mammals present on the catena that might have a role in the functioning and interactions of this heterogeneous ecosystem. A general description was also provided of habitat and habitat features that determine the presence of mammals on the catena. There is scope for future studies on the Southern Granite Supersite to expand on this knowledge and information.
Conclusion
There is nothing obvious that can prohibit movement of animals through the study area, and considering the park has a large surface area catering for various species, the possibility is high that some mammal species, especially the smaller mammals, were not listed. Some species might be present for short periods, or during specific seasons, increasing the heterogeneity of the larger supersite even more than what was found. Furthermore, camera traps do not monitor the entire site, which will further contribute towards under-reporting or entirely missing lower density and transient species. This study at least provided a basic list of 31 mammal species present in the Southern Granite Supersite, and some measure of relative abundance. The more common species were found in almost all catenal zones; thus, the question about certain mammal species that might use specific zones more often could not be answered with this study. Distances between the different catenal zones were relatively short, which made it more difficult to differentiate between utilisation of zones separately. Large and small predators, as well as herbivores of all sizes, were present in the study area, while poor visibility in some areas might explain the absence or lower presence of mammals based on the landscape of fear principles and/or poor detectability. Small changes were also observed in activity periods of specific species between different years of surveys, probably in reaction to the drought.
Differences in species presence between seasons might be because of animals' migration, or localised movement patterns. The extreme drought has changed the vegetation structure and availability of food, which had a pronounced effect on the presence and movement of animals (e.g. hippo appearing at the site during the drought as it grazed further from perennial rivers), but this aspect was not studied specifically. Animals move to areas where their needs are best met, some will move locally in search of food or water, but others might be bound to strict territorial boundaries that restrict their movement to local areas. Future studies can focus on longer periods of data collection and exploring the possible differences in the presence of mammals between seasons. It would also be interesting to study any possible changes in the presence of mammal species in a normal rainfall year after the veld recovered from the impact of the severe 2015-2016 drought.
Acknowledgements
The following people and institutions are acknowledged: The UFS Strategic Research Fund, as well as the NRF Thuthuka Grant for funding the research; Martin Tinneveld for assistance with the checkerboard; Dr Izak Smit from SANParks for his time, guidance and valuable comments on this manuscript; the staff of SANParks Scientific Services for administrative arrangements; the game guards who kept us safe during field work; Dr Tascha Vos for her time, patience and effort with figure and table formatting; and Erneli Steyn for assistance with data processing and literature searches.
Competing interests
The authors declare that they have no financial or personal relationships that may have inappropriately influenced them in writing this article.
Authors' contributions
Both authors were co-responsible for experimental layout, camera trapping, data gathering, data processing and interpretation. B.B.J. was responsible for writing the majority of the article and creating the figures. J.G.B. processed the camera trap data and compiled the tables.
Funding information
The University of the Free State (UFS) Strategic Research Fund largely funded the multidisciplinary project as a whole, including this part of the study; and the National Research Foundation Thuthuka Grant also partially funded this research.
Data availability
Study data are available and may be provided, on request, by the corresponding author. Data from all research done within Kruger National Park is placed within the SANParks repository (not for free, open access).
Disclaimer
The views and opinions expressed in this article are the authors' own and do not necessarily reflect the official policy or position of the institution or funder.
References
Ben-Shahar, R. & Skinner, J.D., 1988, 'Habitat preferences of African ungulates derived by uni- and multivariate analyses', Ecology 69(5), 1479-1485. https://doi.org/10.2307/1941645 [ Links ]
Bissett, C. & Bernard, R.T.F., 2007, 'Habitat selection and feeding ecology of the cheetah (Acinonyx jubatus) in thicket vegetation: Is the cheetah a savanna specialist?', Journal of Zoology 271(3), 310-317. https://doi.org/10.1111/j.1469-7998.2006.00217.x [ Links ]
Bonyongo, C.M., 2005, 'Habitat utilization by impala (Aepyceros melampus) in the Okavango delta', Botswana Notes and Records 37, 227-235. [ Links ]
Bouwer, D., Le Roux, P.A.L. & Van Tol, J., 2020, 'Identification of hydropedological flowpaths in Stevenson-Hamilton catena from soil morphological, chemical and hydraulic properties', Koedoe 62(2), a1584. https://doi.org/10.4102/koedoe.v62i2.1584 [ Links ]
Davidson, Z., Valeix, M., Loveridge, A.J., Hunt, J.E., Johnson, P.J., Madzikanda, H., et al., 2012, 'Environmental determinants of habitat and kill site selection in a large carnivore: Scale matters', Journal of Mammalogy 93(3), 677-685. https://doi.org/10.1644/10-MAMM-A-424.1 [ Links ]
Du Toit, J.T., 2003, 'Large herbivores and savanna heterogeneity', in J.T. Du Toit, K.H. Rogers & H.C. Biggs (eds.), The Kruger experience: Ecology and management of savanna heterogeneity, pp. 292-309, Island Press, Washington, WA. [ Links ]
Gaylard, A., Owen-Smith, N. & Redfern, J., 2003, 'Surface water availability: Implications for heterogeneity and ecosystem processes', in J.T. Du Toit, K.H. Rogers & H.C. Biggs (eds.), The Kruger experience: Ecology and management of savanna heterogeneity, pp. 171-188, Island Press, Washington, WA. [ Links ]
Grant, C.C. & Scholes, M.C., 2006, 'The importance of nutrient hot-spots in the conservation and management of large wild mammalian herbivores in semi-arid savannas', Biological Conservation 130(3), 426-437. https://doi.org/10.1016/j.biocon.2006.01.004 [ Links ]
Grant, R.C.C., Peel, M.J.S., Bezuidenhout, H. & Grant, R., 2011, 'Evaluating herbivore management outcomes and associated vegetation impacts', Koedoe 53(2), 116-130. https://doi.org/10.4102/koedoe.v53i2.1008 [ Links ]
Hall, L.S., Krausman, P.R. & Morrison, M.L., 1997, 'The habitat concept and a plea for standard terminology', Wildlife Society Bulletin 25(1), 173-182. [ Links ]
Hansen, B.B., Herfindal, I., Aanes, R., Sæther, B.E. & Henriksen, S., 2009, 'Functional response in habitat selection and the tradeoffs between foraging niche components in a large herbivore', Oikos 118(6), 859-872. https://doi.org/10.1111/j.1600-0706.2009.17098.x [ Links ]
Jacobs, S.M. & Naiman, R.J., 2008, 'Large African herbivores decrease herbaceous plant biomass while increasing plant species richness in a semi-arid savanna toposequence', Journal of Arid Environments 72(6), 891-903. https://doi.org/10.1016/j.jaridenv.2007.11.015 [ Links ]
Janecke, B.B., 2020, 'Vegetation structure and spatial heterogeneity in the Granite Supersite, Kruger National Park', Koedoe 62(2), a1591. https://doi.org/10.4102/koedoe.v62i2.1591 [ Links ]
Janecke, B.B., 2011, 'A plant based study of the feeding ecology of introduced herbivore game species in the central Free State', PhD thesis, Department of Animal, Wildlife and Grassland Sciences, University of the Free State, Bloemfontein. [ Links ]
Janecke, B.B., Van Tol, J., Smit, I.P.J., Van Aardt, A.C., Riddell, E.S., Seaman, M.T. et al., 2020, 'Biotic and abiotic connections on a granitic catena: Framework for multidisciplinary research', Koedoe 62(2), a1600. https://doi.org/10.4102/koedoe.v62i2.1600 [ Links ]
Johnson, D.H., 1980, 'The comparison of usage and availability measurements for evaluating resource preference', Ecology 61(1), 65-71. https://doi.org/10.2307/1937156 [ Links ]
Joubert, S.C.J., 2016, 'Animal behaviour', in J.d.P. Bothma & J.T. Du Toit (eds.), Game ranch management, pp. 385-392, Van Schaik Publishers, Pretoria. [ Links ]
Khomo, L., Hartshorn, A.S., Rogers, K.H. & Chadwick, O.A., 2011, 'Impact of rainfall and topography on the distribution of clays and major cations in granitic catenas of southern Africa', CATENA 87(1), 119-128. https://doi.org/10.1016/j.catena.2011.05.017 [ Links ]
Khomo, L.M. & Rogers, K.H., 2005, 'Proposed mechanism for the origin of sodic patches in Kruger National Park, South Africa', African Journal of Ecology 43(1), 29-34. https://doi.org/10.1111/j.1365-2028.2004.00532.x [ Links ]
Krausman, P.R. & Morrison, M.L., 2016, 'Another plea for standard terminology: Editor's message', The Journal of Wildlife Management 80(7), 1143-1144. https://doi.org/10.1002/jwmg.21121 [ Links ]
Laundre, J.W., Hernandez, L. & Ripple, W.J., 2010, 'The landscape of fear: Ecological implications of being afraid', The Open Ecology Journal 3(3), 1-7. https://doi.org/10.2174/1874213001003030001 [ Links ]
Malherbe, J., Smit, I., Wessels, K. & Beukes, P., 2020, 'Recent droughts in the Kruger National Park as reflected in the extreme climate index', African Journal of Range and Forage Science, 37(1), 1-17. [ Links ]
Naiman, R.J. & Rogers, K.H., 1997, 'Large animals and system-level characteristics in river corridors', BioScience 47(8), 521-529. https://doi.org/10.2307/1313120 [ Links ]
Owen-Smith, R.N., 2002, Adaptive herbivore ecology - from resources to populations in variable environments, Cambridge University Press, Cambridge. [ Links ]
Pickett, S.T.A., Cadenasso, M.L. & Benning, T.L., 2003, 'Biotic and abiotic variability as key determinants of savanna heterogeneity at multiple spatiotemporal scales', in J.T. du Toit, K.H. Rogers & H.C. Biggs (eds.), The Kruger experience: Ecology and management of savanna heterogeneity, pp. 22-40, Island Press, Washington, WA. [ Links ]
Pieterse, M., 2018, 'The ecology of impala (Aepyceros melampus) in a dystrophic system: A case study from Welgevonden Game Reserve, Limpopo Province, South Africa', MSc dissertation, School of Natural Resource Management, Nelson Mandela Metropolitan University, George. [ Links ]
Riginos, C. & Grace, J.B., 2008, 'Savanna tree density, herbivores, and the herbaceous community: Bottom-up vs top-down effects', Ecology 89(8), 2228-2238. https://doi.org/10.1890/07-1250.1 [ Links ]
Seydack, A.H., Grant, C.C., Smit, I.P., Vermeulen, W.J., Baard, J. & Zambatis, N., 2012, 'Climate and vegetation in a semi-arid savanna: Development of a climate-vegetation response model linking plant metabolic performance to climate and the effects on forage availability for large herbivores', Koedoe 54(1), Art. #1046, 12 pages. http://dx.doi.org/10.4102/koedoe.v54i1.1046 [ Links ]
Smit, I.P.J., Riddell, E.S., Cullum, C. & Petersen, R., 2013, 'Kruger National Park research supersites: Establishing long-term research sites for cross-disciplinary, multiscaled learning', Koedoe 55(1), Art. #1107, 7 pages. http://dx.doi.org/10.4102/koedoe.v55i1.1107 [ Links ]
Staver, A.C., Wigley-Coetsee, C. & Botha, J., 2019, 'Grazer movements exacerbate grass declines during drought in an African savanna', Journal of Ecology 107(3), 1482-1491. https://doi.org/10.1111/1365-2745.13106 [ Links ]
Theron, E.J., Van Aardt, A.C. & Du Preez, P.J., 2020, 'Vegetation distribution along a granite catena, southern Kruger National Park', Koedoe 62(2), a1588. https://doi.org/10.4102/koedoe.v62i2.1588 [ Links ]
Treydte, A.C., Riginos, C. & Jeltsch, F., 2010, 'Enhanced use of beneath-canopy vegetation by grazing ungulates in African savannahs', Journal of Arid Environments 74(12), 1597-1603. https://doi.org/10.1016/j.jaridenv.2010.07.003 [ Links ]
Van Aardt, A.C., Codron, D., Theron, E. & Du Preez, P.J., 2020, 'Plant community structure and vegetation changes after drought on a granite catena in the Kruger National Park, South Africa', Koedoe 62(2), a1585. https://doi.org/10.4102/koedoe.v62i2.1585 [ Links ]
Weil, R.R. & Brady, N.C., 2016, The nature and properties of soils, 15th edn., Pearson Education Limited, Harlow. [ Links ]
Zambatis, N. & Biggs, H.C., 1995, 'Rainfall and temperatures during the 1991/92 drought in the Kruger National Park', Koedoe 38(1), 1-16. https://doi.org/10.4102/koedoe.v38i1.301 [ Links ]
 Correspondence:
Beanelri B. Janecke
janeckbb@ufs.ac.za
Received: 13 Sept. 2019
Accepted: 19 Apr. 2020
Published: 29 Oct. 2020

