


Services on Demand
Article
 English (pdf)
 Article in xml format
 Article references
Indicators

Related links
-
 Cited by Google
 -
 Similars in Google
Share

 Permalink
Koedoe
On-line version ISSN 2071-0771
Print version ISSN 0075-6458
Koedoe vol.62 n.2 Pretoria 2020
http://dx.doi.org/10.4102/koedoe.v62i2.1591
The author declares that she has no financial or personal relationships that may have inappropriately influenced her in writing this article.
Author's contributions
B.B.J. is the sole author of this research article.
Funding information
The University of the Free State Strategic Research Fund largely funded the multi-disciplinary project as a whole, including this part of the study, and the National Research Foundation Thuthuka Grant also partially funded this research.
Data availability statement
Data from all research done within Kruger National Park is placed within the SANParks repository (not for free, open access).
Disclaimer
The views and opinions expressed in this article are the author's own and do not necessarily reflect the official policy or position of the institution or funder.
References
Adjorlolo, C. & Mutanga, O., 2013, 'Integrating remote sensing and geostatistics to estimate woody vegetation in an African savanna', Journal of Spatial Science 58(2), 305-322. https://doi.org/10.1080/14498596.2013.815577 [ Links ]
Asner, G.P., Levick, S.R., Kennedy-Bowdoin, T., Knapp, D.E., Emerson, R., Jacobson, J., et al., 2009, 'Large-scale impacts of herbivores on the structural diversity of African savannas', Proceedings of the National Academy of Sciences 106(12), 4947-4952. https://doi.org/10.1073/pnas.0810637106 [ Links ]
Augustine, D.J., 2003, 'Spatial heterogeneity in the herbaceous layer of a semi-arid savanna ecosystem', Plant Ecology 167(2), 319-332. https://doi.org/10.1023/A:1023927512590 [ Links ]
Bailey, C.L. & Scholes, M.C., 1997, 'Comparative patterns of sodium accumulation in leaves of selected savanna species growing on sodic and nonsodic soils', South African Journal of Plant and Soil 14(3), 103-106. https://doi.org/10.1080/02571862.1997.10635090 [ Links ]
Belsky, A.J., 1994, 'Influences of trees on savanna productivity: Tests of shade, nutrients, and tree-grass competition', Ecology 75(4), 922-932. https://doi.org/10.2307/1939416 [ Links ]
Blozan, W., 2006, 'Tree measuring guidelines of the eastern native tree society', Bulletin of the Eastern Native Tree Society 1(1), 1-8. [ Links ]
Bond, W.J., 2008, 'What limits trees in C4 grasslands and savannas?', Annual Review of Ecology, Evolution and Systematics 39(1), 641-659. https://doi.org/10.1146/annurev.ecolsys.39.110707.173411 [ Links ]
Bouwer, D., Le Roux, P.A.L. & Van Tol, J.J., 2020, 'Identification of hydropedological flowpaths in Stevenson-Hamilton catena from soil morphological, chemical and hydraulic properties', Koedoe 62(2), a1584. https://doi.org/10.4102/koedoe.v62i2.1584 [ Links ]
Buitenwerf, R., Swemmer, A.M. & Peel, M.J.S., 2011, 'Long-term dynamics of herbaceous vegetation structure and composition in two African savanna reserves: Effects of rainfall on herbaceous vegetation', Journal of Applied Ecology 48(1), 238-246. https://doi.org/10.1111/j.1365-2664.2010.01895.x [ Links ]
Colgan, M.S., Asner, G.P., Levick, S.R., Martin, R.E. & Chadwick, O.A., 2012, 'Topo-edaphic controls over woody plant biomass in South African savannas', Biogeosciences 9(5), 1809-1821. https://doi.org/10.5194/bg-9-1809-2012 [ Links ]
Davidson, Z., Valeix, M., Loveridge, A.J., Hunt, J.E., Johnson, P.J., Madzikanda, H. et al., 2012, 'Environmental determinants of habitat and kill site selection in a large carnivore: Scale matters', Journal of Mammalogy 93(3), 677-685. https://doi.org/10.1644/10-MAMM-A-424.1 [ Links ]
Druce, D.J., Shannon, G., Page, B.R., Grant, R. & Slotow, R., 2008, 'Ecological thresholds in the savanna landscape: Developing a protocol for monitoring the change in composition and utilisation of large trees', PLoS One 3(12), 1-12. e3979. https://doi.org/10.1371/journal.pone.0003979 [ Links ]
Du Toit, J.T., 2003, 'Large herbivores and savanna heterogeneity', in J.T. Du Toit, K.H. Rogers & H.C. Biggs (eds.), The Kruger experience: Ecology and management of savanna heterogeneity, pp. 292-309, Island Press, Washington, WA. [ Links ]
Dye, P.J. & Walker, B.H., 1980, 'Vegetation-environment relations on sodic soils of Zimbabwe Rhodesia', The Journal of Ecology 68(2), 589-602. https://doi.org/10.2307/2259424 [ Links ]
Eckhardt, H.C., Wilgen, B.W. & Biggs, H.C., 2000, 'Trends in woody vegetation cover in the Kruger National Park, South Africa, between 1940 and 1998', African Journal of Ecology 38(2), 108-115. https://doi.org/10.1046/j.1365-2028.2000.00217.x [ Links ]
Emmet, M. & Pattrick, S., 2012, Game Ranger in your backpack: All-in-one interpretative guide to the lowveld, Briza Publications, Pretoria. [ Links ]
Evans, R.A. & Love, R.M., 1957, 'The step-point method of sampling: A practical tool in range research', Journal of Range Management 10(5), 208-212. https://doi.org/10.2307/3894015 [ Links ]
Gillson, L. & Duffin, K.I., 2007, 'Thresholds of potential concern as benchmarks in the management of African savannahs', Philosophical Transactions of the Royal Society B: Biological Sciences 362(1478), 309-319. https://doi.org/10.1098/rstb.2006.1988 [ Links ]
Gordijn, P.J., Rice, E. & Ward, D., 2012, 'The effects of fire on woody plant encroachment are exacerbated by succession of trees of decreased palatability', Perspectives in Plant Ecology, Evolution and Systematics 14(6), 411-422. https://doi.org/10.1016/j.ppees.2012.09.005 [ Links ]
Grant, C.C. & Scholes, M.C., 2006, 'The importance of nutrient hot-spots in the conservation and management of large wild mammalian herbivores in semi-arid savannas', Biological Conservation 130(3), 426-437. https://doi.org/10.1016/j.biocon.2006.01.004 [ Links ]
Grant, R.C.C., Peel, M.J.S., Bezuidenhout, H. & Grant, R., 2011, 'Evaluating herbivore management outcomes and associated vegetation impacts', Koedoe 53(2), 116-130. https://doi.org/10.4102/koedoe.v53i2.1008 [ Links ]
Holdo, R.M., 2007, 'Elephants, fire, and frost can determine community structure and composition in Kalahari Woodlands', Ecological Applications 17(2), 558-568. https://doi.org/10.1890/05-1990 [ Links ]
Jacobs, S.M. & Naiman, R.J., 2008, 'Large African herbivores decrease herbaceous plant biomass while increasing plant species richness in a semi-arid savanna toposequence', Journal of Arid Environments 72(6), 891-903. https://doi.org/10.1016/j.jaridenv.2007.11.015 [ Links ]
Janecke, B.B. & Bolton, J.G., 2020, 'Variation in mammal habitat and diversity affect heterogeneity and processes of granite catena', Koedoe 62(2), a1592. https://doi.org/10.4102/koedoe.v62i2.1592 [ Links ]
Janecke, B.B. & Smit, G.N., 2011, 'Phenology of woody plants in riverine thicket and its impact on browse availability to game species', African Journal of Range & Forage Science 28(3), 139-148. https://doi.org/10.2989/10220119.2011.642075 [ Links ]
Janecke, B.B., Van Tol, J.J., Smit, I.P.J., Van Aardt, A.C., Riddell, E., Seaman, M.T. et al., 2020, 'Biotic and abiotic connections on a granitic catena: Framework for multidisciplinary research', Koedoe 62(2), a1600. https://doi.org/10.4102/koedoe.v62i2.1600 [ Links ]
Jennings, S., Brown, N.D. & Sheil, D., 1999, 'Assessing forest canopies and understorey illumination: Canopy closure, canopy cover and other measures', Forestry 72(1), 59-74. https://doi.org/10.1093/forestry/72.1.59 [ Links ]
Joubert, S.C.J., 2016, 'Animal behaviour', in J. du P. Bothma & J.T. Du Toit (eds.), Game ranch management, pp. 385-392, Van Schaik Publishers, Pretoria. [ Links ]
Khan, S.U., Khan, I., Zhao, M., Khan, A.A. & Ali, M.A.S., 2019, 'Valuation of ecosystem services using choice experiment with preference heterogeneity: A benefit transfer analysis across inland river basin', Science of the Total Environment 679, 126-135. https://doi.org/10.1016/j.scitotenv.2019.05.049 [ Links ]
Khomo, L., Hartshorn, A.S., Rogers, K.H. & Chadwick, O.A., 2011, 'Impact of rainfall and topography on the distribution of clays and major cations in granitic catenas of southern Africa', Catena 87(1), 119-128. https://doi.org/10.1016/j.catena.2011.05.017 [ Links ]
Khomo, L.M. & Rogers, K.H., 2005, 'Proposed mechanism for the origin of sodic patches in Kruger National Park, South Africa', African Journal of Ecology 43(1), 29-34. https://doi.org/10.1111/j.1365-2028.2004.00532.x [ Links ]
Leckie, D., Gougeon, F., Hill, D., Quinn, R., Armstrong, L. & Shreenan, R., 2003, 'Combined high-density LIDAR and multispectral imagery for individual tree crown analysis', Canadian Journal of Remote Sensing 29(5), 633-649. https://doi.org/10.5589/m03-024 [ Links ]
Leverett, B. & Bertolette, D., n.d., Champion trees measuring guidelines handbook, viewed 28 November 2018, from https://www.americanforests.org/wp-content/uploads/2014/12/AF-Tree-Measuring-Guidelines_LR.pdf. [ Links ]
Lévesque, J. & King, D.J., 2003, 'Spatial analysis of radiometric fractions from high-resolution multispectral imagery for modelling individual tree crown and forest canopy structure and health', Remote Sensing of Environment 84(4), 589-602. https://doi.org/10.1016/S0034-4257(02)00182-7 [ Links ]
Levick, S.R. & Asner, G.P., 2013, 'The rate and spatial pattern of treefall in a savanna landscape', Biological Conservation 157, 121-127. https://doi.org/10.1016/j.biocon.2012.07.009 [ Links ]
Ludwig, J.A., Tongway, D.J., Eager, R.W., Williams, R.J. & Cook, G.D., 1999, 'Fine-scale vegetation patches decline in size and cover with increasing rainfall in Australian savannas', Landscape Ecology 14(6), 557-566. https://doi.org/10.1023/A:1008112122193 [ Links ]
McNaughton, S.J., 1983, 'Serengeti grassland ecology: The role of composite environmental factors and contingency in community organization', Ecological Monographs 53(3), 291-320. https://doi.org/10.2307/1942533 [ Links ]
Murwira, A. & Skidmore, A.K., 2006, 'Monitoring change in the spatial heterogeneity of vegetation cover in an African savanna', International Journal of Remote Sensing 27(11), 2255-2269. https://doi.org/10.1080/01431160500396683 [ Links ]
Naiman, R.J. & Rogers, K.H., 1997, 'Large animals and system-level characteristics in river corridors', BioScience 47(8), 521-529. https://doi.org/10.2307/1313120 [ Links ]
O'Connor, T.G., 1998, 'Impact of sustained drought on a semi-arid Colophospermum mopane savanna', African Journal of Range & Forage Science 15(3), 83-91. https://doi.org/10.1080/10220119.1998.9647948 [ Links ]
Owensby, C.E., 1973, 'Modified step-point system for botanical composition and basal cover estimates', Journal of Range Management 26(4), 302-303. https://doi.org/10.2307/3896585 [ Links ]
Peel, M.J.S., Kruger, J.M. & Zacharias, P.J.K., 2005, 'Environmental and management determinants of vegetation state on protected areas in the eastern Lowveld of South Africa', African Journal of Ecology 43(4), 352-361. https://doi.org/10.1111/j.1365-2028.2005.00590.x [ Links ]
Pickett, S.T.A., Cadenasso, M.L. & Benning, T.L., 2003, 'Biotic and abiotic variability as key determinants of savanna heterogeneity at multiple spatiotemporal scales', in J.T. Du Toit, K.H. Rogers & H.C. Biggs (eds.), The Kruger experience: Ecology and management of savanna heterogeneity, pp. 22-40, Island Press, Washington, WA. [ Links ]
Riddell, E.S., Nel, J.M., Van Tol, J.J., Fundisi, D., Jumbi, F., Van Niekerk, A. et al., 2020, 'Groundwater-surface water interactions in an ephemeral savanna catchment, Kruger National Park', Koedoe 62(2), a1583. https://doi.org/10.4102/koedoe.v62i2.1583 [ Links ]
Riginos, C., Grace, J.B., Augustine, D.J. & Young, T.P., 2009, 'Local versus landscape-scale effects of savanna trees on grasses', Journal of Ecology 97(6), 1337-1345. https://doi.org/10.1111/j.1365-2745.2009.01563.x [ Links ]
Roodt, V., 2015, Grasses and grazers of Botswana and the surrounding savanna, Struik Nature Publishers, Cape Town. [ Links ]
Sankaran, M., Hanan, N.P., Scholes, R.J., Ratnam, J., Augustine, D.J., Cade, B.S. et al., 2005, 'Determinants of woody cover in African savannas', Nature 438(7069), 846-849. https://doi.org/10.1038/nature04070 [ Links ]
Sankaran, M., Ratnam, J. & Hanan, N., 2008, 'Woody cover in African savannas: The role of resources, fire and herbivory', Global Ecology and Biogeography 17(2), 236-245. https://doi.org/10.1111/j.1466-8238.2007.00360.x [ Links ]
Sankaran, M., Ratnam, J. & Hanan, N.P., 2004, 'Tree-grass coexistence in savannas revisited - insights from an examination of assumptions and mechanisms invoked in existing models', Ecology Letters 7(6), 480-490. https://doi.org/10.1111/j.1461-0248.2004.00596.x [ Links ]
Scholes, R. & Walker, B.H., 1993, An African savanna: Synthesis of the Nylsvley study, Cambridge University Press, Cambridge, NY. [ Links ]
Shannon, G., Druce, D.J., Page, B.R., Eckhardt, H.C., Grant, R. & Slotow, R., 2008, 'The utilization of large savanna trees by elephant in southern Kruger National Park', Journal of Tropical Ecology 24(3), 281-289. https://doi.org/10.4102/koedoe.v50i1.138 [ Links ]
Siebert, F. & Eckhardt, H.C., 2008, 'The vegetation and floristics of the Nkhuhlu exclosures, Kruger National Park', Koedoe, 50(1), 126-144. https://doi.org/10.4102/koedoe.v50i1.138 [ Links ]
Smit, G.N. & Swart, J.S., 1994, 'The influence of leguminous and non-leguminous woody plants on the herbaceous layer and soil under varying competition regimes in mixed bushveld', African Journal of Range and Forage Science 11(1), 27-33. https://doi.org/10.1080/10220119.1994.9638350 [ Links ]
Smit, I.P.J., 2020, 'Integrating multi-scaled and multi-disciplinary studies: A critical reflection on the Kruger National Park Research Supersites', Koedoe 62(2), a1586. https://doi.org/10.4102/koedoe.v62i2.1586 [ Links ]
Smit, I.P.J., Riddell, E.S., Cullum, C. & Petersen, R., 2013, 'Kruger National Park research supersites: Establishing long-term research sites for cross-disciplinary, multiscaled learning', Koedoe 55(1), Art. #1107, 7 pages. https://doi.org/10.4102/koedoe.v55i1.1107 [ Links ]
Smit, N., 2014, 'BECVOL 3: An expansion of the aboveground biomass quantification model for trees and shrubs to include the wood component', African Journal of Range & Forage Science 31(2), 179-186. https://doi.org/10.2989/10220119.2013.866161 [ Links ]
Stangroom, J., 2019, 'Different statistical calculators, social science statistics', viewed 05 December 2019, from https://www.socscistatistics.com/tests/pearson/default.aspx. [ Links ]
Theron, E.J., Van Aardt, A.C. & Du Preez, P.J., 2020, 'Vegetation distribution along a granite catena, southern Kruger National Park', Koedoe 62(2), a1588. https://doi.org/10.4102/koedoe.v62i2.1588 [ Links ]
Treydte, A.C., Heitkönig, I.M.A., Prins, H.H.T. & Ludwig, F., 2007, 'Trees improve grass quality for herbivores in African savannas', Perspectives in Plant Ecology, Evolution and Systematics 8(4), 197-205. https://doi.org/10.1016/j.ppees.2007.03.001 [ Links ]
Treydte, A.C., Riginos, C. & Jeltsch, F., 2010, 'Enhanced use of beneath-canopy vegetation by grazing ungulates in African savannahs', Journal of Arid Environments 74(12), 1597-1603. https://doi.org/10.1016/j.jaridenv.2010.07.003 [ Links ]
Treydte, A.C., Van Der Beek, J.G.M., Perdok, A.A. & Van Wieren, S.E., 2011, 'Grazing ungulates select for grasses growing beneath trees in African savannas', Mammalian Biology 76(3), 345-350. https://doi.org/10.1016/j.mambio.2010.09.003 [ Links ]
Turner, M.G., 1989, 'Landscape ecology: The effect of pattern on process', Annual Review of Ecological Systems 20, 171-197. https://doi.org/10.1146/annurev.es.20.110189.001131 [ Links ]
Van Aardt, A.C., Codron, D., Theron, E.J. & Du Preez, P.J., 2020, 'Plant community structure and possible vegetation changes after drought on a granite catena in the Kruger National Park, South Africa', Koedoe 62(2), a1585. https://doi.org/10.4102/koedoe.v62i2.1585 [ Links ]
Van Coller, H., Siebert, F. & Siebert, S.J., 2013, 'Herbaceous species diversity patterns across various treatments of herbivory and fire along the sodic zone of the Nkuhlu exclosures, Kruger National Park', Koedoe 55(1), 1ߝ6. https://doi.org/10.4102/koedoe.v55i1.1112 [ Links ]
Van Oudtshoorn, F., 2012, Guide to grasses of Southern Africa, 3rd edn., Briza Publications, Pretoria. [ Links ]
Venter, F.J., Scholes, R.J. & Eckhardt, H.C., 2003, 'The abiotic template and its associated vegetation pattern', in J. Du Toit, H. Biggs & K.H. Rogers (eds.), The Kruger experience: Ecology and management of savanna heterogeneity, pp. 83-129, Island Press, London. [ Links ]
Wang, J.F., Zhang, T.L. & Fu, B.J., 2016, 'A measure of spatial stratified heterogeneity', Ecological Indicators 67, 250-256. https://doi.org/10.1016/j.ecolind.2016.02.052 [ Links ]
Weil, R.R. & Brady, N.C., 2016, The nature and properties of soils, 15th edn., Pearson Education Limited, Harlow. [ Links ]
Whyte, I.J., Van Aarde, R. & Pimm, S.L., 2003, 'Kruger's elephant population: Its size and consequences for ecosystem heterogeneity', in J.T. Du Toit, K.H. Rogers & H.C. Biggs (eds.), The Kruger experience: Ecology and management of savanna heterogeneity, pp. 332-348, Island Press, Washington, WA. [ Links ]
 Correspondence:
Beanelri B. Janecke
janeckbb@ufs.ac.za
Received: 11 Sept. 2019
Accepted: 19 Apr. 2020
Published: 10 Sept. 2020
REVIEW ARTICLE
Plant community structure and possible vegetation changes after drought on a granite catena in the Kruger National Park, South Africa
Andri C. van AardtI; Daryl CodronII; Ettienne J. TheronI; Pieter J. du PreezI, †
IDepartment of Plant Sciences, Faculty of Natural and Agricultural Sciences, University of the Free State, Bloemfontein, South Africa
IIDepartment of Zoology and Entomology, Faculty of Natural and Agricultural Sciences, University of the Free State, Bloemfontein, South Africa
ABSTRACT
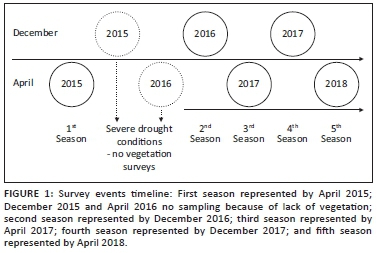
A preliminary study investigated the associations between vegetation communities along catenary soil gradients in 2015. The severe drought of 2016 in South Africa presented the opportunity to study post-drought savanna vegetation changes. This hillslope transect was surveyed for five successive seasons. The Braun-Blanquet method was used, and the data were analysed by means of the TWINSPAN algorithm, which resulted in the classification of different communities on the crest, sodic site and riparian area. Change in herbaceous and grassy vegetation composition and diversity in the transect is compared between rainfall years, wet and dry seasons, and three different zones (crest, sodic site and riparian areas). Spatial and temporal autocorrelation of the woody component shifted the focus to variance within the graminoid and herbaceous layers. Clear vegetation changes were observed on the crest and the sodic sites, whereas changes in the riparian area were less obvious. In all three habitats, species richness decreased after the drought and did not reach pre-drought levels even after two years. However, plant species diversity was maintained as climax species were replaced by pioneer and sub-climax species. These changes in community structure, which had reverted to systems dominated by climax species by the end of the sampling period, might be an indication of the savanna ecosystem's resilience to drought conditions.
CONSERVATION IMPLICATIONS: Although clear vegetation changes were observed in the five successive seasons after the drought, this study showed that the savanna ecosystem is relatively resistant to drought and that human intervention is not needed
Keywords: Drought; Vegetation classification; Savanna; Diversity; Catena.
Introduction
The Earth's environment is dominated by three great natural components, namely, climate, vegetation and soil. Climate is considered the most important factor influencing the distribution and composition of vegetation on a micro and sub-continental scale (Campbell et al. 2008; Furley 2010; Scholes 1997; Schulze 1997). Vegetation development is controlled largely by light, temperature and moisture (Bond, Midgley & Woorward 2003; Schulze 1997). Topography and the chemical and physical compositions of the soil also influence vegetation and, in conjunction with climate, are responsible for the intricate interactions that govern the worldwide distribution of vegetation (Campbell et al. 2008; Furley 2010; Scholes 1997). Understanding how these interactions regulate the ecology of plant communities is critical for characterising the impacts of global change on biodiversity at local and regional scales.
The savanna biome is unique because it consists of both woody vegetation and a grass layer. Climate and other regulating factors likely affect these two components differently, resulting in spatio-temporal heterogeneity of tree:grass compositions. Severe droughts, for example, may remove trees, leading to negative effects on woody plant diversity (Swemmer 2016; Walker et al. 1987; Zambatis & Biggs 1995). By reducing tree densities, droughts in savanna provide opportunities for drought-adapted flora to thrive, for instance, by promoting seedling recruitment of fast-growing, palatable shrub species and the re-establishment of a grassy layer (Swemmer et al. 2018; Vetter 2009). In this way, drought can help maintain the balance between trees and grasses (Swemmer 2016). Grasses, on the other hand, can take decades to recover their productive potential or might recover comfortably before the next drought (Swemmer et al. 2018). The herbaceous layer thus also regularly experiences negative responses to drought (Zambatis & Biggs 1995); however, Abbas, Bond and Midgley (2019) indicated that grasses can resprout vigorously after the onset of rainfall events. In fact, this layer usually responds to droughts and other climate changes first, primarily because of the shallow depth of root penetration. Upper soil layers are more susceptible to desiccation than the deeper strata penetrated by many woody plants. Furthermore, the extensive root structures of trees increase their access to subterranean reserves of ground water. Shorter term responses of grassy and herbaceous vegetation were highlighted by Buitenwerf, Swemmer and Peel (2011), who showed that dynamics of this savanna component are mainly controlled by interannual changes in rainfall. The response of the grass layer to climate is of importance for conservation planning and application, because it is an important food source for grazer populations (Staver, Wigley-Coetzee & Botha 2018).
The savanna regions of South Africa are considered semi-arid, receiving rainfall mostly during the summer months between October and April (Walker et al. 1987). Fluctuations in annual rainfall, including droughts, are a regular and recurrent feature of the climate (Rouault & Richard 2003). In more than half of the 80 summer rainfall districts identified by Rouault and Richard (2003), droughts were recorded during 1926, 1933, 1945, 1949, 1952 1970, 1983 and 1992 (Fauchereau et al. 2003; Rouault & Richard 2003; Gommes & Petrassi 1996). Rouault and Richard (2003) and Staver et al. (2018) indicated that the 1982-1983 drought was the worst drought recorded since 1922; however, Swemmer (2016) indicated that the drought of 2015-2016 was the worst drought that the Lowveld experienced in the past 33 years. In the savanna areas of KwaZulu-Natal, this drought was shown to be the worst in 50 years by Abbas et al. (2019). Research by Hu and Fedorov (2019) indicated that the drought of 2015-2016 was worse than the droughts of 1982 and 1997. These studies show that, since the 1960s, drought is more often associated with El Niño events; notably, however, annual rainfall during wet years has also increased since the 1970s.
South African savannas experienced drought conditions during the rainfall seasons of 2014-2015 and 2015-2016. In the Kruger National Park (KNP), and the surrounding areas of the Lowveld, below average rainfall occurred at annual (255 mm) and monthly scales (Swemmer 2016). This resulted in devastating effects on vegetation, animal and human welfare in certain areas. These years were also marked by unusually high temperatures, resulting in higher evaporation rates, further reducing water availability (Swemmer 2016). The severity of these conditions provided us with the opportunity to study their effects on short-term responses of vegetation, specifically on the grassy and herbaceous component. We conducted a study of seasonal and annual plant community dynamics along a granitic catenal gradient. This catena forms part of a research supersite, where long-term research is needed to establish baselines for monitoring and understanding ecological change (Smit et al. 2013). We describe taxonomic community changes, as well as testing for shifts in diversity, over two wet and two dry seasons through the drought period and compare these with pre-drought conditions (April 2015) described elsewhere (Theron, Van Aardt & Du Preez 2020). We focused only on the herbaceous and grassy components of the vegetation because we were interested in resolving short-term responses in savanna plant resilience to drought.
Study area
The study site is in the southern parts of KNP south of Skukuza (see study area figure in Theron et al. 2020) at 25.111ºS and 31.579ºE. Kruger National Park falls within the arid 'BSh' (hot semi-arid climate) climate type according to the Köppen-Geiger classification system (Venter, Scholes & Eckhardt 2003). 'BSh' is one of the four climate types within this category. The main features of 'BSh' climate are distinct seasonal rainfall and temperature variations. Mean annual precipitation in KNP is generally in the range of 650 mm annually (Smit et al. 2013). On a local scale, MAP of the Granite Lowveld varies between 450 and 900 mm along the eastern plains and the western escarpment, respectively (eds. Mucina & Rutherford 2006). However, the average annual total rainfall as recorded at the Skukuza Meteorological Station is 553 mm (Zambatis 2006). The mean annual temperature in the vicinity of the study area varies between 21ºC and 22ºC (Khomo et al. 2011; Scholes, Bond & Eckhardt 2003). This area experiences an insignificant seasonal and diurnal temperature variation with extreme periods of inundation and aridity (Kruger, Makamo & Shongwe 2002). The study site is underlain by the Nelspruit Suite geological formation and consists of granite and gneiss mostly occurring in the eastern parts of KNP (Alard 2009; Smit et al. 2013; Van Zijl & Le Roux 2014). Granite gneiss is widespread in the eastern regions of KNP and results in shallow, nutrient-poor soils that vary from grey to red to brown in colour (Venter 1990). Descriptions of the different soil forms found along the catena at the site were provided in Figure 2 within the article by Theron et al. (2020). The vegetation type at the study site is mostly Granite Lowveld (SVI3), characterised by a ground layer of tall grasses with intermittent trees and other woody species (eds. Mucina & Rutherford 2006).
Methods
Data collection
The same hillslope transect was surveyed for five seasons; the first survey was conducted prior to the onset of severe drought conditions (Theron et al. 2020) during December 2015 and April 2016 (Figure 1). The second and fourth surveys represent the start of the rainy summer season, while the third and fifth surveys reflect the end thereof (Figure 1). Relevés of 10 m2 were aligned along a 500 m transect. Cover abundance was recorded per species according to the modified Braun-Blanquet scale (Kent 2012; Kent & Coker 1992; Van der Maarel & Franklin 2013; Theron et al. 2020).
Classification, richness and diversity analysis
The analysis done by Theron et al. (2020) indicated that the catenal vegetation communities can be divided into crest, sodic site and riparian areas. Each of these habitat types contains different plant communities that are bound by different soil forms. Thus, the analysis of data for the seasons after the drought (December 2016-April 2018) was guided by these differentiations. Each topographical unit was thus analysed separately to look at the vegetation composition or change over the period of December 2016-April 2018. During this study, December samples were regarded as wet seasons, and April samples were regarded as dry seasons, irrespective of the delayed effect, because most summer rainfall usually occurred during December.
Classification
VegCap (unpublished database tool designed by N. Collins) was used to capture vegetation data into a macro-enabled Excel spreadsheet. From there, the data were imported into JUICE© (Tichý & Holt 2006) where a Modified TWINSPAN Classification (Roleček et al. 2009) analysis was carried out. Parameters for this analysis included the following: pseudo-species cut level (5); analysis was constrained to a minimum group size of 3-54 clusters; and division reached an endpoint if dissimilarity went lower than 0.3 based on average Sorensen dissimilarity. The resulting clusters were then arranged within both JUICE© and Excel to form the final vegetation communities. Although all the species were recorded during the field surveys, woody species were removed from the data in order to look at the change in graminoids and herbaceous species after the drought. This follows, for example, Rouault and Richard (2003), who indicated that trees and other vegetation with extensive root structures have access to subterranean reserves of groundwater and will thus not be immediately affected by the drought. The naming of communities and sub-communities was carried out according to the guidelines presented in Brown et al. (2013). In order to obtain diagnostic, constant and dominant species, we made use of the Analysis of Columns of a Synoptic Table in JUICE. The frequency thresholds were set at 75, 60 and 50 for the respective diagnostic, constant and dominant species. An asterisk indicates alien invasive species.
Diversity and richness
In addition to descriptions of community composition and how this changed over time, we evaluated changes in diversity and compared these across time for each of the three communities. We compared changes in species richness as well as changes in alpha-diversity. We used the Chao estimator as an indicator of species richness, as this index accounts for the occurrences of singletons and doubletons, and the Shannon index was used to quantify alpha-diversity. For each sample (i.e. per season and per habitat), ordinal abundance data as scored by the Braun-Blanquet system were converted to abundance cover data, rounded to integer values, following Van der Maarel (2007): r = 1; + = 2; 1 = 3; 2a = 8; 2b = 18; 3 = 38; 4 = 63; 5 = 88. Diversity estimates were computed using the iNext package (Hsieh, Ma & Chao 2016) for R (R Core Team 2015). The iNext function was used for extrapolation and prediction of diversity indices based on rarefaction procedures, with the expected means and standard errors extrapolated from the asymptotes of the fitted accumulation curves (see Figure 2). In all cases, accumulation curves approached or reached an asymptote, and observed data represented between 80 and 100% of extrapolated estimates (in the case of species richness), and between 94% and 100% of extrapolated estimates (for Shannon diversity), depending on the sample. Thus, sampling effort is considered sufficient for reliable estimations of diversity in these communities.
Ethical considerations
Ethical approval was obtained from the Interfaculty Animal Ethics Committee of the University of the Free State (UFS-AED2019/0121).
Results and discussion
Classification
Different plant communities were classified for each topographical unit as defined by Theron et al. (2020). In this article, the data for 2015 were not included in the classification in order to prevent a repetition of information.
Crest communities (December 2016- April 2018)
These communities located on the crest zone and upslope beyond the sodic site occur on the Clovelly, Pinedene, Fernwood, Estcourt, Mispha and Sterkspruit soil forms (Theron et al. 2020). The soil depth varies from 533 to 620 mm deep, with an average pHH₂O of 5.95-6.08. Soil texture is mostly loamy sand to coarse loamy sand (Theron et al. 2020). Vegetation classification resulted in three communities and two sub-communities that perfectly align with the different sampling seasons, showing a clear change in vegetation composition since the onset of the rainy season in December 2016 (Online Appendix 1). Although there are only three communities, the sub-communities of community 3 distinguish between season 4 (S4) (December 2017) and season 5 (S5) (April 2018), although their composition was very similar. The vegetation of the crest communities can be compared to community 3 (Vachellia excuvialis-Pogonarthria squarrosa) from Theron et al. (2020). As indicated in the 'Materials and methods' section, data on the woody species were removed as it obscured the focus of this study:
1. Heliotropium ciliatum-Cleome monophylla Community
2. Zornia glochidiata-Crotalaria sphaerocarpa subsp. sphaerocarpa Community
3. Aristida congesta subsp. barbicollis-Bulbostylis *barbata Community
3.1. Aristida congesta subsp. barbicollis-Bulbostylis *barbata-Melhania acuminata Sub-community
3.2. Aristida congesta subsp. barbicollis-Bulbostylis *barbata-Schmidtia pappophoroides Sub-community
Crest community descriptions:
1. Heliotropium ciliatum - Cleome monophylla Community
Diagnostic species: Cleome monophylla 84.3, Heliotropium ciliatum 93.4
Constant species: Bare soil 77, Bulbostylis hispidula 77, Chlorophytum recurvifolium 62, Cleome monophylla 92, Dipcadi papillatum 62, Heliotropium ciliatum 100, Kyllinga alba 85, Phyllanthus maderaspatensis 62, Tragus berteronianus 77, Urochloa mosambicensis 85
Dominant species: None
This community mostly represents vegetation sampled during the December 2016 (S2) season. Species from Species Group A (Online Appendix 1) define this community. These species are mostly absent or occur with very low cover-abundance values in the other communities. From a growth-form perspective, it is notable that this community contains the most geophytic plants. There is also a strong presence of species from Species Group B and Species Group I and the 'pseudo-species' indicated as bare soil (Species Group J):
2. Zornia glochidiata-Crotalaria sphaerocarpa subsp. sphaerocarpa Community
Diagnostic species: Crotalaria sphaerocarpa s. sphaerocarpa 82.3, Zornia glochidiata 84.8
Constant species: Aristida congesta s. congesta 79, Crotalaria sphaerocarpa s. sphaerocarpa 74, Eragrostis superba 63, Pogonarthria squarrosa 95, Setaria sphacelata v. sericea 63, Tricholaena monachne 68, Vernonia fastigiata 79, Zornia glochidiata 89
Dominant species: None
Vegetation found in this community represents the sampling during April 2017, which is mostly dominated by species from Species Group C (Online Appendix 1). Again, the species found here do not occur in other communities. Notable is the high cover abundance of species found in this community when compared to that of community 1. Furthermore, species from Species Group B are shared between community 1 and community 2; however, Aristida congesta subsp. congesta occur with much higher cover abundance in community 2 than in community 3. A possible explanation for that might be the increase in rainfall after the severe drought experienced in 2015-2016. From Species Group H, it is also clear that the grasses Eragrostis cylindriflora, Aristida adscensionis and Melinis repens start to establish with average cover-abundance values:
3. Aristida congesta subsp. barbicollis-Bulbostylis *barbata Community
Diagnostic species: Aristida congesta s. barbicollis 77.1, Bulbostylis barbata 79.4
Constant species: Aristida congesta s. barbicollis 75, Bare soil 81, Bulbostylis barbata 78, Schmidtia pappophoroides 66
Dominant species: None
This community represents sampling seasons 4 and 5 (December 2017 and April 2018), which is more or less one year after rainfall occurred that terminated the 2015-2016 drought. Species from Species Group F distinguishes this community from the other communities. Plants from Species Group H also started to occur in more relevés during these seasons, which might indicate that the veld was starting to improve after the drought conditions:
3.1. Aristida congesta subsp. barbicollis-Bulbostylis *barbata-Melhania acuminata Sub-community
Diagnostic species: Melhania acuminata 79.4, Panicum coloratum 78.5
Constant species: Aristida congesta s. barbicollis 94, Bare soil 100, Bulbostylis barbata 81, Eragrostis cylindriflora 69, Hibiscus micranthus v. micranthus 62, Melhania acuminata 88, Panicum coloratum 75, Panicum maximum 69, Perotis patens 88, Pogonarthria squarrosa 94, Tricholaena monachne 75
Dominant species: None
Sub-community 3.1 mostly represents vegetation sampled during April 2018 (S5). This sub-community is distinguished by the presence of species from Species Group E, which are either absent from other communities or occur with very low cover-abundance values. When looking at Species Group D, it is clear that the graminoids (Pogonarthria squarrosa, Tricholaena monachne, Eragrostis superba and Digitaria eriantha) mostly occur during the December sampling seasons (S3 and S5). Although these grasses do occur in other communities, it is with very low cover abundance:
3.2. Aristida congesta subsp. barbicollis-Bulbostylis *barbata-Schmidtia pappophoroides Sub-community
Diagnostic species: None
Constant species: Aristida adscensionis 62, Bare soil 62, Bulbostylis barbata 75, Schmidtia pappophoroides 75, Urochloa panicoides 62
Dominant species: None
This sub-community represents crest vegetation during April 2017 (S4). Species Group G distinguishes this sub-community from the Aristida congesta subsp. barbicollis-Bulbostylis *barbata-Melhania acuminate sub-community 3.1. Furthermore, the absence of species from Species Group E is also very prominent in this sub-community. However, from Species Group F it is clear that the cover-abundance values of Aristida congesta subsp. barbicollis and Panicum maximum decreased from sub-community 3.1 to 3.2. A possible explanation might be that during December 2017 (S4; sub-community 3.2), the species only started to establish at the site and favourable environmental conditions such as an increase in rainfall allowed the improvement of cover in April 2018 (S5; sub-community 3.1).
The above community descriptions cannot be directly compared to what was found in 2015 (Theron et al. 2020) because of the removal of the woody species which then dominated the community. There are, however, species such as Aristida congesta, Tricholaena monachne, Melhania acuminata, Panicum maximum and Perotis patens that occur on the site during most of the sampling seasons. It is, nevertheless, clear that the grass Pogonarthria squarrosa (Species Group D) only started to reappear in the vegetation in growing season 3 (April 2017), then diminished and reappeared again in growing season 5 (April 2018). This might indicate that this grass is also restricted to certain sampling seasons and does not occur on the crest sites throughout the year. Van Oudtshoorn (2018) indicated that P. squarrosa is a weak perennial tufted grass that can grow for two to five seasons. Diminishing of this grass during season 4 (December 2017) might therefore still be due to the effects of the drought; indicating that the drought still affected vegetation composition one year after the onset of the rainy season.
Sodic site communities (December 2016- April 2018)
The communities occur between the crest and the riparian area on the mid-slope of the hill, and are also sodic sites. Soils are mostly of the Sterkspruit form; however, there were also instances of Mispah soil forms present. The depth varies between 180 mm and 500 mm with an average pHH2O of 6.20-6.43. Soil texture is coarse sandy loam. The vegetation classification resulted in two communities and four sub-communities (Online Appendix 2). In terms of vegetation composition, these communities can be compared to the Dactyloctenium aegyptium-Sporobolus nitens (community 4) of Theron et al. (2020):
1. Tribulus terrestris-Portulaca *oleracea Community
a. Tribulus terrestris-Portulaca *oleracea-Urochloa panicoides Sub-community
b. Tribulus terrestris-Portulaca *oleracea-Heliotropium ciliatum Sub-community
2. Chloris virgata-Eragrostis cylindriflora Community
a. Chloris virgata-Eragrostis cylindriflora-Sporobolus nitens Sub-community
b. Chloris virgata-Eragrostis cylindriflora-Chloris gayana Sub-community
Sodic site community descriptions:
1. Tribulus terrestris-Portulaca *oleracea Community
Diagnostic species: Portulaca oleracea 78.5, Tribulus terrestris 89.8
Constant species: Bare soil 96, Cynodon dactylon 64, Portulaca *oleracea 86, Schkuhria pinnata 100, Tribulus terrestris 89, Urochloa mosambicensis 68
Dominant species: None
This community is defined by species from Species Group C, which occur here and are absent from other communities or occur with low cover-abundance values. Cynodon dactylon is known as a pioneer grass (Van Oudtshoorn 2018) and Tribilus terrestris is known to occur in disturbed areas (Van Wyk & Malan 1998). Portulaca *oleracea is a creeping succulent that grows vigorously under warm conditions covering the soil surface (Bromilow 2018). This community was mostly restricted to April 2017 (S2) and April 2018 (S4). Thus, again as seen in the Crest communities, there are certain species that show preferences for certain sampling seasons:
1.1. Tribulus terrestris-Portulaca *oleracea-Urochloa panicoides Sub-community
Diagnostic species: Urochloa panicoides 91.7
Constant species: Alternanthera pungens 62, Bare soil 94, Portulaca oleracea 81, Schkuhria pinnata 100, Sporobolus nitens 69, Tribulus terrestris 81, Urochloa panicoides 88
Dominant species: None
The vegetation found in this sub-community mostly represents species from growing season 4 with a single occurrence of season 2. Species from Species Group A (Online Appendix 2) define this sub-community. These species are completely absent or occur with very low cover-abundance values in other communities and sub-community on the sodic site. Urochloa panicoides, which defines this sub-community, is known as a pioneer annual tufted grass and will thus only be present for one season (Van Oudtshoorn 2018). In this subcommunity, this grass co-occurs with Sporobolus nitens, which defined the communities found in 2015 before the drought:
1.2. Tribulus terrestris-Portulaca *oleracea-Heliotropium ciliatum Sub-community
Diagnostic species: None
Constant species: Bare soil 100, Cynodon dactylon 75, Gomphrena celosioides 67, Heliotropium ciliatum 92, Ledebouria luteola 67, Portulaca oleracea 92, Schkuhria pinnata 100, Tribulus terrestris 100, Urochloa mosambicensis 92
Dominant species: None
This sub-community is mostly represented by growing season 2 (December 2016) at the onset of the rainy season after the severe drought. Furthermore, this sub-community is defined by the presence of species from Species Group B, which include two geophytic species. There is also a complete absence of the species from Species Group A in this sub-community. Very notable in this sub-community is the almost complete absence of Sporobolus nitens (Species Group G) and Dactyloctenium aegyptium (Species Group F), which completely dominated the vegetation during 2015 (growing season 1) (Theron et al. 2020):
2. Chloris virgata-Eragrostis cylindriflora Community
Diagnostic species: Chloris virgata 83.5
Constant species: Alternanthera pungens 78, Bare soil 85, Chloris virgata 100, Dactyloctenium aegyptium 67, Eragrostis cylindriflora 74, Schkuhria pinnata 96, Sporobolus nitens 93, Urochloa mosambicensis 70
Dominant species: Bare soil 4
This community is defined by the presence of species from Species Group F. Although some of the species that occur in this Species Group were also present in community 1, they occur with much higher cover-abundance values in community 2:
2.1. Chloris virgata-Eragrostis cylindriflora-Sporobolus nitens Sub-community
Diagnostic species: None
Constant species: Alternanthera pungens 92, Bare soil 100, Chloris virgata 100, Dactyloctenium aegyptium 62, Gomphrena celosioides 92, Schkuhria pinnata 92, Sporobolus nitens 100, Urochloa mosambicensis 92
Dominant species: None
Vegetation in this sub-community is mostly from growing season 5 (April 2018) with a single occurrence of vegetation from growing season 3 (April 2017). Although S. nitens is the diagnostic species for this sub-community, the presence of species from Species Group D defines this sub-community. These species are completely absent from sub-community 2.2. Season 5 marks the return of S. nitens (with high cover abundance) and Dactyloctenium aegyptium (with low cover-abundance and only in some relevés) which dominated the communities found on the sodic site by Theron et al. (2020) in 2015:
2.2. Chloris virgata-Eragrostis cylindriflora-Chloris gayana Sub-community
Diagnostic species: None
Constant species: Alternanthera pungens 64, Bare soil 71, Chloris gayana 71, Chloris virgata 100, Dactyloctenium aegyptium 71, Eragrostis cylindriflora 93, Schkuhria pinnata 100, Sporobolus nitens 86
Dominant species: Bare soil 7
Sub-community 2.2 is defined by the presence of perennial grasses from Species Group E, which are absent from sub-community 2.1. Although having low cover abundances and not occurring in all relevés, this is the only season in which these grass species were found. All three of these grass species (Chloris gayana, Eragrostis gummiflua and Aristida stipitata) are regarded by Van Oudtshoorn (2018) as sub-climax species, which might indicate that after the third season, the sodic site started to recover from the severe drought of 2015-2016.
Species such as Schkuhria pinnata, Urochloa mosambicensis and Chloris virgata occurred on the site through most of the sampling seasons since 2015. Sporobolus nitens that formed part of the diagnostic species that defined the sodic site communities in 2015 (Theron et al. 2020) only started to appear in April 2017 (S3) with low cover-abundance values. The high cover-abundance values of this diagnostic species only started returning in December 2017 (S4) and increased in April 2018 (S5). From Online Appendix 2, it is clear that certain species on the sodic site are restricted to certain sampling seasons such as April or December. However, it is also clear that the vegetation composition on the sodic site changed from December 2016 until April 2018. The mentioned changes can possibly be assigned to the recovery of the site after the drought of 2015-2016.
Riparian area communities (December 2016- April 2018)
The communities occur between the sodic site on the lower midslope of the hill and the drainage line. Soil forms found in this area include Dundee, Mispah, Bonheim and Sterkspruit. The depth of these soils varies from 100 mm to 600 mm with an average pHH20 of between 6.21-6.73. Soil texture also varies from sandy loam to loamy to sandy clay loam. In contrast to the other terrain units depicted along the catena, the riparian area's classification did not result in communities that could depict the different seasons of sampling. The vegetation classification resulted in five communities (Online Appendix 3). The vegetation of the riparian communities can be compared to communities 1 (Panicum maximum-Pupalia lappacea) and 2 (Themeda triandra-Flueggea virosa) from Theron et al.'s (2020) 2015 study:
1. Eragrostis cylindriflora-Urochloa mosambicensis Community
2. Themeda triandra-Panicum maximum Community
3. Eragrostis superba-Bothriochloa insculpta Community
4. Eragrostis rigidior-Urochloa mosambicensis Community
5. Bothriochloa radicans-Eragrostis superba Community
Riparian area community descriptions:
1. Eragrostis cylindriflora-Urochloa mosambicensis Community
Diagnostic species: None
Constant species: Bare soil 67, Eragrostis cylindriflora 83, Panicum maximum 75, Urochloa mosambicensis 83
Dominant species: None
Eragrostis cylindriflora (Species Group G) and Urochloa mosambicensis (Species Group H) define this community. Species from Species Group A are mostly present in community 1 and absent or occur with low cover-abundance value in other communities in the riparian areas. This community represents sampling seasons 2, 4 and 5. It is notable that none of the relevés done during season 2 (just at the onset of the rainy season) is present in this community. Community 1 also share a lot of species from Species Group B with community 2:
2. Themeda triandra-Panicum maximum Community
Diagnostic species: None
Constant species: Cymbopogon caesius 68, Panicum maximum 95, Themeda triandra 95, Urochloa mosambicensis 74
Dominant species: None
Community 2 is defined by the presence of species from Species Group C, which are mostly restricted to this community although they occur with low cover-abundance values. Notable in this community is the strong presence of Themeda triandra (Species Group D) and Panicum maximum (Species Group H), which were also present as diagnostic species defining the riparian areas in Theron et al. (2020). It seems as if Themeda triandra is mostly limited to this community with high cover-abundance values. However, Panicum maximum occurs throughout all the communities present in the riparian area throughout all the sampling seasons. This community is also mostly represented by sampling seasons 3 and 5 with some instances of sampling season 4:
3. Eragrostis superba-Bothriochloa insculpta Community
Diagnostic species: None
Constant species: Bare soil 100, Bothriochloa insculpta 67, Eragrostis superba 100, Panicum maximum 67, Urochloa mosambicensis 67
Dominant species: None
Community 3 is the community with the lowest number of species in all the communities found in the riparian area, and there are no species that clearly distinguish this community from all the other communities in the riparian area. The cover abundance of species in this community is also low, and species do not occur in all the relevés found in this community. It is only the grass Eragrostis superba (Species Group H), known to grow in disturbed areas (Van Oudtshoorn 2018), that occurs in all three relevés that make up the community. Vegetation in this community mostly represents sampling seasons 2 and 5. The reason for the low number of species might be that the vegetation still needed to recover after the drought.
4. Eragrostis rigidior-Urochloa mosambicensis Community
Diagnostic species: None
Constant species: Bare soil 100, Eragrostis rigidior 77, Eragrostis superba 62, Urochloa mosambicensis 92
Dominant species: None
Vegetation in this community is dominated by species from Species Group E, which are mostly absent from the other communities in the riparian area. Furthermore, Urochloa mosambicensis (Species Group H) also occurs more frequently and with a higher cover abundance in this community. According to Van Oudtshoorn (2018), U. mosambicensis grows in disturbed or overgrazed and trampled areas. The high occurrence of this species in the riparian area might indicate that animals were seeking shade in order to evade the heat of the day during the drought (2015-2016). He further also indicated that Eragrostis rigidior is known to occur in disturbed soil. It is also important to note that most of the relevés present in this community represent sampling season 2, which was just after the 2015-2016 drought:
5. Bothriochloa radicans-Eragrostis superba Community
Diagnostic species: None
Constant species: Bare soil 62, Bothriochloa radicans 77, Dicoma tomentosa 62, Eragrostis superba 69
Dominant species: Bare soil 8
This is the only community that is solely represented by vegetation sampled during sampling season 4. The vegetation is mostly dominated by the presence of species from Species Group F, which is mostly absent or occurs with low cover-abundance values in other communities of the riparian area. The grasses Bothriochloa radicans and Eragrostis trichophora are known to occur in areas with additional moisture or where water collects (Van Oudtshoorn 2018). A possible explanation for this might be that after rains, water can remain close to the surface in the vicinity of the riparian area, which contributes to the additional moisture that is favourable for these grasses.
Although there is no distinction to be made between the sampling seasons in the riparian area of the study site, there are differences in the vegetation composition over the study period. When comparing the vegetation of the riparian area with communities 1 and 2 (Theron et al. 2020), it is clear that Panicum maximum, Urochloa mosambicenis and Themeda triandra remained an important part of the vegetation composition over all the different sampling seasons.
Richness and diversity of plant communities
From Figure 3a, it seems as if the species richness decreased at all the sites during the drought and subsequently increased more-or-less progressively through time as the communities recovered from the drought between 2015 and the onset of the current sampling period. However, pre- versus post-drought richness estimates are only significantly different for the sodic and riparian habitats (non-overlapping 95% confidence intervals between groups); variance in estimates for the crest communities is high and overlaps with the pre-drought estimate. Interestingly, however, the recovery in species richness in sodic and riparian habitats appeared to slow or even reverse by the end of the study period (April 2018), although this could be because the final sample was taken in the dry season. Overall, species richness in crest habitats was greater than in both sodic and riparian habitats.
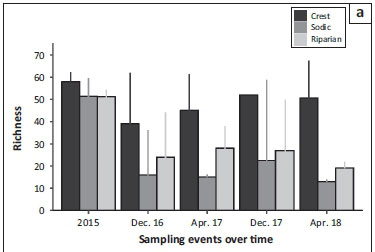
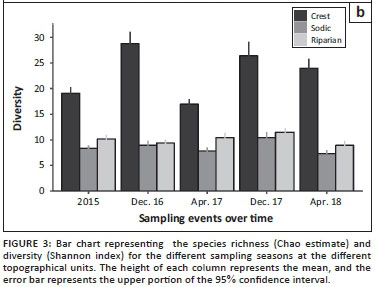
Figure 3b represents the changes that took place in diversity over the different sampling seasons. In contrast to richness, species diversity did not differ between pre- and post-drought periods. However, a more cyclic seasonal shift is apparent, in that diversity was often highest in the wet seasons (December samples), compared with both dry season samples (April). The sodic and riparian habitats are an exception to this trend, because diversity in these areas was low in December 2016, perhaps because of a lag in recovery from the drought. As with species richness, diversity was also consistently greater in the crest, compared with the other two habitats.
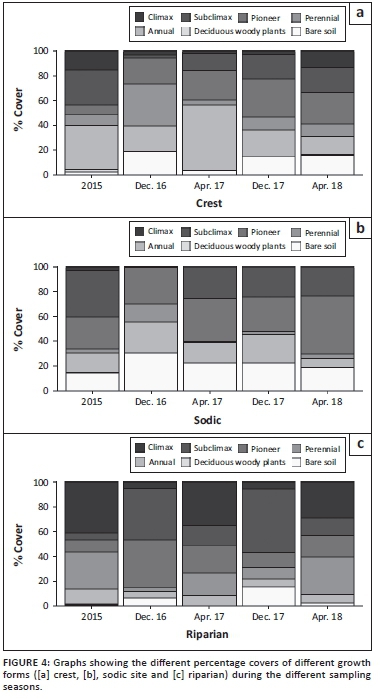
While these indices of diversity provide some indication about changes in the studied communities, their overall function might be better represented in terms of changes in plant functional groups. Indeed, in all three habitats, the proportional representation of plant functional groups differed between 2015 and 2016, with climax and subclimax species being replaced by pioneers, perennials, annuals and - in some cases, especially in the sodic habitat - bare soil (Figure 4). By the end of the sampling period, however, the frequency distribution of functional groups at each habitat was qualitatively similar to pre-drought conditions.
General discussion
With this study, we aimed to determine how savanna plant communities along a catenal gradient changed over time following a severe drought. The catenal gradient studied could be divided into three plant communities - crest and midslope with the highest diversity; sodic site, and riparian areas. The crest and sodic sites further showed a definite change in species composition among the different sampling seasons. There was also an association between April sampling seasons for the crest as well as associations between the December and April sampling sites for the sodic site. Vegetation in the riparian section of the study revealed no clear distinction between different sampling seasons or any correlation between April and December. In a study by Scholes (1985), he investigated the drought of 1981-1983 and found that the grasses were more adversely affected by the drought than the trees. Although we excluded data for woody plants from this study, it is clear that vegetation changes took place in the ground layer (graminoids, forbs, herbs and geophytes), especially in the crest and sodic site communities (see Janecke 2020).
Previous studies have indicated that the physical and chemical properties of soils would affect grass mortality rates during drought conditions (Khomo & Rogers 2005; Khomo et al. 2011; Scholes 1985). Specifically referring to the characteristics of the study site and its catenary properties, it is expected that grasses inhabiting the sandy crest and valley bottoms would have a higher mortality rate than those inhabiting the clay-rich sodic sites and downslopes. The physical properties of sandy soils would compound the effects of droughts because they retain less water than do clay soils, and also through exasperating water infiltration and percolation of any available surface water. The effect of soil properties was shown to also affect this catena complex (Theron et al. 2020). This is also comparable to this study because most of the grass species dominating the climax community (sampling S1; 2015) returned to the vegetation composition of communities during sampling season 3 (April 2017). We furthermore found that richness and diversity declined and that recovery was not complete two years after the drought, especially in the sodic and riparian habitats, which have maintained a low level of species richness throughout the sampling period. These shifts coincided with changes in functional group representation following the drought.
Conclusion
Definite changes in plant community composition were seen in the crest, midslope and sodic sites during the different sampling seasons. Shifts were also seen in terms of species composition at certain times of the year. This was not always clear in terms of richness and diversity of plant species. We would, however, be cautious to extrapolate these findings to all vegetation successions along a catena.
In the riparian area, no distinctions were clear between the different sampling seasons and no cyclic correspondence was observed between April and December. This phenomenon might be ascribed to water movement through the process of hydraulic lift from deeper soil layers which lessen the impact of drought on the vegetation.
We recommend that future studies following droughts should be done over more sampling seasons than reported here to better relate seasons to plant assemblages. Lastly, the recovery of the plant growth forms from 2015 to 2018 might be an indication of the resilience of the savanna ecosystem, in spite of the recovery not being complete.
Acknowledgements
The authors thank the South African National Parks for providing them with access to the research sites within Kruger National Park. A special thanks goes to the field rangers who accompanied them during the surveys. The authors also thank Louis Scott and Leslie Brown for suggestions on the writing of the manuscript.
Competing interests
The authors declare that they have no financial or personal relationships that may have inappropriately influenced them in writing this article.
Authors' contributions
E.J.T. and A.C.v.A. (partially) were responsible for the fieldwork and data collection during field surveys. A.C.v.A. and P.J.d.P. contributed towards the analysis and interpretation of the plant communities. D.C. contributed towards the analysis and interpretation of the statistical elements of the article. All authors contributed to the writing of the manuscript.
Funding information
The authors are grateful to the University of the Free State (UFS) Strategic Research Fund for partially funding this multidisciplinary research.
Data availability
Study data are available and may be provided, on request, by the corresponding author. Data from all research done within Kruger National Park is placed within the SANParks repository (not for free, open access).
Disclaimer
The views and opinions expressed in this article are those of the authors and do not necessarily reflect the official policy or position of any affiliated agency of the authors.
References
Abbas, H.A., Bond, W.J. & Midgley, J.J., 2019, 'The worst drought in 50 years in a South African savannah: Limited impact on vegetation', African Journal of Ecology 57(4), 1-10. https://doi.org/10.1111/aje.12640 [ Links ]
Alard, G.F., 2009, 'A comparison of grass production and utilization in sodic and crest patches on a semi-arid granitic savanna catena in the southern Kruger National Park, South Africa', MSc thesis, Faculty of Science, University of the Witwatersrand. [ Links ]
Bond, W.J., Midgley, G.F. & Woorward, F.I., 2003, 'What controls South African vegetation - Climate or fire?' South African Journal of Botany 69(1), 79-91. https://doi.org/10.1016/S0254-6299(15)30362-8 [ Links ]
Bromilow, C., 2018, Problem plants and alien weeds of Southern Africa, 4th edn., Briza Publications, Pretoria. [ Links ]
Brown, L.R., Du Preez, P.J., Bezuidenhoudt, H., Bredenkamp, G.J, Mostert, T.H.C. & Collins, N.B., 2013, 'Guidelines for phytosociological classifications and descriptions of vegetation in southern Africa', Koedoe 55(1), Art. #1103, 10. https://doi.org/10.4102/koedoe.v55i1.1103 [ Links ]
Buitenwerf, R., Swemmer, A.M. & Peel, M.J.S., 2011, 'Long-term dynamics of herbaceous vegetation structure and composition in two African savanna reserves', Journal of Applied Ecology 48(1), 238-246. https://doi.org/10.1111/j.1365-2664.2010.01895.x [ Links ]
Campbell, N.A., Reece, J.B, Urry, L.A., Cain, M.L., Wasserman, S.A., Minorsky, P.V., 2008, Biology, 8th edn., Pearson Benjamin Cummings, San Francisco, CA. [ Links ]
Fauchereau, N., Trzaska, S., Rouault, M. & Richard, Y., 2003, 'Rainfall variability and changes in Southern Africa during the 20th century in the global warming context', Natural Hazards 29(2), 139-154. https://doi.org/10.1023/A:1023630924100 [ Links ]
Furley, P., 2010, 'Tropical savannas: Biomass, plant ecology, and the role of fire and soil on vegetation', Progress in Physical Geography 34(4), 563-585. https://doi.org/10.1177/0309133310364934 [ Links ]
Gommes, R. & Petrassi, F., 1996, Rainfall variability and drought in sub-Saharan Africa, Food and Agriculture Organization of the United Nations, Rome. [ Links ]
Hsieh, T.C., Ma, K.H. & Chao, A., 2016, 'iNext: An R package for rarefaction and extrapolation of species diversity (Hill numbers)', Methods in Ecology and Evolution 7(12), 1451-1456. https://doi.org/10.1111/2041-210X.12613 [ Links ]
Hu, S. & Fedorov, A.V., 2019, 'The extreme El Niño of 2015-2016: The role of westerly and easterly wind bursts, and preconditioning by the failed 2014 event', Climate Dynamics 48(1), 1-19. https://doi.org/10.1007/s00382-017-3531-2 [ Links ]
Janecke, B.B., 2020, 'Vegetation structure and spatial heterogeneity in the Granite Supersite, Kruger National Park', Koedoe 62(2), a1591. https://doi.org/10.4102/koedoe.v62i2.1591 [ Links ]
Kent, M., 2012, Vegetation description and data analysis: A practical approach, 2nd edn., Wiley-Blackwell Publishers, West Sussex. [ Links ]
Kent, M. & Coker, C., 1992, Vegetation description and analysis: A practical approach, Bellhaven Press, West Sussex. [ Links ]
Khomo, L.M., Hartshorn, A.S., Rogers, K.H. & Chadwick, O.A., 2011, 'Impact of rainfall and topography on the distribution of clays and major cations in granitic catenas of Southern Africa', Catena 87(1), 119-128. https://doi.org/10.1016/j.catena.2011.05.017 [ Links ]
Khomo, L.M. & Rogers, K.H., 2005, 'Proposed mechanism for the origin of sodic patches in Kruger National Park, South Africa', African Journal of Ecology 43(1), 29-34. https://doi.org/10.1111/j.1365-2028.2004.00532.x [ Links ]
Kruger, A.C., Makamo, L.B. & Shongwe, S., 2002, 'An analysis of Skukuza climate data', Koedoe 45(1), 1-7. https://doi.org/10.4102/koedoe.v45i1.16 [ Links ]
Mucina, L. & Rutherford, M.C. (eds.), 2006, The vegetation of South Africa, Lesotho and Swaziland, Strelizia 19, South African National Biodiversity Institute, Pretoria. [ Links ]
R Core Team, 2015, computer software, R: A language and environment for statistical computing, R Foundation for Statistical Computing, Vienna. [ Links ]
Roleček, J., Lubomír, T., David, Z., & Milan, C., 2009, 'Modified TWINSPAN classification in which the hierarchy respects cluster heterogeneity', Journal of Vegetation Science 20(4), 596-602. https://doi.org/10.1111/j.1654-1103.2009.01062.x [ Links ]
Rouault, M. & Richard, Y., 2003, 'Intensity and spatial extension of drought in South Africa at different time scales', Water SA 29(4), 489-500. https://doi.org/10.4314/wsa.v29i4.5057 [ Links ]
Scholes, R.J., 1985, 'Drought related grass, tree and herbivore mortality in a southern African savanna', in J.C. Tothill & J.J. Mott (eds.), Ecology and management of the world's savannas, pp. 350-353, Australian Academy of Science, Washington, DC. [ Links ]
Scholes, R.J., 1997, 'Savanna', in R.M. Cowling, D.M. Richardson & S.M. Pierce (eds.), Vegetation of Southern Africa, pp. 258-277, Cambridge University Press, Cambridge. [ Links ]
Scholes, R.J., Bond, W.J. & Eckhardt, H.C., 2003, 'Vegetation dynamics in the Kruger ecosystem', in J.T. Du Toit, K.H. Rogers & H.C. Biggs (eds.), The Kruger experience: Ecology and management of Savanna heterogeneity, pp. 242-262, Island Press, London. [ Links ]
Schulze, R.E., 1997, 'Climate', in R.M. Cowling, D.M. Richardson & S.M. Pierce (eds.), Vegetation of Southern Africa, pp. 21-42, Cambridge University Press, Cambridge. [ Links ]
Smit, I.P.J., Riddell, E.S., Cullum, C. & Petersen, R., 2013, 'Kruger National Park research supersites: Establishing long-term research site for cross-disciplinary, multiscaled learning', Koedoe 55(1), Art. #1107, 7, https://doi.org/10.4102/koedoe.v55i1.1107 [ Links ]
Staver, A.C., Wigley-Coetsee, C. & Botha, J., 2018, 'Grazer movements exacerbate grass declines during drought in an African savanna', Journal of Ecology 107(1), 1482-1491. [ Links ]
Swemmer, A.M., Bond, W.J., Donaldson, J., Hempson, G.P., Malherbe, J. & Smit, I.P.J., 2018, 'The ecology of drought - A workshop report', South African Journal of Science 114(9-10) Art.#5098, 3. https://doi.org/10.17159/sajs.2018/5098 [ Links ]
Swemmer, T., 2016, The Lowveld's worst drought in 33 years? Understanding the long-term impacts, viewed 13 April 2017, from http://www.saeon.ac.za/newsletter/archives/2016february/doc02. [ Links ]
Theron, E.J., Van Aardt, A.C. & Du Preez, P.J., 2020, 'Vegetation distribution along a granite catena, southern Kruger National Park, South Africa', Koedoe 62(2), a1588. https://doi.org/10.4102/koedoe.v62i2.1588 [ Links ]
Tichý, L. & Holt, J., 2006, JUICE: A program for management, analysis and classification of ecological data, Vegetation Science Group, Brno. [ Links ]
Van der Maarel, E., 2007, 'Transformation of cover-abundance values for appropriate numerical treatment - Alternatives to the proposals by Podani', Journal of Vegetation Science 18(5), 767-770. https://doi.org/10.1111/j.1654-1103.2007.tb02592.x [ Links ]
Van der Maarel, E. & Franklin, J., 2013, Vegetation ecology, 2nd edn., John Wiley & Sons, Chichester. [ Links ]
Van Oudtshoorn, F., 2018, Guide to grasses of southern Africa, Briza Publications, Pretoria. [ Links ]
Van Wyk, B. & Malan, S., 1998, Field guide to the wild flowers of the Highveld, Struik Nature, Cape Town. [ Links ]
Van Zijl, G. & Le Roux, P., 2014, 'Creating a conceptual hydrological soil response map for the Stevenson Hamilton Research Supersite, Kruger National Park, South Africa', Water SA 40(2), 331-336. [ Links ]
Venter, F.J., 1990, 'A classification of land for management planning in the Kruger National Park', PhD thesis, University of South Africa, Pretoria. [ Links ]
Venter, F.J., Scholes, R.J. & Eckhardt, H.C., 2003, 'The abiotic template and its associated vegetation pattern', in J.T. Du Toit, K.H. Rogers & H.C. Biggs (eds.), The Kruger experience: Ecology and management of savanna heterogeneity, pp. 83-129, Island Press, London. [ Links ]
Vetter, S., 2009, 'Drought, change and resilience in South Africa's arid and semi-arid rangelands', South African Journal of Science 105(1-2), 29-33. https://doi.org/10.4102/sajs.v105i1/2.35 [ Links ]
Walker, B.H., Emslie, R.H., Owen-Smith, R.N. & Scholes, R.J., 1987, 'To cull or not to cull: Lessons from a southern African drought', Journal of Applied Ecology 24(2), 381-401. https://doi.org/10.2307/2403882 [ Links ]
Zambatis, N., 2006, Average monthly and seasonal temperatures (°C) of the Kruger National Park, Scientific Services, Kruger National Park, Cape Town. [ Links ]
Zambatis, N. & Biggs, H.C., 1995, 'Rainfall and temperatures during the 1991/92 drought in the Kruger National Park', Koedoe 38(1), 1-16. https://doi.org/10.4102/koedoe.v38i1.301 [ Links ]
Correspondence:
Andri C. van Aardt
vanaardtac@ufs.ac.za
Received: 04 Sept. 2019
Accepted: 14 Apr. 2020
Published: 29 Oct. 2020
† 1960-2019.
^rND^sAbbas^nH.A.^rND^sBond^nW.J.^rND^sMidgley^nJ.J.^rND^sBond^nW.J.^rND^sMidgley^nG.F.^rND^sWoorward^nF.I.^rND^sBrown^nL.R.^rND^sDu Preez^nP.J.^rND^sBezuidenhoudt^nH.^rND^sBredenkamp^nG.J^rND^sMostert^nT.H.C.^rND^sCollins^nN.B.^rND^sBuitenwerf^nR.^rND^sSwemmer^nA.M.^rND^sPeel^nM.J.S.^rND^sFauchereau^nN.^rND^sTrzaska^nS.^rND^sRouault^nM.^rND^sRichard^nY.^rND^sFurley^nP.^rND^sHsieh^nT.C.^rND^sMa^nK.H.^rND^sChao^nA.^rND^sHu^nS.^rND^sFedorov^nA.V.^rND^sJanecke^nB.B.^rND^sKhomo^nL.M.^rND^sHartshorn^nA.S.^rND^sRogers^nK.H.^rND^sChadwick^nO.A.^rND^sKhomo^nL.M.^rND^sRogers^nK.H.^rND^sKruger^nA.C.^rND^sMakamo^nL.B.^rND^sShongwe^nS.^rND^sRoleček^nJ.^rND^sLubomír^nT.^rND^sDavid^nZ.^rND^sMilan^nC.^rND^sRouault^nM.^rND^sRichard^nY.^rND^sScholes^nR.J.^rND^sScholes^nR.J.^rND^sScholes^nR.J.^rND^sBond^nW.J.^rND^sEckhardt^nH.C.^rND^sSchulze^nR.E.^rND^sSmit^nI.P.J.^rND^sRiddell^nE.S.^rND^sCullum^nC.^rND^sPetersen^nR.^rND^sStaver^nA.C.^rND^sWigley-Coetsee^nC.^rND^sBotha^nJ.^rND^sSwemmer^nA.M.^rND^sBond^nW.J.^rND^sDonaldson^nJ.^rND^sHempson^nG.P.^rND^sMalherbe^nJ.^rND^sSmit^nI.P.J.^rND^sTheron^nE.J.^rND^sVan Aardt^nA.C.^rND^sDu Preez^nP.J.^rND^sVan der Maarel^nE.^rND^sVan Zijl^nG.^rND^sLe Roux^nP.^rND^sVenter^nF.J.^rND^sScholes^nR.J.^rND^sEckhardt^nH.C.^rND^sVetter^nS.^rND^sWalker^nB.H.^rND^sEmslie^nR.H.^rND^sOwen-Smith^nR.N.^rND^sScholes^nR.J.^rND^sZambatis^nN.^rND^sBiggs^nH.C.^rND^1A01^nBeanelri B.^sJanecke^rND^1A02^nJeremy G.^sBolton^rND^1A01^nBeanelri B.^sJanecke^rND^1A02^nJeremy G.^sBolton^rND^1A01^nBeanelri B^sJanecke^rND^1A02^nJeremy G^sBoltonORIGINAL RESEARCH
Variation in mammal diversity and habitat affect heterogeneity and processes of a granite catena
Beanelri B. JaneckeI; Jeremy G. BoltonII
IDepartment of Animal, Wildlife and Grassland Sciences, Faculty of Natural and Agricultural Sciences, University of the Free State, Bloemfontein, South Africa
IIBushcam Consulting, Stonehurst Mountain Estate, Lakeside, Cape Town, South Africa
ABSTRACT
A higher variety of habitats normally result in higher diversity of species. The granite catenas near Skukuza, Kruger National Park (KNP), consist of different soil types along the hillslope, creating different habitats. Objectives were to determine the mammal species present on a catena and surrounding areas; to indicate their main period of activity; and to indicate human visibility in each catenal zone to explain landscape of fear principles. Camera trap surveys were conducted for short periods and repeated over three years. In total, 31 mammal species were observed on the catena, and its nearest waterholes. Small to mega-sized mammals were present, but some species were only observed during one survey period. Small changes were noticed in activity periods between survey periods, probably due to the drought. A severe drought changed vegetation structure and visibility, but the study area appeared to act as a drought forage refuge. The lowest visibility was found at the sodic patch upper-midslope ecotone, and shrub veld. This can possibly explain the lower number of mammal observations in these areas. Different habitats and habitat features were described which can affect the presence of mammals, i.e. the mud wallows that were created and maintained by the mammals. Future studies can focus on the impact of seasonal changes in mammal presence and on mammal diversity during a normal rainfall year.
CONSERVATION IMPLICATIONS: To understand the mechanisms of herbivores as ecosystem drivers, aspects such as vegetation, soil and mammals should be combined. Better understanding of mammals, their habitats and associated processes can lead to better conservation actions
Keywords: Animal presence; Ecosystem functioning; Herbivores and predators; Landscape of fear; Stevenson-Hamilton Supersite.
Introduction
Acceptable habitat conditions are one of the most important requirements for successful maintenance of animal populations. Resources in the habitat are exploited differently in order for animals to fulfil their requirements for survival, reproduction and growth (Owen-Smith 2002). Hall, Krausman and Morrison (1997) define habitat as follows:
[T]he resources and conditions present in an area that produce occupancy - including survival and reproduction - by a given organism. Habitat is organism-specific; it relates the presence of a species, population or individual (animal or plant) to an area's physical and biological characteristics. Habitat implies more than vegetation or vegetation structure; it is the sum of the specific resources that are needed by organisms. (p. 175)
Habitat is thus any area where an animal has the necessary resources that allow it to survive, including migration paths, dispersal corridors and areas occupied during breeding times (Hall et al. 1997; Krausman & Morrison 2016).
Habitat selection refers to a process where an animal selects a specific set of environmental factors that can provide all the essential resources it needs to survive and reproduce (Bonyongo 2005; Johnson 1980; Krausman & Morrison 2016). The basic habitat requirements of animals in general are food, water, cover (i.e. thermal cover, shade, shelter, escape cover and cover for new-borns) and space to perform normal daily activities (i.e. resting, feeding, rumination, reproduction, socialising, avoiding competition, etc.) (Hansen et al. 2009; Janecke 2011). Other features that are included when an animal selects a habitat are the vegetation structure of the area, certain geomorphological features, topography, seasonal availability of resources, distance from resources (such as water and grazing), presence of predators and the landscape of fear principle, to name but a few. The specific animal species, their social structure, age, sex, physiological condition (gestation and lactation) and behavioural aspects play a role in the needs of the animal when selecting a habitat (Bonyongo 2005; Grant et al. 2011; Joubert 2016; Owen-Smith 2002). The presence or absence of an animal species is determined by how well the species' own special, or general habitat requirements and basic needs are met in that specific area, amongst other reasons, and probably also what its niche role is in maintaining ecosystem processes of the area. A variety of available habitats in an area will usually result in a variety of animals in that area (Joubert 2016). It is essential for long-term management and conservation of species to relate the distribution patterns of animals to certain characteristics of their chosen habitat (Ben-Shahar & Skinner 1988; Pieterse 2018).
This study forms part of a larger multidisciplinary study on the Stevenson-Hamilton Southern Granite Supersite of the Kruger National Park (KNP), with the main aim of determining specific abiotic processes and some biotic diversity that may play a role in the functioning of the catena ecosystem. Weil and Brady (2016) define a catena as a soil sequence (soilscape) where each soil type occurs on the same parent material, but in different arrays from the crest down to the footslope. This hillslope facilitates the transfer of solutes, colloids or other particles from upslope areas downhill along an increasing environmental gradient, resulting in a variation of soil properties and associated vegetation in different catenal zones (Khomo et al. 2011). The focus of this current study was on whether specific mammal species use certain catenal zones more frequently than others; the specific objectives of this study were to:
1. determine the mammal species present in the study area, at the nearest waterholes and granite outcrops with a snapshot approach
2. indicate the main period of activity of these mammals during three different survey periods
3. establish human visibility (based on density of vegetation) in each catenal zone in order to explain the landscape of fear principle usually connected to the absence or presence of mammals in the area.
Methods
Study area
The supersite concept was established formally in 2013 to try and focus research effort geographically in KNP, and to allow data integration over long periods and across different research themes. One of the four research supersites is located in a specific area on the wetter, southern granite landscape in the Stevenson-Hamilton area (Smit et al. 2013).
This study was conducted on a hillslope in the Southern Granite Supersite, located between 25°06'28.6 S, 31°34'41.9 E and 25°06'25.7 S, 31°34'33.7 E, approximately 10 km from Skukuza, KNP. The study area falls in the Renosterkoppies land type, described as an ecotonal area between land types that are associated with the Sabie River catchment (Smit et al. 2013). The average herbivore biomass on the supersite is 2.1 kg grazers/ha, 3.0 kg browsers/ha and 9.9 kg mixed feeders/ha (Smit et al. 2013).
This study focused on one catena or hillslope from the crest to third-order watercourse or drainage line. The vegetation in this area is described as moderately dense bush savanna on midslopes and as shrub savanna with a dense riverine forest at the footslope and valley bottom (Smit et al. 2013). As part of the effort to focus different research fields together on the supersites, the following research was conducted on one specific study area: Bouwer, Le Roux and Van Tol (2020) described the soil types and properties, Theron, Van Aardt and Du Preez (2020) did a detailed vegetation classification and Janecke (2020) provided a description of the vegetation structure. Four catenal zones were identified along the slope based on their position on the catena and associated vegetation, namely, crest and upper-midslope, lower midslope or sodic patch, footslope shrub veld and a riparian area around the dry drainage line. A seepline defines the transition between the upper and lower-midslope. To give an indication of the size of each zone, a linear measurement was done from crest to drainage line (but that does not indicate the surface area of each zone): upper-midslope is 140 m in width, lower midslope is 220 m, footslope is 70 m (on its shortest end) and the riparian area is roughly 50 m but more difficult to indicate because of the winding of the drainage line. The study area was approximately 1.5 km in length. A visual illustration of the catena studied is provided by Janecke et al. (2020).
Camera trapping
The location of each camera trap was determined after a visual survey of the study area in order to represent the four identified catenal zones. The three nearest permanent waterholes (De La Porte, Kwaggaspan and Renosterkoppiesdam) and two rocky outcrops with granite boulders close to the study area, as well as two large mud wallows inside the study area (sodic patch and riparian zone), were also surveyed through cameras. In total, 30 camera traps were deployed during each of the three survey periods, which lasted for approximately a fortnight each during September 2015, March 2016 and March-April 2017.
Of the 30 cameras used, 23 were Bushnell models, 4 were Cuddeback, 2 were Scoutguard and 1 was Little Acorn model. Cameras were selected with similar attributes in terms of trigger response time (between 0.25 s and 0.9 s) and field of view ranges, and all utilised infrared flashes. A camera trap positioned to monitor a game trail was required to have a faster trigger response time than one monitoring a wide clearing. The same locations were used in all three surveys unless the camera-holding tree had been damaged or vegetation conditions dictated that a better (nearby) location was essential to obtain good results. The majority of cameras were set up to monitor mammals passing at close range, while four were set up to monitor on a time-lapse basis from a distance as follows:
1. Passing mammals (26 cameras). Cameras were positioned between 50 cm and 170 cm height to give the best uninterrupted view of the area around a well-used game trail, termite mound or an open clearing where there was evidence of the presence of mammals. Where possible, cameras were orientated in a southerly direction to optimise the quality of images obtained (sunlight). Cameras were installed as low as possible, provided that the camera's field of view was not obstructed by vegetation, to also capture small mammals. Cameras were programmed to take two photographs per trigger event, with a rest interval of 5 s between image pairs.
2. Time lapse (four cameras). These cameras were installed between 1.5 m and 3 m height so as to give a clear view of the entire waterhole or sodic patch and were programmed to take one image every 5 min. This was deemed an appropriate interval to ensure that any mammal drinking at the waterhole or crossing the sodic patch would likely be recorded. In addition to the camera taking time lapse images, it was also programmed to record the movement of mammals passing the camera at close range.
Visibility
During the vegetation sampling of the study area in 2015, a visibility index was determined. The distance of 20 m was used after testing different possible distances - in many of the plant communities, the vegetation was too dense to see much further than 20 m or 30 m. A 100-m measuring tape was used as a transect line in the different catenal zones. Transects were placed on a horizontal plane in each zone (in other words, not running from top to bottom down the slope) at approximately 20 m intervals but excluding the transition areas (Janecke 2020). A 1 m2 cloth with a checkerboard pattern of 10 cm blocks and dowel sticks on the edges was used. The method was slightly adjusted from that of Bissett and Bernard (2007). The field assistant held this apparatus at ground level, 20 m from the observer and at 90°, 180° and 270° angles, respectively, from the observer standing on the transect line. The observer then counted the number of blocks visible at an observing height of 70 cm and 170 cm from the ground level to imitate different sized animals. These observations were repeated at 20 m intervals along the 100 m transect line (0 m, 20 m, 40 m, 60 m, 80 m and 100 m) for each catenal zone. The average in the bar graph illustrating the results was calculated from all the values on the 100 m line (20 m intervals) for each angle (90°, 180° and 270°) observed, respectively.
Data and statistical analyses
Camera trapping images were analysed as follows. For the purpose of this study, an independent trigger event is defined as an image or a series of images that record the passing of an individual or group of individuals at a specific time. For example, an event could include the movement of a herd of impala, or a single hyena, passing the camera. The number of events thus represents the number of observations of an animal species. No specific interval was used to determine the independence of consecutive events. However, every effort was made to determine whether the individual or individuals were different from those in preceding sequences of images to prevent double-counting. If an animal species could not be identified, for example, because of badly blurred photos usually taken at night, it was indicated as Unknown. From these, the following data per independent trigger event were extracted: date and time, animal species, number of individuals in the view of the camera and the primary activity of the animals.
Data from the camera traps were grouped according to the catenal zone that the camera was located in, with all three waterholes combined together as one zone. There were five cameras per catenal zone, five at waterholes and surrounds (the two larger waterholes had two cameras each pointing in different directions), and five at special locations (granite outcrops and mud wallows). The number of trigger events (or observations of each species) was totalled for each mammal species per catenal zone and graphically presented as a grayscale gradient of increasing number of events for each survey period (year) of research. A Pareto graph was used to indicate the total number of events of that species in the study area in descending order of frequency and its percentage of the total as a cumulative line. Only mammal species were indicated in the results, but all information on the two rhinoceros species was excluded (for security reasons).
The minimum to maximum range in general group size of individuals visible in the cameras' view and the median value of typical group sizes observed were tabulated per survey period. The Excel median function was used to determine a median value of those records of group sizes greater than 1. This was verified by a visual observation of the data to ensure that the median value looked reasonable. The sum total of all mammals observed per species in each survey period was also indicated in a table (this is the total number of all individuals captured on the cameras and not the number of times/events that they were observed). Other information calculated from photographs included the percentage of the total number of events that a species was observed on the cameras to be active (grouped into day, night and civil twilight) and species that utilised the catena was also indicated.
Utilisation of the catena was described as mammals captured on the cameras doing one or more of these activities:
-
Feeding: obvious feeding activity, or a species moving slowly across the camera's field of view in a feeding position, for example, head down for grazers and head near vegetation for browsers.
-
Socialising: chasing each other, making body contact, locking horns.
-
Resting: lying down for long periods, usually at night for diurnal animals.
-
Wallowing: lying in the mud holes on the catena and a mammal next to the wallow that showed mud on its body were included.
-
Drinking: some animals were drinking from the mud wallows, but mostly mammals standing at the edge of a waterhole were presumed to be drinking. If mammals were just in the vicinity, although it can be assumed that they might have been drinking, these mammals are not listed in Table 3 (but are indicated in Figure 1).
The normal distribution of data was determined by the Shapiro-Wilk test. As it was not normally distributed, the Kruskal-Wallis test (https://www.socscistatistics.com/) for non-parametric data was used to determine significant differences in number of animal species observations per catenal zone between the three different survey periods. A 5% level of significance was used. Variability in sample means of the number of blocks visible on the checkerboard was measured through standard errors. Error bars were included for standard error of the mean (SEM) in the visibility graph and were calculated by Excel using the following formula: SEM = standard deviation/square root of total number of samples.
Ethical considerations
Ethical approval for the multidisciplinary project as a whole, with specific mention to the camera trapping, was obtained from the Interfaculty Animal Ethics Committee at the University of the Free State (UFS-AED2019/0121).
Results
A snapshot approach was followed to give an idea of the mammal species that frequent the study area - in other words, the cameras were only left in the veld for short periods during each survey period. A total of 31 mammal species were observed during the study (Table 1). Tortoises, terrapins, (large) millipedes and several bird species (including ground birds and smaller birds) were also observed on the cameras but are not included in the species list which focuses only on mammals. All data on the black and white rhinoceroses have been removed from the figures because of the sensitive nature of this data (i.e. poaching concerns). Although exclusion of these two threatened species affects the results, we decided to remove such data as a precaution.
Figure 1 indicates the events (or in other words, the number of independent observations) of each mammal species observed during the three survey periods, divided into catenal zones (determined from its position on the catena and associated vegetation). Herbivores (16 species), carnivores (11 species), insectivores (2 species: aardvark and civet) and primates (2 species) were recorded. Of these, seven species are small mammals, such as the mongoose species, genet, scrub hare and tree squirrel. Figure 2 presents the total number of events that each species was observed and its percentage of the total number of events (including all species). This graph clearly shows the species that were observed more frequently than others, in contrast to species that were recorded the least or were completely absent during all the survey periods. The order of species also changes through the survey periods (Figure 2). The more common species during all three survey periods were impala (603 events in total), elephant (289), spotted hyena (74), kudu (76), giraffe (72), buffalo (54), zebra (51), warthog (48) and grey duiker (43). Blue wildebeest (28 events in total), lion and steenbok (approximately 20 events each) were also observed more than the remainder of the species.
The general group sizes of each species observed are shown in Table 2. It is noted that some individuals may have passed outside the view of the cameras; thus, the totals are just an indication and not the true possible numbers of herds or groups in the area. The sum total of all animals of each species that were observed during a survey period (Table 2) clearly shows the following: the rise and fall of total elephant numbers observed during the three surveys, the increasing total number of impalas observed and the declining total number of kudu recorded over the three periods, to mention but a few. These totals are not herd sizes but all the individuals in total observed during the survey period, which can be the same individuals seen repeatedly. If these totals are compared to herd sizes and the number of events (Table 2), it may be interpreted that individuals of these specific species are probably resident in the study area and will therefore utilise the area more than other species just passing through the area and are not observed so frequently.
The total number of mammal species observed during each survey period (24, 25 and 24 species, respectively) seem very similar, but they include some species that were only observed during one survey period but were absent from other periods (Figure 1). This was confirmed by significant statistical differences between the number of observations of each animal species in a catenal zone between the three different survey periods (n = 122 per survey period; H = 7.295; p = 0.026 < 0.05). The total number of mammal species in each catenal zone was as follows: crest and upper-midslope (19); sodic patch on lower midslope (17); shrub veld on footslope (14); riparian area close to the drainage line (15); permanent waterholes (22); rocky hills (16); and mud wallows, temporarily filled with water (13). Many of these mammal species were present in more than one catenal zone. The highest species diversity was found on the upper-midslope and sodic patch, and as was expected, at the waterholes (Figure 1).
The period of a 24-h day when the mammals were observed on the cameras is indicated in Table 2. The obvious assumption was made that animals engaging in activities such as feeding, resting, wallowing, drinking and socialising were spending more time in the study area than animals just passing the cameras. These results may differ seasonally, but there is insufficient data from this study to confirm that, and it is possible that more mammal species may utilise the area than that found from the short duration of camera surveys (Table 3). The duiker was included, as they are territorial and not water-dependent animals (meaning that their presence indicates utilisation of the area and not just moving through the area to perhaps reach waterholes), and the civet was included because of the presence of active civetories (i.e. locations of frequent civet defecation) on the catena.
Figure 3 indicates the human visibility (average of six distances in one direction) in the different directions (or angles from the transect line) in each catenal zone surveyed. Because of the vegetation structure, the sodic patch had the highest average visibility, while the transition zone between the upper-midslope and sodic patch had the lowest average visibility, followed by the shrub veld on the footslope. There were differences observed in Figure 3 between the 70 cm and 170 cm observation heights, especially in the riparian zone (T7). Tall, dense grasses, clumps of shrubs, large trees and the presence of the drainage line (with its relatively higher banks than the surrounding area) contributed to lowered visibility in this zone.
During the initial vegetation sampling as part of the large multidisciplinary project, the veld was still in relatively good condition and the vegetation was dense with long grass, especially in the shrub veld and the riparian areas. This changed during 2016, with the extreme drought, not only for the study area, but many other areas in the southern and central KNP were also similarly affected (Malherbe et al. 2020). The visibility changed to an estimated 80% - 100% in different zones of the study area (pers. obs. October 2016) - the grasses that were present were only small tufts grazed down to stubble height. The trees were mostly bare or sparsely leafed and many trees died or were uprooted and damaged by elephants. After the drought in 2016, many of the tall grasses died and were lying flat on the ground (covering the soil - see Janecke 2020). All of this greatly increased the visibility in that area during the last two years of camera data collection.
Discussion
Mammals are usually present in a habitat if their needs and requirements are met or if they move between preferred habitats. With regards to the usual terrestrial mammal habitat requirements, the assumption can be made that the basic needs are most probably accounted for in the study area and surrounds, based on the presence of the listed mammals (Figure 2) as indicated by the definition of habitat (Hall et al. 1997; Krausman & Morrison 2016). There are various reasons why mammal species will be present in or absent from a specific area or catenal zone (see Introduction) and some of these reasons will be focussed on in this section. Food, water, cover (shade, shelter, etc.), space and certain geomorphological characteristics (soil types, topography, geological formations, etc.) are considered to be the basic habitat requirements of most mammals. The medium- to large-sized individual trees (with canopy cover ranging from 10.5% to 33.6%) present on the upper-midslope and in the lower-lying riparian area (Janecke 2020), together with scattered clumps of shrubs and trees, should provide food for herbivores and sufficient shade and shelter from the extreme temperatures associated with savannas. The characteristic granite boulders on small hills or outcrops (geomorphology) in the surrounding area had their own mammal species associated with that habitat which mostly differed from that of the catena (Figure 1).
The nearest drinking water is available to animals at the Sabie River and some of its smaller tributaries, and at three nearby permanent waterholes located in different directions from the study area. The rationale with placing camera traps at the three permanent waterholes was that mammals that were not observed in the study area but were caught at the waterholes are actually present in the local area and might also use the study area from time to time as habitat. Waterbuck, side-striped jackal and banded mongoose were only found at the waterholes and not on the catena or granite hills (Figure 1). There were three large mud wallows in the study area that might have been created by mammals looking for water. It might fill up with rain water, surface run-off, and there is a possibility that water seepage from underground may also play a role (depending on the position of the mud wallow on the catena). Many animals were also observed to drink at these temporary holes when water was present. Water sources are generally crucial components in habitat selection by many water-dependent herbivores, and also for predators like lions. Habitat selection of most herbivores is also influenced by distance to water; hence, predators will have a greater chance of encountering prey in the areas closer to water (Davidson et al. 2012; Gaylard et al. 2003).
The temporary mud wallows contained rain water during the 2015 and 2016 survey periods, but during 2017 no water was present. This might have affected the presence of species on the catena and the number of individuals present during the 2017 observation period. The group numbers of elephant, buffalo, warthog and blue wildebeest were lower in this period (Table 2), possibly as a result of the absence of water in the temporary holes, and also possibly because of obvious food shortages caused by the drought (2015-2017). Mongoose was not observed during 2017, while other smaller-sized mammals like scrub hare, vervet monkey, duiker and steenbok had the lowest number of events (observations). This can be because of various reasons, such as food limitations, the absence of cover (higher visibility to predators) and high temperatures, to name but a few (see Seydack et al. 2012). The number of observations of kudu and giraffe did not change drastically over the survey periods, although it was only a few individuals observed at a time (Table 2).
During the extreme El Niño event of 2015-2017, the study area appeared to be a refuge island of green vegetation surrounded by the desert-like areas around Skukuza and Lower Sabie where mainly bare soil, leafless trees and dead trees were present during the drought (Janecke et al. 2020; Van Aardt et al. 2020). The long-term (76 years) average annual rainfall total for Skukuza is 550.4 mm. During the drought, the cumulative total of rainfall measured at the end of the climatic year (June 2015-July 2016) for the Skukuza area was 194 mm (Skukuza Scientific Services Weather Data). This is lower than the lowest annual rainfall on record (251 mm during 1990-1991 - Zambatis & Biggs 1995) for that area. Staver, Wigley-Coetsee and Botha (2019) concluded that the droughts of 1991-1992 and 2015-2017 were exceptionally severe and that it probably exceeded the tolerance of the grasses. The impact of browsing or grazing across a landscape is differentially affected by the dispersion of herbivores as an agent of heterogeneity, while further controls include the social structure of these animals and their density. Dispersion (and thus the presence or absence in the study area) may also be controlled by the degree of the drought (Pickett et al. 2003). There was still grass available on the catena (although it was grazed to stubble height on most of the sodic patch, but not on the upper-hillslope) and the trees on the catena were alive and full of leaves (pers. obs. April 2016 and visible on the cameras). This can provide an explanation for the presence of the herbivores in the study area at the peak of the drought (Figure 1), where they appeared to be mostly absent from surrounding areas closer to Skukuza.
Hippos were captured on the cameras at the De La Porte and Renosterkoppies waterholes and in the dry drainage line of the study area during 2016, but not during other survey periods (Figure 1). As expected, they seemed to have moved further away from the river in search of food (and possibly other large waterbodies for cooling their body temperature) during the drought period (Table 3). Elephants were observed during the day in 87% of events in 2015, 66% in 2016 and 52% in 2017 (Table 2); giraffe were observed during the day for 73%, 69% and 53% of each of the three survey periods; kudu for 85%, 100% and 55%; and zebra for 86%, 44% and 56% of the survey periods. These changes in their active period might be a way to deal with intensifying heat during the day as the drought progressed, by being more active in cooler periods of the night, or it might be that as more rains were experienced from 2017, the food resources were less scarce and animals could spend less time on feeding and moving in the hot period of the day; however, more long-term research is needed to confirm any of these statements for the catena. White rhino and hippo grazing, together with continuous grazing from other species, and the trampling effect on the soil are important contributors to maintaining the short grass state on grazing lawns. Active dung middens also contribute to the nutrient value of a local area. High-quality forage that is seasonally available on sodic sites may have important consequences for population dynamics and the behaviour of grazers (Grant & Scholes 2006; Jacobs & Naiman 2008; Khomo & Rogers 2005).
Du Toit (2003) stated that grazers concentrate on zones that shift up and down a catenary drainage gradient on a seasonal basis, and they move progressively down the hillslope in the dry season as green grass declines, while they switch back to nutritional swards on the uplands as rains commence. The same pattern is described for browsers, usually resulting in the higher herbivory in riparian areas during the dry season (Du Toit 2003). In the current study, the riparian areas had lower average visibility, and these areas were not frequented by mammals more than other catenal zones at the end of the growing season when the surveys were conducted.
Visibility might affect the presence of herbivores in some of the catenal zones, or parts thereof, because of predation risk and the landscape of fear principles. The presence of carnivores is also affected by visibility in the area because smaller carnivores, as possible prey for larger carnivores, might also experience a landscape of fear in certain areas. Terrain heterogeneity differs over landscapes and a predator is not adapted to hunt skilfully in all types of landscapes. A system can be conceived where the lethality of a predator and predation risk will vary with spatial changes in different habitats. This is described as the landscape of fear: 'a three dimensional landscape whose peaks and valleys are defined by the level of predation risk related to changes in habitat as they affect the lethality of the predator' (Laundre, Hernandez & Ripple 2010:2). The landscape of fear thus reflects the level of fear of predation that a prey will experience in various parts of the area it uses as habitat (Laundre et al. 2010).
Specific areas of the riparian zone proved to have the lowest overall visibility of all the catenal zones, especially for smaller-sized mammals (everything smaller than, and including, a dwarf antelope), because of tall grasses and dense shrubs. Although camera traps were specifically placed on footpaths and open areas where more mammal activity was expected, the lower recorded visibility score (Figure 3) might explain why relatively few observations of mammals were made in the shrub veld and riparian zones (Figure 1). The percentage of the total number of events (observations) in each catenal zone was recorded as follows: 13.3% on the crest and upper-midslope, 19.1% on the sodic patch, 9.0% in the shrub veld on the footslope, 10.7% in the riparian area, 10.5% at mud wallows and the remainder at waterholes (25.2%) and surrounding areas (12.2%). However, these percentages are slightly biased because of different capturing techniques used by the cameras and because of impala that 'camped out' in vicinity of some cameras while feeding and ruminating - increasing the number of events on a single day but spaced out with longer time periods in between (see the definition of 'event' under 'Methods' section).
Lions and leopards are stalk and ambush predators and are expected to be more successful where they can use dense vegetation as concealment for hunting. Lions in Hwange National Park, Zimbabwe, preferred to be located in denser vegetation, next to more open, bushed grassland areas, from where they can observe prey inside the bushed grasslands (Davidson et al. 2012). Trees and bushes are also used by predators when they approach prey, which to a certain extent might counteract a tree's attractiveness to herbivores for feeding and/or resting. Furthermore, areas with high densities in trees, especially trees with low branching heights, are known to be less attractive because of impeded predator visibility (Riginos & Grace 2008; Treydte, Riginos & Jeltsch 2010). In the study area, leopards were observed on the upper-midslope and in the riparian area, while lions were observed on the upper-midslope, sodic patch and riparian area of the catena (Figure 1). They may have similar tendencies in using the denser areas around the sodic patch to observe potential prey, as recorded in the literature, but this assumption has not been researched in the current study and these predators were also observed in other catenal zones.
The vegetation structure and density, together with other factors such as the presence of termite mounds and the higher banks of the drainage line, made visibility poor in certain zones on the catena. This can create a top-down regulation by predators (or their possible presence anticipated by prey) on herbivore numbers and species in these areas, based on landscape of fear principles (see Laundre et al. 2010), especially in riparian areas known to usually have higher grazing value (Du Toit 2003; Naiman & Rogers 1997). Lower observations than expected were made of herbivores in the riparian zone (Figure 1) and only the more open areas were used by animals that were present. Bottom-up controls (vegetation structure, cover and food availability) can also play an equally important role in the presence of mammals. There may be feedbacks present between mammals and vegetation heterogeneity, for example, herbivores selecting open areas in order to reduce exposure to predation risk, which results in them maintaining these areas as open through their grazing and trampling effects (i.e. a positive feedback loop).
Factors that play an important role in controlling species richness on sodic areas specifically are biomass consumption, trampling or hoof action and other activities. To quantify these relationships will enhance the understanding of the mechanistics of herbivores as ecosystem drivers, and also of riparian areas at the bottom of a catena as refuges for biodiversity and as nutrient sinks (Jacobs & Naiman 2008). Localised patches known to have higher nutrient value (sub-canopy habitats, termite mounds and sodic patch), as well as permanent (waterholes) and ephemeral (mud wallows) water sources, were used by herbivores and can also explain their presence in the study area. This article aimed to provide a basic list of mammals present on the catena that might have a role in the functioning and interactions of this heterogeneous ecosystem. A general description was also provided of habitat and habitat features that determine the presence of mammals on the catena. There is scope for future studies on the Southern Granite Supersite to expand on this knowledge and information.
Conclusion
There is nothing obvious that can prohibit movement of animals through the study area, and considering the park has a large surface area catering for various species, the possibility is high that some mammal species, especially the smaller mammals, were not listed. Some species might be present for short periods, or during specific seasons, increasing the heterogeneity of the larger supersite even more than what was found. Furthermore, camera traps do not monitor the entire site, which will further contribute towards under-reporting or entirely missing lower density and transient species. This study at least provided a basic list of 31 mammal species present in the Southern Granite Supersite, and some measure of relative abundance. The more common species were found in almost all catenal zones; thus, the question about certain mammal species that might use specific zones more often could not be answered with this study. Distances between the different catenal zones were relatively short, which made it more difficult to differentiate between utilisation of zones separately. Large and small predators, as well as herbivores of all sizes, were present in the study area, while poor visibility in some areas might explain the absence or lower presence of mammals based on the landscape of fear principles and/or poor detectability. Small changes were also observed in activity periods of specific species between different years of surveys, probably in reaction to the drought.
Differences in species presence between seasons might be because of animals' migration, or localised movement patterns. The extreme drought has changed the vegetation structure and availability of food, which had a pronounced effect on the presence and movement of animals (e.g. hippo appearing at the site during the drought as it grazed further from perennial rivers), but this aspect was not studied specifically. Animals move to areas where their needs are best met, some will move locally in search of food or water, but others might be bound to strict territorial boundaries that restrict their movement to local areas. Future studies can focus on longer periods of data collection and exploring the possible differences in the presence of mammals between seasons. It would also be interesting to study any possible changes in the presence of mammal species in a normal rainfall year after the veld recovered from the impact of the severe 2015-2016 drought.
Acknowledgements
The following people and institutions are acknowledged: The UFS Strategic Research Fund, as well as the NRF Thuthuka Grant for funding the research; Martin Tinneveld for assistance with the checkerboard; Dr Izak Smit from SANParks for his time, guidance and valuable comments on this manuscript; the staff of SANParks Scientific Services for administrative arrangements; the game guards who kept us safe during field work; Dr Tascha Vos for her time, patience and effort with figure and table formatting; and Erneli Steyn for assistance with data processing and literature searches.
Competing interests
The authors declare that they have no financial or personal relationships that may have inappropriately influenced them in writing this article.
Authors' contributions
Both authors were co-responsible for experimental layout, camera trapping, data gathering, data processing and interpretation. B.B.J. was responsible for writing the majority of the article and creating the figures. J.G.B. processed the camera trap data and compiled the tables.
Funding information
The University of the Free State (UFS) Strategic Research Fund largely funded the multidisciplinary project as a whole, including this part of the study; and the National Research Foundation Thuthuka Grant also partially funded this research.
Data availability
Study data are available and may be provided, on request, by the corresponding author. Data from all research done within Kruger National Park is placed within the SANParks repository (not for free, open access).
Disclaimer
The views and opinions expressed in this article are the authors' own and do not necessarily reflect the official policy or position of the institution or funder.
References
Ben-Shahar, R. & Skinner, J.D., 1988, 'Habitat preferences of African ungulates derived by uni- and multivariate analyses', Ecology 69(5), 1479-1485. https://doi.org/10.2307/1941645 [ Links ]
Bissett, C. & Bernard, R.T.F., 2007, 'Habitat selection and feeding ecology of the cheetah (Acinonyx jubatus) in thicket vegetation: Is the cheetah a savanna specialist?', Journal of Zoology 271(3), 310-317. https://doi.org/10.1111/j.1469-7998.2006.00217.x [ Links ]
Bonyongo, C.M., 2005, 'Habitat utilization by impala (Aepyceros melampus) in the Okavango delta', Botswana Notes and Records 37, 227-235. [ Links ]
Bouwer, D., Le Roux, P.A.L. & Van Tol, J., 2020, 'Identification of hydropedological flowpaths in Stevenson-Hamilton catena from soil morphological, chemical and hydraulic properties', Koedoe 62(2), a1584. https://doi.org/10.4102/koedoe.v62i2.1584 [ Links ]
Davidson, Z., Valeix, M., Loveridge, A.J., Hunt, J.E., Johnson, P.J., Madzikanda, H., et al., 2012, 'Environmental determinants of habitat and kill site selection in a large carnivore: Scale matters', Journal of Mammalogy 93(3), 677-685. https://doi.org/10.1644/10-MAMM-A-424.1 [ Links ]
Du Toit, J.T., 2003, 'Large herbivores and savanna heterogeneity', in J.T. Du Toit, K.H. Rogers & H.C. Biggs (eds.), The Kruger experience: Ecology and management of savanna heterogeneity, pp. 292-309, Island Press, Washington, WA. [ Links ]
Gaylard, A., Owen-Smith, N. & Redfern, J., 2003, 'Surface water availability: Implications for heterogeneity and ecosystem processes', in J.T. Du Toit, K.H. Rogers & H.C. Biggs (eds.), The Kruger experience: Ecology and management of savanna heterogeneity, pp. 171-188, Island Press, Washington, WA. [ Links ]
Grant, C.C. & Scholes, M.C., 2006, 'The importance of nutrient hot-spots in the conservation and management of large wild mammalian herbivores in semi-arid savannas', Biological Conservation 130(3), 426-437. https://doi.org/10.1016/j.biocon.2006.01.004 [ Links ]
Grant, R.C.C., Peel, M.J.S., Bezuidenhout, H. & Grant, R., 2011, 'Evaluating herbivore management outcomes and associated vegetation impacts', Koedoe 53(2), 116-130. https://doi.org/10.4102/koedoe.v53i2.1008 [ Links ]
Hall, L.S., Krausman, P.R. & Morrison, M.L., 1997, 'The habitat concept and a plea for standard terminology', Wildlife Society Bulletin 25(1), 173-182. [ Links ]
Hansen, B.B., Herfindal, I., Aanes, R., Sæther, B.E. & Henriksen, S., 2009, 'Functional response in habitat selection and the tradeoffs between foraging niche components in a large herbivore', Oikos 118(6), 859-872. https://doi.org/10.1111/j.1600-0706.2009.17098.x [ Links ]
Jacobs, S.M. & Naiman, R.J., 2008, 'Large African herbivores decrease herbaceous plant biomass while increasing plant species richness in a semi-arid savanna toposequence', Journal of Arid Environments 72(6), 891-903. https://doi.org/10.1016/j.jaridenv.2007.11.015 [ Links ]
Janecke, B.B., 2020, 'Vegetation structure and spatial heterogeneity in the Granite Supersite, Kruger National Park', Koedoe 62(2), a1591. https://doi.org/10.4102/koedoe.v62i2.1591 [ Links ]
Janecke, B.B., 2011, 'A plant based study of the feeding ecology of introduced herbivore game species in the central Free State', PhD thesis, Department of Animal, Wildlife and Grassland Sciences, University of the Free State, Bloemfontein. [ Links ]
Janecke, B.B., Van Tol, J., Smit, I.P.J., Van Aardt, A.C., Riddell, E.S., Seaman, M.T. et al., 2020, 'Biotic and abiotic connections on a granitic catena: Framework for multidisciplinary research', Koedoe 62(2), a1600. https://doi.org/10.4102/koedoe.v62i2.1600 [ Links ]
Johnson, D.H., 1980, 'The comparison of usage and availability measurements for evaluating resource preference', Ecology 61(1), 65-71. https://doi.org/10.2307/1937156 [ Links ]
Joubert, S.C.J., 2016, 'Animal behaviour', in J.d.P. Bothma & J.T. Du Toit (eds.), Game ranch management, pp. 385-392, Van Schaik Publishers, Pretoria. [ Links ]
Khomo, L., Hartshorn, A.S., Rogers, K.H. & Chadwick, O.A., 2011, 'Impact of rainfall and topography on the distribution of clays and major cations in granitic catenas of southern Africa', CATENA 87(1), 119-128. https://doi.org/10.1016/j.catena.2011.05.017 [ Links ]
Khomo, L.M. & Rogers, K.H., 2005, 'Proposed mechanism for the origin of sodic patches in Kruger National Park, South Africa', African Journal of Ecology 43(1), 29-34. https://doi.org/10.1111/j.1365-2028.2004.00532.x [ Links ]
Krausman, P.R. & Morrison, M.L., 2016, 'Another plea for standard terminology: Editor's message', The Journal of Wildlife Management 80(7), 1143-1144. https://doi.org/10.1002/jwmg.21121 [ Links ]
Laundre, J.W., Hernandez, L. & Ripple, W.J., 2010, 'The landscape of fear: Ecological implications of being afraid', The Open Ecology Journal 3(3), 1-7. https://doi.org/10.2174/1874213001003030001 [ Links ]
Malherbe, J., Smit, I., Wessels, K. & Beukes, P., 2020, 'Recent droughts in the Kruger National Park as reflected in the extreme climate index', African Journal of Range and Forage Science, 37(1), 1-17. [ Links ]
Naiman, R.J. & Rogers, K.H., 1997, 'Large animals and system-level characteristics in river corridors', BioScience 47(8), 521-529. https://doi.org/10.2307/1313120 [ Links ]
Owen-Smith, R.N., 2002, Adaptive herbivore ecology - from resources to populations in variable environments, Cambridge University Press, Cambridge. [ Links ]
Pickett, S.T.A., Cadenasso, M.L. & Benning, T.L., 2003, 'Biotic and abiotic variability as key determinants of savanna heterogeneity at multiple spatiotemporal scales', in J.T. du Toit, K.H. Rogers & H.C. Biggs (eds.), The Kruger experience: Ecology and management of savanna heterogeneity, pp. 22-40, Island Press, Washington, WA. [ Links ]
Pieterse, M., 2018, 'The ecology of impala (Aepyceros melampus) in a dystrophic system: A case study from Welgevonden Game Reserve, Limpopo Province, South Africa', MSc dissertation, School of Natural Resource Management, Nelson Mandela Metropolitan University, George. [ Links ]
Riginos, C. & Grace, J.B., 2008, 'Savanna tree density, herbivores, and the herbaceous community: Bottom-up vs top-down effects', Ecology 89(8), 2228-2238. https://doi.org/10.1890/07-1250.1 [ Links ]
Seydack, A.H., Grant, C.C., Smit, I.P., Vermeulen, W.J., Baard, J. & Zambatis, N., 2012, 'Climate and vegetation in a semi-arid savanna: Development of a climate-vegetation response model linking plant metabolic performance to climate and the effects on forage availability for large herbivores', Koedoe 54(1), Art. #1046, 12 pages. http://dx.doi.org/10.4102/koedoe.v54i1.1046 [ Links ]
Smit, I.P.J., Riddell, E.S., Cullum, C. & Petersen, R., 2013, 'Kruger National Park research supersites: Establishing long-term research sites for cross-disciplinary, multiscaled learning', Koedoe 55(1), Art. #1107, 7 pages. http://dx.doi.org/10.4102/koedoe.v55i1.1107 [ Links ]
Staver, A.C., Wigley-Coetsee, C. & Botha, J., 2019, 'Grazer movements exacerbate grass declines during drought in an African savanna', Journal of Ecology 107(3), 1482-1491. https://doi.org/10.1111/1365-2745.13106 [ Links ]
Theron, E.J., Van Aardt, A.C. & Du Preez, P.J., 2020, 'Vegetation distribution along a granite catena, southern Kruger National Park', Koedoe 62(2), a1588. https://doi.org/10.4102/koedoe.v62i2.1588 [ Links ]
Treydte, A.C., Riginos, C. & Jeltsch, F., 2010, 'Enhanced use of beneath-canopy vegetation by grazing ungulates in African savannahs', Journal of Arid Environments 74(12), 1597-1603. https://doi.org/10.1016/j.jaridenv.2010.07.003 [ Links ]
Van Aardt, A.C., Codron, D., Theron, E. & Du Preez, P.J., 2020, 'Plant community structure and vegetation changes after drought on a granite catena in the Kruger National Park, South Africa', Koedoe 62(2), a1585. https://doi.org/10.4102/koedoe.v62i2.1585 [ Links ]
Weil, R.R. & Brady, N.C., 2016, The nature and properties of soils, 15th edn., Pearson Education Limited, Harlow. [ Links ]
Zambatis, N. & Biggs, H.C., 1995, 'Rainfall and temperatures during the 1991/92 drought in the Kruger National Park', Koedoe 38(1), 1-16. https://doi.org/10.4102/koedoe.v38i1.301 [ Links ]
Correspondence:
Beanelri B. Janecke
janeckbb@ufs.ac.za
Received: 13 Sept. 2019
Accepted: 19 Apr. 2020
Published: 29 Oct. 2020
SHORT COMMUNICATION
First report of various Fusarium species from the Stevenson-Hamilton Supersite granite catena system in the Kruger National Park, South Africa
Marieka GryzenhoutI; Marcele VermeulenII; Gilmore PambukaI; Riana JacobsIII
IDepartment of Genetics, Faculty of Natural and Agricultural Science, University of the Free State, Bloemfontein, South Africa
IIDepartment of Microbial Biochemical and Food Biotechnology, Faculty of Natural and Agricultural Science, University of the Free State, Bloemfontein, South Africa
IIIDepartment of Mycology Unit, Plant Health and Protection, Agricultural Research Council, Pretoria, South Africa
Keywords: Fusarium; Neocosmospora; Kruger National Park; Topsoil; Rhizosphere; Catena.
Introduction
The Kruger National Park (KNP) covers the north-eastern part of southern Africa (Carruthers 2017) and is also linked with the Gonarezhou National Park (Zimbabwe) and the Limpopo National Park (Mozambique) as the Great Limpopo Transfrontier Park. The KNP is part of the Kruger to Canyons Biosphere area designated by the United Nations Educational, Scientific and Cultural Organization (UNESCO) as an International Man and Biosphere Reserve (the 'Biosphere') (http://www.unesco.org/new/en/natural-sciences/environment/ecological-sciences/biosphere-reserves/africa/south-africa/kruger-to-canyons/). The Stevenson-Hamilton Supersite, where this study was conducted, is part of four research 'supersites' in the KNP, with each representing distinct geological, climatic and linked biodiversity patterns (Smit et al. 2013).
The foundational biological information regarding soil biota in South Africa was recently assessed, and it included soil fungi (Janion-Scheepers et al. 2016). These authors reported that despite South Africa being only 0.8% of the earth's terrestrial area, it contains nearly 1.8% of the world's described soil species. Areas such as the Nama-Karoo, Northern Cape and Eastern Cape are undersampled for most taxa as well as natural soils in biodiversity hotspots. Similarly, the KNP with its diverse ecosystems is not well explored.
The fungal genus Fusarium has a cosmopolitan distribution and includes a vast number of species. These species are commonly recovered from a variety of substrates including soil, air, water and decaying plant materials (Leslie & Summerell 2006). They have diverse ecosystem functions in soils and are also able to colonise living tissues of plants and animals, including humans, acting as endophytes (microbial organisms existing inside plant tissues), secondary invaders or becoming devastating plant pathogens (Nelson, Dignani & Anaissie 1994). In addition to their ability to colonise a multiplicity of habitats, Fusarium species are present in almost any ecosystem in the world (Leslie & Summerell 2006).
A number of genera representing previously known Fusarium species were established based on deoxyribonucleic acid (DNA) sequence data (Lombard et al. 2015). For instance, the Fusarium solani species complex (FSSC) was proposed to be the genus Neocosmospora (Lombard et al. 2015). However, because of the close association with the name Fusarium and the fact that these names serve a large community of end-users, that is, plant pathologists, quarantine officers, veterinarians and medical practitioners, a different system was proposed where the name Fusarium was kept, for instance, for the FSSC (Geiser et al. 2013). The resulting confusion is evident as a number of new species in the complex kept the name of Fusarium, for example, F. euwallaceae (Freeman et al. 2014), which is the pathogenic fungus associated with the devastating polyphagous Shothole Borer. These taxa are usually included in Fusarium research.
A multidisciplinary study was conducted in the KNP to study the structure and biodiversity, and the various possible biotic and abiotic interactions of a catena or hill slope ecosystem on the Stevenson-Hamilton Supersite (25°06'28.6S, 31°34'41.9E and 25°06'25.7S, 31°34'33.7E). The aim of this study was to establish a baseline on the species diversity of Fusarium occurring at the particular supersite in order to possibly use species in Fusarium and closely related genera, which include specialised and generalist species, as a possible focus group to study interactions with the various biotic and abiotic factors in the catena system.
Previous studies have already described five new species with representative isolates from the KNP. These included F. nygamai (Burgess & Trimboli 1986) and F. fredkrugeri (Sandoval-Denis et al. 2018) in the FFSC, F. polyphialidicum (Marasas et al. 1986) in the Fusarium concolor species complex (FCOSC), F. convolutans in the Fusarium buharicum species complex (FBSC) and F. transvaalense in the Fusarium sambucinum species complex (FSaSC) from soils (Sandoval-Denis et al. 2018). Jacobs-Venter et al. (2018a) separated F. polyphialidicum strains into three species, namely F. concolor, F. babinda and F. austroafricanum, and confirmed that F. polyphialidicum is synonymous with F. concolor. F. fredkrugeri, F. convolutans and F. transvaalense originated from the Stevenson-Hamilton Supersite.
In this study, soil and rhizosphere samples from various plants in the Stevenson-Hamilton Supersite, which has a distinct geology and hydrology, were obtained. Isolations from these samples revealed a large collection of Fusarium isolates. The aim of this study was to identify these fusaria. As information on microbes, including fungi, is scarce for the KNP, and basically non-existent for the supersite, the study will contribute pioneering and invaluable biodiversity data on these ill-studied organisms that will be informative and useful for the management and conservation of the KNP.
Materials and methods
Sampling
The study was conducted in the Southern Granites 'Supersite' catena close to the Stevenson-Hamilton Memorial (Smit et al. 2013). Four random soil samples to a depth of 5 cm were taken for each of the components of the catena system in a transect of more or less 500 m following Theron, Van Aardt and Du Preez (2020). Furthermore, roots of Pogonarthria squarrosa (sickle grass, Poaceae, Poales), Sporobolus nitens (curly leaved drop seed grass, Poaceae) and Schkuhria pinnata (dwarf marigold, Asteraceae, Asterales), which included some of the dominant plants in the catena (Theron et al. 2020), were collected. Topsoil was deliberately included with the assumption that the soils will contain soil-associated fusaria as well as spores that were aerially distributed from plants in the area. The soils were transported cold to the laboratory, where soil dilution series were made on Rose Bengal-glycerine-urea medium (Leslie & Summerell 2006) and 20% potato dextrose agar (PDA; Biolab, Merck, South Africa). Roots were suspended in sterile water and shaken, and the soil solution was then used in a dilution series. Colonies resembling the cultural morphotypes of Fusarium species were purified from the primary plates by making single spore cultures from colonies on SNA medium (Leslie & Summerell 2011). Cultures were deposited in the National Collection of Fungi (PREM), Biosystematics Division, Agricultural Research Council (ARC), Pretoria, South Africa (Table 1).
Deoxyribonucleic acid sequence-based characterisation
Inqaba Biotec (Pretoria, South Africa) extracted DNA from the scraped mycelium of 1-week-old cultures grown on PDA, and the translation elongation factor 1α gene region (TEF1α) was amplified and sequenced using primers EF1 and EF2 (O'Donnell et al. 2008). Sequences obtained were viewed and edited with Geneious 7.1.9 (Biomatter, Auckland).
Sequences were grouped into Fusarium species complexes using a skeleton sequence data set representing all species complexes in Fusarium and genera previously named as Fusarium, as well as species grouping outside species complexes (data not shown). After the appropriate complex or closest related species has been identified, sequences were included in separate DNA data sets representing all known and vouchered sequences of the particular group or complex. All alignments were performed in Mafft 7.0 (http://mafft.cbrc.jp/alignment/software/) with the L-INS-I option selected (Katoh et al. 2005). The alignments were corrected manually where needed.
Representative sequences with a high identity to the FFSC were aligned with all currently recognised species and phylogenetic lineages in the FFSC (Edwards et al. 2016; Geiser et al. 2013; Herron et al. 2015; Moroti et al. 2016). Similarly representative sequences with a high identity to the Fusarium chlamydosporum species complex (FCSC) (Lombard et al. 2019a; O'Donnell et al. 2009b) and Fusarium oxysporum species complex (FOSC) (Laurence et al. 2014; Lombard et al. 2019b; O'Donnell et al. 2009a) were aligned in data sets linked to the listed references. Sequences of the FSSC (O'Donnell et al. 2008) that are now known as Neocosmospora (Lombard et al. 2015) were also used. Maximum likelihood analyses were conducted in MEGA v. 7 using the models assigned to each data set and with a 1000 Bootstrap replicates to determine the support of the branches.
Ethical considerations
Ethical approval for the multidisciplinary project as a whole was obtained from the Interfaculty Animal Ethics Committee at the University of the Free State (UFS-AED2019/0121). SANParks permit numbers for collection of soil for lab analyses and vegetation for identification purposes are SK069, SK2095 and SK054.
Results
Deoxyribonucleic acid sequence-based characterisation
Isolates (109) characterised in this study from the catena system represented four species complexes, namely FFSC, FCSC, FSSC and FOSC, and originated from the rhizospheres of all three plants and the topsoil (Table 1). Each of these complexes includes a diversity of species. In the FFSC, isolate PPRI 20296 was identified as F. proliferatum (Bootstrap support 98%), and isolates PPRI 20281 and PPRI 201306 were identified as F. nygamai (Bootstrap support 97%) (Figure 1). Isolates PPRI 20610, PPRI 19535 and PPRI 19537 were grouped in the clade of N. vasinfecta (Figure 2) in the FSSC (Bootstrap support of 97%) and grouped into two haplotype groups. Isolates from the KNP that were grouped in the FCSC (Table 1) constituted a very large number of isolates that did not group with any of the previously known lineages or newly described species (Figure 3). Between-isolate variation seven haplotypes was seen that could be indicative of more possible cryptic species or significant population structure. Based on the TEF sequence data alone, all of the novel species described (Lombard et al. 2019a) in the FOSC could not be resolved but isolates (Table 1) formed four haplotypes that grouped together with F. callistephi and F. fabacearum, and isolates from Australia (Figure 4).
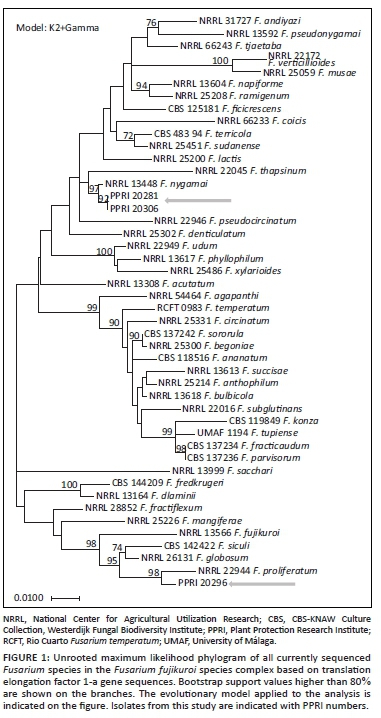
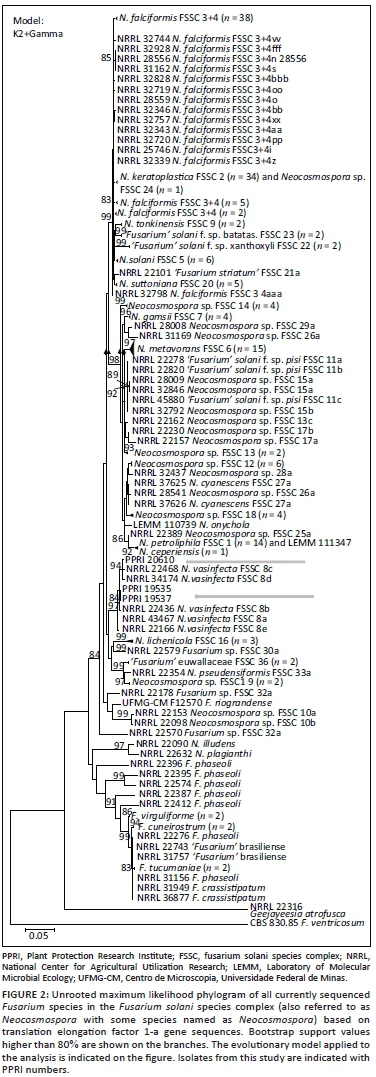
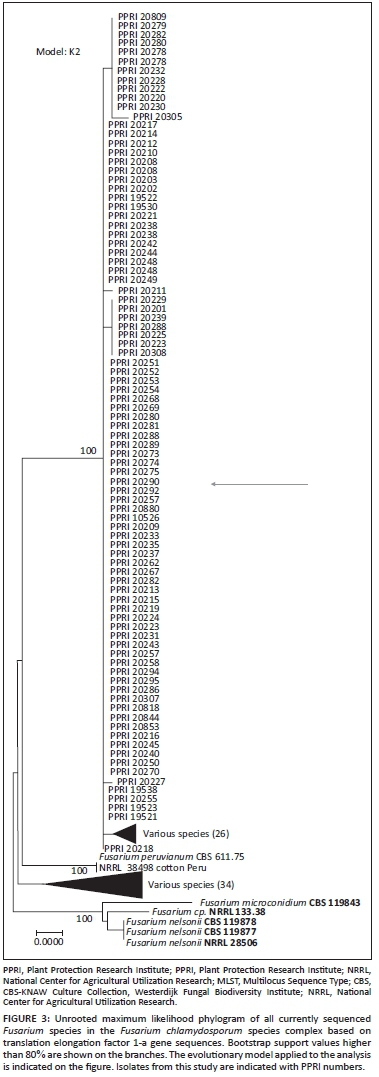
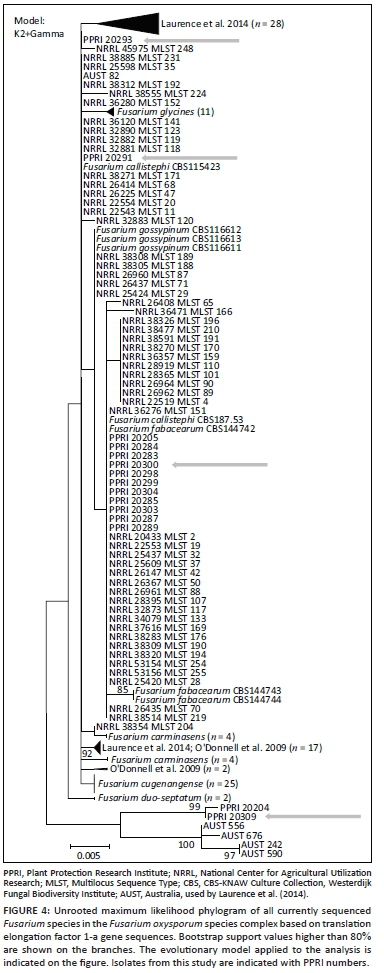
Discussion
This study represents the first report of F. proliferatum (FFSC), N. vasinfectum that was previously known as F. cosmosporiellum in the FSSC (Geiser et al. 2013) and F. oxysporum sensu lato (FOSC) from soils in the Stevenson-Hamilton Granite Supersite in the KNP. Possible new species in the FCSC were also detected. The presence of F. nygamai (FFSC) was confirmed. Together with other species previously described from the KNP (F. fredkrugeri, F. convalutum, F. transvaalense and F. concolor as F. polyphialidicum), there are thus at least nine Fusarium species present in the KNP.
Fusarium nygamai, F. proliferatum, F. oxysporum sensu lato, F. chlamydosporum, N. vasinfectum and F. concolor are species that have a world-wide occurrence, including South Africa (Jacobs et al. 2018a; Leslie & Summerell 2006). They are associated with various plant hosts as well as soils and can also produce mycotoxins in food commodities or be associated with diseases of animals or humans (Leslie & Summerell 2006). The new species F. fredkrugeri, F. convalutum and F. transvaalense have only recently been described and have most likely not yet been discovered elsewhere. Because these species are generalists that can be isolated from various substrates and plant hosts, these species most likely are not suitable to represent a target group to study unique species associations within a catena system.
The majority of strains (90) obtained from the KNP sample sites belonged to F. chlamydosporum species complex. A four-locus typing scheme (O'Donnell et al. 2009b) revealed MLST and species within the species complex, and Lombard et al. (2019a) recently published the description of numerous new species in the complex. Isolates obtained from this study appear to represent new species. As before, a number of new species from the KNP are yet to be described.
What is notable is that several undescribed Fusarium species have been discovered in the KNP. Previously, F. nygamai, F. polyphialidicum, F. fredkrugeri, F. convalutum and F. transvaalense were described from the KNP, while possible new species have also been characterised in this study. Since their description, F. nygamai and F. concolor (also as the synonym F. polyphialidicum) have been discovered from across the world (Leslie & Summerell 2006), suggesting a wide substrate, host and geographical range despite being first described from a national conservation park in South Africa. The number of undescribed species of Fusarium in the KNP is not surprising because the biodiversity of Fusarium and closely allied genera that were previously called Fusarium is largely untouched. This is especially so in pristine natural areas (Jacobs et al. 2018b), because most Fusarium research in South Africa is focused on agricultural problems or animal and human health issues caused by Fusarium species.
Conclusion
The KNP plays an important role in not only protecting the native ecosystems present in that area and the animals and plants they contain but also protecting Fusarium species that occur in South Africa, of which some are new to science. The ecological roles of these species in numerous ecosystems are, however, still unknown, and further studies on their impact on ecosystem services and function must be pursued. Such studies are important because Gryzenhout et al. (2020) showed through environmental sequencing that Fusarium species are one of the dominant groups found within the soil-plant root zones of plants occurring in the Stevenson-Hamilton Granite Supersite. Further sequencing of additional genes, as what has been done in this study, will provide a better estimation on species level of the species that could be involved.
Acknowledgements
The authors thank the University of the Free State Strategic Research Fund for providing funding for this research, SANParks Scientific Services for their assistance during field sampling, Dr Beanelri Janecke for her leadership in the project and the rest of the research team for their insights. The authors are grateful to Mrs Grace Kwanda (ARC, Pretoria) for her patience and assistance during the submission of the fungal cultures to the National Collection of Fungi. Mr E. Theron and Profs. Johan du Preez and Piet le Roux (UFS) are thanked for the provision of soil and plant samples.
Competing interests
The authors declare that they have no financial or personal relationships that may have inappropriately influenced them in writing this article.
Authors' contributions
The authors directly participated in the study design, execution and interpretation of the research. All authors contributed equally to this research work.
Funding information
This study was funded by the University of the Free State under the 'Multi-disciplinary Program'.
Data availability
Data are available from the corresponding author on request.
Disclaimer
The views and opinions expressed in this article are those of the authors and do not necessarily reflect the official policy or position of any affiliate agency of the authors.
References
Burgess, L.W. & Trimboli, D., 1986, 'Characterization and distribution of Fusarium nygamai, sp. nov.', Mycologia 78(2), 223-229. https://doi.org/10.1080/00275514.1986.12025233 [ Links ]
Carruthers, J., 2017, National Park Science: A century of research in South Africa, Cambridge University Press, Cambridge. [ Links ]
Edwards, J., Auer, D., De Alwis, SK., Summerell, B., Aoki, T., Proctor, R.H. et al., 2016, 'Fusarium agapanthi sp. nov, a novel bikaverin and fusarubin-producing leaf and stem spot pathogen of Agapanthus praecox (African lily) from Australia and Italy', Mycologia 15(2), 333. https://doi.org/10.3852/15-333 [ Links ]
Freeman, S., Sharon, M., Maymon, M., Mendel, Z., Protasov, A., Aoki, T. et al., 2014, 'Fusarium euwallaceae sp. nov. - A symbiotic fungus of Euwallacea sp., an invasive ambrosia beetle in Israel and California', Mycologia 105(6), 1595-1606. https://doi.org/10.3852/13-066 [ Links ]
Geiser, D.M., Aoki, T., Bacon, C.E., Baker, S.E., Bhattacharyya, M.K., Brandt, M.E. et al., 2013, 'One fungus, one name: Defining the genus Fusarium in a scientifically robust way that preserves longstanding use', Phytopathology 103(5), 400-408. https://doi.org/10.1094/PHYTO-07-12-0150-LE [ Links ]
Gryzenhout, M., Cason, E.D., Vermeulen, M., Kloppers, G.A.E., Bailey, B. & Ghosh, S., 2020, 'Fungal community structure variability between the root rhizosphere and endosphere in a granite catena system in the Kruger National Park, South Africa', Koedoe 62(2), a1597. https://doi.org/10.4102/koedoe.v62i2.1597 [ Links ]
Herron, D.A., Wingfield, M.J., Wingfield, B.D., Rodas, C.A., Marincowitz, S. & Steenkamp, E.T., 2015, 'Novel taxa in the Fusarium fujikuroi species complex from Pinus spp.', Studies in Mycology 80, 131-150. https://doi.org/10.1016/j.simyco.2014.12.001 [ Links ]
Jacobs, A., Laraba, I., Geiser, D.M., Busman, M., Vaughan, M.M. & Proctor, R.H., 2018a, 'Molecular systematics of two sister clades, the Fusarium concolor and F. babinda species complexes, and the discovery of a novel microcycle macroconidium-producing species from South Africa', Mycologia 110(6), 1189-1204. https://doi.org/10.1080/00275514.2018.1526619 [ Links ]
Jacobs, A., Mojela, L., Summerell, B. & Venter, E., 2018b, 'Characterisation of members of the Fusarium incarnatum-equiseti species complex from undisturbed soils in South Africa', Antonie van Leeuwenhoek 111, 1999-2008. https://doi.org/10.1007/s10482-018-1093-x [ Links ]
Janion-Scheepers, C., Measey, J., Braschler, B., Chown, S.L., Coetzee, L., Colville, J.F. et al., 2016, 'Soil biota in a megadiverse country: Current knowledge and future research directions in South Africa', Pedobiologia 59(3), 129-174. https://doi.org/10.1016/j.pedobi.2016.03.004 [ Links ]
Katoh, K., Kuma, K., Toh, H. & Miyata, T., 2005, 'MAFFT version 5: Improvement in accuracy of multiple sequence alignment', Nucleic Acids Research 33(2), 511-518. https://doi.org/10.1093/nar/gki198 [ Links ]
Laurence, M.H., Summerell, B.A., Burgess, L.W. & Liew, E.C.Y, 2014, 'Genealogical concordance phylogenetic species recognition in the Fusarium oxysporum species complex', Fungal Biology 118(4), 374-384. https://doi.org/10.1016/j.funbio.2014.02.002 [ Links ]
Leslie, J.F. & Summerell, B.A., 2006, The Fusarium laboratory manual, Blackwell Publications, Ames. [ Links ]
Lombard, L., Van der Merwe, N.A. & Groenewald, J.Z., 2015, 'Generic concepts in Nectriaceae', Studies in Mycology 80, 189-245. https://doi.org/10.1016/j.simyco.2014.12.002 [ Links ]
Lombard, L.A., Van Doorn, R. & Crous, P.W., 2019a, 'Neotypification of Fusarium chlamydosporum - A reappraisal of a clinically important species complex', Fungal Systematics and Evolution 4(1), 183-204. https://doi.org/10.3114/fuse.2019.04.10 [ Links ]
Lombard, L., Sandoval-Denis, M., Lamprecht, S.C. & Crous, P.W., 2019b, 'Epitypification of Fusarium oxysporum - Clearing the taxonomic chaos', Persoonia 43, 1-47. https://doi.org/10.3767/persoonia.2019.43.01 [ Links ]
Marasas, W.F.O., Nelson, P.E., Tousson, T.A. & Van Wyk, P.W., 1986, 'Fusarium polyphialidicum, a new species from South Africa', Mycologia 78(4), 678-682. https://doi.org/10.1080/00275514.1986.12025306 [ Links ]
Moroti, R.V., Gheorghita, V., Al-Hatmi, A.M.S., De Hoog, G.S., Meis, J.F. & Netea, M.G., 2016, 'Fusarium ramigenum, a novel human opportunist in a patient with common variable immunodeficiency and cellular immune defects: Case report', BMC Infectious Diseases 16, 79. https://doi.org/10.1186/s12879-016-1382-9 [ Links ]
Nelson, P.E., Dignani, M.C. & Anaissie, E.J., 1994, 'Taxonomy, biology, and clinical aspects of Fusarium species', Clinical Microbiology Reviews 7(4), 479-504. https://doi.org/10.1128/CMR.7.4.479-504.1994 [ Links ]
O'Donnell, K., Gueidan, C., Sink, S. & Johnston, P.S., 2009a, 'A two-locus DNA sequence database for typing plant and human pathogens within the Fusarium oxysporum species complex', Fungal Genetics and Biology 46(12), 936-948. https://doi.org/10.1016/j.fgb.2009.08.006 [ Links ]
O'Donnell, K., Sutton, D.A., Rinaldi, M.G., Gueidan, C., Crous, P.W. & Geiser, D.M., 2009b, 'Novel multilocus sequence typing scheme reveals high genetic diversity of human pathogenic members of the Fusarium incarnatum-F. equiseti and F. chlamydosporum species complexes within the United States', Journal of Clinical Microbiology 47(12), 3851-3861. https://doi.org/10.1128/JCM.01616-09 [ Links ]
O'Donnell, K., Sutton, D.A., Fothergill, A., McCarthy, D., Rinaldi, M.G., Brandt, M.E. et al., 2008, 'Molecular phylogenetic diversity, multilocus haplotype nomenclature, and in vitro antifungal resistance within the Fusarium solani species complex', Journal of Clinical Microbiology 46(8), 2477-2490. https://doi.org/10.1128/JCM.02371-07 [ Links ]
Sandoval-Denis, M., Swart, W.J. & Crous, P.W., 2018, 'New Fusarium species from the Kruger National Park, South Africa', MycoKeys 34, 63-92. https://doi.org/10.3897/mycokeys.34.25974 [ Links ]
Smit, I.P.J., Riddell, E.S., Cullum, C. & Petersen, R., 2013, 'Kruger National Park research supersites: Establishing long-term research sites for cross-disciplinary, multiscaled learning', Koedoe 55(1), 1-7. https://doi.org/10.4102/koedoe.v55i1.1107 [ Links ]
Theron, E.J., Van Aardt, A.C. & Du Preez, P.J., 2020, 'Vegetation distribution along a granite catena, southern Kruger National Park, South Africa', Koedoe 62(2), a1588. https://doi.org/10.4102/koedoe.v62i2.1588 [ Links ]
Correspondence:
Marieka Gryzenhout
gryzenhoutm@ufs.ac.za
Received: 28 Sept. 2019
Accepted: 19 Apr. 2020
Published: 29 Oct. 2020
ESSAY
Integrating multi-scaled and multidisciplinary studies: A critical reflection on the Kruger National Park research supersites
Izak P.J. SmitI, II
IScientific Services, South African National Parks, Skukuza, South Africa
IICentre for African Ecology, School of Animal, Plant and Environmental Sciences, University of the Witwatersrand, Johannesburg, South Africa
ABSTRACT
The Kruger National Park (KNP) research supersites were designed to encourage place-based research in order to geographically focus research activities on known and well described study sites as opposed to ad hoc site selection practiced previously. This was done by (i) delineating sites using a clear rationale, (ii) providing basic meta-data for these sites, and (iii) actively encouraging scientists to conduct research on these sites and share data freely. The underlying concept was that geographically focused research would facilitate data and knowledge exchanges and lead to long-term, multi-scaled and cross-disciplinary studies at these data-rich sites, facilitating an integrated and collectively developed understanding that would be hard to achieve otherwise.
This essay acts as a short-term reflection on the KNP supersites and an introductory text for the special issue focusing on the outcomes from a multi-disciplinary study conducted on the southern granitic supersite. It starts off by briefly introducing the supersite concept, followed by a reflection on the achievements and challenges towards achieving the main objectives of the supersites. In addition, and as part of the "data-begets-data" philosophy underlying the supersites (i.e positive feedback of place-based data attracting further research and hence collection of further data), updated lists of references and available datasets are provided.
CONSERVATION IMPLICATIONS: This paper highlights the successes and challenges of geographically focusing research in the KNP to the research supersites in order to facilitate integrative and multi-scaled learning in savanna systems. It also provides updated lists of references and available datasets to further stimulate research at these sites
Keywords: Long-term ecological research sites (LTERS); Monitoring; Multidisciplinary studies; Integrative studies; Research supersites.
Introduction
Over the years, the Kruger National Park (KNP) has established a reputation as an 'outdoor laboratory', and has registered more than 700 research projects between 2005 and 2016, and published 556 papers between 2003 and 2013, both by in-house scientists and external collaborators from around the world (Smit et al. 2017; Van Wilgen et al. 2016). As a result, the park has become one of the most studied savanna conservation areas in Africa (Smit et al. 2017). Many of these studies have focussed on specific experimental sites where underlying drivers are manipulated, for example, herbivore exclosures (e.g. Asner et al. 2009) or plots where fire regimes have been manipulated (e.g. Higgins et al. 2007). However, for many projects that aim to study or monitor patterns and processes emerging under non-manipulated conditions, sites were selected in a haphazard and uncoordinated manner and, as a consequence, because of underlying heterogeneity, it was often hard to integrate data sets and knowledge across these disparate sites. In an attempt to geographically focus research effort and allow data integration over time and across themes, the 'KNP research supersites' was conceptualised. It was envisaged that through establishing these areas, some geographic focussing of research would be achieved with these sites increasingly acting as data-rich, long-term sites for monitoring and research. In many respects, the KNP supersites have objectives similar to long-term ecological research sites (LTERS) (e.g. Gosz, Waide & Magnuson 2010; Mirtl et al. 2018). The four KNP research supersites that cover the rainfall gradient (lower rainfall northern KNP and higher rainfall southern KNP) and geological contrast (basalt in east and granite in west) were formally introduced to the scientific community by Smit et al. (2013) who described the rationale, selection criteria and location of the sites, and introduced existing data sets describing environmental variables for each of these sites. The supersites' conceptualisation and delineation process started earlier (around 2011).
Six years after formally introducing the supersites and coinciding with this Special Issue focussing on a multidisciplinary project on the southern granitic supersite (Stevenson-Hamilton supersite), it is an opportune time to reflect on the successes of the KNP research supersites, the shortcomings and possible ways to further increase the value of these sites going forward. It is hoped that this reflection will also be useful for other situations where long-term research sites are being established. This essay will also act as a valuable reference document by providing consolidated and updated lists of research outputs and data sets (Online Appendix 1 - Online Appendix 3).
Research outputs from Kruger National Park research supersites (up to August 2019)
Since establishment, four Honours, four Master's and two PhDs have been completed on the supersites (Online Appendix 1). In addition, 24 peer reviewed articles (11 as part of this Special Issue, excluding this essay); two scientific reports; one book chapter; and one peer-reviewed conference proceeding have been published based on work fully or mostly conducted on the supersites (Online Appendix 1). Considering the relatively short existence of the supersites, the research outputs compare favourably to the number of research outputs associated with the KNP's well-established experimental burn plots (EBPs) that have been in existence since the 1950s (by June 2020, there were 79 papers published on the EBPs - Tercia Strydom [South African National Parks] pers. comm., 19 June 2020). The Skukuza flux tower is another example of place-based research in the KNP, linked to specialised equipment, which has attracted research attention and has been used as a study site for a range of studies (e.g. Majozi et al. 2017). It is also expected that as the supersites become better known and more data were accumulated, research at these sites will be further stimulated. It is anticipated that this Special Issue, which reports on integrative learning happening at the southern granitic supersite across a range of disciplines, will also advance the profile and increase the understanding of these sites, and will act as a further catalyst for stimulating research interest. Online Appendix 2 provides a list of a diverse range of papers and dissertations/theses known to the author that cite the supersites or make a reference to the KNP supersites concept, reflecting also on the broader impact the KNP supersites had in recent years.
Effectiveness of Kruger National Park research supersites in achieving original objectives
The following sections highlight six of the original objectives of the KNP research supersites and reflect on the effectiveness of the sites in achieving these objectives.
Objective 1: Attracting and geographically focussing research to established and well-described study sites
Based on a subjective assessment, it seems as if the KNP research supersites have, at least partially, managed to become geographical focal areas for research within the KNP. This geographical focus of studies makes it easier to integrate data sets or infer conditions between studies. The initial Smit et al. (2013) paper, which introduced the supersites concept, delineated the sites and provided a backbone of metadata that has proven valuable as a reference document for studies conducted on the supersites ever since. Most of the studies that have been conducted on the supersites refer to and cite this paper, as it provides a finer-scale description of the supersites than most other study site references that are usually available only at the regional or park-wide scale.
A comment that was raised by critics during the initial phases of delineation of the supersites was that the 'ideal' location of the supersites would be highly dependent on the specific objectives of each study, and that it would be hard to select sites that would 'fit-all'. Although this was acknowledged, the idea was never to optimise the supersites for a specific application but rather to delineate sites based on 'generic' principles and to make them potentially useful for a wide range of studies. As such, the final sites were selected based on a delineation of nested first- to third-order catchments entirely embedded within a single geology, across the rainfall gradient (north and south of park) and contrasting the geological divide (basalt and granite) in order to represent the dominant abiotic drivers in a nested hierarchy. Secondly, these sites had to adhere to some logistical criteria as well (e.g. close to research accommodation, accessible by all-weather roads from multiple directions and outside wilderness zones in order to allow instrumentation). As such, it is encouraging to note that the final supersite locations have proven suitable for a suite of themes, including studies on different taxonomic groups (vegetation, microbes, aquatic invertebrates, small mammals, bats, birds, and large mammals), abiotic patterns and processes (geology, soils, topography and hydrology) and development and use of technology (remote sensing) (see focal themes in Online Appendix 1).
Objective 2: Promoting integrated understanding across multiple disciplines and scales
Although there was some cross reference and data sharing within and between hydrological and geological/soil studies, it was apparent that many studies did not integrate with other studies nor were they following a multidisciplinary approach. This is probably to be expected as studies considering very dissimilar taxa or processes and at very different scales would not have obvious and direct linkages or these linkages may not be fully appreciated. Also, science is often still approached using traditional discipline and specialist focal areas, with cross-disciplinary studies still in the minority. The multidisciplinary project conducted by the University of the Free State, and on which this Special Issue focusses, is an example where some level of coordination and integration has happened during the initial project design phase, continued through coordinated and spatiotemporally aligned field campaigns, and ultimately resulted in integrative dissemination (this Special Issue). Furthermore, some papers in this Special Issue attempt to make explicit the links between how the abiotic patterns (soils, geology and topography) influence the abiotic processes (hydrology, soil chemistry), ultimately giving rise to the biotic communities responding to the resulting heterogeneity (vegetation, large mammals, aquatic invertebrates and microbes). This project involved eight principal researchers representing six different departments (Soil Sciences, Groundwater Studies, Plant Sciences, Wildlife Sciences, Environmental Sciences and Microbiology), doing collective fieldwork campaigns and sharing ideas and data across disciplinary boundaries. Janecke et al. (2020) (co-authored by all principle investigators from diverse disciplines) makes a concerted effort to not only summarise but to some degree also integrate between the different studies conducted as part of this project, providing a conceptual framework for biotic and abiotic interactions and feedbacks.
Objective 3: Promoting free sharing of data
The supersites concept aims to leverage the 'data-begets-data' principle, and for this to function optimally, free sharing and easy accessibility of data are critical. This has been partially successful with the supersites, with data and metadata being archived on a centrally managed South African National Parks data repository.1 However, various challenges were also experienced in this regard. Some researchers were not allowed or prepared to share data because of a range of reasons (e.g. restrictions linked to funding bodies). In other cases, researchers failed to respond to requests to share data, and KNP project coordinators were not effective in following up to ensure all data were appropriately archived. Another challenge is that in some cases data got shared and centrally archived, but search terms were ineffective for the data to be associated with the supersites, reducing the likelihood of other researchers working on the supersites being aware of the existence of the data. Online Appendix 3 provides a list of data sets and key reports currently available for the supersites and also indicates for which supersites the respective data sets are available.
Objective 4: Comparing abiotic contrasts
It was initially hoped that studies would collect and compare data across all four supersites in order to better understand the role of rainfall gradients and disparate geologies. This has proven problematic from the start - most of the studies focus only on one of the two southern supersites. This Special Issue is a point in case, focussing only on one of the four supersites. This is inter alia because of the fact that the southern supersites are in close proximity to Skukuza (the main research hub of KNP and also the closest supersite to reach from most universities, with the northern supersites adding another day of travelling), and these sites have higher rainfall, deeper soils, more heterogeneity and higher levels of biodiversity. This is further compounded by the financial implications of repeating fieldwork at all supersites. With the exception of remote sensing studies and one geology study, all of the studies in Online Appendix 1 were conducted on the southern supersites. As such, the northern sites (which represent about half of the KNP abiotic template) have not received any notable research attention. It is anticipated that the knowledge and data disparities between the southern and northern supersites will continue to increase. Although not a problem per se, it is foreseen that this gap will increasingly widen and the value of the northern supersites may prove to be very limited. Research coordinators within KNP could play a role in promoting these sites if and where appropriate and where logistical constraints allow.
Objective 5: Understanding long-term ecological dynamics
Another objective of the supersites was that it would become important long-term monitoring sites, similar to LTERS. Too little time has passed after the initiation of the sites to really assess whether the sites are contributing towards this objective. However, colleagues from the Skukuza Science Leadership Initiative (SSLI) in partnership with Florida University, USA, are already exploring some short-term vegetation and biodiversity trends and dynamics on the southern basalt supersite (2013-2019) (unpublished presentations). Van Aardt et al. (2020) and Janecke et al. (2020) also provide insights into short-term drought dynamics. In addition, various remote sensing projects have also explored long-term woody cover patterns on the supersites (although the historical data sets were collected independently of the establishment of the supersites).
Objective 6: Training sites for remote sensing products
Although various remote sensing projects have been conducted on the supersites using a range of sensors (aerial Light Detection and Ranging [LiDAR], aerial photography and optical satellite sensors [i.e. Satellite Pour l'Observation de la Terre {SPOT} 6]), the supersites have not been used as training or validation sites for remote sensing products. This is likely because of relatively little vegetation-related fieldwork and at scales inappropriate for linking to the remote sensing products. It is anticipated that wall-to-wall aerial LiDAR coverage across the supersites would significantly increase the value of these sites as training sites for development of global remote sensing products for savannas (multiple such requests have been received). Unfortunately, it has not been possible to acquire such data sets yet, but potential opportunities are being explored.
Discussion, recommendations and conclusions
The KNP supersite concept has gained traction, with research on a range of topics conducted on these sites since their establishment. Many of the studies in Online Appendix 1 could have been conducted at a number of locations within the park, yet the conceptualisation and delineation of the supersites seemed to have been instrumental in geographically focussing research. In the absence of supersites, these studies would most likely have happened at various unrelated sites across the park. Furthermore, the conceptual appeal and the rationale behind the supersites may even have attracted research projects to the park that may otherwise not have happened. It is believed that some of the reasons for research projects focussing on the supersites may have been (1) the clear ecological rationale behind the site selection, (2) the logistical benefits of working at these sites (i.e. easy access to research camps and other research support services), (3) the availability of good basic metadata and descriptions of these sites and (4) other research projects also being conducted at these sites, allowing opportunities for data sharing and collaboration.
Going forward, a concerted effort should be made to ensure that data management is improved to ensure that all supersite data are systematically collated, archived and easily accessible. Even if data archiving infrastructure is in place, follow-up and coordination is important to ensure that datasets get collated and centrally archived in a database with appropriate search terms. It is proposed that this database be continually updated in order to (1) increase awareness of the available data sets, (2) attract further research to the sites, (3) facilitate data sharing and integration, and ultimately (4) increase understanding of the role of top-down and bottom-up processes in savanna ecosystems.
Some limited measuring equipment (e.g. soil moisture meters) and small-scale manipulations (herbivore exclosures) have been added in recent years at some of the sites, which may further increase the value and research uptake. Installation of further long-term equipment (e.g. weather stations) and wall-to-wall coverage of valuable datasets (e.g. high-resolution airborne LiDAR and derived products like Digital Terrain Model [DTM] and Digital Surface Model [DSM]) should be promoted, as it will act as additional catalysts for further studies on the supersites. In addition, the sites may gain further traction if they become more formally part of the research infrastructure networks and increase their involvement with international collaborators and LTER initiatives. Dedicated research budget, solicited research and well-funded projects on these sites can also contribute towards the objectives set out in this essay.
Where the KNP research supersites provide a good 'fit' for the purposes of studies, they should be actively promoted as potential field sites. As per their original conceptualisation, it is believed that the longer these sites are in existence and the more they are studied (and with associated data sets becoming freely available), the more valuable they will become and the more research attention they will attract, contributing towards answering questions that would not be possible with individual projects, which are typically funded only for three- to five-year cycles. This Special Issue, together with the earlier work of Riddell et al. (2014), and other studies listed in Online Appendix 1 are a testament to how the KNP supersites are contributing towards improved understanding of bottom-up and top-down drivers of and responders to savanna heterogeneity. It is hoped that over time, and as more studies are conducted on these sites, more integration would emerge between studies that can benefit from multidisciplinary approaches.
Acknowledgements
The author thanks Edward S. Riddell, Beanelri Janecke and Johan van Tol for comments on an earlier draft.
Competing interests
The author declares that he has no financial or personal relationships that may have inappropriately influenced him in writing this essay.
Author's contribution
I.P.J.S. is the sole author of this research article.
Ethical considerations
This research followed all ethical standards for research without direct contact with human or animal subjects.
Funding information
This research received no specific grant from any funding agency in the public, commercial or not-for-profit sectors.
Data availability
Data sharing is not applicable to this essay as no new data were created or analysed.
Disclaimer
The views and opinions expressed in this essay are those of the author and do not necessarily reflect the official policy or position of any affiliated agency of the author.
References
Asner, G.P., Levick, S.R., Kennedy-Bowdoin, T., Knapp, D.E., Emerson, R., Jacobson, J. et al., 2009, 'Large-scale impacts of herbivores on the structural diversity of African savannas', Proceedings of the National Academy of Sciences 106(12), 4947-4952. https://doi.org/10.1073/pnas.0810637106 [ Links ]
Gosz, J.R., Waide, R.B. & Magnuson, J.J., 2010, 'Twenty-eight years of the US-LTER program: Experience, results, and research questions', in F. Müller, C. Baessler, H. Schubert & S. Klotz (eds.), Long-term ecological research, pp. 59-74, Springer, Dordrecht. [ Links ]
Higgins, S.I., Bond, W.J., February, E.C., Bronn, A., Euston-Brown, D.I., Enslin, B. et al., 2007, 'Effects of four decades of fire manipulation on woody vegetation structure in savanna', Ecology 88(5), 1119-1125. https://doi.org/10.1890/06-1664 [ Links ]
Janecke, B.B., 2020, 'Vegetation structure and spatial heterogeneity in the granite supersite, Kruger National Park', Koedoe 62(2), a1591. https://doi.org/10.4102/koedoe.v62i2.1591 [ Links ]
Janecke, B., Van Tol, J., Smit, I.P.J., Van Aardt, A.C., Riddell, E.S., Seaman, M.T. et al., 2020, 'Biotic and abiotic connections on a granitic catena: Framework for multidisciplinary research', Koedoe 62(2), a1600. https://doi.org/10.4102/koedoe.v62i2.1600 [ Links ]
Majozi, N.P., Mannaerts, C.M., Ramoelo, A., Mathieu, R.S., Nickless, A. & Verhoef, W., 2017, 'Analysing surface energy balance closure and partitioning over a semi-arid savanna FLUXNET site in Skukuza, Kruger National Park, South Africa', Hydrology and Earth System Sciences 21(7), 3401-3415. https://doi.org/10.5194/hess-21-3401-2017 [ Links ]
Mirtl, M., Borer, E.T., Djukic, I., Forsius, M., Haubold, H., Hugo, W. et al., 2018, 'Genesis, goals and achievements of long-term ecological research at the global scale: A critical review of ILTER and future directions', Science of the Total Environment 626, 1439-1462. https://doi.org/10.1016/j.scitotenv.2017.12.001 [ Links ]
Riddell, E.S., Nel, J., Fundisi, D., Jumbi, F., Van Niekerk, A. & Lorentz, S.A., 2014, Ephemeral hydrological processes in savannas, Water Research Commission Report, Gezina, Pretoria. [ Links ]
Smit, I.P.J., Riddell, E.S., Cullum, C. & Petersen, R., 2013, 'Kruger National Park research supersites: Establishing long-term research sites for cross-disciplinary, multiscaled learning', Koedoe 55(1), 01-07. https://doi.org/10.4102/koedoe.v55i1.1107 [ Links ]
Smit, I.P.J., Roux, D.J., Swemmer, L.K., Boshoff, N. & Novellie, P., 2017, 'Protected areas as outdoor classrooms and global laboratories: Intellectual ecosystem services flowing to-and-from a National Park', Ecosystem Services 28, 238-250. https://doi.org/10.1016/j.ecoser.2017.05.003 [ Links ]
Van Aardt, A.C., Codron, D., Theron, E.J. & Du Preez, P.J., 2020, 'Plant community structure and possible vegetation changes after drought on a granite catena in the Kruger National Park, South Africa', Koedoe 62(2), a1585. https://doi.org/10.4102/koedoe.v62i2.1585 [ Links ]
Van Wilgen, B.W., Boshoff, N., Smit, I.P.J., Solano-Fernandez, S. & Van der Walt, L., 2016, 'A bibliometric analysis to illustrate the role of an embedded research capability in South African National Parks', Scientometrics 107(1), 185-212. https://doi.org/10.1007/s11192-016-1879-4 [ Links ]
Correspondence:
Izak P.J. Smit
izak.smit@sanparks.org
Received: 12 Sept. 2019
Accepted: 08 Jan. 2020
Published: 29 Oct. 2020
1 See https://dataknp.sanparks.org/sanparks/ (using 'supersites' as the search keyword).
^rND^sAsner^nG.P.^rND^sLevick^nS.R.^rND^sKennedy-Bowdoin^nT.^rND^sKnapp^nD.E.^rND^sEmerson^nR.^rND^sJacobson^nJ.^rND^sGosz^nJ.R.^rND^sWaide^nR.B.^rND^sMagnuson^nJ.J.^rND^sHiggins^nS.I.^rND^sBond^nW.J.^rND^sFebruary^nE.C.^rND^sBronn^nA.^rND^sEuston-Brown^nD.I.^rND^sEnslin^nB.^rND^sJanecke^nB.B.^rND^sJanecke^nB.^rND^sVan Tol^nJ.^rND^sSmit^nI.P.J.^rND^sVan Aardt^nA.C.^rND^sRiddell^nE.S.^rND^sSeaman^nM.T.^rND^sMajozi^nN.P.^rND^sMannaerts^nC.M.^rND^sRamoelo^nA.^rND^sMathieu^nR.S.^rND^sNickless^nA.^rND^sVerhoef^nW.^rND^sMirtl^nM.^rND^sBorer^nE.T.^rND^sDjukic^nI.^rND^sForsius^nM.^rND^sHaubold^nH.^rND^sHugo^nW.^rND^sSmit^nI.P.J.^rND^sRiddell^nE.S.^rND^sCullum^nC.^rND^sPetersen^nR.^rND^sSmit^nI.P.J.^rND^sRoux^nD.J.^rND^sSwemmer^nL.K.^rND^sBoshoff^nN.^rND^sNovellie^nP.^rND^sVan Aardt^nA.C.^rND^sCodron^nD.^rND^sTheron^nE.J.^rND^sDu Preez^nP.J.^rND^sVan Wilgen^nB.W.^rND^sBoshoff^nN.^rND^sSmit^nI.P.J.^rND^sSolano-Fernandez^nS.^rND^sVan der Walt^nL.^rND^1A01^nWijnand J.^sSwart^rND^1A02^nMaitland T.^sSeaman^rND^1A03 A04^nPieter A.L.^sle Roux^rND^1A05^nBeanelri B.^sJanecke^rND^1A01^nWijnand J.^sSwart^rND^1A02^nMaitland T.^sSeaman^rND^1A03 A04^nPieter A.L.^sle Roux^rND^1A05^nBeanelri B.^sJanecke^rND^1A01^nWijnand J^sSwart^rND^1A02^nMaitland T^sSeaman^rND^1A03 A04^nPieter A. L^sle Roux^rND^1A05^nBeanelri B^sJaneckeTRIBUTE
A tribute to Frederick (Fred) J. Kruger
Wijnand J. SwartI; Maitland T. SeamanII; Pieter A.L. le RouxIII, IV; Beanelri B. JaneckeV
IDepartment of Plant Sciences, Faculty of Natural & Agricultural Sciences, University of the Free State, Bloemfontein, South Africa
IICentre for Environmental Management, Faculty of Natural & Agricultural Sciences, University of the Free State, Bloemfontein, South Africa
IIIDigital Soils Africa, Bloemfontein, South Africa
IVInstitute for Groundwater Studies, Faculty of Natural and Agricultural Sciences, University of the Free State, Bloemfontein, South Africa
VDepartment of Animal, Wildlife & Grassland Sciences, Faculty of Natural & Agricultural Sciences, University of the Free State, Bloemfontein, South Africa
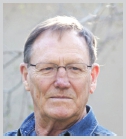
Frederick J. Kruger, passed away in his sleep in May 2017 in Stellenbosch after a short illness. Fred, as he was known to everyone, was highly educated in forest science and ecology and a pioneer of forest hydrology, fynbos ecology and invasive species. Fred was a Member of the Royal Society, and a former director of the South African Forestry Research Institute, and of the CSIR's Division of Forest Science and Technology.
His passing left an indelible mark on forestry and environmental science in South Africa. Fred was an intellectual (although he refused to be called an academic) and uncompromising in his pursuit of answers. He was supportive, understated but provocative, with dignity and integrity and always a twinkle in his eyes. In recent years, he was a major contributor to scholarly literature about the environmental history of South Africa.
He often collaborated in ecological research and was actively involved from 2015 to 2017 in this multidisciplinary research project near Skukuza in the Kruger National Park (published in this special issue) together with colleagues from the University of the Free State. The main concept of the study was the 'brain child' of Fred and Piet le Roux. Fred stimulated the team's thoughts on the interaction between the biosphere and lithosphere and he encouraged us to always focus on the bigger ecological picture. His active involvement in this project led to the discovery of a new species of fungus, which was subsequently described and named after him (Fusarium fredkrugeri Sandoval-Denis, Crous & W.J. Swart, sp. nov.). His extensive knowledge and experience will be sorely missed by all those people he interacted with over many years.
At the time of his passing, he was an active Research Fellow of the Centre for Environmental Management at the University of the Free State, and was investigating and documenting studies on the role of water in rivers in the catchments of the Kruger National Park.
This is a tribute to honour Dr Fred Kruger, and to show our respect, gratitude and admiration when we remember the huge contribution that he has made to the research published in this special issue.
- W. Swart, M. Seaman, P. Le Roux, B. Janecke and the research team
Correspondence:
Beanelri B. Janecke
janeckbb@ufs.ac.za
TRIBUTE
A tribute to Pieter Johannes (Johann) du Preez
Leslie R. BrownI; Andri C. van AardtII; Beanelri B. JaneckeIII
IApplied Behavioural Ecology & Ecosystem Research Unit, University of South Africa, Florida, South Africa
IIDepartment of Plant Sciences, Faculty of Natural & Agricultural Sciences, University of the Free State, Bloemfontein, South Africa
IIIDepartment of Animal, Wildlife & Grassland Sciences, Faculty of Natural & Agricultural Sciences, University of the Free State, Bloemfontein, South Africa

Pieter Johannes du Preez passed away on the evening of 29 December 2019 in Hermanus after a short fight against cancer. Johann as he was known to everyone, was well educated in ecology and had a passion for nature. His knowledge of the environment and willingness to share that with colleagues, students and the general public is how he will be remembered.
Johann's passing came as a huge shock to all with whom he has worked and who has known him. He has left a huge gap within the scientific world, especially within the field of vegetation science where he was well known and regarded as one of the top plant ecologists in the country. He will be remembered for his endless passion to study nature and obtain more knowledge on the functioning of ecosystems. His love for nature and conservation could be felt in his presence. He was modest, humble, understanding, supportive and always willing to walk that extra mile for the people that crossed his path.
As an academic he influenced the lives of several students who became successful vegetation scientists and researchers under his supervision. He also contributed to the literature in various fields of ecology mostly specialising in the mapping of vegetation and investigating various ecological community compositions. Many of the valuable plant samples that he collected are housed at the Geo Potts Herbarium at the University of the Free State (UFS). He is well-published and has contributed numerous publications, book chapters, conference presentations and technical reports on the vegetation of southern Africa. He produced a detailed vegetation map of the Free State Province and was co-author of the widely acclaimed ecology book Life and the Environment: an African perspective for which he received the Golden Merit award from the South African Academy for Science and Arts for his contribution to science. Johann collaborated on the vegetation surveys of the Stevenson Hamilton Research Supersite near Skukuza in the Kruger National Park with colleagues from the University of the Free State. Here he contributed towards our understanding of the interaction between vegetation and the environmental factors that influenced the various plant communities in the area. He was one of the main researchers of this multidisciplinary project and contributed to much of the research published in this special issue.
At the time of his passing, Johann was an active Research Fellow at the Department of Plant Sciences, UFS, where he was still involved in supervising students and playing his part in research with colleagues from other South African universities. A day in the field with Johann was equivalent to a long time in the classroom. He was cited by many people for his many achievements. Johann played a quiet, yet profound role in the advancement of vegetation science in southern Africa and we will remember him for his huge contribution not only in terms of scientific knowledge, but his energetic and positive approach to life.
This is a tribute to honour Prof. Johann du Preez, and to show our respect, gratitude and admiration when we remember the huge contribution that he has made to the research published in this special issue.
- L. Brown, A. Van Aardt, B. Janecke and the research team
(A special thanks to Prof. Leslie Brown from UNISA for his contribution to this tribute).
Correspondence:
Beanelri B. Janecke
janeckbb@ufs.ac.za
ORIGINAL RESEARCH
Vegetation structure and spatial heterogeneity in the Granite Supersite, Kruger National Park
Beanelri B. Janecke
Department of Animal, Wildlife and Grassland Sciences, Faculty of Natural and Agricultural Sciences, University of the Free State, Bloemfontein, South Africa
ABSTRACT
Spatial heterogeneity is the unequal distribution of landscape features and consists of diversity in vegetation structure, number and size of woody plants, patchiness in grass cover, sub-canopy habitats, etc. A granite catena (hillslope) comprises of a gradient of soils, hydrology patterns and vegetation composition, creating a spatially heterogeneous area with variety in animal habitats. Objectives were to determine small-scale spatial heterogeneity along a catena near Skukuza, such as vegetation structure, patchiness, size and cover of woody and grass components, to describe certain catenal processes. Tree sizes and canopy cover were measured and the point method used on seven 100 m transects representing different catenal zones. Grasses were categorised according to grazing value, ecological status and percentage shade tolerant grasses. A total of 155 tree canopies were present. Large trees (> 5 m) occurred in riparian zone and upper midslope, but were low in number (< 4 per transect). Woody plants ranged in number from 8 to 32, canopy cover 4.5% - 33.6%, and grass cover from 47% to 69% between zones. A strong correlation was found between canopy cover and shade-tolerant grasses. Size of sub-canopy habitats are mostly determined by size of woody plants and both are important to animals. Various factors related to vegetation contributed to heterogeneity and spatial stratification patterns of the catena ecosystem.
CONSERVATION IMPLICATIONS: Concerns about the decline in tree numbers inside Kruger National Park are addressed. Mammal habitats and plant communities are impacted by the decline. The research can be linked to the long-term exclosure studies on granites at Nkuhlu
Keywords: Big trees; Drought; Grazers and browsers; Savanna; Sodic grazing lawn.
Introduction
Spatial patterns in plant communities, including vegetation structure, patchiness and density, as well as the factors that generate them, have been receiving increased attention from ecologists (Adjorlolo & Mutanga 2013; Eckhardt, Wilgen & Biggs 2000; Gordijn, Rice & Ward 2012; Holdo 2007; Lévesque & King 2003; Murwira & Skidmore 2006). Spatial heterogeneity refers to the unequal dissemination of a landscape or population in a specific area (Khan et al. 2019). According to Khan et al. (2019):
A landscape with spatial heterogeneity [sic] for example, is composed of concentrations of numerous biological species of plant or animal origin, terrain formations (geological) or environmental attributes (e.g. rainfall, temperature, wind) included in the area. (p. 127)
Several spatially stratified heterogeneous phenomena can be described, such as vertical layering of plants in an environment; differences in population densities between areas, ecological zones or climates; and distribution of soil types, land cover and land use (Pickett, Cadenasso & Benning 2003; Wang, Zhang & Fu 2016). A landscape with savanna components (e.g. trees, shrubs, grasses and forbs) that occurs on different soil types along an environmental gradient, such as a catena, can thus be considered as a spatially heterogeneous area.
Local spatial patterning forms part of the description of spatial heterogeneity and is associated with alternation between vegetated and bare areas that commonly occur in savanna systems. This variability and patchiness of vegetation cover creates different habitats for wildlife species (Augustine 2003, Murwira & Skidmore 2006). Khomo and Rogers (2005:30) describe the patchiness of a granite catena (hillslope with different soil and hydrology gradients) specifically as a 'spatio-temporally complex boundary' between footslope and upland vegetation. In addition, small-scale patch structure can also be observed in plant species distribution and vertical layering, where pattern diversity can indicate the dissimilarity in species composition of areas within the same sward (Augustine 2003; McNaughton 1983). The extent of woody vegetation cover is determined at a regional scale largely by precipitation and climate (Sankaran et al. 2005), while on a landscape scale, cover and vegetation structure are determined by topography, fire, herbivory, geological substrate, etc. (Asner et al. 2009; Holdo 2007; Sankaran, Ratnam & Hanan 2008; Venter, Scholes & Eckhardt 2003). Two of the primary determinants of savanna dynamics, namely, herbivory and fire, have both a strong and opposing effect on spatial pattern diversity (Augustine 2003).
Vegetation structure and plant species composition play an important role in the suitability of a habitat to animals. This is because different animal species are sensitive to the size of vegetated and bare patches in the landscape, and this makes the state of the spatial heterogeneity (i.e. patchiness) a valuable indicator of the suitability of a habitat to animals (Turner 1989). It is easy to distinguish between grass plains, tree savannas, forests and thickets on the basis of the structure of their vegetation. Within a specific habitat, there are also differences in the vegetation structure, like between short-grass and tall-grass plains (Venter et al. 2003). Vegetation structure can change seasonally (deciduous nature of woody plants), through animal impact, or when fire burns away tall grasses to convert the area to a short-grass area (Bond 2008; Gordijn et al. 2012; Holdo 2007; Janecke & Smit 2011; Joubert 2016). On the individual tree scale, it is known that savanna trees have positive and negative (competition) effects on grasses growing below their canopies relative to grasses in inter-canopy areas. Thus, large trees can affect plant species composition in sub-canopy areas and therefore change the vegetation structure of that immediate environment (Riginos et al. 2009; Treydte et al. 2007). Some of the positive effects of large trees and shrubs on the environment include enriched nutrients in soil and grass leaves in sub-canopy areas, increased soil water availability because of hydraulic lift, reduced evapotranspiration and increased grass productivity (Riginos et al. 2009). Large woody plants provide animals with shade, shelter against climate conditions, food for browsing animals, sub-habitats with higher nutrient levels, higher yield of highly palatable grass species and many more rewards (Smit & Swart 1994; Treydte, Riginos & Jeltsch 2010; Treydte et al. 2007).
Many savanna systems across the world have undergone some dramatic changes in terms of tree abundance (Bond 2008). In some areas, trees and shrubs are increasing in density because of encroachment into open areas, while in other areas woody plant densities are declining mostly because of elephant impact and heavy browsing and grazing, which in turn reduces the fuel load for fires (Grant et al. 2011; Riginos et al. 2009). This upsets the delicate balance between trees and grasses in a normal savanna system and can change the vegetation structure and species composition (Riginos et al. 2009).
Adjorlolo and Mutanga (2013:305) mentioned that managers in Kruger National Park (KNP) use a series of monitoring endpoints or 'thresholds of potential concern' (TPCs) to define limits of changes in biodiversity and vegetation structure that are acceptable. The TPCs for woody vegetation cover or density in landscape groups of KNP should not drop more than 80% of the maximum value and the mean drop for the entire park should not exceed 30% (Gillson & Duffin 2007). It is important to determine woody density or canopy cover in order to develop an early warning system that can guide management to identify landscapes with possible TPC (Adjorlolo & Mutanga 2013). Many studies focus on large-scale surveys that require expensive technology and expert knowledge (i.e. Leckie et al. 2003; Lévesque & King 2003; Murwira & Skidmore 2006), but small-scale studies on vegetation structure and direct measurement of vegetation can also have importance in determining local areas where changes in vegetation structure and cover are taking place (Buitenwerf, Swemmer & Peel 2011; Ludwig et al. 1999; O'Connor 1998; Peel, Kruger & Zacharias 2005).
The granite landscape in the south of KNP is finely dissected with a high density of streams and hillslopes or catenas (Smit et al. 2013). These catenas each have a soil sequence arranged in zones with different soil properties and soil types from the crest to the footslope (Weil & Brady), but each soil type occurs on the underlying granite. The various slopes facilitate transfer of different particles from upslope areas down the hills along an environmental gradient that results in variation in the soil and its associated vegetation in the different zones on each hillslope (Khomo et al. 2011). The catena ecosystem thus consists of abiotic and biotic processes that play a part in its normal functioning. The environmental gradient along the catenas creates heterogeneity in the landscape, while the topo-edaphic differences also support different vegetation structure and plant cover in the catenal zones.
Soil, hydrology and vegetation form the foundation of the catena ecosystem; therefore, it is important to give an accurate description of these. This study forms part of a bigger study presented in this Special Issue where multidisciplinary research fields are focussed on the same local study area (small area) with the ultimate goal of finding links and processes that can drive the catena functioning. The multidisciplinary research has been conducted on a small scale to provide a basis for further studies in the same area, or to be expanded to the larger Southern Granite Supersite, or to be used as comparison for similar studies.
This study is an extension of the vegetation studies that formed part of the multidisciplinary research and expands on the description of plant communities along the environmental gradient (from top to bottom of the hillslope) done in the study area (Theron et al. 2020). The focus of this study was not on large-scale spatial patterning, where remote sensing, georeferencing or Light Detection and Ranging (LiDAR) techniques are usually used, but rather on local small-scale patterns, structure and heterogeneity of a specific area. The aims of this study were to determine spatial heterogeneity in (1) the general vegetation structure (including the number and size of woody plants and their canopies) and vegetation cover in each catenal zone in order to (2) describe the small-scale patterns and patchiness of woody and herbaceous vegetation along a specific granite catena, and also to (3) refer to some of the processes where vegetation structure and patterning or cover play a part in the functioning of this ecosystem. These aspects are important when describing the habitat of mammals and the catena environment. Because of the different zones present from the crest to the drainage line of the catena, the expectations were high to find differences along this catenal gradient in vegetation structure, plant cover and the consequent vegetation patterns that form along the hillslope.
Methods
Study area
Supersites were established in 2013 to give researchers an opportunity to focus research geographically in specific areas of KNP and to allow long-term monitoring and integration of data across different research themes on specific large study areas with similar climate and geology (Smit et al. 2013). One of the four identified supersites is located in the Stevenson-Hamilton area on a granite landscape (~36 km2) (Smit 2020; Smit et al. 2013). This study was conducted on a part of this supersite located between 25°06'28.6 S, 31°34'41.9 E and 25°06'25.7 S, 31°34'33.7 E, approximately 10 km from Skukuza. The supersite falls in the Renosterkoppies land type of the Savanna Biome, described as a transitional area between land types associated with the catchment of the Sabie River (Smit et al. 2013).
The study focussed on one catena (or hillslope) from the crest down to the third order drainage line (or watercourse) in the Sabie River catchment. A Global Positioning System (GPS) was used to indicate the highest point (370 m above sea level [m.a.s.l.]) that was taken as the crest. The lowest point was inside the drainage line at 354 m m.a.s.l. It is not a steep slope (1%), with a gradual drop of 16 m over a 200 m length. A seepline was present in the transitional area between the upper midslope and the sodic patch on the lower midslope. This formed a green grass belt that could clearly be differentiated from the rest of the sodic patch during the time of study. The riparian zone contained a small floodplain and the banks of the drainage line. Jacobs and Naiman (2008) reported vegetation types and zones similar to what was found in this study. Research for our study was conducted in the same area where previous soil studies and geohydrology were performed (Riddell et al. 2020).
The vegetation on the hillslopes is generally described as moderately dense bush or shrub savanna, with a riverine forest at the valley bottom in areas closer to the river (Smit et al. 2013). Vegetation classification of the specific study area was done by Theron, Van Aardt and Du Preez (2020). They recorded a cover abundance of 171 plant species and also included a visual illustration of this catena. Smit et al. (2013) reported that the average herbaceous biomass was 2900 kg/ha and woody cover was 45% for the supersite. Combretum apiculatum and Combretum zeyheri mostly dominate the sandy crests of catenas in this supersite. Clayey midslopes and footslopes are dominated by fine-leaved woody species, such as Vachellia nilotica. Euclea divinorum characterises the footslopes where duplex, sodic soils occur (Smit et al. 2013). A vegetation description of a similar granite catena closer to the perennial Sabie River is provided by Siebert and Eckhardt (2008), and the effect of fire and herbivory by Van Coller, Siebert and Siebert (2013).
Vegetation surveys
The study followed on the vegetation classification surveys (description of plant communities) that were conducted as part of a bigger multidisciplinary research project in the same study area during 2015. Line transects of this study were placed in the length of the catenal zones, in other words, perpendicular to the single long belt transect that ran from the crest down to the drainage line, that was used for the description of the vegetation gradient from top to bottom of the catena by Theron et al. (2020). In this way, the vegetation structure and cover of each zone could be described separately in this study. Seven line transects of 3.5 m × 100 m were spaced roughly 25 m apart from the crest to the drainage line to represent the four catenal zones identified during our veld survey. These zones were identified based on their position on the catena and their associated plant community, namely, crest and upper midslope, lower midslope or sodic patch, footslope shrub veld and a riparian zone around the dry drainage line.
Two measurements were taken to describe the canopy of trees and shrubs, where crown refers to an individual plant and canopy refers to more crowns together in the same area. The first measurement was taken for the widest part of the crown (if the largest part of that crown fell inside the transect). This was done to describe maximum crown width of individual plants. An adapted Biomass Estimates of Canopy Volume (BECVOL) method (Smit 2014) was used where only the height and width of the broadest or widest part of the crown were measured for woody plants rooted inside the transect (trunk present inside the transect) (Leverett & Bertolette n.d.). These woody species located inside the transect were identified on a species basis and counted. The second canopy measurement was taken for only the part of the canopy that covered the 100 m measuring tape. This was done to describe canopy cover. A 100 m measuring tape was positioned in the centre of the transect and the part of the crown that covered the tape was measured, irrespective of whether the trunk was present in the transect or not. Canopy cover is defined as the proportion of a fixed area on the ground that was covered by woody plant crowns (Jennings, Brown & Sheil 1999). The dead trees were only included as an observation at the end of the study period and no further data were collected on them. Trees were regarded as large if they were more than 5 m tall, medium if they were 3 m - 4 m tall and small if they were < 1 m - 2 m tall.
The point method was used to determine grass cover and species composition (Evans & Love 1957; Owensby 1973). At each metre mark of the measuring tape, a metal rod was positioned (100 points). If the base or crown and/or shoot of a grass tuft touched the rod, it was noted as such. If no grass shoot was touched by the metal rod (open area), the nearest grass (30 cm radius) was noted, and if no grass was within the radius, it was noted as bare soil. Grasses were identified up to species level. Forbs were not included in this study, but forb cover (percentage class values) on a species basis was recorded by Theron et al. (2020) for the study area. The grass cover was determined at the end of the growing season during 2015 and repeated in 2016 on the exact locations, based on GPS positions of the transects. Because of the drought in 2016 and consequent intense grazing of available grass by herbivores, grass species were very difficult to identify and living (green) grasses were rather grouped based on the size of their tufts as follows: small tuft (< 3 cm across, 1 cm - 2 cm high with no seed culms or leaves), short tuft (< 10 cm across, up to 3 cm high with few leaves but no seed culms), medium tuft (5 cm - 10 cm high with leaves) and tall tuft (30 cm and higher with leaves and/or seed culms in some unpalatable species). Normally, dead plants are not recorded with this method, but to indicate the impact of the drought, the percentage of dead grasses was noted during 2016.
Data and statistical analyses
Woody plants were grouped into different height classes based on about 1 m increments, that is, 0 m - 0.9 m, 1 m - 1.9 m, 2 m - 2.9 m, etc., up to 5 m and then the trees higher than 5 m were grouped together for each transect. The number of species per transect, as well as the number of individual woody plants for each height class, was counted and tabulated. A difference was made between rooted woody plants where the trunk was within the transect (3.5 m × 100 m) and woody plants that were not rooted in the transect but their canopies covered part of the transect. Similar size classes were used for categorising the maximum crown width of woody plants (where the broadest part was measured). This differs from the more commonly used average crown spread where the longest and shortest extent of the crown is measured and divided by two (Blozan 2006). The number of woody plants that fall in a crown width class was indicated on a stack bar graph for each transect. The percentage area covered by the canopies was determined by the sum total of each part of a crown that covered the 100 m tape measure in a transect. The number of woody canopies that covered the tape measure was counted per size class (maximum crown width), although they were not necessarily rooted in the transect.
The number of points where a grass tuft (crown or shoot) touched the metal rod with the point method (hits) was totalled to indicate the grass cover of living grasses, while points with 'no hit' were divided into nearest grass (30 cm radius) and bare soil (with no grass present in a 30 cm radius of the rod). Grass species were grouped into different categories based on their grazing value, plant succession stage and ecological status, following Van Oudshoorn (2012) and Roodt (2015). The percentage of each grass species in a category (determined from the number of points where the species touched the rod out of 100 points in total) was summarised in a table for each transect. The percentage of grass species known to grow in shade (like under tree canopies) was also totalled per transect. These grasses were Panicum maximum, Setaria verticillata, Sporobolus fimbriatus and Urochloa mosambicensis. Pearson's correlation coefficient (calculated from Stangroom 2019) was used to indicate the linear relationship between the percentage canopy cover and percentage shade grasses (grass species hit and nearest grasses/no hit with point method) on the same 100 m line in each transect. The Shapiro-Wilk test was performed separately on the number of grass tuft hits and the nearest grass values (excluding the bare soil) of 2015 and 2016 to test for normality. The data were normally distributed and the one-tailed t-test for independent variables was performed at 5% level (Stangroom 2019) to test for differences in grass cover between the two years.
Ethical considerations
Ethical approval for the multidisciplinary project as a whole was obtained from the Interfaculty Animal Ethics Committee at the University of the Free State (UFS-AED2019/0121).
Results
Description of the tree layer
A total number of 155 woody plant canopies partially covered the seven transects (Table 1), while 137 of those plants were also rooted inside the transects (trunk included). An average of 21 rooted woody plants per transect was recorded on the upper midslope, nine woody plants in the sodic patch, a total of 31 rooted plants in the footslope shrub veld and 26 plants in the riparian area. The number of woody species (crown inside transect) is shown in Table 1. The transitional area between the upper midslope and the sodic patch on the lower midslope, next to the seepline, had a higher number of woody species present relative to the other zones (see transect 'Above sodic site' in Table 1). Note that this does not include all the woody plant diversity present in each catenal zone - for a complete description of the vegetation, the species composition and its correlation with soil properties in the study area, see Theron et al. (2020).
All height classes of the woody plants (from < 1 m to > 5 m) were represented on the crest and upper midslope of the catena (Figure 1). The largest trees (> 5 m high) were found at the drainage line in the riparian zone and a high number of large trees occurred on the upper midslope just above the sodic patch seepline, but only a low number of smaller woody plants (< 2 m high) were present on the sodic patch itself. The shrub veld transect passed through a patch of Pterocarpus rotundifolius, with more than 31 small trees in the patch (< 1 m high because of browsing by animals). Nine of the 20 small plants (< 2 m) indicated as total for that size class are from this patch (Figure 1).
The maximum crown width of individual woody plants that were grouped into the mentioned size classes is indicated in Figure 2. Only one or two trees had a maximum crown width of 4.0 m - 4.9 m in each catenal zone, excluding the sodic patch on the lower midslope, while three to four individual trees had a maximum crown width of larger than 5 m (Figure 2). The low number of trees and shrubs present in the sodic patch accounted for the low percentage canopy cover (2.7% - 4.5%) (Table 1). The highest percentage cover was found in the riparian zone, followed by the above sodic transitional area and the crest (Table 1). In these three mentioned areas, the highest numbers of larger trees (> 4 m) were also present (Figure 1).
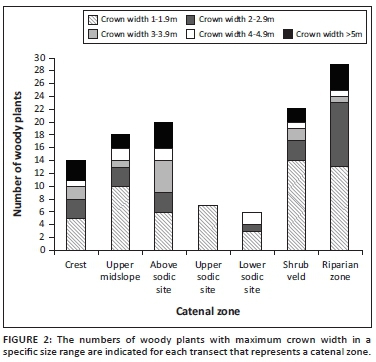
Description of the grass layer
Grass cover ranged from 47% to 69% during 2015 in different catenal zones of the study area, with the lowest cover in the riparian zone on the banks of the dry drainage line and on the lower midslope sodic site (Figure 3). Although no bare soil per se was indicated in the results for 2015, the 'Nearest Grass' percentages represented open areas where no grass was touched by the metal rod of the point method. Larger bare areas were visible on the drainage line banks and in the sodic patch that fell outside the transect line used for vegetation surveys and was thus not reflected in the percentages of the results. Significant differences were observed in grass cover between the two years of surveys (Grass Tufts hit: t = 6.08, p = 0.0001; and Nearest Grass: t = 4.58, p = 0.0009) and the percentage bare patches increased during the second year of drought to such an extent that it was clearly visible in the results of 2016 (Figure 3). It became difficult to identify grass species during the drought in the fixed transects because of the majority of grass tufts that were grazed to stubble height (< 5 cm; Table 2).
About 58% - 74% of the grass species present on the upper midslope transects during 2015 were of high grazing value (Table 3), with 37% - 38% of the species in transects on the sodic area and 60% - 76% in the riparian area and shrub veld classified as high grazing value species. The dominant grasses present in the sodic patch transects were of average to high grazing value, but that does not indicate the effect of the nutrients in the soil on the acceptability or palatability of the grasses. The categorisation of grass species differs between areas and one species does not always fall in the same ecological status or successional category in different regions because of differences in climate and soil nutrients (Roodt 2015). However, in general, most of these grass species mentioned (Table 3) are also decreasers (that decrease with overgrazing because of high acceptability and selection by herbivores) and climax species (that are the perennial, better-adapted, top species in the order of plant succession) based on the classification of Van Oudtshoorn (2012). The numbers of grass species recorded in each line transect (including Nearest Grass percentages) and the percentage of those grasses (hits with the point method) that are known to grow in shade are presented in Table 1.
Discussion
A catena is a dynamic arrangement of vegetation and localised soils in a gradient pattern resulting from geological features, hydrology and topography that cause apparent irregularities in vegetation distribution (Emmet & Pattrick 2012). This gradient creates different catenal zones that are responsible for spatial heterogeneity on the catena, for example, in different structures of the vegetation in each zone, the varying plant cover and resulting alternating patches of vegetated and bare areas, among others (Wang et al. 2016). Woody plants increase the spatial heterogeneity of the plant community because they occur in different heights (vertical layering) and canopy sizes, and because they create sub-canopy environments where certain herbaceous species can flourish (Treydte et al. 2010). Woody plants concentrate nutrients and water in sub-canopy environments and increase animal diversity by providing forage to herbivores and by providing protection to herbivores and predators from the harsh climate of the savanna (Belsky 1994). Animal presence can lead to changes in vegetation structure and patterning in the savanna.
A total of 137 individual woody plants were rooted in the seven transects covering the four catenal zones during the vegetation survey. Several trees were uprooted by elephants (Loxodonta africana) and most of these trees died in the two years of drought following the vegetation survey, possibly as a result of the combined effect of the drought and elephants (pers. obs. October 2016 & April 2017). The loss of trees did not form part of the scope of this study and no data are available on the number of trees that were affected, but it explains changes in the vegetation structure and spatial heterogeneity of the area and is therefore included as observations. Uprooting and breaking of trees by elephants alter the tree crown and change species composition and distribution of biomass (Pickett et al. 2003). Some of the bigger trees in the study area had clearly visible browse lines. Signs of browsing (probably from elephant) were also evident on all the small P. rotundifolius trees in a patch located in the shrub veld next to the riparian zone during 2015 - every tree in this patch was browsed and pruned to 1 m or less in height. During 2016, many of these small to large trees that showed significant damage by elephants have died (pers. obs. October 2016). Shannon et al. (2008) reported that 60% of large trees in the southern section of KNP exhibited utilisation by elephants and 4% were dead because of this animal's foraging behaviour. This might also provide an explanation to the low number of large trees in the study area and thus lower the spatial heterogeneity (as the large tree component is limited in the environment). The clear evidence of browsing by different browsers and of elephant foraging in the study area can be part of the reasons for the low number of large trees present. Other factors such as drought, tree competition, water availability and plant diseases might also play a role. The observations of treefall in the study area indicate a decline in the number of trees, especially in the medium (3 m - 4 m) to large (4 m - 5 m) height classes, and also in other height classes, over a period of two years.
There have been some concerns from conservationists and researchers about the general decline in the number of trees inside KNP over the past 50 - 75 years, especially in the large tree component (> 5 m tall) (Druce et al. 2008; Eckhardt et al. 2000; Levick & Asner 2013; Shannon et al. 2008). The decline is believed to be mainly the result of an interaction between regular fires and utilisation by elephants; however, other factors such as rainfall and soil fertility can also play a role (Eckhardt et al. 2000; Sankaran et al. 2008; Whyte, Van Aarde & Pimm 2003). As the current study cannot provide results on these factors mentioned because it falls outside the scope of the study, the following explanation on numbers of large trees in KNP and possible causes for low numbers is included from the literature. Eckhardt et al. (2000) stated that the density of large trees decreased by an estimated 15%, while the smaller trees and shrubs increased in cover on the granites of the park between 1940 and 1998. Levick and Asner (2013) reported for the larger granitic catchment of the Sabie River (of which the study area forms a part) a rate of treefall loss of 20% in the 5 m height class specifically over two years. The treefall rate was not evenly distributed across different height classes in the landscape, but was the highest in the 4 m - 6 m class, because these trees escaped the fire trap of 1 m - 3 m but were still within the reach of elephants (Levick & Asner 2013). The regular, frequent burning that is practised in the park will prevent smaller trees to develop into large trees, especially when combined with browsing (Eckhardt et al. 2000; Gordijn et al. 2012). The mean fire return interval for the Granite Supersite is reported to be 5.8 years, with the minimum interval being 1.04 years and the maximum interval being 11.05 years (Smit et al. 2013). Although some remnants of a previous fire were visible in a specific local area in the riparian zone of the study area, no fire went through the area during the study period. Our results confirmed that mostly smaller trees were present on the granite catena. Therefore, fire cannot be the main reason for the low numbers of large trees in the study area. The shallow depth of the soil in the sodic patch, the underlying rock bed and changes in soil hydrology of the catena because of the drought (Bouwer, Le Roux & Van Tol 2020; Janecke et al. 2020; Khomo & Rogers 2005), together with the visible impact of elephants, may have an influence on the number of trees that can survive in the study area.
Large trees might be low in numbers in the study area, but woody cover in general seems to be increasing on the granite catenas over time and that may change the vegetation structure normally associated with these areas. Eckhardt et al. (2000) reported that the increase in overall woody plant density (12%) on the granites might be because of reduced competition from grasses as a result of overgrazing by herbivores. Intense grazing was especially obvious in the study area during the extreme drought of 2016 compared to the previous year (Figure 3). Heavy grazing of certain areas more than other areas creates patchiness that adds to spatial heterogeneity. The number of herbivores is usually high in most areas where surface drinking water is provided to them on a permanent basis (Grant et al. 2011; Shannon et al. 2008), and there are three permanent waterholes in close vicinity to the study area, which can lead to higher numbers of herbivores grazing in the areas surveyed. The average herbivore biomass on the Granite Supersite was reported to be 2.1 kg grazers/ha, 3.0 kg browsers/ha and 9.9 kg mixed feeders/ha (Smit et al. 2013). The herbivore species and numbers observed in the study area are listed by Janecke and Bolton (2020). In contrast, a decrease in woody cover was observed in the basalts, which is ascribed to the short-interval prescribed burning of those areas in combination with grazing. The density of grazing animals is usually higher on basalts than on granites, but the grasses on the nutrient-rich basalts can also recover better than those on the nutrient-poor granites after heavy grazing (Eckhardt et al. 2000). Whyte et al. (2003) reported a 64% decline in cover on basalts because of a 38% decrease in large trees (> 5 m). Thus, different processes and causes are leading to changes in the woody cover and numbers of large woody plants between granites and basalts in KNP.
Herbivores have a definite effect on spatial patterns involving vegetation structure, diversity and cover (Augustine 2003). Van Coller et al. (2013) confirmed that the lowest herbaceous diversity occurred in the absence of all herbivores (after 10 years of animal exclusion) in the Nkuhlu long-term exclusion experiment in KNP and that herbivores are essential to sustain the richness of plant species in sodic areas. In the control site of the exclosures, the mean biomass was 1200 kg/ha on the sodic site and 2700 kg/ha in the exclosure where no animals or fire were present (Van Coller et al. 2013). Jacobs and Naiman (2008) reported a significant increase in mean herbaceous biomass in the riparian area of the Nkuhlu exclosures, located 18 km downstream of Skukuza on the northern bank of Sabie River, where animals are completely excluded from the area. Riparian areas in savannas are normally grazed extensively because herbivores are attracted by abundant grass forage, especially in the dry season (Du Toit 2003; Naiman & Rogers 1997). These studies confirmed that herbivores have both a positive (higher herbaceous diversity in grazed areas) and a negative (intense grazing removing palatable grasses and biomass) impact on the catena, especially on the sodic site.
Canopy cover creates patchiness in the environment in the form of sub-habitats, each with its own microclimate underneath the canopy, and areas that are not covered (Jennings et al. 1999; Treydte et al. 2007). Large trees are important for the vegetation structure and provide many benefits to the environment. Isolated savanna trees can trigger vegetation heterogeneity by changing resource availability in their immediate surroundings and thus improve the herbaceous layer's growing conditions (Treydte et al. 2011). Some very large trees can produce shade up to 11 m away from the tree trunk (Belsky 1994; Treydte et al. 2010). In savanna with its high temperatures, shade is important for survival of many animals (Treydte et al. 2010). The canopy also affects light penetration and thus plant growth and survival, and this determines the type of vegetation growing under the canopy in the shaded areas (Jennings et al. 1999).
Canopy cover varied from 11% to 18% on the upper midslope transects, while 18% and 34% was calculated for the shrub veld and riparian zone transects, respectively (Table 1). This means that up to 34% of the riparian zone transects was under the canopies of woody plants and large areas were covered in shade. The riparian area specifically was characterised by large, trampled, open areas under the trees where animal droppings and tracks were found, indicating the extensive use of these areas possibly for shade. In the sodic patch, the lowest density of trees was observed compared to other catenal zones. Up to 14 plants per transect had a maximum crown width of less than 2 m on the catena, while less than five plants per transect had a maximum width of 3 m or more (Figure 2). The size of the woody plant's crown and its subsequent sub-habitat is important for the processes of nutrient cycling of the catena ecosystem (Janecke et al. 2020) because of the impact of the larger woody plants elevating nutrient levels and the animals using the larger sub-habitats while contributing with droppings. Scholes and Walker (1993) described spatial patterns of trees and shrubs at a scale of the plants themselves where canopies typically reach 3 m - 6 m in both height and crown diameter, with an average canopy cover of 10% - 40%, but bigger trees are also known to occur in the Nylsvley area. These results corresponded to the results found in this study.
The composition of grass species usually differs significantly between canopied and open areas, thus affecting the vegetation structure and patterning (Riginos et al. 2009; Smit & Swart 1994; Treydte et al. 2007). Elevated levels of grass leaf nitrogen and phosphorous were found underneath large tree canopies that were up to 25% higher than areas outside the canopies (Treydte et al. 2007). Treydte et al. (2010) reported that herbivores in the Satara area of KNP ate the grass and deposited dung twice as frequently beneath large and very large trees (> 7 m) compared to open areas. This trend was not observed in smaller trees (< 2.5 m). They concluded that large trees represent essential habitat features for herbivores and that small trees cannot provide the same functional or structural advantages as do large trees (Treydte et al. 2010). A strong positive correlation (r = 0.95, p = 0.00098) was found between canopy cover (%) of mostly the larger woody plants and shade-tolerant grasses (%) in the current study. On the upper midslope of the study area, above the sodic site, shade grasses were present in 26% - 45% of the hits by the point method (Table 1) and 39% - 55% in the shrub veld and riparian zone, respectively. This clearly indicated that if canopy cover decreased, as observed during the drought, the sub-canopy areas and the associated palatable grasses would also decrease. The general grazing value of the grasses found in the study area is indicated in Table 3. The abundance of high-quality grass species beneath trees usually attracts grazing animals (Treydte et al. 2007); thus, it is highly likely that lower availability of nutritious grasses will result in a decrease in grazer numbers on the upper midslope and riparian areas, which should also lead to higher use of the sodic areas with its higher nutrient levels than other areas of the catena.
Environmental conditions such as different soil properties in various areas, namely, wetness, leaching, clay or sand content, available nutrients, acidity (pH), etc. (Bouwer et al. 2020; Khomo & Rogers 2005), can influence nutrient content or palatability of plants. Sodic patches are known to contain soils with high levels of exchangeable sodium originating from sodium-releasing parent material such as granite (Bailey & Scholes 1997; Khomo & Rogers 2005), and it is a unique feature of semi-arid toposequences (Dye & Walker 1980; Jacobs & Naiman 2008). The presence of these patches on the catena contributes to its spatial heterogeneity by means of differences in plant species composition, vegetation structure (very few trees), distribution of soil types creating different vegetation zones, etc. Sodic patches are favoured by herbivores deriving essential nutrients from the plants growing there (Bailey & Scholes 1997; Jacobs & Naiman 2008). In the study area, most of the grasses were grouped into the pioneer and subclimax categories in the sodic area, indicating some form of disturbance. These sodic patches are commonly referred to as nutrient hotspots because of their high-quality forage (Grant & Scholes 2006) and are also preferred by herbivores for higher predator visibility (Davidson et al. 2012). Most of these grass species present on the sodic patch were grouped into the average grazing value class (Table 3). In other words, these grasses are not normally classified as highly palatable decreaser species, but grasses growing on sodic patches and on termite mounds can be more nutritious than plants not growing on such enriched soils (Grant & Scholes 2006), although this was not tested for in the current study. High percentages of grasses considered to have high grazing value were found in the upper midslope (74%), shrub veld (76%) and riparian zone (60%).
The presence or absence of grasses contributes to vegetation cover and thus to the patchiness (bare and vegetated areas) associated with heterogeneity of the catena. Grass tufts provided cover to the soil during 2015, but in 2016 many tufts were dead, possibly as a result of extreme heat, low rainfall and animal grazing during the intensifying drought conditions (Table 2). The general lower presence of decreaser grass species in the sodic patch of this study area can be attributed to a combination of these reasons: it can be habitat specific (adapted grass species that grow in sodic conditions might not be decreaser species - see Bailey & Scholes 1997; Theron et al. 2020); the near absence of trees might play a role (some of the palatable decreasers grow in shady conditions, or are associated with conditions in this kind of sub-habitat, Roodt 2015); or it might be because of higher grazing pressure based on the more nutrient-rich soils and wetter conditions of the sodic patches (because of the hydrology of the catena - Bouwer et al. 2020); and the area might be slightly disturbed as well (Khomo & Rogers 2005) because of high presence of animals (Janecke & Bolton 2020).
A decline in grass cover was observed in the study area during the drought, mostly because of the climate and the impact of grazing on top of that, and this lowered the heterogeneity in the patchiness of the area by creating large bare areas and reducing vegetated areas. The effect of the drought (Van Aardt et al. 2020) could also clearly be seen in smaller grass tufts (Table 2) compared to the previous year's surveys. Statistically significant differences were observed between grass cover of 2015 and that of 2016 on transects in the same locations. Total herbaceous biomass in the sodic area of the Nkuhlu long-term exclusion experiment in KNP was also found to be low, which can be a reflection of the experienced drier conditions (less rainfall, but not drought conditions) throughout that study year, as well as the harsh growing conditions usually because of shallow surface soils and relatively impenetrable subsurface soils of the sodic areas (Dye & Walker 1980; Van Coller et al. 2013). The study area can perhaps sustain herbivores for longer periods, as green vegetation was still available on the catena at the beginning of 2016, the second year of the drought, but not in the surrounding Skukuza area (Janecke et al. 2020).
Vegetation patchiness is common in the savannas and can be observed at specific scales, from landscape scale to individual tree or grass scale. A key driver of savanna ecosystem structure and functioning is the impact of large herbivores. Large herbivores alter standing biomass, woody and herbaceous diversity, and soil characteristics that form part of the heterogeneity in the structure of plant communities. Herbivory can also act as a disturbance by reducing the biomass and canopy cover of specific species and by increasing the spatial heterogeneity in the process (Jacobs & Naiman 2008). Another well-known key driver of heterogeneity at a local scale is the tree-grass interaction that creates patchiness in vegetation cover (Colgan et al. 2012; Sankaran, Ratnam & Hanan 2004). The structure of savannas is a result of several interacting factors that include climate, fire, resource competition, elephant foraging, grazing and browsing that usually operate at different spatial and temporal scales (Sankaran et al. 2004).
This study focussed on reporting the spatial heterogeneity of the catena vegetation structure and its patchy vegetation cover. Different zones are created on the catena because of soil types and characteristics that differ from the crest to the drainage line, and this causes alterations in plant species composition, vegetation structure and patterns in the zones. Vegetation structure ranged between the zones, from a high density of woody plants (including different height classes and crown widths) and a high grass cover to a low density of woody plants (where they were almost absent) and low grass cover. The number of woody plants in different height classes also differed between the upper midslope, sodic site, shrub veld and riparian zone, creating a variation in vertical layering on the catena. Patchiness was observed in alternating areas of different vegetation cover and bare areas that also led to certain patterns in the vegetation. Canopy cover increased the patterning and patchiness of vegetation by creating sub-habitats under the canopies that differed from the inter-canopy open areas. The drought caused changes in the distribution of patterns in the vegetation on the catena by increasing the bare areas to most of the catena, reducing the vegetated areas, and the spatial heterogeneity in the process. Herbivores (including elephants) can impact the observed spatial heterogeneity of the area by changing the vegetation structure and vertical layering (felling, removing and breaking woody plants), species composition and density (feeding more on palatable plants and opening up the vegetation), plant cover and patchiness (intensive grazing in higher nutritional areas and by trampling) and thus also impacting the patterns observed in the vegetation on the catena.
Conclusions
Spatial heterogeneity was found between the catenal zones as differences in the number of woody plants present, various sizes of trees and shrubs, grass cover (bare areas and vegetated areas), patchiness, sub-canopy habitats, etc. Large trees were scarce in the study area and mainly medium-to-small woody plants were present in the vegetation structure. A positive correlation was found between canopy cover and the percentage of shade-tolerant grasses that impact sub-canopy habitats and vegetation patchiness. Significant differences in grass cover were found between the two survey years, with larger bare areas noted in the drought year. Various factors from the literature that could have contributed to the heterogeneity and spatial stratification patterns of the catena ecosystem were mentioned. Some of these factors also play a role in the processes and functioning of the catena ecosystem, such as the nutrient cycling and the impact of animal presence on the habitat and sub-habitats created by the different vegetation structures. This small-scale vegetation structure study was used successfully to describe specific aspects of spatial heterogeneity on the catena and to provide information that can be used as a potential warning system for changes in vegetation structure with regard to specifically the low numbers of large trees. This data can be used by management as an indicator to identify when the study area will reach a Threshold of Potential Concern (TPC) for woody vegetation structure and cover.
Acknowledgements
The author wants to thank the late Fred Kruger from the Organisation for Tropical Studies and the Centre for Environmental Management at the University of the Free State for valuable input into this project and especially for his assistance with fieldwork for this article. The author would also like to thank the following persons and institutions: The University of the Free State Strategic Research Fund for largely funding the multi-disciplinary project; the National Research Foundation for partially funding the research in this article; the staff of SANParks Scientific Services for their friendliness and all the administrative arrangements; Martin Tinneveld (student) for field assistance; and Dr Tascha Vos for all her time and effort with table and figure formatting.
Competing interests
The author declares that she has no financial or personal relationships that may have inappropriately influenced her in writing this article.
Author's contributions
B.B.J. is the sole author of this research article.
Funding information
The University of the Free State Strategic Research Fund largely funded the multi-disciplinary project as a whole, including this part of the study, and the National Research Foundation Thuthuka Grant also partially funded this research.
Data availability statement
Data from all research done within Kruger National Park is placed within the SANParks repository (not for free, open access).
Disclaimer
The views and opinions expressed in this article are the author's own and do not necessarily reflect the official policy or position of the institution or funder.
References
Adjorlolo, C. & Mutanga, O., 2013, 'Integrating remote sensing and geostatistics to estimate woody vegetation in an African savanna', Journal of Spatial Science 58(2), 305-322. https://doi.org/10.1080/14498596.2013.815577 [ Links ]
Asner, G.P., Levick, S.R., Kennedy-Bowdoin, T., Knapp, D.E., Emerson, R., Jacobson, J., et al., 2009, 'Large-scale impacts of herbivores on the structural diversity of African savannas', Proceedings of the National Academy of Sciences 106(12), 4947-4952. https://doi.org/10.1073/pnas.0810637106 [ Links ]
Augustine, D.J., 2003, 'Spatial heterogeneity in the herbaceous layer of a semi-arid savanna ecosystem', Plant Ecology 167(2), 319-332. https://doi.org/10.1023/A:1023927512590 [ Links ]
Bailey, C.L. & Scholes, M.C., 1997, 'Comparative patterns of sodium accumulation in leaves of selected savanna species growing on sodic and nonsodic soils', South African Journal of Plant and Soil 14(3), 103-106. https://doi.org/10.1080/02571862.1997.10635090 [ Links ]
Belsky, A.J., 1994, 'Influences of trees on savanna productivity: Tests of shade, nutrients, and tree-grass competition', Ecology 75(4), 922-932. https://doi.org/10.2307/1939416 [ Links ]
Blozan, W., 2006, 'Tree measuring guidelines of the eastern native tree society', Bulletin of the Eastern Native Tree Society 1(1), 1-8. [ Links ]
Bond, W.J., 2008, 'What limits trees in C4 grasslands and savannas?', Annual Review of Ecology, Evolution and Systematics 39(1), 641-659. https://doi.org/10.1146/annurev.ecolsys.39.110707.173411 [ Links ]
Bouwer, D., Le Roux, P.A.L. & Van Tol, J.J., 2020, 'Identification of hydropedological flowpaths in Stevenson-Hamilton catena from soil morphological, chemical and hydraulic properties', Koedoe 62(2), a1584. https://doi.org/10.4102/koedoe.v62i2.1584 [ Links ]
Buitenwerf, R., Swemmer, A.M. & Peel, M.J.S., 2011, 'Long-term dynamics of herbaceous vegetation structure and composition in two African savanna reserves: Effects of rainfall on herbaceous vegetation', Journal of Applied Ecology 48(1), 238-246. https://doi.org/10.1111/j.1365-2664.2010.01895.x [ Links ]
Colgan, M.S., Asner, G.P., Levick, S.R., Martin, R.E. & Chadwick, O.A., 2012, 'Topo-edaphic controls over woody plant biomass in South African savannas', Biogeosciences 9(5), 1809-1821. https://doi.org/10.5194/bg-9-1809-2012 [ Links ]
Davidson, Z., Valeix, M., Loveridge, A.J., Hunt, J.E., Johnson, P.J., Madzikanda, H. et al., 2012, 'Environmental determinants of habitat and kill site selection in a large carnivore: Scale matters', Journal of Mammalogy 93(3), 677-685. https://doi.org/10.1644/10-MAMM-A-424.1 [ Links ]
Druce, D.J., Shannon, G., Page, B.R., Grant, R. & Slotow, R., 2008, 'Ecological thresholds in the savanna landscape: Developing a protocol for monitoring the change in composition and utilisation of large trees', PLoS One 3(12), 1-12. e3979. https://doi.org/10.1371/journal.pone.0003979 [ Links ]
Du Toit, J.T., 2003, 'Large herbivores and savanna heterogeneity', in J.T. Du Toit, K.H. Rogers & H.C. Biggs (eds.), The Kruger experience: Ecology and management of savanna heterogeneity, pp. 292-309, Island Press, Washington, WA. [ Links ]
Dye, P.J. & Walker, B.H., 1980, 'Vegetation-environment relations on sodic soils of Zimbabwe Rhodesia', The Journal of Ecology 68(2), 589-602. https://doi.org/10.2307/2259424 [ Links ]
Eckhardt, H.C., Wilgen, B.W. & Biggs, H.C., 2000, 'Trends in woody vegetation cover in the Kruger National Park, South Africa, between 1940 and 1998', African Journal of Ecology 38(2), 108-115. https://doi.org/10.1046/j.1365-2028.2000.00217.x [ Links ]
Emmet, M. & Pattrick, S., 2012, Game Ranger in your backpack: All-in-one interpretative guide to the lowveld, Briza Publications, Pretoria. [ Links ]
Evans, R.A. & Love, R.M., 1957, 'The step-point method of sampling: A practical tool in range research', Journal of Range Management 10(5), 208-212. https://doi.org/10.2307/3894015 [ Links ]
Gillson, L. & Duffin, K.I., 2007, 'Thresholds of potential concern as benchmarks in the management of African savannahs', Philosophical Transactions of the Royal Society B: Biological Sciences 362(1478), 309-319. https://doi.org/10.1098/rstb.2006.1988 [ Links ]
Gordijn, P.J., Rice, E. & Ward, D., 2012, 'The effects of fire on woody plant encroachment are exacerbated by succession of trees of decreased palatability', Perspectives in Plant Ecology, Evolution and Systematics 14(6), 411-422. https://doi.org/10.1016/j.ppees.2012.09.005 [ Links ]
Grant, C.C. & Scholes, M.C., 2006, 'The importance of nutrient hot-spots in the conservation and management of large wild mammalian herbivores in semi-arid savannas', Biological Conservation 130(3), 426-437. https://doi.org/10.1016/j.biocon.2006.01.004 [ Links ]
Grant, R.C.C., Peel, M.J.S., Bezuidenhout, H. & Grant, R., 2011, 'Evaluating herbivore management outcomes and associated vegetation impacts', Koedoe 53(2), 116-130. https://doi.org/10.4102/koedoe.v53i2.1008 [ Links ]
Holdo, R.M., 2007, 'Elephants, fire, and frost can determine community structure and composition in Kalahari Woodlands', Ecological Applications 17(2), 558-568. https://doi.org/10.1890/05-1990 [ Links ]
Jacobs, S.M. & Naiman, R.J., 2008, 'Large African herbivores decrease herbaceous plant biomass while increasing plant species richness in a semi-arid savanna toposequence', Journal of Arid Environments 72(6), 891-903. https://doi.org/10.1016/j.jaridenv.2007.11.015 [ Links ]
Janecke, B.B. & Bolton, J.G., 2020, 'Variation in mammal habitat and diversity affect heterogeneity and processes of granite catena', Koedoe 62(2), a1592. https://doi.org/10.4102/koedoe.v62i2.1592 [ Links ]
Janecke, B.B. & Smit, G.N., 2011, 'Phenology of woody plants in riverine thicket and its impact on browse availability to game species', African Journal of Range & Forage Science 28(3), 139-148. https://doi.org/10.2989/10220119.2011.642075 [ Links ]
Janecke, B.B., Van Tol, J.J., Smit, I.P.J., Van Aardt, A.C., Riddell, E., Seaman, M.T. et al., 2020, 'Biotic and abiotic connections on a granitic catena: Framework for multidisciplinary research', Koedoe 62(2), a1600. https://doi.org/10.4102/koedoe.v62i2.1600 [ Links ]
Jennings, S., Brown, N.D. & Sheil, D., 1999, 'Assessing forest canopies and understorey illumination: Canopy closure, canopy cover and other measures', Forestry 72(1), 59-74. https://doi.org/10.1093/forestry/72.1.59 [ Links ]
Joubert, S.C.J., 2016, 'Animal behaviour', in J. du P. Bothma & J.T. Du Toit (eds.), Game ranch management, pp. 385-392, Van Schaik Publishers, Pretoria. [ Links ]
Khan, S.U., Khan, I., Zhao, M., Khan, A.A. & Ali, M.A.S., 2019, 'Valuation of ecosystem services using choice experiment with preference heterogeneity: A benefit transfer analysis across inland river basin', Science of the Total Environment 679, 126-135. https://doi.org/10.1016/j.scitotenv.2019.05.049 [ Links ]
Khomo, L., Hartshorn, A.S., Rogers, K.H. & Chadwick, O.A., 2011, 'Impact of rainfall and topography on the distribution of clays and major cations in granitic catenas of southern Africa', Catena 87(1), 119-128. https://doi.org/10.1016/j.catena.2011.05.017 [ Links ]
Khomo, L.M. & Rogers, K.H., 2005, 'Proposed mechanism for the origin of sodic patches in Kruger National Park, South Africa', African Journal of Ecology 43(1), 29-34. https://doi.org/10.1111/j.1365-2028.2004.00532.x [ Links ]
Leckie, D., Gougeon, F., Hill, D., Quinn, R., Armstrong, L. & Shreenan, R., 2003, 'Combined high-density LIDAR and multispectral imagery for individual tree crown analysis', Canadian Journal of Remote Sensing 29(5), 633-649. https://doi.org/10.5589/m03-024 [ Links ]
Leverett, B. & Bertolette, D., n.d., Champion trees measuring guidelines handbook, viewed 28 November 2018, from https://www.americanforests.org/wp-content/uploads/2014/12/AF-Tree-Measuring-Guidelines_LR.pdf. [ Links ]
Lévesque, J. & King, D.J., 2003, 'Spatial analysis of radiometric fractions from high-resolution multispectral imagery for modelling individual tree crown and forest canopy structure and health', Remote Sensing of Environment 84(4), 589-602. https://doi.org/10.1016/S0034-4257(02)00182-7 [ Links ]
Levick, S.R. & Asner, G.P., 2013, 'The rate and spatial pattern of treefall in a savanna landscape', Biological Conservation 157, 121-127. https://doi.org/10.1016/j.biocon.2012.07.009 [ Links ]
Ludwig, J.A., Tongway, D.J., Eager, R.W., Williams, R.J. & Cook, G.D., 1999, 'Fine-scale vegetation patches decline in size and cover with increasing rainfall in Australian savannas', Landscape Ecology 14(6), 557-566. https://doi.org/10.1023/A:1008112122193 [ Links ]
McNaughton, S.J., 1983, 'Serengeti grassland ecology: The role of composite environmental factors and contingency in community organization', Ecological Monographs 53(3), 291-320. https://doi.org/10.2307/1942533 [ Links ]
Murwira, A. & Skidmore, A.K., 2006, 'Monitoring change in the spatial heterogeneity of vegetation cover in an African savanna', International Journal of Remote Sensing 27(11), 2255-2269. https://doi.org/10.1080/01431160500396683 [ Links ]
Naiman, R.J. & Rogers, K.H., 1997, 'Large animals and system-level characteristics in river corridors', BioScience 47(8), 521-529. https://doi.org/10.2307/1313120 [ Links ]
O'Connor, T.G., 1998, 'Impact of sustained drought on a semi-arid Colophospermum mopane savanna', African Journal of Range & Forage Science 15(3), 83-91. https://doi.org/10.1080/10220119.1998.9647948 [ Links ]
Owensby, C.E., 1973, 'Modified step-point system for botanical composition and basal cover estimates', Journal of Range Management 26(4), 302-303. https://doi.org/10.2307/3896585 [ Links ]
Peel, M.J.S., Kruger, J.M. & Zacharias, P.J.K., 2005, 'Environmental and management determinants of vegetation state on protected areas in the eastern Lowveld of South Africa', African Journal of Ecology 43(4), 352-361. https://doi.org/10.1111/j.1365-2028.2005.00590.x [ Links ]
Pickett, S.T.A., Cadenasso, M.L. & Benning, T.L., 2003, 'Biotic and abiotic variability as key determinants of savanna heterogeneity at multiple spatiotemporal scales', in J.T. Du Toit, K.H. Rogers & H.C. Biggs (eds.), The Kruger experience: Ecology and management of savanna heterogeneity, pp. 22-40, Island Press, Washington, WA. [ Links ]
Riddell, E.S., Nel, J.M., Van Tol, J.J., Fundisi, D., Jumbi, F., Van Niekerk, A. et al., 2020, 'Groundwater-surface water interactions in an ephemeral savanna catchment, Kruger National Park', Koedoe 62(2), a1583. https://doi.org/10.4102/koedoe.v62i2.1583 [ Links ]
Riginos, C., Grace, J.B., Augustine, D.J. & Young, T.P., 2009, 'Local versus landscape-scale effects of savanna trees on grasses', Journal of Ecology 97(6), 1337-1345. https://doi.org/10.1111/j.1365-2745.2009.01563.x [ Links ]
Roodt, V., 2015, Grasses and grazers of Botswana and the surrounding savanna, Struik Nature Publishers, Cape Town. [ Links ]
Sankaran, M., Hanan, N.P., Scholes, R.J., Ratnam, J., Augustine, D.J., Cade, B.S. et al., 2005, 'Determinants of woody cover in African savannas', Nature 438(7069), 846-849. https://doi.org/10.1038/nature04070 [ Links ]
Sankaran, M., Ratnam, J. & Hanan, N., 2008, 'Woody cover in African savannas: The role of resources, fire and herbivory', Global Ecology and Biogeography 17(2), 236-245. https://doi.org/10.1111/j.1466-8238.2007.00360.x [ Links ]
Sankaran, M., Ratnam, J. & Hanan, N.P., 2004, 'Tree-grass coexistence in savannas revisited - insights from an examination of assumptions and mechanisms invoked in existing models', Ecology Letters 7(6), 480-490. https://doi.org/10.1111/j.1461-0248.2004.00596.x [ Links ]
Scholes, R. & Walker, B.H., 1993, An African savanna: Synthesis of the Nylsvley study, Cambridge University Press, Cambridge, NY. [ Links ]
Shannon, G., Druce, D.J., Page, B.R., Eckhardt, H.C., Grant, R. & Slotow, R., 2008, 'The utilization of large savanna trees by elephant in southern Kruger National Park', Journal of Tropical Ecology 24(3), 281-289. https://doi.org/10.4102/koedoe.v50i1.138 [ Links ]
Siebert, F. & Eckhardt, H.C., 2008, 'The vegetation and floristics of the Nkhuhlu exclosures, Kruger National Park', Koedoe, 50(1), 126-144. https://doi.org/10.4102/koedoe.v50i1.138 [ Links ]
Smit, G.N. & Swart, J.S., 1994, 'The influence of leguminous and non-leguminous woody plants on the herbaceous layer and soil under varying competition regimes in mixed bushveld', African Journal of Range and Forage Science 11(1), 27-33. https://doi.org/10.1080/10220119.1994.9638350 [ Links ]
Smit, I.P.J., 2020, 'Integrating multi-scaled and multi-disciplinary studies: A critical reflection on the Kruger National Park Research Supersites', Koedoe 62(2), a1586. https://doi.org/10.4102/koedoe.v62i2.1586 [ Links ]
Smit, I.P.J., Riddell, E.S., Cullum, C. & Petersen, R., 2013, 'Kruger National Park research supersites: Establishing long-term research sites for cross-disciplinary, multiscaled learning', Koedoe 55(1), Art. #1107, 7 pages. https://doi.org/10.4102/koedoe.v55i1.1107 [ Links ]
Smit, N., 2014, 'BECVOL 3: An expansion of the aboveground biomass quantification model for trees and shrubs to include the wood component', African Journal of Range & Forage Science 31(2), 179-186. https://doi.org/10.2989/10220119.2013.866161 [ Links ]
Stangroom, J., 2019, 'Different statistical calculators, social science statistics', viewed 05 December 2019, from https://www.socscistatistics.com/tests/pearson/default.aspx. [ Links ]
Theron, E.J., Van Aardt, A.C. & Du Preez, P.J., 2020, 'Vegetation distribution along a granite catena, southern Kruger National Park', Koedoe 62(2), a1588. https://doi.org/10.4102/koedoe.v62i2.1588 [ Links ]
Treydte, A.C., Heitkönig, I.M.A., Prins, H.H.T. & Ludwig, F., 2007, 'Trees improve grass quality for herbivores in African savannas', Perspectives in Plant Ecology, Evolution and Systematics 8(4), 197-205. https://doi.org/10.1016/j.ppees.2007.03.001 [ Links ]
Treydte, A.C., Riginos, C. & Jeltsch, F., 2010, 'Enhanced use of beneath-canopy vegetation by grazing ungulates in African savannahs', Journal of Arid Environments 74(12), 1597-1603. https://doi.org/10.1016/j.jaridenv.2010.07.003 [ Links ]
Treydte, A.C., Van Der Beek, J.G.M., Perdok, A.A. & Van Wieren, S.E., 2011, 'Grazing ungulates select for grasses growing beneath trees in African savannas', Mammalian Biology 76(3), 345-350. https://doi.org/10.1016/j.mambio.2010.09.003 [ Links ]
Turner, M.G., 1989, 'Landscape ecology: The effect of pattern on process', Annual Review of Ecological Systems 20, 171-197. https://doi.org/10.1146/annurev.es.20.110189.001131 [ Links ]
Van Aardt, A.C., Codron, D., Theron, E.J. & Du Preez, P.J., 2020, 'Plant community structure and possible vegetation changes after drought on a granite catena in the Kruger National Park, South Africa', Koedoe 62(2), a1585. https://doi.org/10.4102/koedoe.v62i2.1585 [ Links ]
Van Coller, H., Siebert, F. & Siebert, S.J., 2013, 'Herbaceous species diversity patterns across various treatments of herbivory and fire along the sodic zone of the Nkuhlu exclosures, Kruger National Park', Koedoe 55(1), 1ߝ6. https://doi.org/10.4102/koedoe.v55i1.1112 [ Links ]
Van Oudtshoorn, F., 2012, Guide to grasses of Southern Africa, 3rd edn., Briza Publications, Pretoria. [ Links ]
Venter, F.J., Scholes, R.J. & Eckhardt, H.C., 2003, 'The abiotic template and its associated vegetation pattern', in J. Du Toit, H. Biggs & K.H. Rogers (eds.), The Kruger experience: Ecology and management of savanna heterogeneity, pp. 83-129, Island Press, London. [ Links ]
Wang, J.F., Zhang, T.L. & Fu, B.J., 2016, 'A measure of spatial stratified heterogeneity', Ecological Indicators 67, 250-256. https://doi.org/10.1016/j.ecolind.2016.02.052 [ Links ]
Weil, R.R. & Brady, N.C., 2016, The nature and properties of soils, 15th edn., Pearson Education Limited, Harlow. [ Links ]
Whyte, I.J., Van Aarde, R. & Pimm, S.L., 2003, 'Kruger's elephant population: Its size and consequences for ecosystem heterogeneity', in J.T. Du Toit, K.H. Rogers & H.C. Biggs (eds.), The Kruger experience: Ecology and management of savanna heterogeneity, pp. 332-348, Island Press, Washington, WA. [ Links ]
Correspondence:
Beanelri B. Janecke
janeckbb@ufs.ac.za
Received: 11 Sept. 2019
Accepted: 19 Apr. 2020
Published: 10 Sept. 2020


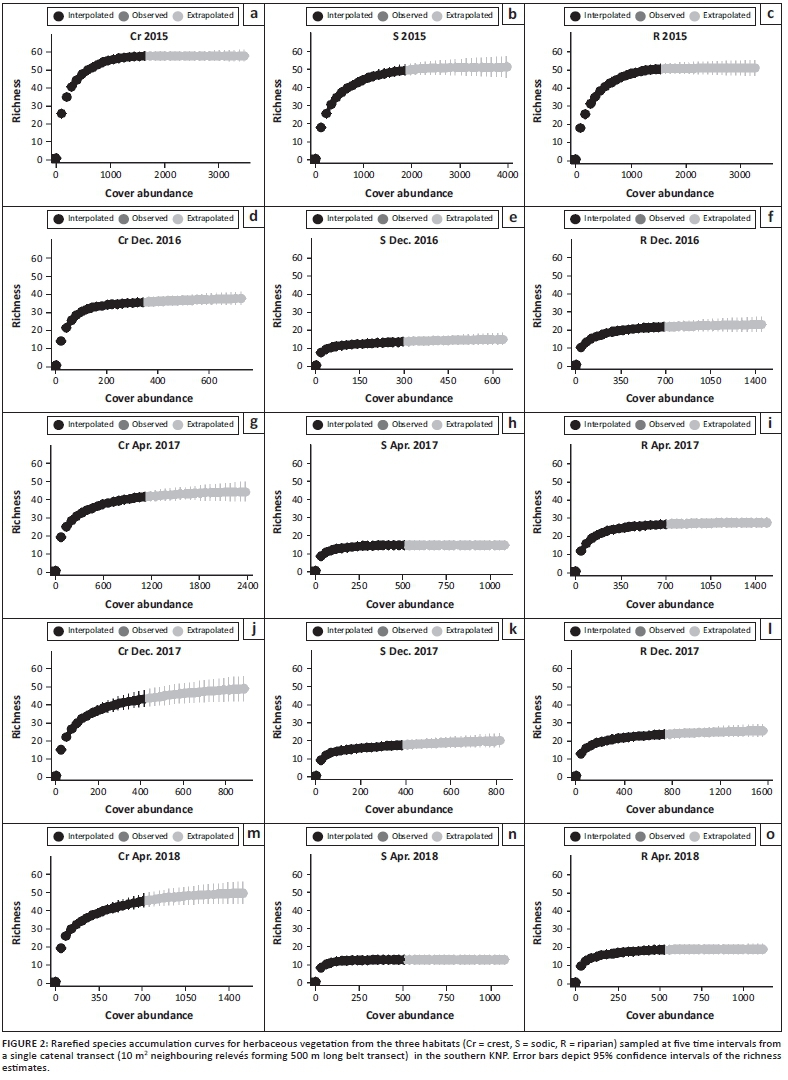
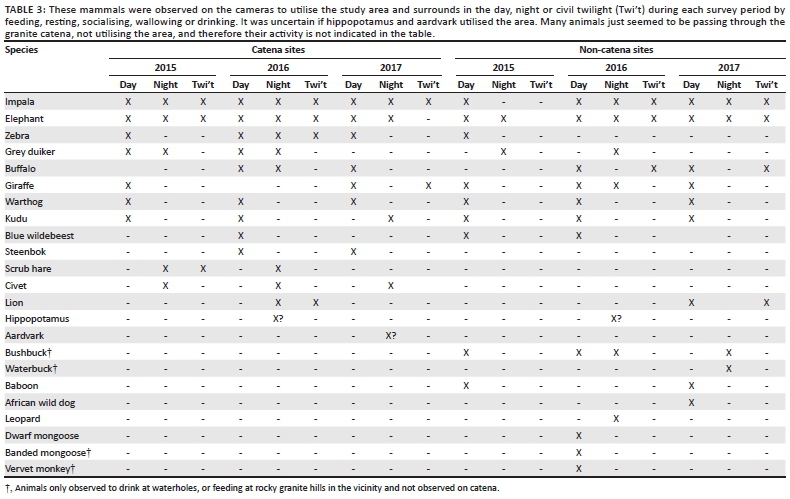
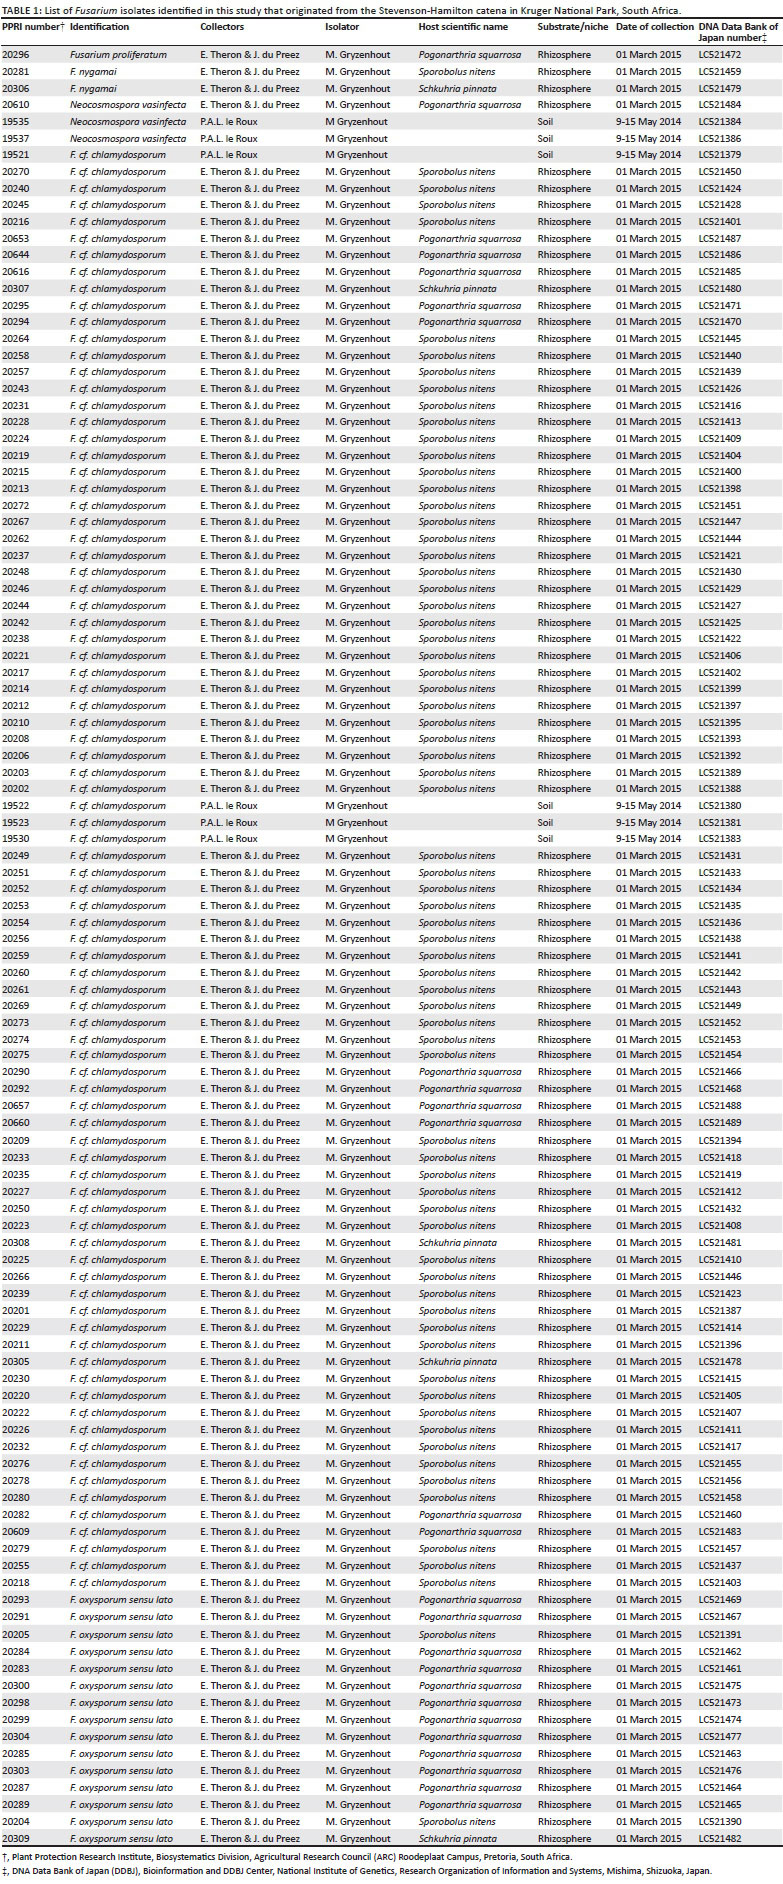
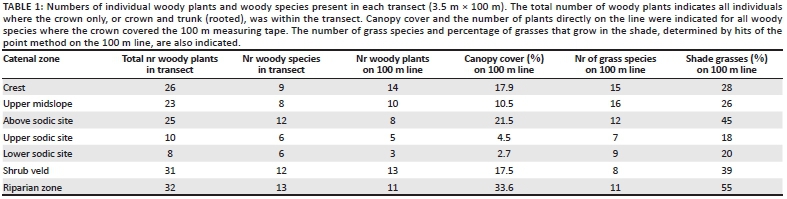
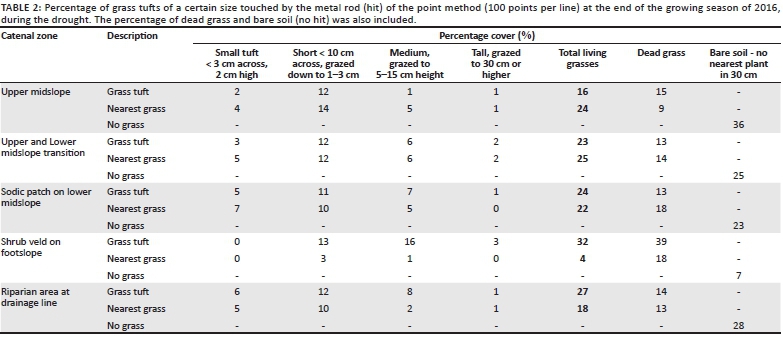