


Services on Demand
Article
 English (pdf)
 Article in xml format
 Article references
Indicators

Related links
-
 Cited by Google
 -
 Similars in Google
Share

 Permalink
Koedoe
On-line version ISSN 2071-0771
Print version ISSN 0075-6458
Koedoe vol.61 n.1 Pretoria 2019
http://dx.doi.org/10.4102/koedoe.v61i1.1574
ORIGINAL RESEARCH
Ecology of palustrine wetlands in Lesotho: Vegetation classification, description and environmental factors
Peter ChatangaI, II; Erwin J.J. SiebenI
ISchool of Agricultural, Earth and Environmental Sciences, University of KwaZulu-Natal, Westville, Durban, South Africa
IIDepartment of Biology, Faculty of Science and Technology, National University of Lesotho, Roma, Lesotho
ABSTRACT
The description and classification of wetland vegetation is important for water resource management and biodiversity conservation as it provides an understanding of the wetland vegetation-environment relationships and information to interpret spatial variation in plant communities. This study discusses the vegetation of the palustrine wetlands of Lesotho based on a phytosociological approach. Data on vegetation and various environmental variables were collected using the Braun-Blanquet method and a standardised protocol developed for environmental information of wetlands in South Africa. The data were analysed mainly by clustering and ordination techniques. Twenty-two communities were found by the classification of the wetland vegetation. These communities were found to be diverse in terms of species richness. The ordination revealed that the wetland vegetation is mainly influenced by altitude, longitude, slope, soil parent material, landscape, inundation, potassium content, soil texture, total organic carbon, nitrogen, electrical conductivity and latitude. Regarding species composition and diversity, plant communities in the Highlands were more diverse and were distinctively different from those in the Lowlands. High-altitude communities were also found to be dominated mainly by C3 plants, while those at low altitudes exhibited the dominance of C4 species. Some communities were either restricted to the Highlands or Lowlands but others exhibited a wide ecological amplitude and occurred over an extensive altitudinal range. The diversity of most of the wetlands, coupled with their restricted habitat, distribution at high altitudes and their role in supplying ecosystem services that include water resources, highlights the high conservation value associated with these wetlands, particularly in the face of climate change and loss of biodiversity.
CONSERVATION IMPLICATIONS: The study can be invaluable to wetland scientists, managers, biodiversity conservationists, water resource managers and planners and vegetation ecologists in Southern Africa. About 70% of Lesotho falls in the Maloti-Drakensberg, accounting for about 60% of the region, and this makes the study important in biodiversity conservation planning, particularly in the Highlands. The wetlands in Lesotho face severe anthropogenic pressures that include overgrazing and economic development. Given that the Lesotho Highlands as a water catchment is not only important for Lesotho, but also for South Africa and Namibia, the conservation of the associated wetlands and this critical water resource is indispensable
Keywords: anthropogenic; biodiversity conservation; canonical ordination; climate change; Maloti-Drakensberg; plant community; palustrine wetlands; phytosociology; vegetation classification.
Introduction
Palustrine wetlands, which cover about 6% of the earth's land surface, are among the most ecologically sensitive ecosystems and very important globally because of their unique role in biogeochemical cycles (Junk et al. 2013; Mitsch & Gosselink 2015). Because they support azonal vegetation that is distinct from the surrounding vegetation (Mucina & Rutherford 2006; Sieben et al. 2016), wetlands are ecological 'islands' within terrestrial environments in different landscapes across the globe. The distinction results from the prolonged water logging that causes oxygen deficiency (hypoxia) or its total absence (anoxia) in the wetland soil, with subsequent chemical changes in soil characteristics (Gopal 2015; Mitsch & Gosselink 2015). Mucina and Rutherford (2006) observed that the presence of water, whether seasonal or permanent, is the primary factor in creating wetland habitats and associated vegetation. Nonetheless, it is not wetness per se that primarily influences the geochemistry and morphology of wetland soils, but rather the anaerobic conditions that result from prolonged soil saturation or flooding (Collins 2005; Kotze et al. 1996).
Montane palustrine wetlands are a special sub-division of freshwater palustrine wetlands that are embedded within terrestrial ecosystems in mountain areas (Mucina & Rutherford 2006). These wetlands are often rich in endemics because many species remain isolated in high-altitude habitats (Junk et al. 2013). By providing a wide spectrum of ecosystem services, these ecosystems are of high ecological and socio-economic importance (Chatterjee et al. 2010). High-altitude wetlands provide essential ecosystem services which help to sustain human life, conserve biodiversity, preserve the hydrological regime and combat the impacts of climate change and are thereby key to water, food and ecological security (Singha 2011). Montane wetlands are located in the headwaters of major river basins, providing water for many trans-boundary rivers and play an important role in the ecology and hydrology of the local environment and downstream systems. They also play a fundamental role in the overall global and regional water cycles (Russi et al. 2013; Sieben, Mtshali & Janks 2014).
The montane wetlands of Lesotho are important for the supply of ecosystem services, including biodiversity conservation, water resources, livestock grazing, harvestable plant products and environmental regulation. Lesotho forms an important hydrological reservoir and watershed for several countries in Southern Africa (Nüsser & Grab 2002). For example, the montane wetlands in the country form part of the headwaters of one of the most important international watercourses in Southern Africa, the Senqu-Orange River (ORASECOM 2015), which is not only important for Lesotho, but also for South Africa and Namibia. Lesotho falls entirely within the catchment of this river system (ORASECOM 2015) and the country is drained by the river and its tributaries. Moreover, the high-altitude wetlands of Lesotho are critical in maintaining the water levels not only in dams supporting the Lesotho Highlands Water Project (LHWP), which transfers water to South Africa (Grab & Deschamps 2004), but also in those supplying the local population. Directly and indirectly, wetlands in Lesotho are estimated to contribute about 22% of the country's gross domestic products (GDPs) and 30% of the total employment in the country (Department of Environment 2014). Furthermore, by providing freshwater that is transferred to the most densely populated and industrialised area of Gauteng, the wetlands in Lesotho also play a key role in the South African economy.
The most ubiquitous and conspicuous feature of the wetland environment, which also plays a critical role in wetland ecosystem functioning, is the vegetation (Cronk & Fennessy 2001; Gopal 2016). As a result, the description of wetland habitats based on vegetation and the associated classifications are useful in strategic planning for the conservation of wetlands (Mitsch & Gosselink 2015). Plants are such a critical component of wetlands that they are the most widely supported biotic indicator for assessing wetland condition (Collins 2005). Accordingly, vegetation is the most suitable feature to consider over a broad range of wetland habitats (Sieben et al. 2014). Within a single wetland, a large diversity of habitats may occur, and as a result, large differences in the types of vegetation may be observed in the same wetland (Mitsch & Gosselink 2000). Therefore, wetland habitats can be classified based on the plant communities in the system (Collins 2005; Sieben, Kotze & Morris 2010a).
Plant species occurring in a wetland can be used as indicators of environmental conditions and ecological changes taking place in the system (Mitsch & Gosselink 2015) because wetland vegetation is azonal (Brand, Du Preez & Brown 2013) and responds quickly to local environmental changes (Cronk & Fennessy 2001). Because the plant community gives a characterisation of habitat units within a wetland and also serves as habitat for associated animals, a detailed wetland vegetation description for a given wetland can be used as a proxy for the system's biodiversity in general, highlighting the conservation value of the wetland (Sieben et al. 2016). Accordingly, the determination of wetland plants that are useful as biological indicators has become increasingly important for use in monitoring the integrity of specific wetlands (Sieben et al. 2014). Wetland typology provides useful information for water resource management and biodiversity conservation (Sieben et al. 2014).
Given the importance of wetlands, recent studies (Moor et al. 2017; Sieben et al. 2016) have emphasised the need for more information about their species composition, ecology and distribution. Although many studies have been carried out in the wetlands of surrounding South Africa (e.g. Brand et al. 2013; Sieben et al. 2014, 2016), no recent detailed countrywide survey has been conducted on the wetland vegetation of Lesotho. The current study is the first to provide a characterisation of the wetland vegetation in detail, covering many wetlands in the country.
The aims of this study for the palustrine wetlands of Lesotho are:
· to produce a phytosociological classification and name the wetland plant communities
· to map the distribution of the vegetation of the palustrine wetlands using the phytosociological method
· to explore and describe the wetland vegetation-environment relationships.
Materials and methods
Study design
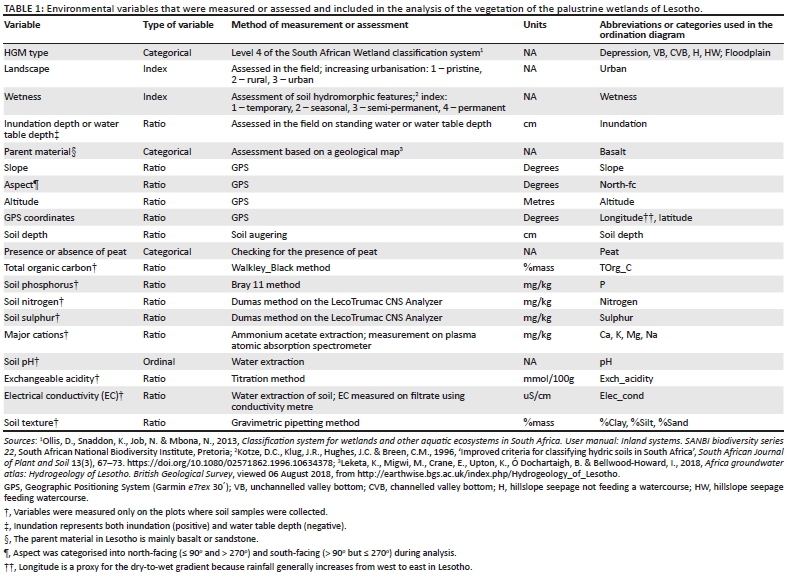
The vegetation of the palustrine wetlands of Lesotho was characterised using a phytosociological approach. The selection of wetlands for sampling was performed in such a way that as much wetland variation as possible in the country was captured with the available time and resources. An attempt was also made to include wetlands in protected areas such as national parks and nature reserves. Fieldwork was carried out during the wet (summer) season, which commenced in February 2017 and ended in March 2018. The study focused on accessible wetlands. In general, the method followed Sieben et al. (2014) to make the results compatible with the South African National Wetland Vegetation Database. Although many wetlands are showing signs of degradation, where wetland density was high and the systems showed little observable variation, large or near-pristine wetlands were selected for the assessment. Depending on the location, each wetland was classified as pristine, rural or urban (Table 1). A 3 × 3 m representative sample plot (quadrat) was then located randomly in each visually distinct and homogenous vegetation type of each selected wetland where different attributes of the vegetation and environment were measured and recorded. This plot size has been recommended for grassy wetlands in Southern Africa (Brown et al. 2013; Sieben et al. 2014). The same plot size has also been recommended for overgrazed grasslands (Brown et al. 2013), a situation that is common in some parts of Lesotho where wetland disturbance by livestock grazing and trampling is widespread. The number of plots per wetland was dependent on the number of observable distinct and homogenous vegetation units within the wetland.
Assessment of vegetation and environmental variables
In each plot, the Braun-Blanquet method, a protocol often used for collecting vegetation data in South Africa (Brown et al. 2013; Sieben et al. 2014), was used for vegetation assessment. Because this method has been applied in South Africa for several decades, it is possible to make comparisons between current and historical data (Brown et al. 2013), which allows for effective plant community comparisons. The method involves assessing wetland vegetation in a stratified manner where plots are placed randomly in each distinct plant community and the species composition is recorded by determining the species present, as well as estimating the cover for each species using a cover-abundance scale. Placing vegetation plots in a stratified manner ensures that as much variation as possible in the wetland is captured, including the different categories of indicators species - obligate wetland (OBL), facultative wetland (FACW), facultative (FAC), facultative upland (FACU) and obligate upland (UPL) (Mitsch & Gosselink 2015). Vegetation structure was described by making estimations of the proportion of the plot covered by vegetation and visually estimating the average height of the vegetation. In case of inundation, the average vegetation height was estimated from the soil surface (Sieben et al. 2014). During the survey, the plant species were identified with the help of botanical field guides (Pooley 2003; Van Oudtshoorn 2014) and those that could not be identified in the field were collected and later taken to the Roma Herbarium (ROML) at the National University of Lesotho for identification.
For each plot, in addition to the vegetation attributes, a standardised protocol developed for environmental information of wetlands in South Africa was also used to systematically measure or assess a number of environmental variables that have been recommended for wetlands (Sieben et al. 2014). In at least one plot per wetland, a soil sample was collected from the top 15 cm of the soil (vegetation rooting zone) using a soil auger. Both vegetation and environmental data were recorded in a wetland field data collection form (Online Appendix 5). Because of the limited funding for the study, soil sampling was limited to one plot per wetland. The plot chosen for soil sampling would be the one representing the most widespread distinct community in the wetland. The samples were packaged in airtight (zipped) plastic bags for further analysis as recommended by Stohlgren et al. (1998). The soil samples were air-dried for at least 48 h and later analysed for different variables (Table 1). The soil analyses were performed by the analytical laboratory service of the Institute for Commercial Forestry Research in Pietermaritzburg, South Africa. The environmental and soil variables included in the study, as well as the methods used for their measurement or assessment, are briefly described (Table 1). While most variables were measured or assessed on site in all vegetation plots, additional soil variables (indicated with an asterisk in Table 1) were measured in the laboratory and only on those plots where soil samples were collected. After describing the plots in each wetland, as much of the wetland would be surveyed to record species occurring within the wetland system but were not encountered in the plots. This was in an attempt to ensure a species list that is as complete as possible for the wetland system for additional floristic analysis.
Data analysis
Both vegetation and environmental data were captured in Microsoft Excel spreadsheets from which they were imported into PC-Ord (Mjm Software Design, Gleneden Beach. OR, United States) and CANOCO (Microcomputer Power, Ithaca, NY, United States) programmes for analysis. Prior to importing into these programs for analysis, the Braun-Blanquet vegetation cover values were converted into percentage cover (Mueller-Dombois & Ellenberg 1974; Omar, Maroyi & Van Tol 2016; Van der Maarel 1979). ArcGIS version 10.2 was used to map the distribution range of the wetland vegetation plots in the study area and to determine the distribution range of the wetland plant communities in Lesotho.
Based on the recommendations by Brown et al. (2013), species richness, diversity and evenness were determined. For each plot, these were determined by calculating Shannon-Weiner index (H′) and evenness index (E), as well as listing the species. The fraction of the plot that was occupied by species i was referred to as pi, and this value is an indication of the relative abundance of species i. The pi was used to calculate the H′ and E, which are surrogates of species diversity, by the following formulae (Ludwig & Reynolds 1988):
where pi is the proportion of species i and ln is the natural logarithm.
where s is the species richness (number of species).
To elucidate the ecological patterns in the vegetation of the palustrine wetlands of Lesotho, a number of multivariate statistical techniques were employed. For the data analyses of this multivariate ecological community, three main types of analyses were employed: (1) hierarchical cluster analysis (HCA), (2) indicator species analysis (ISA) and (3) canonical correspondence analysis (CCA). These were performed mainly following Sieben et al. (2014).
Classification and indicator species analysis
Cluster analysis was used to classify sites with respect to similarity or dissimilarity (Van Tongeren 1995). Classification makes the use of similarity between vegetation plots such that plots which are more similar in species composition are grouped together. Classification facilitates the description and ecological interpretation of plant communities from a large amount of vegetation data. Classification and description of vegetation not only provide an understanding of the vegetation-environment relationships, but also information to interpret the spatial variation between plant communities (Clegg & O'Connor 2012). Accordingly, to obtain vegetation typology of the palustrine wetlands of Lesotho, agglomerative HCA was performed on vegetation data to identify homogenous plant communities in the wetlands. This would enable vegetation plots that are similar in species composition to be grouped together, with emphasis on the relationships between them (McCune & Mefford 2011; Van Tongeren 1995).
The classification was performed by grouping vegetation plots based on species composition and abundance data. PC-Ord version 6.0 was used for the classification (McCune & Mefford 2011). Non-transformed percentage plant cover data were used for the clustering. The best interpretable classification was produced by the combination of the Sørenson's (Bray-Curtis) similarity index and Ward's linkage method. The Ward's method has been reported to have an advantage of producing clearly defined clusters (Pla et al. 2012). The plant communities obtained were named following the guidelines by Brown et al. (2013). However, in cases where there was no clear dominant, the name was derived from the description (structure and distribution) of the community.
Indicator species analysis was used as an objective criterion for determining the optimal number of clusters in the final dendrogram. This was achieved by repeating the clustering algorithm while varying the number of clusters (Dufrêne & Legendre 1997) and the number that gave the lowest average p-value of the indicator species was used in the final dendrogram (Peck 2010). The ISA was also used in characterising different wetland plant communities obtained from the final clusters. Indicator species with indicator values (IVs) greater than 20 and significant (p ≤ 0.05) in the Monte Carlo permutation test were considered real indicators (Sieben et al. 2016) and were therefore listed for each cluster. The ISA is often used to test the fidelity (faithfulness) of a species to a given community. The Monte Carlo permutation test (also available in PC-Ord) was also used to test for the statistical significance of the fidelity of the indicator species to the communities (Dufrêne & Legendre 1997). The ISA was also conducted in PC-Ord. For each community obtained from the classification, the median and range for species richness, diversity index, and evenness and means for vegetation height and cover were determined.
Ordination
Another important feature of the analysis was the relationship between wetland plant communities and explanatory variables. Consequently, to examine the influence of environmental variables and gradients on wetland vegetation, the vegetation and environmental variable data and the plant communities obtained from the classification were subjected to canonical ordination (Ter Braak & Šmilauer 1998). This was performed twice: (1) constrained CCA on all vegetation plots using species abundance data and environmental variables and (2) constrained CCA only on those vegetation plots where soil samples had been taken, using species abundance data and more detailed explanatory data. Data of log-transformed percentage plant cover were used for the ordination. The choice for CCA for the ordination was based on the fact that the vegetation data were compositional and the gradient was greater than four units (Lepš & Šmilauer 2003). The canonical ordination was performed using CANOCO version 5.11 (Ter Braak & Šmilauer 1998). The statistical significance of the constrained ordination (relationship of communities with environmental variables) was tested using the unrestricted Monte Carlo permutation test available in CANOCO (Ter Braak 1995). The primary objective of canonical ordination is to detect the main pattern in the species-environment or community-environment relationships (Ter Braak 1995).
The CCA helps to detect patterns of variation in the species data that can be explained best by the supplied environmental variables (McGarigal, Cushman & Stafford 2000). In the ordination output, the total variation in the data set is the sum of all the eigenvalues of all axes. The proportion of this total variation that is explained by the supplied explanatory variables is described as the variation explained and is the sum of all canonical eigenvalues divided by the total variation (Ter Braak 1995). In the ordination diagram, each arrow points in the direction of the steepest increase in the explanatory variable with its length proportional to its importance in explaining the variation, while the angle between the arrows indicates the correlation between individual variables (Ter Braak & Šmilauer 1998).
Results
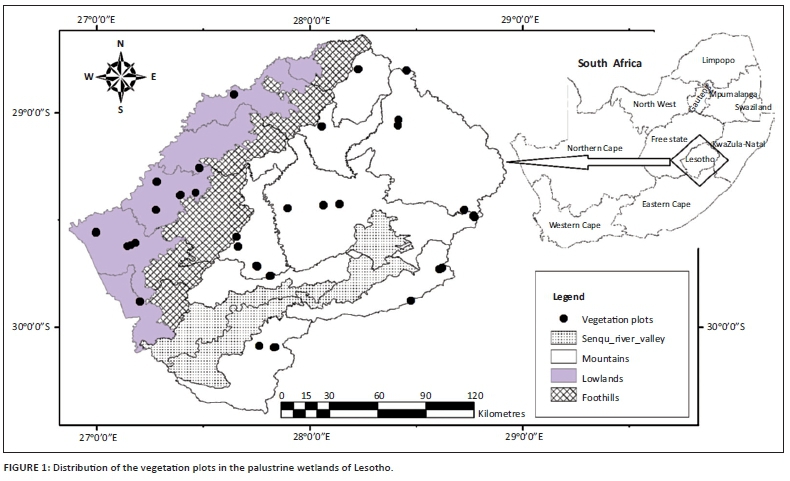
Overall, 150 vegetation plots from 30 palustrine wetlands in Lesotho were analysed in this study (Figure 1). A total of 312 plant species belonging to 51 families occurred in the wetlands (Online Appendix 1 - Table 1-A1[a] and [b]). Of the 312 species, 276 were encountered in the 150 plots and the remaining 36 species occurred within the wetlands but outside the plots (Online Appendix 1 - Table 1-A1[a]; Online Appendix 2 - Table 1-A2). Five most dominant families, accounting for most of the species occurring in the wetlands, were Poaceae (20.19%), Asteraceae (19.23%), Cyperaceae (14.10%), Scrophulariaceae (4.17%) and Polygonaceae (3.85%) (Online Appendix 1 - Table 1-A1 [b]). From these results, it can be observed that three (Poaceae, Asteraceae and Cyperaceae) out of the 51 families account for 53.52% of all the species occurring in these wetlands. While the species richness of whole wetland units ranged between 10 and 53, the number of species per 3 × 3 m plot ranged from 1 (monospecific communities, e.g. community 19) to 27 (highly diverse communities, e.g. communities 3 and 4), with a median species richness of about 14. The highest median number of species for whole wetland units (41.5) was recorded in the Highlands and the lowest (26) in the Lowlands. The five most frequently occurring species in the wetlands all represent different families (Ranunculaceae, Leguminosae, Asteraceae, Poaceae and Cyperaceae) (Online Appendix 1 - Table 1-A1[a] and [b]). The type of metabolism (C3/C4) is also indicated in Online Appendix 1 - Table 1-A1[a] for some of the species. The species that were collected during fieldwork were deposited in the ROML at the National University of Lesotho.
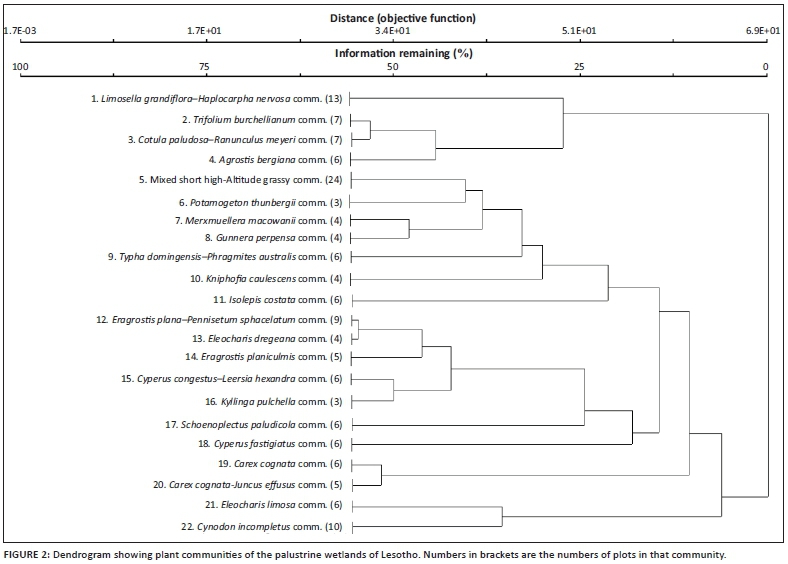
Classification
Clustering of all the vegetation plots produced 22 distinct communities (Figure 2). The 22 communities are described in terms of their dominant species, indicator species and the associated IVs (Table 2). These communities were also grouped into five main clusters (wetland types), four highland wetland types (wetland types 1-4) and one lowland type (wetland type 5). While most of the high-altitude communities exhibited the dominance of C3 plants, most of the dominants in the low-altitude communities were C4 species. Exceptions are communities such as Schoenoplectus paludicola, Potamogeton thunbergii and Typha domingensis-Phragmites australis, which, although dominated by C3 plants, occurred at low altitudes. However, a mixture of C3 and C4 plants dominated the communities with a wide ecological amplitude (see Online Appendix 1 - Table 1-A1[a] for metabolic pathways of some of the species). The synoptic table for the classification of the wetland vegetation is provided in Online Appendix 2 - Table 1-A2.
Ordination
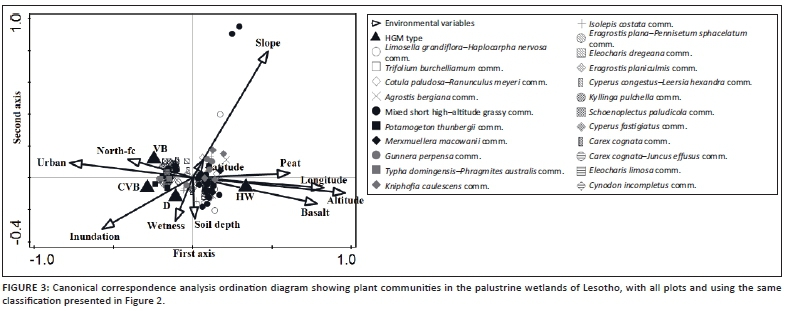
The CCA ordination diagram for all vegetation plots is presented in Figure 3. In this ordination, the total variation is 25.483 and the environmental variables supplied account for 18.11% of this. The first axis of the ordination is positively correlated with altitude, longitude, soil parent material and peat but negatively associated with landscape, inundation and aspect. Communities located on the right side of the ordination diagram (i.e. communities 1, 3, 5, 7, 10 and 20) are associated with near-pristine and high-altitude areas that are underlain by basalt and located in the eastern part of the country. Communities on the left side of the diagram (i.e. communities 6, 15, 16, 17, 18, 21 and 22) are associated with more inundated wetlands in the western lowland and more urbanised areas of the country that are underlain by sandstone. These communities are also associated with a shallower water column. The second axis of the ordination is best explained by slope but wetness and soil depth are also important factors. However, some communities occur on a wide range of altitudinal gradient and these include communities 12, 13 and 14.
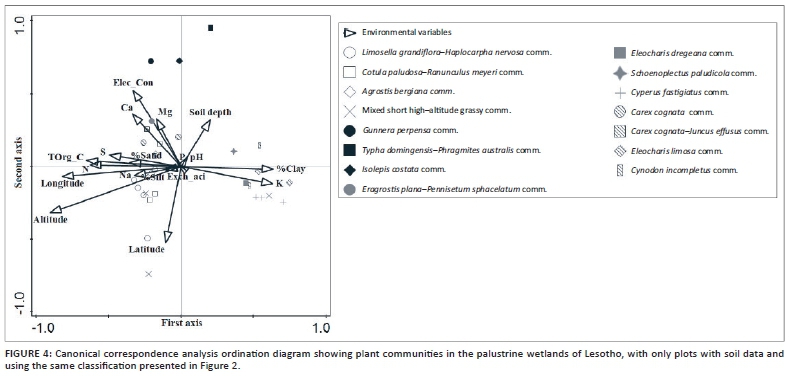
Thirty of the 150 vegetation plots had detailed soil data and this subset of the vegetation plots represents 15 of the 22 plant communities presented in Figure 2. Figure 4 presents the CCA ordination diagram for this subset of the vegetation plots. The total variation was 10.051 and 65.40% of this could be explained by the supplied explanatory variables. The first axis is positively correlated with potassium and percentage clay but is negatively correlated with altitude, longitude, total organic carbon, nitrogen, sulphur, percentage sand and sodium. While potassium and percentage clay have a strong positive correlation, total organic carbon, nitrogen, sulphur, percentage sand and longitude also have a strong positive correlation. The second axis is negatively correlated with latitude and positively associated with electrical conductivity, soil depth, magnesium and calcium content. Communities on the left side of the ordination diagram (i.e. communities 1, 3, 4, 8, 19 and 20) are in high-altitude areas and are associated with sand soils with high organic carbon, nitrogen, sulphur and sodium content and those on the right side (i.e. communities 9, 13, 17, 18, 21 and 22) are in the Lowlands and on soils with high potassium and clay levels. Those communities on the upper part of the ordination diagram, including communities 8, 9, 11, 12, 17, 19 and 20, are associated with high levels of electrical conductivity, calcium and magnesium, as well as deeper so
Description and distribution of wetland plant communities
The 22 plant communities were further described in terms of their most dominant species, structure, diversity and environmental conditions (Table 3). Species that are protected by law in the country are also highlighted in Table 3. Online Appendix 3 - Figure 5 presents some of these communities and Online Appendix 4 provides a further description of all the communities. The distribution range of the wetland vegetation in Lesotho is presented in Figure 1.
Discussion
The earliest studies on the palustrine wetlands of Lesotho were carried out in the early 1960s and 1970s (Guillarmod 1962; Van Zinderen Bakker & Werger 1974). Since then, other studies conducted in the country (Du Preez & Brown 2011; Grab & Deschamps 2004; Meakins & Duckett 1993) were mainly carried out on small areas, focusing on specific or a few wetlands. The current study has provided the most recent and more comprehensive assessment of the palustrine wetlands in the country by providing a classification and description of the wetland vegetation. The wetland vegetation has been classified into 22 communities, which are influenced mainly by altitude, longitude, slope, soil parent material, landscape, inundation, peat, soil potassium, clay, total organic carbon, nitrogen, sulphur, electrical conductivity, calcium, soil depth, wetness, magnesium, aspect and latitude. The wetlands were found to be occurring mainly in those areas where topography allows wetland conditions to develop (mostly in flat areas); mainly on the summit plateau and in the Lowlands. Nonetheless, it is noteworthy that there may be more communities in the country than the number reported here because only 150 plots from 30 wetlands were analysed in this study, although this forms an important starting point for documenting and classifying the wetland vegetation for Lesotho.
Despite Lesotho being entirely Afromontane, the study found a clear distinction between wetlands that are found in the Highlands and those in the Lowlands, in terms of diversity, species making up the communities and structure of the communities (Table 3). While the highland wetlands (types 1-4) are mainly south-facing, those in the Lowlands (type 5) are mainly north-facing. Differences exist between the north- and south-facing slopes because of distinct solar radiation patterns. The resulting ecological differences that include snow cover duration and moisture conditions between the moister and colder south-facing slopes and the drier and warmer north-facing slopes contribute to the observed differences in vegetation types (Nüsser 2002). Indicators of wetland type 5 are typical lowland wetland plants. This wetland type is comparable to the most widespread and common type of wetlands in South Africa, the temperate grassy wetlands (Sieben et al. 2014). One of the highland wetland types (type 4) comprises wetlands that are found in the small high-altitude area underlain by sandstone and limited to the eastern edge of Lesotho (Sehlabathebe National Park). These wetlands are also located on very steep slopes. However, this wetland type was under-sampled in this study as it was represented by only two wetlands and nine vegetation plots. Despite the country's high altitude (1388-3482 m asl) and rugged terrain, qualifying it to be entirely Afromontane (Carbutt & Edwards 2015), some of the communities in the Lowlands also fit into the temperate grassy wetland vegetation of Sieben et al. (2017a) and the eastern temperate freshwater wetlands of Mucina and Rutherford (2006).
All the wetlands surveyed in the current study can broadly be classified as the freshwater wetland vegetation type of Mucina and Rutherford (2006), which is further divided into eastern temperate freshwater wetlands (AZf 3), Drakensberg wetlands (AZf 4) and Lesotho mires (AZf 5). The dominance of Poaceae, Asteraceae, Cyperaceae and Scrophulariaceae families observed in the current study has also been reported in the entire Maloti-Drakensberg region and the surrounding areas, although Asteraceae was the most dominant in the latter (Chatanga et al. 2019). The current study also concurs with Sieben, Glen and Muasya (2017b) who report that Poaceae is the most common plant family in the South African wetlands based on species richness. However, of the five most dominant plant families recorded in the current study, two (Asteraceae and Scrophulariaceae) have higher than average levels of endemism in the Maloti-Drakensberg region (Cowling & Hilton-Taylor 1994). High levels of endemism in the high-altitude environments such as the Maloti-Drakensberg are attributed to the many small-scale microhabitats and a wide range of edaphic conditions that develop as a result of slope and aspect (Brand, Scott-Shaw & O'Connor 2019).
The five most common species in the study all represent different families. This implies that the wetland vegetation in the country is phylogenetically diverse and this is unlike the situation in South Africa where the five most common wetland plant species are all grasses (Poaceae) (Sieben et al. 2014). The high altitude that characterises the greater part of Lesotho could account for this high diversity, and montane wetlands have been identified as some of the most species-rich in South Africa (Sieben et al. 2014). While the high-altitude montane wetland communities in Lesotho are more diverse and are virtually never a monoculture, the lowland wetland communities are generally less diverse and sometimes monospecific communities. In lowland wetlands, it is common for just one or two species to dominate the entire wetland plant community (Boutin & Keddy 1993; Sieben et al. 2010a). This trend, also exhibited in the current study, is contrary to the decline in species richness with altitude, which has widely been recognised as a general law of ecology (Rosenzweig 1995). However, the large number of species and communities recorded in this study generally reflects the high diversity of wetland habitats in the country, although the highest diversity is associated with higher altitudes. It is noteworthy that exceptions such as Kniphofia caulescens and Carex cognata communities usually exhibit lower diversity than other communities at such higher elevations. This suggests that the dominant species in these communities are so adapted to the harsh high-altitude conditions that they have developed a very large competitive effect on local resources and act as a habitat filter by excluding the less competitive species (Maire et al. 2012). It is also noteworthy that the Lowlands is the area subjected to more anthropogenic pressures that include cultivation, urbanisation and conversion to other forms of land use and this threatens the wetlands in this part of the country.
The higher species richness and diversity in the Highlands highlights that these wetland habitats are more diverse than those in the Lowlands. This could be attributable, in part, to the fact that most of the dominant species in the high-altitude montane wetlands of the country are non-clonal (Table 3). Clonal plants are species that can reproduce vegetatively by sprouting from stolons or rhizomes, forming stands of individuals of that species (Song & Dong 2002). Typical clonal plants include Phragmites and Typha spp. that form dense rhizome mats and outcompete other non-clonal species. These findings corroborate Sieben et al. (2010b, 2017b) who suggest that, unlike lowland wetlands, high-altitude wetlands are unusual in that they are richer in species and particularly non-clonal species. Moreover, because the usually dominant wetland plants cannot cope well with the low temperatures characterising high-altitude environments, they cannot be as dominant as usual, leaving many vacant niches that then become available for colonisation by other plants (Sieben et al. 2010b). Furthermore, in wetland environments, the abundance of clonal plants has been reported to be negatively associated with the overall plant species diversity, as well as with altitude (Song & Dong 2002). The high diversity can also be attributed to the steep gradients in the landscape and harsh climatic conditions that create unique habitats in the mountains of Lesotho (Pooley 2003). The high diversity can further be ascribed to the underlying basaltic parent material. Mucina and Rutherford (2006) observe that the seepage water in these high-altitude wetlands is eutrophic as the underlying basalt is rich in nutrients. This also influences the floristic composition and community structure of the wetlands. These results are consistent with observations by Sieben et al. (2010a) who acknowledge the significant number of wetland community types in the montane areas of Lesotho. The high floristic diversity observed in the current study is also consistent with findings from the high-altitude montane wetlands of Alborz Mountains, Iran (Kamrani et al. 2011; Naqinezhad et al. 2009).
The ordination of the vegetation data for all plots reveals that the explanatory environmental variables supplied could explain only about 18.11% of the total variation. This highlights that the remaining variation could be explained by the environmental factors which were not included in the analysis, such as precipitation (assessed only indirectly through longitude) and wetland water quality. It may also be that plants colonise wetland habitats by chance (Chesson 2000). However, the degree of variation explained in the ordination is comparable to similar studies in the wetlands of South Africa (Sieben et al. 2016, 2017a). Moreover, Brand et al. (2013) highlight that substrate and hydrogeological conditions play a bigger role in influencing the floristic composition, structure and dynamics in high-altitude montane wetlands than microclimate. The inclusion of soil variables in the analysis increased the proportion of the total variation explained by the supplied variables from 18.11% to 65.40%. Thus, the inclusion of soil data in the analysis significantly improves wetland vegetation-environment assessments. The degree of variation explained in the ordination with soil data is significantly higher than that reported for the South African wetlands (Sieben et al. 2016, 2017a). Nevertheless, the amount of variation explained after the inclusion of soil data could also have improved because the data set was smaller (30 vegetation plots).
While the second axis is positively associated with slope, it is negatively correlated with the wetness and soil depth. This implies that communities on the lower part of the ordination diagram are associated with wetter habitats with deeper soils, while those on the upper part are associated with steeper slopes. The former include communities such as C. cognata-Juncus effusus, while the latter include communities such as Merxmuellera macowanii, which are often associated with hillslope seepages. The correlation between wetness and soil depth, which are both negatively correlated with slope, could be attributed to the soil deposition and water accumulation that is often consistent with fairly flat habitats. Altitude, longitude, slope, wetness, soil parent material, landscape, peat, inundation, aspect, soil depth and wetness have been observed to be very important factors explaining the distribution and variation of the wetland vegetation in this study.
Abundance of peat is also strongly correlated with altitude and longitude. Because most of these Afromontane wetlands are often located on a slope at high altitudes, they are unique (Mucina & Rutherford 2006; Sieben et al. 2014). A temperature drop of 1 °C has been estimated for every 125 m gain in altitude in Lesotho and the Maloti-Drakensberg region (Pomela et al. 2000). Such steep environmental gradients over short distances (Körner, Paulsen & Spehn 2011) in Afromontane areas are associated with huge spatial variation in physical features and this results in remarkable variation in terms of species diversity and distribution (Kotze & O'Connor 2000). As a result, increasing altitude corresponds with a decrease in temperature and an increase in rainfall (Mucina & Rutherford 2006) and the greater part of Lesotho is generally much higher and colder than the surrounding areas (Sieben et al. 2014). The hypoxia or anoxia in the wetlands, coupled with the low temperature and pH, often associated with these high-altitude wetlands, reduces the rate of decomposition and favours the accumulation of organic matter and peat formation (Chatterjee et al. 2010; Gopal 2016). Therefore, lower temperatures, higher rainfall and other environmental conditions associated with high altitudes also create habitats that can harbour unique vegetation (Sieben et al. 2014).
Through its influence on temperature and rainfall, altitude is a suitable surrogate measure for climate in Lesotho and the Maloti-Drakensberg region, which represents an indirect gradient (Sieben et al. 2010a). The strong correlation between longitude and altitude can therefore be explained by the fact that altitude generally increases on moving from west to east in Lesotho and rainfall also increases with altitude and with increasing longitude (Cowling & Hilton-Taylor 1994; Mucina & Rutherford 2006). The high altitudes of Lesotho are mainly associated with abundant orographic rainfall, which results in many springs and seepage zones (Mucina & Rutherford 2006; Sieben et al. 2014). The influence of altitude and wetness on high-altitude wetland vegetation has also been reported in South Africa (Kotze & O'Connor 2000; Mucina & Rutherford 2006; Sieben et al. 2010a, 2010b), southern Brazil (Rolon & Maltchik 2006) and in Cumbria, UK (Jones, Li & Maberly 2003). The importance of both altitude and slope gradients on the floristic composition of high-altitude montane wetlands has also been reported in Bulgaria, south-eastern Europe (Hájková, Hájek & Apostolova 2006) and in the Alborz Mountains, India (Kamrani et al. 2011; Naqinezhad et al. 2009).
Although a negative correlation between altitude and wetness was observed in this study, altitude operates at a larger scale, whereas wetness operates on a local scale. It is nevertheless noteworthy that, while some communities are restricted to either the Highlands or Lowlands, others seem to have a wide ecological amplitude. These include Eragrostis plana-Pennisetum sphacelatum, Eleocharis dregeana and Eragrostis planiculmis communities. Furthermore, some species, such as Ranunculus meyeri Harv., have been reported to occur at low abundances at lower altitudes but achieve greater cover at higher altitudes as they gain a competitive advantage because of the lower temperatures that reduce the vigour of the usually more competitive species (Sieben et al. 2010b). Because some of the plant communities recorded in this study are restricted to the highest altitudes, occurring at the summit plateaus, they are likely to disappear in the face of climate change as they cannot migrate any further up (Bentley, Robertson & Barker 2019; Lee et al. 2015).
While high-altitude communities (e.g. Limosella grandiflora-Haplocarpha nervosa, Agrostis bergiana and Cotula paludosa- R. meyeri communities) were also associated with soils that are high in total organic carbon, nitrogen and sulphur, the habitat soils for the low-altitude communities (e.g. Cynodon incompletus, Eleocharis limosa, S. paludicola and E. dregeana communities) were high in potassium and clay percentage. However, the negative correlation of potassium with altitude is contrary to Mucina and Rutherford (2006) who report that the high-altitude areas are associated with high potassium levels. In the current study, communities such as C. cognata, Gunnera perpensa and E. plana-P. sphacelatum were also found to be associated with high soil magnesium, calcium and electrical conductivity. The importance of potassium, electrical conductivity and clay percentage in influencing high-altitude montane wetland vegetation is consistent with findings from a similar study on the wetlands of the Alborz Mountains, India (Kamrani et al. 2011). Because of the low temperature and basaltic parent material, the soils in the mountains of Lesotho are high in organic matter and generally nutrient-rich, with a high water-retention capacity (Mucina & Rutherford 2006). However, the soils found in the Lowlands are considered to be generally nutrient-poor (Maro 2011).
Conservation value and impacts of climate change
Some of the species encountered in this study are protected by law in Lesotho (Table 3), which highlights the fact that they are threatened. The wetlands of Lesotho contribute significantly not only to biodiversity, but also provide a wide spectrum of ecosystem services, particularly in terms of water resources and livestock grazing. They are the headwaters of the five major, economically important rivers in the country, namely the Maliba-matšo, Senqu-Orange, Mohokare (Caledon), Makhaleng and Senqunyane, which also feed the LHWP dams (Department of Environment 2014). They play a major role in sustaining the perennial flow of water and regulating the water quality of the rivers that flow into the Atlantic Ocean (Pooley 2003). However, all the mountain areas in the country are drained through the Senqu-Orange River and its tributaries (Backéus & Grab 1995), the most important and most developed shared river system in Southern Africa. For South Africa, the water is tapped mainly through the LHWP. In fact, the Lesotho Highlands water is of national importance to the South African population as a significant portion of the agriculture in the arid regions of the country is watered from the aqueducts from the dams on the Senqu-Orange River.
Because of their high carbon sequestration and storage capacity, the conservation of these wetlands can also play a role in mitigating global climate change. Peatlands are the second most important reservoir of carbon on earth after oceans (Russi et al. 2013). Climate change predictions highlight that much of Southern Africa will become drier (Mitchell 2013). Based on climate change modelling, by 2025, Namibia will probably experience problems of water quality and availability, Lesotho will be water-stressed and South Africa will be facing absolute water scarcity (SADC 2008). Accordingly, the conservation of these wetlands becomes indispensable.
The wetlands of Lesotho are a critical resource for livestock grazing, especially in summer when thousands of cattle, sheep and goats are seen grazing on these sensitive ecosystems (Du Preez & Brown 2011; Van Zinderen Bakker & Werger 1974). In fact, much of the grazing in the mountains of Lesotho takes place within wetlands because they harbour the most palatable vegetation (Grab & Deschamps 2004). The Basotho are now sometimes observed keeping their livestock in the mountains throughout the year. This is contrary to their tradition of mostly inhabiting the Lowlands and taking their herds of livestock to the mountains in summer and returning them to the Lowlands during winter (Meakins & Duckett 1993). Thus, the value of these wetlands as a grazing resource is increasingly becoming greater. The widespread degradation and loss of wetlands, mainly because of grazing and trampling by cattle, sheep and goats, has been reported quite extensively since the 1960s (e.g. Backéus & Grab 1995; Du Preez & Brown 2011; Guillarmod 1962; Van Zinderen Bakker & Werger 1974). Most of the communities described here are threatened by grazing and trampling except for the M. macowanii community, which is unpalatable. It is painfully unpleasant to walk through the community because of the sharp tips of the dominant M. macowanii (Stapf) Conert.
At least eight invasive alien species have been recorded in the wetlands and these include Paspalum dilatatum Poir., Cirsium vulgare (Savi) Ten., Cyperus esculentus L., Hypochaeris radicata L. and P. clandestinum Hochst. ex Chiov. While some of them occurred more frequently (e.g. P. dilatatum occurred in 16% of the plots and was the 11th most frequent species in the study), others occurred in relatively low frequencies (Online Appendix 1 - Table 1-A1[a]) but in large stands in a given wetland (e.g. C. vulgare). Paspalum dilatatum was found to be the fourth most dominant wetland species in South Africa, occurring in 9.1% of all the wetland vegetation plots in the country's database (Sieben et al. 2014). Invasive alien plants are not only among the major drivers of wetland degradation and loss in sub-Saharan Africa (Mitchell 2013), but also use wetlands as corridors to penetrate even terrestrial plant communities (Mucina & Rutherford 2006).
The wetlands are further threatened mainly by the economic development associated with damming, mining and infrastructure development. Therefore, the unsustainable utilisation of the water and other resources, as well as other anthropogenic activities, in the different catchments of the country, would have an adverse effect on the wetlands and concomitantly diminish their capacity to supply the water resources. Nevertheless, montane wetlands generally remain less impacted than those in the Lowlands where human pressure is higher (Lee et al. 2015), although wetlands in general are among the most threatened ecosystems globally (Millennium Ecosystem Assessment 2005; Russi et al. 2013). Consequently, montane wetlands also serve as repositories and refugia for biodiversity and are regarded as biodiversity hot spots (Chatterjee et al. 2010).
These wetlands can also potentially be threatened by climate change, which has been predicted to significantly alter the availability of water for individual montane wetlands and give rise to substantial shifts in the distribution and composition of wetlands in montane landscapes (Lee et al. 2015). Widespread ecological transitions have been reported to be likely at higher elevations because montane regions exhibit greater sensitivity to climate change (Bentley et al. 2019; Ryan et al. 2014). This will concomitantly give rise to widespread changes in the functioning of these wetlands and their delivery of ecosystem services. Projections have also indicated that climate change will cause potentially severe threats on peat-forming wetlands (Essl et al. 2012; Lee et al. 2015). The Maloti-Drakensberg area has been reported to be highly vulnerable to climate change (Brand et al. 2019). In the Maloti-Drakensberg, environmental domains that are defined by climate variables are projected to change substantially as a result of climate change, particularly an increase in temperature and a concomitant decline in water availability (Brand et al. 2019). Most of the species in the Maloti-Drakensberg are already at the highest altitudes and cannot shift any higher (Bentley et al. 2019). Furthermore, the pattern of increasing dominance of C3 plants in communities with increasing altitude, which is evident in this study and consistent with the findings of Kotze and O'Connor (2000) in KwaZulu-Natal, South Africa, highlights a threat to the high-altitude communities because C3 will be replaced with C4 plants as the climate changes.
Conclusion
Given their important role in water resources, livestock grazing and harbouring rare and endemic species, as well as unique biodiversity, the wetlands described in the current study are of high conservation value in Southern Africa, particularly in the face of increased water scarcity, climate change and unprecedented loss of biodiversity. Accordingly, the wetlands of Lesotho play a critical role in providing ecosystem services at the local, national and regional scales. As a result, the government of Lesotho and the Orange-Senqu River Commission (ORASECOM) have a responsibility in terms of scaling-up the efforts towards the protection of these wetlands for the sustainable provision of the benefits obtained from them. Because the wetland vegetation of a particular wetland can be used as a proxy for biodiversity of the wetland, understanding the wetland vegetation-environment patterns is important for the successful conservation planning of these ecosystems. Therefore, the current study has provided baseline information, which can be useful for monitoring the wetland vegetation and concomitantly the wetlands, which are vital for the water resources of Lesotho, South Africa and Namibia.
Acknowledgements
The authors would like to thank Khotso Kobisi and Moretloa J. Polaki who helped in identifying some of the species. The authors also thank Tumelo Tjale who helped in collecting part of the data.
Competing interests
The authors declare that they have no competing interests that may have inappropriately influenced them in writing this article.
Authors' contributions
P.C. led the conceptualisation of the study and conducted fieldwork, laboratory analysis and data analysis and wrote the manuscript. E.J.J.S. helped in conceptualising the study, conducting fieldwork and manuscript writing.
Ethical considerations
This article followed all ethical standards for research without direct contact with human or animal subjects.
Funding information
The study was funded by the University of KwaZulu-Natal and the National University of Lesotho.
Data availability statement
Permission to conduct the study was obtained from the Lesotho Department of Environment.
Disclaimer
The views expressed in this article are the authors' own and not an official position of their institutions or funders.
References
Backéus, I. & Grab, S., 1995, 'Mires in Lesotho', Gunneria 70, 243-250. [ Links ]
Bentley, L.K., Robertson, M.P. & Barker, N.P., 2019, 'Range contraction to a higher elevation: The likely future of the montane vegetation in South Africa and Lesotho', Biodiversity and Conservation 28(1), 131-153. https://doi.org/10.1007/s10531-018-1643-6 [ Links ]
Boutin, C. & Keddy, P.A., 1993, 'A functional classification of wetland plants', Journal of Vegetation Science 4(5), 591-600. https://doi.org/10.2307/3236124 [ Links ]
Brand, R.F., Du Preez, P.J. & Brown, L.R., 2013, 'High altitude montane wetland vegetation classification of the Eastern Free State, South Africa', South African Journal of Botany 88(September), 223-236. https://doi.org/10.1016/j.sajb.2013.07.011 [ Links ]
Brand, R.F., Scott-Shaw, C.R. & O'Connor, T.G., 2019, 'The alpine flora on inselberg summits in the Maloti-Drakensberg Park, KwaZulu-Natal, South Africa', Bothalia-African Biodiversity & Conservation 49(1), 1-15. https://doi.org/10.4102/abc.v49i1.2386 [ Links ]
Brown, L.R., Du Preez, P.J., Bezuidenhout, H., Bredenkamp, G.J., Mostert, T.H.C. & Collins, N.B., 2013, 'Guidelines for phytosociological classifications and descriptions of vegetation in Southern Africa', Koedoe 55(1), Art. #1103, 1-10. https://doi:10.4102/koedoe.v55i1.1103 [ Links ]
Carbutt, C. & Edwards, T.J., 2015, 'Reconciling ecological and phytogeographical spatial boundaries to clarify the limits of the montane and alpine regions of sub-Sahelian Africa', South African Journal of Botany 98(May), 64-75. https://doi.org/10.1016/j.sajb.2015.01.014 [ Links ]
Chatanga, P., Kotze, D.C., Janks, M. & Sieben, E.J.J., 2019, 'Classification, description and environmental factors of montane wetland vegetation of the Maloti-Drakensberg region and the surrounding areas', South African Journal of Botany 125(September), 221-233. https://doi.org/10.1016/j.sajb.2019.04.028 [ Links ]
Chatterjee, A., Blom, E., Gujja, B., Jacimovic, R., Beevers, L., O'Keeffe, J. et al., 2010, 'WWF initiatives to study the impact of climate change on Himalayan high-altitude wetlands (HAWs)', Mountain Research and Development 30(1), 42-52. https://doi.org/10.1659/MRD-JOURNAL-D-09-00091.1 [ Links ]
Chesson, P., 2000, 'General theory of competitive coexistence in spatially-varying environments', Theoretical Population Biology 58(3), 211-237. https://doi.org/10.1006/tpbi.2000.1486 [ Links ]
Clegg, B.W. & O'Connor, T.G., 2012, 'The vegetation of Malilangwe Wildlife Reserve, south-eastern Zimbabwe', African Journal of Range & Forage Science 29(3), 109-131. https://doi.org/10.2989/10220119.2012.744352 [ Links ]
Collins, N.B., 2005, Wetlands: The basics and some more, Free State Department of Tourism, Environmental and Economic Affairs, Bloemfontein, viewed 07 April 2017, from https://www.dwa.gov.za/iwqs/rhp/provinces/freestate/wetlands_basics&more.pdf. [ Links ]
Cowling, R.M. & Hilton-Taylor, C., 1994, 'Patterns of plant diversity and endemism in Southern Africa: An overview', in B.J. Huntley (ed.), Botanical diversity in Southern Africa, pp. 31-52, Botanical Research Institute, Pretoria. [ Links ]
Cronk, J.K. & Fennessy, M.S., 2001, Wetland plants: Biology and ecology, Lewis Publishers, Boca Raton, FL. [ Links ]
Department of Environment, 2014, Lesotho environment outlook report 2014: Environment for national prosperity, Ministry of Tourism, Environment and Culture, Maseru, Lesotho, 280 p. [ Links ]
Dufrêne, M. & Legendre, P., 1997, 'Species assemblages and indicator species: The need for a flexible asymmetrical approach', Ecological Monographs 67(3), 345-366. https://doi.org/10.2307/2963459 [ Links ]
Du Preez, P.J. & Brown, L.R., 2011, 'Impact of domestic animals on ecosystem integrity of Lesotho high altitude peatlands', in O. Grillo & G. Venora (eds.), Ecosystems biodiversity, pp. 249-271, InTech, Rijeka, Croatia. [ Links ]
Essl, F., Dullinger, S., Moser, D., Rabitsch, W. & Kleinbauer, I., 2012, 'Vulnerability of mires under climate change: Implications for nature conservation and climate change adaptation', Biodiversity and Conservation 21(3), 655-669. https://doi.org/10.1007/s10531-011-0206-x [ Links ]
Gopal, B. (ed.), 2015, Guidelines for rapid assessment of biodiversity and ecosystem services of wetlands, version 1.0, Asia-Pacific Network for Global Change Research (APN-GCR), Kobe, Japan, and National Institute of Ecology, New Delhi, 134 p. [ Links ]
Gopal, B., 2016, 'Should "wetlands" cover all aquatic ecosystems and do macrophytes make a difference to their ecosystem services?', Folia Geobotanica 51(3), 209-226. https://doi.org/10.1007/s12224-016-9248-x [ Links ]
Grab, S.W. & Deschamps, C.L., 2004, 'Geomorphological and geoecological controls and processes following gully development in alpine mires, Lesotho', Arctic, Antarctic, and Alpine Research 36(1), 49-58. https://doi.org/10.1657/1523-0430(2004)036[0049:GAGCAP]2.0.CO;2 [ Links ]
Guillarmod, A.J., 1962, 'The bogs and sponges of the Basutoland Mountains', South African Journal of Science 58(6), 179-182. [ Links ]
Hájková, P., Hájek, M. & Apostolova, I., 2006, 'Diversity of wetland vegetation in the Bulgarian high mountains, main gradients and context-dependence of the pH role', Plant Ecology 184(1), 111-130. https://doi.org/10.1007/s11258-005-9056-5 [ Links ]
Jones, J.I., Li, W. & Maberly, S.C., 2003, 'Area, altitude and aquatic plant diversity', Ecography 26(4), 411-420. https://doi.org/10.1034/j.1600-0587.2003.03554.x [ Links ]
Junk, W.J., An, S., Finlayson, C.M., Gopal, B., Květ, J., Mitchell, S.A. et al., 2013, 'Current state of knowledge regarding the world's wetlands and their future under global climate change: A synthesis', Aquatic Sciences 75(1), 151-167. https://doi.org/10.1007/s00027-012-0278-z [ Links ]
Kamrani, A., Jalili, A., Naqinezhad, A., Attar, F., Maassoumi, A.A. & Shaw, S.C., 2011, 'Relationships between environmental variables and vegetation across mountain wetland sites, N. Iran', Biologia 66(1), 76-87. https://doi.org/10.2478/s11756-010-0127-2 [ Links ]
Körner, C., Paulsen, J. & Spehn, E.M., 2011, 'A definition of mountains and their bioclimatic belts for global comparisons of biodiversity data', Alpine Botany 121(2), 73-78. https://doi.org/10.1007/s00035-011-0094-4 [ Links ]
Kotze, D.C. & O'Connor, T.G., 2000, 'Vegetation variation within and among palustrine wetlands along an altitudinal gradient in KwaZulu-Natal, South Africa', Plant Ecology 146(1), 77-96. https://doi.org/10.1023/a:1009812300843 [ Links ]
Kotze, D.C., Klug, J.R., Hughes, J.C. & Breen, C.M., 1996, 'Improved criteria for classifying hydric soils in South Africa', South African Journal of Plant and Soil 13(3), 67-73. https://doi.org/10.1080/02571862.1996.10634378 [ Links ]
Lee, S.-Y., Ryan, M.E., Hamlet, A.F., Palen, W.J., Lawler, J.J. & Halabisky, M., 2015, 'Projecting the hydrologic impacts of climate change on montane wetlands', PLoS ONE 10(9), e0136385. https://doi.org/10.1371/journal.pone.0136385 [ Links ]
Leketa, K., Migwi, M., Crane, E., Upton, K., Ó Dochartaigh, B. & Bellwood-Howard, I., 2018, Africa groundwater atlas: Hydrogeology of Lesotho. British Geological Survey, viewed 06 August 2018, from http://earthwise.bgs.ac.uk/index.php/Hydrogeology_of_Lesotho. [ Links ]
Lepš, J. & Šmilauer, P., 2003, Multivariate analysis of ecological data using CANOCO, Cambridge University Press, Cambridge. [ Links ]
Ludwig, J.A. & Reynolds, J.F., 1988, Statistical ecology: A primer on methods and computing, John Wiley and Sons, New York. [ Links ]
Maire, V., Gross, N., Börger, L., Proulx, R., Wirth, C., Da Silveira Pontes, L. et al., 2012, 'Habitat filtering and niche differentiation jointly explain species relative abundance within grassland communities along fertility and disturbance gradients', New Phytologist 196(2), 497-509. https://doi.org/10.1111/j.1469-8137.2012.04287.x [ Links ]
Maro, P., 2011, Environmental change in Lesotho: An analysis of the causes and consequences of land-use change in the Lowland Region, Springer, London. [ Links ]
McCune, B. & Mefford, M.J., 2011, PC-ORD. Multivariate analysis of ecological data. Version 6.0, MjM Software Design, Gleneden Beach, OR. [ Links ]
McGarigal, K., Cushman, S. & Stafford, S., 2000, Multivariate statistics for wildlife and ecology research, Springer-Verlag Inc., New York. [ Links ]
Meakins, R.H. & Duckett, J.D., 1993, 'Vanishing bogs of the Mountain Kingdom', Veld and Flora 79(2), 49-51. [ Links ]
Millennium Ecosystem Assessment, 2005, Ecosystems and human well-being: Wetlands and water synthesis, World Resources Institute, Washington, DC. [ Links ]
Mitchell, S.A., 2013, 'The status of wetlands, threats and the predicted effect of global climate change: The situation in sub-Saharan Africa', Aquatic Sciences 75(1), 95-112. https://doi.org/10.1007/s00027-012-0259-2 [ Links ]
Mitsch, W.J. & Gosselink, J.G., 2000, 'The value of wetlands: Importance of scale and landscape setting', Ecological Economics 35(1), 25-33. https://doi.org/10.1016/S0921-8009(00)00165-8 [ Links ]
Mitsch, W.J. & Gosselink, J.G., 2015, Wetlands, 5th edn., Wiley, Hoboken, NJ. [ Links ]
Moor, H., Rydin, H., Hylander, K., Nilsson, M.B., Lindborg, R. & Norberg, J., 2017, 'Towards a trait-based ecology of wetland vegetation', Journal of Ecology 105(6), 1623-1635. https://doi.org/10.1111/1365-2745.12734 [ Links ]
Mucina, L. & Rutherford, M.C. (eds.), 2006, The vegetation of South Africa, Lesotho and Swaziland, Strelitzia 19, South African National Biodiversity Institute (SANBI), Pretoria. [ Links ]
Mueller-Dombois, D. & Ellenberg, H., 1974, Aims and methods of vegetation ecology, John Wiley and Sons, New York. [ Links ]
Mugomeri, E., Chatanga, P., Raditladi, T. & Tarirai, C., 2016, 'Ethnobotanical study and conservation status of local medicinal plants: Towards a repository and monograph of herbal medicines in Lesotho', African Journal of Traditional, Complementary & Alternative Medicines 13(1), 138-151. https://doi.org/10.4314/ajtcam.v13i1.20 [ Links ]
Naqinezhad, A., Jalili, A., Attar, F., Ghahreman, A., Wheeler, B.D., Hodgson, J.G. et al., 2009, 'Floristic characteristics of the wetland sites on dry southern slopes of the Alborz Mts., N. Iran: The role of altitude in floristic composition', Flora - Morphology, Distribution, Functional Ecology of Plants 204(4), 254-269. https://doi.org/10.1016/j.flora.2008.02.004 [ Links ]
Nüsser, M., 2002, 'Pastoral utilization and land cover change: A case study from the Sanqebethu Valley, eastern Lesotho', Erdkunde 56(2), 207-221. https://doi.org/10.3112/erdkunde.2002.02.07 [ Links ]
Nüsser, M. & Grab, S., 2002, 'Land degradation and soil erosion in the eastern highlands of Lesotho, Southern Africa', DIE ERDE 133, 291-311. [ Links ]
Ollis, D., Snaddon, K., Job, N. & Mbona, N., 2013, Classification system for wetlands and other aquatic ecosystems in South Africa. User manual: Inland systems. SANBI biodiversity series 22, South African National Biodiversity Institute, Pretoria. [ Links ]
Omar, M.Y., Maroyi, A. & Van Tol, J.J., 2016, 'Floral diversity, composition and distribution in a montane wetland in Hogsback, the Eastern Cape Province, South Africa', Pakistan Journal of Botany 48(5), 1861-1870. [ Links ]
ORASECOM, 2015, Orange-Senqu River Commission 15 years 2000-2015, Orange-Senqu River Commission, Gauteng, 60 p. [ Links ]
Peck, J.E., 2010, Step-by-step using PC-Ord. Multivariate analysis for community ecologists, MjM Software Design, Gleneden Beach, OR. [ Links ]
Pla, L., Casanoves, F. & Di Rienzo, J., 2012, Functional diversity indices, Springer, London. [ Links ]
Pomela, E.M., Mokuku, C., Maabataung, S., Phororo, R., Makoae, M., Majoro, M. et al., 2000, Biological diversity in Lesotho: A country study, National Environmental Secratariat, Government of Lesotho, Maseru. [ Links ]
Pooley, E., 2003, Mountain flowers: A field guide to the flora of the Drakensberg and Lesotho, 1st edn., Flora Publications Trust, Durban, 320 p.-illus., col. illus. [ Links ]
Rolon, A.S. & Maltchik, L., 2006, 'Environmental factors as predictors of aquatic macrophyte richness and composition in wetlands of southern Brazil', Hydrobiologia 556(1), 221-231. https://doi.org/10.1007/s10750-005-1364-1 [ Links ]
Rosenzweig, M.L., 1995, Species diversity in space and time, Cambridge University Press, Cambridge. [ Links ]
Russi, D., Ten Brink, P., Farmer, A., Badura, T., Coates, D., Förster, J. et al., 2013, The economics of ecosystems and biodiversity for water and wetlands, IEEP, London. [ Links ]
Ryan, M.E., Palen, W.J., Adams, M.J. & Rochefort, R.M., 2014, 'Amphibians in the climate vise: Loss and restoration of resilience of montane wetland ecosystems in the western US', Frontiers in Ecology and the Environment 12(4), 232-240. https://doi.org/10.1890/130145 [ Links ]
SADC, 2008, Southern Africa environment outlook, SADC, SARDC, IUCN & UNEP, Gaborone. [ Links ]
Sieben, E.J.J., Collins, N.B., Kotze, D.C., Mofutsanyana, S.S. & Janks, M., 2017a, 'Temperate grassy wetlands of South Africa: Description, classification and explanatory environmental factors', South African Journal of Botany 113(November), 68-76. https://doi.org/10.1016/j.sajb.2017.07.009 [ Links ]
Sieben, E.J.J., Glen, R.P. & Muasya, A.M., 2017b, 'The wetland flora of South Africa: Occurrence patterns, frequency and dominance across a diverse landscape', Aquatic Botany 142(September), 112-118. https://doi.org/10.1016/j.aquabot.2017.03.003 [ Links ]
Sieben, E.J.J., Kotze, D.C. & Morris, C.D., 2010a, 'Floristic composition of wetlands of the South African section of the Maloti-Drakensberg Transfrontier Park', Bothalia 40(1), 117-134. https://doi.org/10.4102/abc.v40i1.201 [ Links ]
Sieben, E.J.J., Morris, C.D., Kotze, D.C. & Muasya, A.M., 2010b, 'Changes in plant form and function across altitudinal and wetness gradients in the wetlands of the Maloti-Drakensberg, South Africa', Plant Ecology 207(1), 107-119. https://doi.org/10.1007/s11258-009-9657-5 [ Links ]
Sieben, E.J.J., Mtshali, H. & Janks, M., 2014, National wetland vegetation database: Classification and analysis of wetland vegetation types for conservation planning and monitoring, Report no. WRC 1980/1/14, Water Research Commission (WRC), Pretoria, South Africa, 255 p. [ Links ]
Sieben, E.J.J., Nyambeni, T., Mtshali, H., Corry, F.T.J., Venter, C.E., MacKenzie, D.R. et al., 2016, 'The herbaceous vegetation of subtropical freshwater wetlands in South Africa: Classification, description and explanatory environmental factors', South African Journal of Botany 104(May), 158-166. https://doi.org/10.1016/j.sajb.2015.11.005 [ Links ]
Singha, V., 2011, High altitude wetlands project: A retrospective, WWF, Kathmandu, Nepal. [ Links ]
Song, M. & Dong, M., 2002, 'Clonal plants and plant species diversity in wetland ecosystems in China', Journal of Vegetation Science 13(2), 237-244. https://doi.org/10.1111/j.1654-1103.2002.tb02044.x [ Links ]
Stohlgren, T.J., Bull, K.A., Otsuki, Y., Villa, C.A. & Lee, M., 1998, 'Riparian zones as havens for exotic plant species in the central grasslands', Plant Ecology 138(1), 113-125. https://doi.org/10.1023/A:1009764909413 [ Links ]
Ter Braak, C.J.F., 1995, 'Ordination', in R.H.G. Jongman, C.J.F. ter Braak & O.F.R. van Tongeren (eds.), Data analysis in community and landscape ecology, pp. 91-173, Cambridge University Press, Cambridge. [ Links ]
Ter Braak, C.J.F. & Šmilauer, P., 1998, Canoco reference manual and user's guide to Canoco for Windows: Software for canonical community ordination (version 4), Microcomputer Power, Ithaca, NY. [ Links ]
Van der Maarel, E., 1979, 'Transformation of cover-abundance values in phytosociology and its effects on community similarity', Vegetatio 39(2), 97-114. https://doi.org/10.1007/bf00052021 [ Links ]
Van Oudtshoorn, F., 2014, Guide to grasses of Southern Africa, 3rd edn., Briza Publications, Pretoria. [ Links ]
Van Tongeren, O.F.R., 1995, 'Cluster analysis', in R.H.G. Jongman, C.J.F. ter Braak & O.F.R. van Tongeren (eds.), Data analysis in community and landscape ecology, pp. 174-212, Cambridge University Press, Cambridge. [ Links ]
Van Zinderen Bakker, E.M. & Werger, M.J.A., 1974, 'Environment, vegetation and phytogeography of the high-altitude bogs of Lesotho', Vegetatio 29(1), 37-49. https://doi.org/10.1007/BF02390894 [ Links ]
 Correspondence:
Peter Chatanga
chatangapn@yahoo.co.uk
Received: 18 Apr. 2019
Accepted: 30 Aug. 2019
Published: 31 Oct. 2019

