


Services on Demand
Article
 English (pdf)
 Article in xml format
 Article references
Indicators

Related links
-
 Cited by Google
 -
 Similars in Google
Share

 Permalink
Koedoe
On-line version ISSN 2071-0771
Print version ISSN 0075-6458
Koedoe vol.61 n.1 Pretoria 2019
http://dx.doi.org/10.4102/koedoe.v61i1.1470
ORIGINAL RESEARCH
https://doi.org/10.4102/koedoe.v61i1.1470
The feasibility of national parks in South Africa endorsing a community development agenda: The case of Mokala National Park and two neighbouring rural communities
Hendri CoetzeeI; Werner NellII
IInstitutional Sustainability and Community Impact Office and Unit for Environmental Sciences and Management, North-West University, South Africa
IIOptentia Research Programme, North-West University, South Africa
ABSTRACT
This article explores the feasibility of South African National Parks (SANParks) endorsing a community development agenda, using Mokala National Park (MNP) and two neighbouring rural communities as case study. A three-phase sequential exploratory, mixed-methods approach was followed: an initial exploratory qualitative phase aimed at identifying the development needs of the two communities; a quantitative phase aimed at verifying and quantifying the identified needs; and a final qualitative phase (with a minor quantitative component) to determine what parks can reasonably achieve in terms of community development based on their available resources, capacity and expertise. Qualitative data were collected via semi-structured interviews (Phase 1: n = 22; Phase 3: n = 6), which were thematically analysed. Quantitative data were collected via a structured questionnaire (Phase 2: n = 484; Phase 3: n = 6) and analysed using SPSS 23. Findings revealed that the communities' most significant needs centred on employment opportunities; improved healthcare, service delivery and waste management; and education. Community members also expressed the need for improved community policing, safety and security; social services; agricultural support and training; general skills development and training; local leadership; recreational facilities; local economic development and conservation initiatives. Results from the third phase of the study suggest that parks such as MNP can realistically only address some of the identified community needs significantly; primarily job creation (via temporary employment), skills development, local economic development, support of local conservation (especially via environmental education) and, to a lesser extent, agricultural support and training and permanent job creation.
CONSERVATION IMPLICATIONS: The findings could be of practical use to SANParks to steer its community development initiatives towards attaining a more optimal balance between actual community needs and what the organisation can realistically offer, thus rendering SANParks' efforts more efficient and effective in supporting the establishment of equitable and sustainable rural communities
Introduction
National parks can potentially play an important role in rural community development. This sentiment is shared by researchers from all over the world, including Africa (Newmark & Hough 2000; Petursson & Vedeld 2017), the Americas (Machlis & Field 2000; Nelson & Serafin 2013), Europe (Barrow 2015; Lundmark, Fredman & Sandell 2010), Asia (Kusters et al. 2006; Tisdell 1999) and Australia (Stolton & Dunley 2015). This notion is also supported by a recent report by the Global Environmental Fund's Scientific and Technical Advisory Panel (Pullin 2014), which outlines the impacts that protected areas (e.g. national parks) can have on rural communities, especially with regard to environmental capital (e.g. resource use and access to land), economic and social capital, health and inequality.
The idea of national parks adopting a developmental agenda stems from a paradigm shift away from traditional forms of conservation (preservation) to more contemporary forms that encompass both conservation and development objectives (Anthony 2007). This led to what is widely known today as community-based conservation (CBC) (Berkes 2007). The underlying principle of this combined approach is that poor rural communities should benefit directly from conservation (Cock & Fig 2000).
Several variations of the approach developed over the years, including (1) that communities should develop their own traditional or cultural land into conservation areas (IUCN 2010; Stevens 2014); (2) that communities should support protected areas and, in return, that they ought to benefit from job creation, skills development and other types of development in their communities (Bennet 2014; Pelser, Redelinghuis & Velelo 2013); (3) that communities should be allowed to harvest grass, wood, medicinal plants and other natural resources from parks (Cock & Fig 2000; SANParks 2016); and (4) the use of 'trade-offs', where certain areas (and the biodiversity contained therein) are protected whilst other parts of the park are made available for development (Rights & Resource Initiative 2015). Mokala National Park (MNP), which serves as a case study in this article, is a good example of a trade-off approach being applied within a South African context, as it is basically a 'trade-off park'1 in the place of the former Vaalbos National Park that was handed back to a local community as part of a land restitution case (SANParks 2017).
Elements of these variations to CBC can also be found in the latest version of SANParks' 5-year strategic management plan (2015/2016-2019/2020) and, more specifically, in its strategic outcome-orientated Goal 3, in terms of which SANParks' goal is (SANParks 2016):
[t]o foster an efficient, effective and development oriented public service and an empowered, fair and inclusive citizenship that will enable the creation of decent employment through inclusive economic growth, vibrant, equitable and sustainable rural communities. (p. 28)
As outlined in the document, this plan is underpinned by the current national government's 'five key pillars', which include job creation, rural development, education and health, as well as a reduction in the levels of crime in society.
SANParks adopted a vision 'Connecting to Society' (SANParks 2012), created a Social Ecology Unit (Swemmer & Taljaard 2011), expanded the scope of its people and conservation programme and added several programmes aimed at promoting access and benefit-sharing, socio-economic development and improved living conditions for local communities adjacent to national parks. This encompasses the implementation of national government's expanded public works programmes (EPWP) (e.g. working for water, land, wetlands, the coast, fire, etc.), value-adding industries, wildlife economy, the development of small, medium and micro-sized enterprises (SMMEs) and a number of social investment programmes at almost all of the national parks (SANParks 2012).
It is not difficult to justify national parks in South Africa endorsing a development agenda. From a conservation perspective, an interdependence between biodiversity and sustainable rural development is needed (Faasen 2006), and much has been written about the threat of unsustainable land-use practices as well as the impact that resource-poor, hunger-stricken rural communities may have on biodiversity and wildlife (Vira & Kontoleon 2010). From a development perspective, this approach also makes sense as parks are scattered throughout South Africa, often in deep rural areas where government cannot always address all the needs in these communities, which are often resource-poor and desperate for help and support from others (Flora, Flora & Gasteyer 2015; Mohan 2009).
The benefits of a CBC approach, as well as the costs thereof and the challenges it poses, have been widely reported (Botha, Witkofski & Cock 2007; Murphee & Hulme 2001; Western, Wright & Strum 2013). Most authors seem to concur that CBC, at best, has only achieved mixed results (Berkes 2004; Conley & Moote 2003; Mansuri & Rao 2004). Many reasons for this have been given (Cox, Arnold & Villamayor-Tomas 2010), which centre mainly around the fact that community development objectives and conservation objectives are often incompatible and that the benefits derived from community-conservation partnerships are often one-sided, primarily benefitting a conservation rather than a community development agenda (Emerton 2001).
One possible strategy to investigate and address these concerns further is to assess the actual needs of communities adjacent to national parks empirically (Wells & McShane 2004) in light of existing literature as well as on the basis of a qualitative exploration pertaining to national parks' current and proposed community development strategies as well as their pool of available resources, skills et cetera. This would enable the feasibility of various development initiatives to be assessed in the light of empirical evidence about what specific communities identify as their particular needs, which, in turn, will allow for distinctions to be made in terms of the viability of specific strategies as outlined in existing SANParks documentation. Furthermore, this approach could potentially address the one-sidedness of the relationship between parks and communities by ensuring that the development side of CBC initiatives articulates self-identified community needs.
Although SANParks has already adopted a developmental approach, given limitations such as restrictions on specific development-related skills and expertise (Berkes 2007; Biggs et al. 2014; Pelser et al. 2013) that fall outside the typical skills required for park personnel, capacity and resources, the extent to which national parks can play a substantive role in community development needs to be investigated. To address these questions, a sequential exploratory, mixed-methods study was conducted in two rural communities (Ritchie and Ratanang) near MNP in order to explore what the typical developmental needs within communities situated near a national park are. This was followed by an additional qualitative study (with a minor quantitative component) aimed at exploring MNP's available capacity, skills and expertise and current CBC initiatives. Following this, the identified community needs were evaluated in the light of a theoretical and empirical investigation of SANParks' CBC initiatives as well as the organisation's capacity, resources and expertise with the intention to assess the feasibility of such needs being addressed by parks such as MNP.
Research method and design
Study area
Mokala National Park is situated in a semi-arid part of central South Africa near Kimberley in the Northern Cape Province (Figure 1). Ritchie, with a total estimated population size of 3504 (Stats-SA 2011), is situated on the Northern Cape side of the border near Modderrivier, an area that falls within the Frances Baard District Municipality and Sol Plaatjies Local Municipality, whilst Ratanang, with a total estimated population size of 4213 (Stats-SA 2011), borders Jacobsdal, which is located on the Free State side of the border and falls within the Xhariep District and Letsemeng Local Municipality (see Figure 1). The largest portion of the population in both areas classify themselves as mixed race and speak mostly Afrikaans (Stats-SA 2011). The two communities were selected as they are the communities closest to Mokala.

Design
A mixed-methods approach, based on a pragmatic paradigm (Creswell & Plano Clark 2007; Johnson, Onwuegbuze & Turner 2007), was followed in the present study, which was executed in three sequential phases: an initial exploratory qualitative phase aimed at identifying the development needs in the two communities; a quantitative phase, where a structured survey was developed and administered to verify and quantify the needs that were identified during the first phase; and a final qualitative phase (with a minor quantitative component) to determine what parks can reasonably achieve based on their available resources, capacity and expertise. This type of approach is widely accepted as one of the most useful approaches to research, because it provides multiple perspectives on a given topic (Creswell 2003) and also affords researchers the opportunity to further explore and explain quantitative results, which, according to Tashakkori and Teddlie (2003), will add richness, depth and greater credibility to any study.
Participants
During the course of the study, three different groups of participants were recruited. A similar procedure was followed during the first (n = 22) and third (n = 6) qualitative phases of the study, where participants were purposively selected (Creswell 2013) based on their knowledge and experience relevant to the research aims. This approach was supplemented with a snowball sampling strategy, where initially selected participants were requested to refer the researchers to other potential participants who met the sampling criteria (Creswell 2013). The purposive sampling criteria that were set for the first phase required that participants had to be active participants in, or residents of, one of the two communities and had to occupy a central or leadership role in the community. The community leaders were identified via snowball sampling. The initial sample was comprised of two staff members from MNP, two staff members from SANParks, two ward councillors, a school principal, two local policemen, two nurses heading up community clinics and the two social workers appointed to work in these communities. An additional number of nine community members representing different stakeholder groups (e.g. youth, elderly, women, etc.) were recruited by means of typical instance sampling (Tracy 2013).
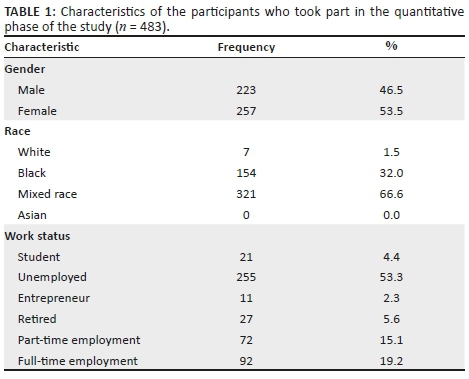
Four hundred and eighty-four participants participated in the second, quantitative phase of the study. Of these, 300 resided in Ritchie (the larger of the two communities) and 184 in Ratanang. A systematic sampling frame (Creswell 2003) was used in order to ensure that all areas of each community were surveyed. Using this approach, every nth household (determined by the total number of participants required for the study in relation to the number of households in each community) was surveyed in each community. The mean age of the participants was 35.97 years (SD = 14.18), with ages ranging from 18 to 86 years. Other relevant demographic information pertaining to the sample is presented in Table 1.
During the third phase, six participants were purposively selected (Tracy 2013) on the basis of having first-hand experience in what MNP or SANParks can realistically achieve in the development space. The participants consisted of a very experienced park manager who managed several national parks in South Africa, a People and Conservation officer who had also worked in multiple parks, the head of the park interface programme, a section ranger and two scientists from SANParks' regional office in Kimberley who worked in all the parks in the arid node.
Procedure and ethics
The first phase of the study took place in early 2016 after ethics clearance was obtained from the North-West University's Human Research Ethics Committee (NWU-00342-15-S1). Once entry into the community had been negotiated, semi-structured interviews were conducted with key participants by the authors and, based on the findings, a structured questionnaire was developed that was subsequently administered to residents of the two communities during the second phase of the study, which took place 1 year later. Eighteen fieldworkers (8 from Ritchie and 10 from Ratanang) were recruited from the respective communities and subsequently trained to administer the survey. Fieldworkers were compensated financially for their services. Informed consent was obtained from all participants. Data were collected over a period of 1 week. Privacy and confidentiality (which are also covered in the informed consent form) were protected by conducting the interviews in a place where the participants felt comfortable (e.g. their homestead) and by making sure that no one other than the researcher had access to the participant's identifiable characteristics linked to specific results. Furthermore, fieldworkers were required to sign confidentiality agreements. Completed questionnaires were inspected on receipt to ensure completeness and correctness and were subsequently taken to the North-West University's Statistical Consultation Services for data capturing and analysis.
During the third qualitative phase of the study, an interview guide and a structured questionnaire were developed based on the results of phases 1 and 2 and were subsequently utilised to gather data from six purposively selected senior members of MNP and SANParks.
In total, the project involved 4 full weeks of fieldwork, which spanned a period of 3 years.
Data gathering methods
During the first (qualitative) phase of the study, data were gathered by means of semi-structured interviews with purposively selected members of the two communities. An interview guide (Tracy 2013) was used to facilitate the interviews. In particular, all participants were asked what they believed to be the most pressing needs in their respective communities.
During the second (quantitative) phase of the study, a structured survey was developed on the basis of the themes that were identified from the first set of semi-structured interviews as outlined previously (see Table 2 for the complete list of items). This strategy was followed in order to ensure that the scale was contextually sensitive and that the items on the scale tapped into actual community needs, as well as to enable the qualitatively identified needs to be empirically quantified and verified. Specifically, participants were requested to rate each of the listed needs on a five-point Likert scale ranging from 1 ('no need') to 5 ('a very big need'). In addition, the survey was structured to gather biographical data pertaining to participants' gender, age, race and employment status.
During the third qualitative phase of the study, data were gathered by means of an interview schedule and structured questionnaire, which were developed on the basis of the findings that emerged from phases 1 and 2 of the study. Participants were requested to rate a list of community needs on a five-point Likert scale (ranging from 1 = 'not at all' to 5 = 'to a great extent') based on their professional view of the extent to which parks like MNP could potentially address each specific need. Participants were then requested to qualitatively elaborate on the reason for their ratings via semi-structured interviews or questionnaires.
Data analysis
Qualitative data derived from phases 1 and 3 of the study were analysed by means of thematic content analysis (Creswell 2003; Tracy 2013). The transcribed data were first read multiple times to ensure immersion in the data, after which data were inductively coded by assigning a brief descriptive label to each segment of text. Based on conceptual similarities, codes were grouped together into categories and overarching themes. These themes formed the basis for the development of the structured survey, which was used to gather data during the second round of the study.
Quantitative data were statistically analysed using SPSS 23 (Field 2005). Descriptive statistics (means and measures of central tendency) were calculated for all items.
Results
Phase 1: Identified community needs
The framework developed by Sirgy et al. (2009) was used to cluster the 17 themes and subthemes that were identified via the thematic analysis of the semi-structured interviews (Phase 1) under the four categories: business services, government services and non-profit-related services, as well as community conditions. Table 2 summarises the main findings that emerged from the analysis and illustrates each with a relevant excerpt from the interviews.
Phase 2: Empirical verification and quantification of community needs
On the basis of the qualitative themes outlined in the previous section, a structured questionnaire was developed and subsequently administered during the second phase of the study. The survey results (see Table 3) confirmed that all the needs that were identified during the qualitative phase of the study are actual needs in the communities, whilst it also enabled the empirical quantification of the relative strength and prevalence of these needs.
According to the participants from both communities, the need for job opportunities was the most pressing (mean = 4.16, SD = 1.22). This was confirmed by the fact that 53.3% of adult participants surveyed were unemployed (see Table 1). The second biggest need was for improved healthcare services (mean = 4.1, SD = 1.14). This was followed by a number of government-related services such as the need for improved infrastructure (mean = 4.09; SD = 1.14), improved waste management (mean = 4.08; SD = 1.13), improved municipal service delivery (mean = 4.07; SD = 1.11), improved safety and security (mean = 4.03; SD = 1.30), improved community policing (mean = 4.00; SD = 1.24), skills development and training (mean = 3.96; SD = 1.27) and improved social services (mean = 3.96; SD = 1.11).
Residents of both communities also felt that there was a significant need for an improvement in public education in their communities, both in terms of the quality and quantity of available educational institutions (mean = 3.95, SD = 1.09).
The survey results also indicate that residents of Ritchie and Ratanang experienced the need for enhanced conservation of their local environments (mean = 3.91, SD = 1.2). A marked need for recreational and sporting facilities is evident not only from the survey results (mean = 3.9, SD = 1.2) but was particularly emphasised during the semi-structured interviews that were conducted with community members. Other needs such as improved local leadership, agricultural support and training and the need for local economic development also achieved an above-average score.
Phase 3: Extent to which Mokala National Park and South African National Parks can potentially address identified community development needs
During the third phase of the study, semi-structured qualitative interviews as well as structured and unstructured questionnaires were used to gather data from purposively selected staff members from MNP and SANParks as well as other experts in relation to the extent to which parks such as MNP can potentially address the development needs that were identified by the communities. Whilst the sample was small, given the expertise of the participants and the need to identify the relative feasibility of each need being addressed, it was deemed to be of value to quantitatively assess all participants' views on the feasibility of each need being addressed (which was done on a five-point scale ranging from 1 = 'not at all' to 5 = 'to a great extent'). This rating was used as the basis for a qualitative exploration of why the participant assigned the given score. Participants' responses to the survey are reflected in Table 4. Following on Table 4, the needs - in order of their ranked importance and based on the themes derived from the qualitative data - will be discussed in greater detail.

More temporary job and employment opportunities
According to the participants, the biggest direct impact that MNP and SANParks can potentially have is via temporary job or employment opportunities (mean = 4.00). As sketched by one of the participants:
'Mokala currently employs nine contractors and each contractor employs 10 or 11 people. This means that nearly 100 contract workers are currently working on one of the Expanded Public Works Programme (EPWP)/Biodiversity Social Project (BSP) activities in the park, for example infrastructure projects, working for ecosystems, working for water, environmental monitors, et cetera.' (Participant 22, male, park manager)
According to the same participant, these temporary job opportunities are creating employment in all national parks in South Africa. The participant also commented that these projects have a lot of potential to address needs related to employment, because the projects' lifecycle typically extends over a period of 2 to 3 years and are often repeated, based on the availability of funding and the need for such services.
The participants also indicated that another opportunity for job creation in parks is to offer concessions to private investors, for example, by outsourcing a park's restaurants, shops, et cetera. According to one of the participants, some of the larger parks such as the Kruger National Park (KNP) are already engaging in this practice, resulting in an increase in the availability of jobs for people from local communities. However, as pointed out by the same participant, this is currently not a feasible strategy at MNP because the park is very remote, its restaurant is not showing much of a profit and accommodation for staff is limited.
Local conservation initiatives
According to expert participants, the second biggest potential impact that MNP and SANParks could have is in the local conservation space, especially via environmental education (EE). Not only is this in line with SANParks' primary mandate, but SANParks already has dedicated staff who can attend to this (its People and Conservation staff) and has a whole array of educational material on hand. As one participant pointed out, 'SANParks also has a fully developed curriculum for environmental education and it has specific programmes aimed at stimulating local conservation initiatives such as its Kids in Park programme' (Participant 23, female, People and Conservation officer). According to the same participant, part of MNP's efforts to stimulate local conservation initiatives includes taking children from local communities to visit the park for up to 2 to 3 days to learn and to be exposed to natural environments and wildlife. This programme, according to another participant (Participant 25, male, head of the park interface programme), has been rolled out at all the local schools in the area.
Skills development and training
The third biggest potential impact that MNP and SANParks can have is via skills development and training. This is largely because of the government-funded BSP/EPWP programmes. According to the participants, training is specifically budgeted for in each of these projects because it is mandatory to train community members temporarily employed through BSP/EPWP in a variety of fields like health, safety and first aid. Furthermore, given that many of these projects are often infrastructure related, for example, building staff accommodation at and erecting a new entrance gate for MNP's Lilydale Camp, participants have the opportunity to acquire practical skills pertaining to the construction industry, which they can subsequently apply in their own communities in support of development (e.g. building various structures).
According to the participants, contractor development also formed an important part of skills development (business management, health and safety, etc.) in the past, the idea being that SANParks should help to empower contractors so that they can secure other job opportunities (contracts) once their contracts with SANParks have expired.
Local economic development
According to one of the participants, MNP spends a portion of its budget in the local economies of Jacobsdal and Modderrivier, but the majority of its budget is spent in Kimberley: 'We do buy local as far as possible. However, some of the foods are not locally available. We therefore have to get it from Kimberley' (Participant 22, male, park manager). However, according to the same participant, Mokala, like all other parks, spends a large portion of its budget on human resources. According to him, at least some of the staff reside in local communities, implying that they also spend a portion of their income at local shops in towns near parks. As such, parks likely have a significant indirect impact on local economic development by means of the disposable income their employees spend in these communities.
Another potential option, according to the same participant, is to focus on supply-chain development. He explained that MNP currently purchases all the meat it uses in its restaurant from a local butcher near the park. Most of the dry food is, however, bought in Kimberley. According to him, much more can be done to identify, source and register local suppliers. In fact, MNP recently undertook an exercise to meet and register local service providers. A potential obstacle that was identified in this process is that suppliers have to be registered on a government database. However, this process is reported to be fairly rapid and inexpensive and, as such, need not pose an undue obstacle to local community members registering their businesses as suppliers. In this regard, national parks like MNP can and have played a supportive role by assisting new service providers with the registration process.
Agricultural support and training
According to the participants, MNP and some of the other national parks are in the process of providing agricultural support and training to local communities. This is currently happening in the Salt Lake community near Mokala. Other parks, such as the Karoo National Park, also focused on this in the past with the help of external service providers. In this regard, the participants felt that the People and Conservation officers can make a huge contribution and that basic skills can be transferred to local communities near parks, which, in turn, can contribute to food security in these communities.
Another participant also indicated that yet another way in which SANParks currently supports agriculture is through its wildlife economy programme, an initiative whereby SANParks gives animals to upcoming farmers on loan to build up their own breeding stock for commercial purposes. MNP is also taking part in this initiative.
More permanent job and employment opportunities
The participants indicated that MNP and SANParks' capacity to provide permanent job opportunities is limited (mean = 2.33). This state of affairs was confirmed in the present study where only two individuals from the Ritchie community were reported to be employed by MNP and only one resident was employed by SANParks' regional office in Kimberley. This, according to the participants, can be ascribed to the fact that Mokala is still a developing park and small compared to other parks: 'There are some expectations, but Mokala is a small park compared to Kruger and can only contribute a small fraction' (Participant 23, female, People and Conservation officer).
According to another participant, the creation of job opportunities in parks will also depend on the staff turnover at the parks (via natural attrition, resignations and retirements). This, according to him, is relatively low at present, thus limiting the capacity of parks like MNP to address this need in a feasible manner.
Another limiting factor that has an influence on the creation of job opportunities, according to the participants, is that some of the higher (more specialised) post levels require some formal education (graduate or postgraduate qualification), which ordinary community members from local communities often do not have.
One of the participants also indicated that in her experience, local community members are not aware of the employment opportunities that exist in parks. As a result, MNP is in the process of implementing the Yes Programme, which is a programme by the national government that is aimed at creating awareness among the youth of the type of job opportunities that exist in parks and within other government institutions.
Improved quality and quantity of education
The participants agreed that they, as a park and as part of SANParks, will not be able to improve the quality of education offered by local primary and secondary schools, nor the quantity of those schools in the area. They did, however, concede that SANParks can support the curriculum by providing context and practical exposure to school children, especially via their EE programmes and initiatives.
Recreation facilities and activities
According to one of the participants, SANParks can play a supporting role in the development of municipalities' Integrated Development Plans, especially when it comes to providing inputs regarding the development of urban parks and open spaces.
A second option, according to the participants, is for communities to make use of the free-entrance week that is normally offered by all national parks in South Africa in the course of September.
Yet another alternative mentioned by Participant 22 is to make use of the honorary ranger's project that, among others, involves hosting an annual mountain bike race in MNP. This initiative, according to him, has a lot of potential to involve developmental groups from the local community.
Improved waste management
Although MNP, and parks in general, cannot take the responsibility for waste management outside the park or in local communities, the participants indicated that improved waste management is a need that they share with local communities.
One of the participants also indicated that MNP is in the process of developing a recycling plant at the park. According to him, this can potentially provide opportunities for local communities. However, given that there are no waste depots or landfill sites near the park, all waste will have to be transported to the town of Kimberley over a distance of 90 km, which is likely to affect the feasibility of this strategy adversely from a community development perspective.
Access to tertiary education
According to the participants, SANParks at present only offers bursaries to its own staff and their children, which implies that even though some of these employees do reside in local communities, the capacity to address this need is limited. However, SANParks also has a junior scientist programme that provides opportunities for upcoming scientists to obtain a master's degree or PhD. According to one of the participants, the programme started in KNP and will be expanded to other parks as well. In addition, SANParks is providing in-service training to graduates with a diploma or degree in conservation, and some of the beneficiaries have even been absorbed as section or field rangers or biotechnicians.
Improved infrastructure
The participants indicated that it would be difficult (if not impossible) for them as a park to address the larger infrastructural needs of their surrounding communities. However, according to them, SANParks does have a socio-economic development department that assists with some of the infrastructure needs in communities (e.g. at schools and with regards to libraries). These interventions are funded by a percentage of the conservation fees that are paid by tourists.
Improved leadership
Here, too, the participants agreed that SANParks cannot really make a significant direct contribution. However, according to one of the participants, SANParks is making an indirect contribution through its Kids in Parks programme, because this programme is aimed at instilling leadership ethics at an early age, especially with regards to the disciplines of conservation and biodiversity.
Improved municipal service delivery
The participants indicated that they, as a park and SANParks in general, will not be able to address needs related to service delivery in local communities outside the park. The participants were fairly unanimous that this is the responsibility of local municipalities.
Improved community safety, security and policing
Participants felt that the need for improved safety and security and better policing in communities cannot be feasibly addressed by SANParks to any significant extent. Nevertheless, given that parks do indeed take measures to ensure security both inside the park and along their boundaries, it stands to reason that their immediate neighbours must be benefitting from these measures to some degree.
Establishing more schools
The participants unanimously felt that MNP and SANParks will not be able to make a significant contribution towards the actual building of more schools.
Improved availability of and/or access to healthcare services (e.g. clinics)
Participants indicated that the need for improved availability of and/or access to healthcare is a need they share with local communities. According to them, some of their staff members have to travel all the way to Kimberley to get treatment and/or chronic medication. Because the park is quite a distance from Kimberley, this involves hours of travel and adversely affects productivity. Negotiations with the department of health to build a clinic nearby or in the park are currently underway. Nevertheless, participants indicated that SANParks' direct potential contribution to addressing this need is minimal.
Improved social services (e.g. social workers)
All the participants agreed that addressing the need for improved social services falls completely outside their mandate and capacity.
Discussion
This study investigated the feasibility of national parks in South Africa endorsing a community development agenda, using MNP and two neighbouring communities as case study. A sequential mixed-methods approach was followed, comprising three phases that spanned a 3-year period.
In relation to the first two phases of the study, which aimed to investigate community needs both qualitatively and quantitatively, findings revealed that the communities' most significant needs centre around employment opportunities; improved healthcare, service delivery and waste management; an improvement in the quality of and access to primary and secondary education opportunities (i.e. schools); and more opportunities for local residents to afford and access tertiary education opportunities. Community members also expressed the need for improved community policing, safety and security; social services and agricultural support and training as well as general skills development and training, local leadership, recreational facilities, local economic development and conservation initiatives.
As will be outlined in the section to follow, the results from the third phase of the study suggest that MNP (and SANParks in general) could realistically only address some of the identified community needs to a significant degree.
The need for employment opportunities as well as the need for skills development and training ranked tops among those identified by the communities targeted in this study. Given that studies by Tepela and Omara-Ojungu (2012) in communities near KNP and by Pelser et al. (2013) near the Golden Gate Highlands National Park revealed similar results, it should come as no surprise that addressing the high unemployment rate in South Africa - identified as one of the 'five key pillars' of national government - has been adopted as a key element in SANParks' vision. In reaction to national government's call to address the unemployment rate, MNP/SANParks indicated that their biggest potential contribution would be in the form of temporary job creation, mainly via the EPWP/BSP programmes. In 2015-2016, three EPWP/BSPs were in operation at Mokala (Spies 2015). Since then, this number has increased to nine - which shows that there is still potential for growth.
Findings derived from the semi-structured interviews in this study confirmed that members of the Ritchie community did indeed benefit from the EPWP/BSP initiative and that over 100 local community members are currently benefitting from these programmes initiated by MNP, but the findings also revealed that several challenges are being experienced in as far as job allocation and the timely settlement of payments are concerned. From the park's perspective, Spies (2015) found the initiatives to be fairly successful, despite some challenges.
According to SANPark's 2015-2016 annual report, EPWP/BSP programmes are on offer in all 19 South African national parks, and 23 298 local community members are being employed on a semi-permanent basis (given that projects typically span 2 to 3 years and are often renewed).
These projects simultaneously also address the community need for skills development and training, as all temporary employees are being trained in a whole array of skills ranging from first aid to construction, some of which might increase their future employability and/or their ability to support local economic or infrastructure development in their own communities by, for example, making use of the skills they have acquired in the construction industry to erect structures in their own communities.
The creation of permanent jobs, though, seems to be a totally different matter that depends on the size of a particular park, its potential for expansion and the turnover of existing staff members. However, given that SANParks employs only around 4000 people countrywide (SANParks 2016) and that funds allocated to national parks are limited (SANParks 2016), the number of people that can be employed by the organisation on a permanent basis is clearly limited.
Two potential avenues for job creation that have probably hitherto been underutilised are to make private concessions available to private investors and to create more opportunities for self-employment. In case of the former, it is likely that private investors will have the capital to grow SANParks' facilities such as restaurants and accommodation and, in the process, to create more job opportunities.
Given that MNP and other parks are already engaging in the practice of sourcing supplies locally, another feasible strategy that could be investigated would be to establish and develop vetted local supply chains with communities adjoining national parks. Given that they are mostly rural (i.e. agricultural), residents could be afforded the opportunity to provide parks with an array of fresh vegetables, fruit and meat or an assortment of arts and crafts. Such a practice is also likely to make a meaningful contribution to local economic development.
The capacity to address the need for local conservation initiatives was ranked second highest. Given that environmental conservation is one of its core mandates, national parks can definitely play a significant role in this regard. Not only would such initiatives fall within SANParks' expertise, but the organisation also has the capacity to address these needs via its People and Conservation division (a programme by SANParks that is used to drive the dual agenda of conservation and development) and the various extension programmes it has on offer. Furthermore, SANParks can also play a role in the development of new conservation areas in traditional and cultural land via collaborative engagement with local communities.
A very pertinent need that was identified in the communities was for recreational facilities and activities. Whilst participants felt that direct involvement in the establishment of recreational facilities generally falls outside the scope of SANParks' mandate, the results of this study do suggest a couple of strategies that could be assessed for feasibility. These include sponsoring recreational facilities (e.g. participants in both communities expressed the need for a skateboard park), sponsoring local residents' participation in the annual park mountain bike race or promoting the park itself as recreational facility, perhaps via sponsoring occasional transport and entry into the park as is currently the case with the free-entrance week that usually occurs in September of each year. The latter strategy would represent a synergistic approach as it combines the park's core asset with a community need, which, as repeatedly revealed in the qualitative interviews, is likely to make a significant positive difference in the lives of residents of impoverished communities.
The findings suggest that MNP and other parks can play a significant role in agricultural support and training. In this regard, parks can partner with external service providers and provide wildlife to emerging farmers. Agricultural support and development is an international priority (linked to sustainable development goals) simply because it has a bearing on food security (FAO 2018). It also forms an integral part of South Africa's national development plan, given that it is part of government's efforts to stimulate integrated and inclusive rural economies in South Africa (The Conversation 2017).
A shared need that was identified by the communities and MNP was for improved waste management. Whilst direct involvement in refuse removal falls outside the auspices of SANParks' community development mandate and CBC initiatives, in this case, it could potentially play a role in terms of promoting environmental awareness and education. This would also be in the interest of national parks, given that refuse and pollution generated by local communities adjacent to national parks have the potential to impact the park and visitors' perceptions and experiences of the park adversely. In partnership with local authorities, the barriers that prevent people from keeping their communities clean can be identified and addressed. For example, MacAllister (2015) found that there were instances where managing farm waste as a health problem served as a means to help address this issue in communities and to prevent concomitant health issues.
Although MNP indicated that it cannot directly contribute to infrastructure development in local communities (e.g. roads, buildings, sanitation, etc.), it can play a role through its socio-economic development initiatives by supporting local supply-chain development and providing skills (such as construction skills) and opportunities to local community members. The beneficiaries of these initiatives can then, in turn, use the skills they have acquired to benefit their communities.
A huge need that was identified by the communities was to improve education. Whilst the findings clearly reveal that SANParks can only play a limited role in the context of formal education and cannot do much to increase the quantity and quality of schools in the region, it can nevertheless play a meaningful educational role by providing new learning opportunities and contexts for children. A number of parks already have some very good educational programmes and projects in place. Included among these are the heritage project Imbewu (developed to promote the transference of traditional cultural knowledge from older to younger people), the junior rangers programme (aimed at promoting civil service and volunteerism in parks), the Kids in Parks programme (aimed at exposing youngsters to parks and pristine natural environments) and the Koedoe Green Schools Programme (an EE programme focusing on, among others, climate change) (SANParks 2017). The potential value of projects such as these were underscored in the present study, where several participants reported that their children showed a marked change in their attitudes and enthusiasm towards the natural environment after a visit to MNP. Findings from the interviews revealed that whilst children would often kill animals such as snakes on sight, those who experienced a guided visit to MNP not only ceased this practice but actively encouraged others in the community to refrain from doing so.
Nevertheless, whilst valuable in itself, exposure to parks and EE will likely not promote the educational agenda necessary for people to matriculate with flying colours or to find gainful employment. This notion is supported by Van der Berg et al. (2011), who found that the level of education in rural communities bordering national parks is typically insufficient for learners to further their tertiary education at a university or college. Limited access to tertiary educational institutions (which was also found in the survey to be a significant community concern and need) and lack of funding, as well as lack of awareness of funding opportunities, conspire to exacerbate this problem. Even though both government and universities are currently doing a lot to assist communities in this regard (DHET 2017), national parks could also potentially play a significant role by, for example, offering bursaries to communities for those who wish to study science or conservation. In the long run, this will enhance the probability that residents originating from these communities may well end up finding permanent employment within a park structure.
Finally, the results indicate that there is very little that MNP and SANParks can feasibly do to directly address needs related to healthcare services (even though they share the need), community safety and security, community policing, social services (e.g. social workers), local leadership and the establishment and erection of more schools, as these needs generally fall outside the auspices and capacity of national parks in South Africa.
Elsewhere, Naughton-Treves, Buck Holland and Brando (2005) came to the same conclusion, whilst Andam et al. (2010) also questioned the actual impact national parks could have on poverty.
In light of the above, it seems necessary to rethink and possibly reconceptualise the developmental agenda that national parks are expected to drive so that these aims are more in line with (1) what parks can reasonably achieve based on resources, capacity and expertise and (2) what communities surrounding national parks need according to their own articulation. Failure to do so could invite the risk of creating unrealistic expectations among communities, resulting in an increased likelihood of general resentment and negative attitudes towards conservation among communities when such expectations are not fulfilled (Anthony 2007). Furthermore, though well-intentioned, community development initiatives that are not aligned with community needs or the capacity, resources and expertise of national parks are likely to either result in costly failures or might fail to truly have a meaningful impact on communities.
It is hoped that the findings of this study will be of use in informing SANParks' community development initiatives and ensuring that those initiatives are optimally aligned with actual community needs.
Conclusion
Using a sequential mixed-methods design, this study set out to investigate the feasibility of national parks in South Africa endorsing a community development agenda based on an exploration of community needs using MNP and two neighbouring rural communities as a case study. Based on the results, the feasibility of national parks substantively addressing all community needs is questioned as many of these needs fall outside the scope, capacity, skills and resource capability of the organisation.
Nevertheless, as was revealed in this study, national parks have the ability to directly or indirectly support several pressing community needs by creating jobs (especially by means of temporary projects and, to a far lesser extent, by means of direct employment) and by enabling those who partake in such employment opportunities to be trained and to develop specific skills. Furthermore, initiatives aimed at promoting awareness and education around waste management and local environmental conservation, supporting local economic development, sponsoring recreational facilities and/or access to parks as well as offering agricultural support and training have been identified as means whereby Mokala can respond to the needs experienced by its surrounding communities. Such initiatives would not only articulate with genuine community needs but could be feasibly pursued based on SANParks' expertise, resources and core mandate and thus hold the promise of truly achieving a positive impact on community development.
Acknowledgements
Competing interests
The authors declare that they have no financial or personal relationship that may have inappropriately influenced them in writing this article.
Authors' contributions
Both authors contributed equally to conceptualising the study as well as towards collecting and analysing the data and writing the manuscript.
Funding information
This study was funded through a strategic research grant of the Unit of Environmental Sciences and Management, Faculty of Natural and Agricultural Sciences, North-West University.
References
Andam, K.S., Ferraro, P.J., Sims, K.R.E., Healy, A. & Holland, M.B., 2010, 'Protected areas reduced poverty in Costa Rica and Thailand', Proceedings of the National Academy of Sciences 107(22), 9996-10001. https://doi.org/10.1073/pnas.0914177107 [ Links ]
Anthony, B., 2007, 'The dual nature of parks: Attitudes of neighbouring communities towards Kruger National Park, South Africa', Environmental Conservation 34(3), 236-245. https://doi.org/10.1017/S0376892907004018 [ Links ]
Barrow, G.C., 2015, 'The socio-economic benefits of new national parks designations in Scotland', Association for the Protection of Rural Scotland 1, 2-13. [ Links ]
Bennet, N.J., 2014, 'Why local people do not support conservation: Community perceptions of marine protected area livelihood impacts, governance and management in Thailand', Marine Policy 44, 107-116. https://doi.org/10.1016/j.marpol.2013.08.017 [ Links ]
Berkes, F., 2004, 'Rethinking community-based conservation', Conservation Biology 18(3), 621-630. https://doi.org/10.1111/j.1523-1739.2004.00077.x [ Links ]
Berkes, F., 2007, 'Community-based conservation in a globalized world', PNAS 104(39), viewed 10 January 2017, from http://www.pnas.org/content/104/39/15188.full.pdf [ Links ]
Biggs, D., Swemmer, L., Phillips, G., Stevens, J., Freitag, S. & Grant, R., 2014, 'The development of a tourism research framework by South African National Parks to inform management', Koedoe 56(2), Art. #1164, 9 pages. [ Links ]
Botha, J., Witkofski, E.T.F. & Cock, J., 2007, 'Is "something better than nothing"? The impacts of ten outreach nurseries on South African community stakeholders', Forests, Trees and Livelihoods 17, 199-221. https://doi.org/10.1080/14728028.2007.9752597 [ Links ]
Cock, J. & Fig, D., 2000, 'From colonial to community based conservation: Environmental justice and the national parks of South Africa. Society in Transition 31(1), 22-35. https://doi.org/10.1080/21528586.2000.10419008 [ Links ]
Conley, A. & Moote, M.A., 2003, 'Evaluating collaborative natural resource management', Society & Natural Resources 16(5), 371-386. https://doi.org/10.1080/08941920309181 [ Links ]
Cox, M., Arnold, G. & Villamayor-Tomas, S., 2010, 'A review of design principles for community-based natural resource management', Ecology and Society 15(4), 38. https://doi.org/10.5751/ES-03704-150438 [ Links ]
Creswell, J.W., 2003, Research design: Qualitative, quantitative, and mixed methods approaches, Sage, Thousand Oaks, CA. [ Links ]
Creswell, J.W., 2013, Qualitative inquiry and research design choosing among five approaches, Sage, Thousand Oaks, CA. [ Links ]
Creswell, J.W. & Plano Clark, V.L., 2007, Designing and conducting mixed methods research, Sage, Thousand Oaks, CA. [ Links ]
Department of Higher Education and Training, 2017, Official website, viewed 10 January 2017, from http://www.dhet.gov.za/ [ Links ]
Emerton, L., 2001, 'The nature of benefits and the benefits of nature: Why wildlife conservation has not economically benefited communities in Africa', in D. Hulme & M. Murphree (eds.), African wildlife and livelihoods: The promise and performance of Community Conservation, pp. 208-226, David Philip Publ, Cape Town, South Africa. [ Links ]
Faasen, H., 2006, 'Synergies between biodiversity conservation and sustainable rural development of adjacent communities: A case study of the Tsitsikamma National Park', PhD thesis, University of Stellenbosch, Faculty of Agriculture and Forestry Sciences. [ Links ]
Field, A., 2005, Discovering statistics using SPSS, Sage, London. [ Links ]
Flora, C.B., Flora, J.L. & Gasteyer, S.P., 2015, Rural communities: Legacy and changes, Westview Press, Boulder, CO. [ Links ]
Food and Agriculture Organization of the United Nations, 2018, viewed 10 August 2018, from http://www.fao.org/sustainable-development-goals/en/ [ Links ]
IUCN, 2010, Policy matters 17, viewed 10 January 2017, from https://www.iucn.org/downloads/policy_matters_17___pg_173_204.pdf [ Links ]
Johnson, R.B., Onwuegbuze, A.J. & Turner, L.A., 2007, 'Toward a definition of mixed methods research', Journal of Mixed Methods Research 1(2), 112-133. https://doi.org/10.1177/1558689806298224 [ Links ]
Kusters, K., Achdiawan, R., Belcher, B. & Perez, M., 2006, 'Balancing development and conservation? An assessment of livelihood and environmental outcomes of nontimber forest product trade in Asia, Africa, and Latin America', Ecology and Society 11(2), 20. https://doi.org/10.5751/ES-01796-110220 [ Links ]
Lundmark, J.L., Fredman, P. & Sandell, K., 2010, 'National parks and protected areas and the role for employment in tourism and forest sectors: A Swedish case', Ecology and Society 15(1), 19. https://doi.org/10.5751/ES-03175-150119 [ Links ]
MacAllister, J., 2015, Factors influencing solid-waste management in the developing World, All Graduate Plan B and other reports. Paper 528, Utah State University, DigitalCommons@USU, Utah. [ Links ]
Machlis, G.E. & Field, D.R., 2000, National parks and rural development: Practice and policy in the United States, Island Press, Washington, DC. [ Links ]
Mansuri, G. & Rao, V., 2004, 'Community-based and -driven development: A critical review', World Bank Research Observer 19(1), 1-39. https://doi.org/10.1093/wbro/lkh012 [ Links ]
Mohan, G., 2009, 'The significance of rural areas in South Africa for tourism development through community participation with special reference to Umgababa, a rural area located in the province of KwaZulu-Natal', University of South Africa, Pretoria, viewed 16 January 2017, from http://hdl.handle.net/10500/2159 [ Links ]
Murphee, M.W. & Hulme, D., 2001, African wildlife and livelihoods: The promise and performance of community conservation, James Currey Ltd, Oxford. [ Links ]
Naughton-Treves, L., Holland, M. & Brando, K., 2005, 'The role of protected areas in conserving biodiversity and sustaining local livelihoods', Annual Review of Environment and Resources 30, 219-252. https://doi.org/10.1146/annurev.energy.30.050504.164507 [ Links ]
Nelson, J.G. & Serafin, R., 2013, National parks and protected areas: Keystones to conservation and sustainable development, NATO ASI book series 40, Springer-Verlag, Berlin Heidelberg. [ Links ]
Newmark, W.D. & Hough, J.L., 2000, 'Conserving wildlife in Africa: Integrated conservation and development projects and beyond', BioScience 50(7), 585-592. https://doi.org/10.1641/0006-3568(2000)050[0585:CWIAIC]2.0.CO;2 [ Links ]
Pelser, A., Redelinghuis, N. & Velelo, N., 2013, Protected areas as vehicles in population development: Lessons from rural South Africa, viewed 10 January 2017, from http://conferences.ufs.ac.za/dl/Userfiles/Documents/00001/654_eng.pdf [ Links ]
Petursson, J.G. & Vedeld, P., 2017, 'Rhetoric and reality in protected area governance: Institutional change under different conservation discourses in Mount Elgon National Park, Uganda', Ecological Economics 131, 166-177. https://doi.org/10.1016/j.ecolecon.2016.08.028 [ Links ]
Pullin, A.S, 2014, Assessing the effects of terrestrial protected areas on human well-being: ASTAP Advisory Document, Global Environmental Facility, Washington, DC. [ Links ]
Rights and Resource Initiative, 2015, Protected areas and the land rights of indigenous peoples and local communities: Current issues and future agenda, viewed 10 January 2017, from file:///C:/Users/12894451/Desktop/RRIReport_ProtectedAreas-and-LandRights_web.pdf [ Links ]
SANParks, 2012, SANParks Annual Performance Plan, viewed 10 January 2017, from https://www.sanparks.org/assets/docs/about/annual_performance_plan_2012013.pdf [ Links ]
SANParks, 2016, SANParks Annual Report 2015/16, viewed 10 January 2017, from https://www.sanparks.org/assets/docs/general/annual-report-2016.pdf [ Links ]
SANParks, 2017, Official website of South African National Parks, viewed 10 January 2017, from https://www.sanparks.org/about/connecting_to_society/ [ Links ]
Sirgy, M.J., Widgery, R.N., Lee, D. & Yu, G.B., 2009, 'Developing a measure of community well-being based on perceptions of impact in various life domains', Social Indicators Research 96, 295-311. https://doi.org/10.1007/s11205-009-9479-9 [ Links ]
Spies, M.O., 2015, 'An exploration of whether the People and Parks Programme contributes to capacity building and awareness in the Ritchie community near Mokala National Park', Unpublished honours dissertation, North-West University, Potchefstroom Campus. [ Links ]
Stats-SA, 2011, Official website of Statistics South Africa, viewed 10 January 2017, from http://www.statssa.gov.za/?page_id=3839 [ Links ]
Stevens, S., 2014, Indigenous peoples, national parks, and protected areas: A new paradigm linking conservation, culture, and rights, University of Arizona Press, Tucson, AZ. [ Links ]
Stolton, S. & Dunley, N., 2015, Values and benefits of protected areas, ANU Press, Canberra, Australia. [ Links ]
Swemmer, L.K. & Taljaard, S., 2011, 'SANParks, people and adaptive management: Understanding a diverse field of practice during changing times', Koedoe 53(2), 1-7. https://doi.org/10.4102/koedoe.v53i2.1017 [ Links ]
Tashakkori, A. & Teddlie, C., 2003, Handbook of mixed methods in social and behavioral research, Sage, Thousand Oaks, CA. [ Links ]
Tepela, B.N. & Omara-Ojungu, P.H., 2012, 'Towards bridging the gap between wildlife conservation and rural development in post-apartheid South Africa: The case of the Makuleke community and the Kruger National Park', South African Geography Journal 81(3), 1999. [ Links ]
The Conversation, 2017, How land reform and rural development can help reduce poverty in South Africa, viewed 10 August 2018, from http://theconversation.com/how-landreform-and-rural-development-can-help-reduce-poverty-in-south-africa84146 [ Links ]
Tisdell, C., 1999, Biodiversity, conservation and sustainable development: Principles and practices with Asian examples, Cheltenham, Edward Elgar. [ Links ]^rND^1A01 A02^nHelga^svan der Merwe^rND^1A01^nNoel^svan Rooyen^rND^1A03 A04^nHugo^sBezuidenhout^rND^1A05^nJacobus du P.^sBothma^rND^1A01 A06^nMargaretha W.^svan Rooyen^rND^1A01 A02^nHelga^svan der Merwe^rND^1A01^nNoel^svan Rooyen^rND^1A03 A04^nHugo^sBezuidenhout^rND^1A05^nJacobus du P.^sBothma^rND^1A01 A06^nMargaretha W.^svan Rooyen^rND^1A01 A02^nHelga^svan der Merwe^rND^1A01^nNoel^svan Rooyen^rND^1A03 A04^nHugo^sBezuidenhout^rND^1A05^nJacobus du P^sBothma^rND^1A01 A06^nMargaretha W^svan Rooyen ORIGINAL RESEARCH Vachellia erioloba dynamics over 38 years in the Kalahari Gemsbok National Park, South Africa Helga van der MerweI, II; Noel van RooyenI; Hugo BezuidenhoutIII, IV; Jacobus du P. BothmaV; Margaretha W. van RooyenI, VI ISouth African Environmental Observation Network, Kimberley, South Africa ABSTRACT Vachellia erioloba is a keystone tree species in the southern Kalahari. This long-term study over nearly four decades tracks two populations in different landscapes (the interior sandy duneveld versus the clayey Nossob riverbed) of a large conservation area and offers valuable data on this species under natural soil moisture conditions and with limited anthropogenic influences. In 1978, 18 trees were permanently marked in a 1 ha plot in the interior duneveld of the Kalahari Gemsbok National Park (Dankbaar site). In the Nossob riverbed all trees in a 1 ha plot were surveyed in 1979 (Grootkolk site). At both sites, tree height and stem circumference were subsequently measured at irregular intervals until 2016 in order to investigate growth rates and population structure. Of the 18 marked trees at Dankbaar, six died and three showed coppice regrowth following substantial dieback after a fire. A mean height increase of 60 mm/year was recorded and the mean height of the remaining uncoppiced trees was 6.8 m in 2016. Stem diameter growth rate per year varied widely between trees and between years with a mean value of 2.5 mm/year over the 38-year period. Growth rate calculated for three 10-year intervals varied. Using the mean growth rate derived in the current study and stem size of the dead trees, the mean age of the trees when they died was estimated. At the Grootkolk site, the position of the centroid in relation to the midpoint of the diameter class range suggests that this population is gradually becoming a mature to old population with limited recruitment. This was supported by the size class distribution curves. However, no differences between slopes or intercepts of the stem diameter size class distributions were found. Keywords: conservation area; growth rate; Kgalagadi Transfrontier Park; long-term study; size class distribution; tree age. Introduction Ecological patterns generated from a single snapshot in time should be used carefully when trying to identify the underlying processes driving the system (Jeltsch, Moloney & Milton 1999), and long-term data can be very useful to assist with the interpretation of ecosystem patterns and processes. However, appropriate long-term data are difficult to find in the case of long-lived organisms such as trees, whose lifetimes are usually considerably longer than those of researchers (Menges 2000). In arid systems, this is further exacerbated by low rates of biotic change (Cody 2000; Lawley et al. 2013; Van Rooyen et al. 2015). In such systems, to accommodate climatic fluctuations, the monitoring of woody species should take place over a timespan in excess of 20 years (O'Connor 1985). In arid savannas, the tree component may seem to be constituted by even-aged cohorts (Midgley & Bond 2001; Wiegand, Ward & Saltz 2005); however, what appear to be cohorts among adult trees may not be even-aged individuals (Seymour 2008). Even-aged stands are interpreted as evidence of the importance of abiotic factors, particularly rainfall, to produce pulsed recruitment. Apparent even-aged stands signify the release from fire or herbivory whereby different-aged saplings are allowed to recruit simultaneously into larger height classes, thus appearing of equal age (Midgley & Bond 2001). In the southern Kalahari, Vachellia erioloba is regarded as a keystone species because it provides food, shelter, perches, nests and roost sites to many types of animals and harbours a distinct assemblage of plant species below its canopy (Barnes 2001; Leistner 1967; Milton & Dean 1995; Seymour 2008; Steenkamp et al. 2008). It is listed as a protected tree species in South Africa (Government Notice no. 1602, 2016). There are, however, growing concerns over increased mortality in mature V. erioloba in the southwestern Kalahari (Schachtschneider & February 2013). The reasons proposed for the increase in mortality include an increase in fire frequency (Seymour & Huyser 2008), increasing groundwater abstraction (Powell 2005; Shadwell & February 2017), harvesting (Seymour 2008), diseases (Slippers et al. 2014), arboricides (Powell 2005) and competition for resources from alien invasive species such as Prosopis (Robertson & Woodborne 2002; Schachtschneider & February 2013; Zachariades, Hoffman & Roberts 2011). These threats are especially relevant outside of conservation areas, emphasising the importance of protected environments in which V. erioloba individuals, exposed only to natural threats such as fire, can be studied. Vachellia erioloba is a long-lived tree with a lifespan in excess of 240 years (Steenkamp et al. 2008). Mature individuals of this species are reportedly not easily affected by short-term climatic variations (Barnes 2001), possibly because individuals have some of the deepest roots of any known species (the maximum recorded is 68 m), allowing them access to deep groundwater sources (Jennings 1974 in Moustakas et al. 2006). Quantitative information on growth rates and lifespan of the species are, however, still inadequate (Steenkamp et al. 2008). From 1978, surveys were initiated in the Kalahari Gemsbok National Park (KGNP) to gather information on the growth rate, lifespan and population dynamics of V. erioloba in the interior duneveld (Dankbaar) and in the Nossob riverbed habitats (Grootkolk). The objectives of this paper were (1) to report on the mean annual increase in stem diameter and tree height of the 18 marked V. erioloba trees at the Dankbaar site; and (2) to document the mean age of those trees that died in the interior duneveld of the park; and (3) at the Grootkolk site to describe changes in the size class distribution of a V. erioloba population in the Nossob riverbed. The publication of these findings contributes to our understanding of V. erioloba population dynamics within large conservation areas without many of the anthropogenic factors proposed to increase mortality in this species. Study area The KGNP is situated in the southern Kalahari (24°15'S-26°30'S and 20°00'E-20°45'E) and covers approximately 9600 km2 (Figure 1). It forms part of the Kgalagadi Transfrontier Park, together with the Gemsbok National Park in Botswana. The mean annual rainfall recorded from 1976 to 2015 at Nossob Rest Camp in the park is 194 mm (Figure 2), with most rain falling between January and April. The annual rainfall has a high coefficient of variation and the rain often falls as short-duration, high-intensity thunderstorms. Temperatures show a large range, with winter lows reaching -10.3 °C and summer highs reaching 45.4 °C (Van Rooyen & Van Rooyen 1998). Sampling was conducted at two sites (Figure 1). The first site is situated 2.7 km east of Dankbaar (1040 m above sea level) in the interior duneveld in the Acacia (Vachellia) erioloba - Schmidtia kalahariensis low duneveld landscape (Van Rooyen et al. 2008). This open tree savanna, dominated by V. erioloba (tree) and S. kalahariensis (grass), occurs in the interior duneveld in the northern part of the park. The aeolian sands of the Low Duneveld landscape are piled into a gently undulating landscape. Beneath the sand lies a vast sheet of calcareous or silicified sand or sandstone that contains grits and minor conglomerates (Malherbe 1984). Van Rooyen (1984) describes the duneveld soils as deep, red, eutrophic, fine and medium sandy soils of the Hutton soil form, or yellow-brown, eutrophic and calcareous, fine to medium sandy soils of the Clovelly soil form (Soil Classification Working Group 1991). The second site, at Grootkolk (1041 m above sea level), is situated in the Nossob riverbed in the Acacia (Vachellia) erioloba - Acacia (Vachellia) haematoxylon riverbeds landscape (Van Rooyen et al. 2008). This landscape is characterised by large scattered V. erioloba trees with a dense grass stratum dominated by Panicum coloratum. Van Rooyen (1984) described the Nossob riverbed's soil as deep, calcareous, reddish-brown and grey-brown loam with clay soils of the Oakleaf, Dundee and Valsrivier soil forms. Upstream from the Grootkolk site, shallow, brown and yellow-brown calcareous sands and loams of the Mispah soil form occur (Soil Classification Working Group 1991). Fine-grained soils in arid areas show the so-called inverse texture effect (Noy-Meir 1973), with the result that there is less available soil water and consequently lower production on fine-textured soils than on coarse-textured soils (Van Rooyen et al. 1984). Methods Field surveys Two study sites (Dankbaar site and Grootkolk site) were surveyed on numerous occasions; however, survey methods used at these two sites differed. In 1978, all V. erioloba trees were marked in a 1 ha plot at the Dankbaar site. Tree height and stem circumference were recorded for each of the 18 permanently marked trees at irregular intervals from 1978 to 2016 (survey years 1978, 1980, 1983, 1985, 1988, 1989, 1991, 1994, 1998, 1999, 2008 and 2016). In 2016, for the first time since the original survey in 1978, all additional trees within the plot were measured and permanently marked. At the 1 hectare (ha) Grootkolk site, height and stem circumference of all V. erioloba individuals were measured at irregular intervals from 1979 to 2016 (survey years 1979, 1984, 1986, 1989, 1994, 1996, 1999, 2008 and 2016). The stem circumferences of all dead trees were also recorded at Grootkolk in the year of the survey when the tree was found to have died. Analysis Because of the different survey methods used at the two sites; the data collected could not be analysed in the same manner for both the sites. For example, only the 18 marked trees at Dankbaar were surveyed throughout the 38-year period; thus an analysis of the population structure is inappropriate as the entire population in the 1 ha plot was not surveyed. An estimate of the growth rate per year over the entire study period (38 years) was calculated for each marked tree at the Dankbaar site by subtracting the first measured stem diameter (1978 survey) from the last live measured stem diameter and dividing by the number of years between these two measurements. Similarly, this method was used to calculate changes in height of a tree. A linear regression using GraphPad 7.02 (GraphPad Software, www.graphpad.com) of stem diameter versus annual growth rate was used to investigate the relationship between these two variables. Additionally, stem diameter growth rates over the first 10-year period (1978-1988), second 10-year period (1988-1998) and third 10-year period (1988-2008) were calculated for each marked individual. This was calculated in the same way as for the entire period, but using the first and last measured diameters for the appropriate periods and calculating a mean across all the individuals. Dead and coppiced individuals were excluded from the calculations from the survey year in which the death or coppicing was recorded for the first time. The mean stem diameter in 1978 and 2016 of all marked trees was used to estimate the average age using the growth rate determined in the current study. The average age of all the marked trees in 1978 and in 2016 were calculated by dividing the mean stem diameter for the particular year by the growth rate determined in the current study. For comparative purposes the mean age of the trees was also calculated by the same method using the mean diameter growth rate for only the interior duneveld (3.2 mm/year) and for the interior duneveld and riverbed combined (3.6 mm/year) reported by Steenkamp et al. (2008). Age was also determined using the growth rate for the interior duneveld and riverbed combined (5.1 mm/year) based on the equation derived for the relationship between radiocarbon age and stem circumference (Steenkamp et al. 2008). These calculations were made using the mean stem diameter of the live trees in 2016 as well as the last 'alive' measured stem diameter for the dead trees. These calculations were also performed for the Grootkolk population using the mean stem diameter of the stem circumference classes. The stem circumferences for trees at the Grootkolk 1 ha plot were classified into 12 equal stem circumference classes (0-20, > 20-40, > 40-60, > 60-80, > 80-100, > 100-120, > 120-140, > 140-160, > 160-180, > 180-200, > 200-220, > 220-240 starting with class 1 and ending with class 12) for each of the survey years. The size class distribution was examined visually to classify the population into one of four population structure types (Gaugris & Van Rooyen 2007; Figure 3). In this model, Type I size class distribution represents a growing population and follows an inverse J-shaped curve, which represents the ideal curve shape for a growing population in a natural environment. There is a constant decrease in the number of individuals as the size classes increase, and the curve spans the whole range of size classes described for the species. Populations with a Type II curve have a near ideal population structure that differs from a Type I only by having a lower abundance of smaller size classes. Populations with Type III size class distributions are typically associated with disturbance. The Type IIIa curve broadly resembles a Type I size class distribution but applies to populations where a section of the curve spanning one or several size classes is missing or where abundance is lower than expected. The typical large pool of small individuals is generally missing in Type IIIb and the size class distribution shows a succession of minor peaks, even with some gaps where one or several size classes may be missing altogether. In the Type IV curve, one or two peaks are observed over a restricted range of size classes, and this curve thus represents an abnormal size class distribution. The curve is either bell-shaped with a peak more or less in the middle of the size class range, or it shows a high frequency of large size classes, with little or no representation of smaller classes. For the 1 ha Grootkolk site the number of individuals recorded per stem circumference size class was calculated in order to obtain the density of trees per size class. Regressions were performed on the density (Di) of individuals against size class (Mi) (Gaugris & Van Rooyen 2007). The diameter class midpoint (Mi) was calculated as the mean of the upper and lower limit of each size class (Condit et al. 1998). Logarithmic transformations, ln (Di + 1) and ln (Mi), were used to standardise the data (Lykke 1998; Niklas, Midgley & Rand 2003) before performing least square linear regressions, that is, ln (Di + 1) for the y-axis and ln (Mi) for the x-axis. The value of +1 was added because some size class bins were empty (Lykke 1998). The linear regressions were evaluated in terms of their slopes and y-axis intercepts (Gaugris, Vasicek & Van Rooyen 2012; Van der Merwe & Geldenhuys 2017). Strongly negative slopes typically represent regenerating populations (Condit et al. 1998), and a high y-axis intercept indicates many small individuals in the population. A y-axis intercept near to zero indicates that few small individuals are present (Everard, Midgley & Van Wyk 1994). Both slopes and y-axis intercepts of regressions were compared statistically across years by means of an analysis of covariance using GraphPad 7.02 (GraphPad Software, www.graphpad.com. Two additional mean values were calculated for the stem diameter distribution for each survey year: (1) the 'centroid' was calculated as the arithmetic mean of all stem diameters recorded; and (2) the 'midpoint of stem diameter range' was calculated as the mean of the upper and lower limits of the diameter range included in the size class distribution. Niklas et al. (2003) found a relationship between the position of the centroid and the diameter class range midpoint for a species. If a centroid value is smaller than the midpoint value, the population is young and growing. When the centroid value is larger than the midpoint value, the population is mature to old. In general, as the mean stem diameter increases in a population, self-thinning occurs and the density decreases, in such a way that an increasing part of the biomass is found in fewer individuals (Niklas et al. 2003; Silvertown & Charlesworth 2001). As self-thinning occurs the centroid of a population shifts towards the right within the size class distribution. Results Growth rate Over the period of 38 years, 6 of the 18 originally marked trees at the Dankbaar site died (33%) and three showed coppice regrowth following substantial dieback because of a fire (Table 1-A1). In 1978 the mean height of the 18 trees was 5.1 m and mean stem diameter 235.85 mm. In 2016 the mean height of the remaining nine originally marked trees that had not experienced dieback was 6.8 m and mean stem diameter 282.7 mm. The mean height for the six dead individuals at the onset of the study was 6.1 m and at the time of last measurement before death 6.8 m. A mean height increase of 60 mm/year was calculated. The 2016 survey measured the remaining 12 originally marked trees as well as 12 additional trees now present; thus, after 38 years, the population increased by six trees in the 1 ha plot. A linear regression of growth rate against stem diameter (Figure 4) indicated that growth rate decreases significantly as stem diameter increases, that is, as the individuals age (p = 0.022). The mean growth rate for the first 10-year period (1978-1988) was 2.99 mm/year, the second 10-year period (1988-1998) 1.01 mm/year and the third 10-year period (1998-2008) 2.84 mm/year, indicating a variable growth rate over time. Stem diameter growth rate per year varied widely between the nine remaining trees (0.91 mm - 4.86 mm/year), with a mean value of 2.5 mm/year. Depending on the choice of mean annual growth rate or application of the regression between stem circumference and age, the mean age of the six dead trees could be estimated at between 71 and 142 years (Table 1). Population structure At the Grootkolk site, 61 live and 14 dead individuals were recorded in the initial survey in 1979. The number of live individuals at Grootkolk in the Nossob riverbed gradually decreased over the survey period (Figure 5). Initially the size class distribution of the trees from 1979 to 1999 could visually be classified as Type IIIb curves; however, there was a gradual transition to a Type IV curve from 2008 to 2016 (Figures 3 and 5). In spite of the decreasing tree numbers and the change of curve shape, linear regressions on the density of individuals against the diameter class midpoint (Figure 1-A1) revealed no significant differences between the slopes (Table 2-A1) or intercepts (Table 3-A1) of the fitted lines. Using calculations from Steenkamp et al. (2008) for the interior duneveld and riverbed, the largest live tree at Grootkolk was aged between 195 and 212 years, while the relationship between stem circumference and radiocarbon age for the interior duneveld and riverbed combined aged the tree between 136 and 148 years (Table 2). When using the same two methods of calculation, most of the dead trees fell in the age categories 25-53, 37-71 and 49-89 years. In all survey years the position of the centroid (arithmetic mean of all stem diameters recorded per site) was to the left of the midpoint of the size class distribution. However, the difference between these two values decreased over time and in 2016 the two values were nearly the same (Table 4-A1), indicating that the population was changing from a young and growing population to a mature to old population. Discussion Growth rate Marked V. erioloba tree stem diameters at Dankbaar in the interior duneveld increased at a mean rate of 2.50 mm/year (range 0.91 mm - 4.86 mm/year) over the monitored period. This mean annual diameter increase is less than the 3.6 mm/year established by Steenkamp et al. (2008) and substantially lower than the 12 mm - 14 mm/year previously reported for Acacia species growing in arid and semi-arid environments (Gourlay 1992). The Steenkamp et al. (2008) study used annual growth ring and radiocarbon ageing to determine growth rates. A mean growth rate was derived from individuals in the interior duneveld as well as in the Nossob riverbed. If only the individuals in the interior duneveld in the Steenkamp et al. (2008) study are considered, then the mean annual diameter increment is 3.2 mm/year. Although Steenkamp et al. (2008) concluded that the growth rate did not differ significantly between trees growing in the dry Nossob riverbed and those growing in the interior duneveld, growth rate varied substantially between individual trees. Variability in the growth rates of other tree species has been reported and the suggested underlying causes for this phenomenon include microsite conditions and/or genetic potential of individual trees (Stahle et al. 1996). Depending on the equation used to determine the age of the dead trees there could be a twofold or greater difference in calculated age at both the Dankbaar (Table 1) (71 years as opposed to 142 years) and Grootkolk (Table 2) (25 years as opposed to 127 years) sites. The high variability in estimated age at which 6 of the 18 marked trees died (48, 103, 163, 178, 181 and 191 years, using the mean annual diameter increase of 2.5 mm/year calculated for this current study) was unexpected. Moustakas et al. (2008), using a combination of aerial photographs and satellite images covering a period of 61 years to provide spatial data on mortality, found that V. erioloba mortality risk was greatest for trees of intermediate size. This does not seem to be the case for the Dankbaar population, where mortality was found to be predominantly among the large trees. At Grootkolk, the data seem to indicate that mortality was highest in smaller size classes and gradually declined for larger size classes. The density of trees at Grootkolk was low, and consequently self-thinning (Silvertown & Charlesworth 2001) is unlikely to have occurred. Population structure On the basis of the position of the centroid in relation to the midpoint of the stem diameter class range, the Grootkolk population could be considered as a population gradually changing from young and growing to mature to old. This is supported by a visual assessment of the size class distribution, which showed a gradual transition from a Type IIIb to a Type IV curve shape over the 38 years. The large peak of young individuals in size class 4 that was evident at the first survey gradually became smaller and shifted to size class 5, and a prominent second peak emerged at size class 8 at the last survey. At Grootkolk, few seedlings were recorded and few individuals appeared to be recruiting into the population. The low survival of size class 2, 3 and 4 individuals over the monitored period could possibly be ascribed to individuals progressing to larger size classes over the monitored period without being replenished. This is supported by the fact that size classes 5 and 8 had more individuals at the end of the monitoring period than when monitoring commenced. Overall, the survival of individuals in the larger size classes (e.g. size classes 6, 7 and 9) exceeded that in the smaller size classes (e.g. size classes 1, 2 and 3). In spite of the fact that the Grootkolk population was almost halved over the 38-year period, the slopes and intercepts of the size class distribution regressions showed no differences between years (Figure 1-A1). In their study, Steenkamp et al. (2008) reported an ageing size class distribution with poor recruitment at some sites in the Nossob riverbed. At other sites, many young individuals were found with only a few mature or dying trees in these populations. The Grootkolk site situated in the same riverbed illustrated an ageing population with few young individuals. It has been suggested that flooding of the Nossob River and/or consecutive years of above-average rainfall were necessary for regeneration of V. erioloba. Steenkamp et al. (2008) were, however, unable to find support to substantiate the need for flooding. Seed germination of V. erioloba is best after good rain events, and seedling survival depends on the availability of moisture during the next few seasons. Mortality rates during seedling establishment are generally higher than during the adult stages (Silvertown & Charlesworth 2001). Seedlings and saplings suffer high mortality in dry years (Barnes 2001; Theron, Van Rooyen & Van Rooyen 1985; Van Rooyen & Van Rooyen 1998; Van Rooyen et al. 1984). The high density of wildlife in the Nossob riverbed could also have contributed to the ageing of the Grootkolk population, with losses in young individuals because of trampling and browsing by herbivores and occasional toppling and breaking of larger trees by wind. Likewise, insects and rodents that impact on the seed pool may be more numerous in the riverbed habitat (Steenkamp et al. 2008). Furthermore, competition from a well-established grass layer may inhibit tree seedling establishment and growth in the riverbed (Steenkamp et al. 2008); however, this was not evident at the Grootkolk site. Fire also significantly impacts V. erioloba populations. After good rainfall, sufficient fuel accumulates and enables fire to spread through the landscape. In general, up to one-third of individuals in an area that experiences a fire are killed by the fire, with most of the individuals subsequently resprouting from the base (Van der Walt & Le Riche 1984). Large old trees, especially those with hollow stems, are most sensitive to fire (Milton & Dean 1995). During the study period, fire only occurred at the Dankbaar study site (large fires in 1995 and 2012). No tree mortality resulting from the fire was evident at the site; however, three of the individuals displayed coppiced growth subsequent to fire. Vachellia erioloba population dynamics differed at the two study sites over the last 38 years. Considering all tree mortalities and recruitments, the Dankbaar population can be considered a self-sustaining population with an increase of 12 new individuals (net increase of six trees) at the site over the 38-year period. The density (number of individuals per the 1 ha plot) of the Grootkolk population is declining and the size classes of the remaining individuals increasing as the population ages. Conclusions and management implications There is growing concern that mortality rates in V. erioloba, a keystone species of the Kalahari, are increasing as a result of threats such as increasing fire frequency, groundwater abstraction, competition from alien invasive species, diseases, harvesting and the effect of arboricides. This study in the KGNP provided an ideal opportunity to investigate V. erioloba dynamics in a natural environment, under different soil types and consequently water availability, where threats were negligible or absent. The different survey methods used at the two sites and alternative data analysis techniques have provided findings on the growth of individual trees as well as on population dynamics. Additionally, the study provided evidence that the population studied in the interior duneveld was self-sustaining and although the population in the Nossob riverbed was declining, new young populations were being established elsewhere in the riverbed (Steenkamp et al. 2008). The continued monitoring of the population at the two sites, where baseline data are already available, is highly recommended. However, monitoring sites should also be established at additional sites outside of park borders to incorporate sites in which various threats to this species can be investigated. It would also be imperative to determine growth rates in the riverbeds. Rainfall stations should be erected at all sites to enable the investigation of the influence of significant rainfall events and drought on seed germination, seedling survival and adult mortality. Acknowledgements The authors gratefully acknowledge the financial assistance of the University of Pretoria, Centre for Wildlife Management and the National Research Foundation (GUN 2053522, grant numbers 61277, 81089 and 91434). The numerous honours students in Wildlife Management and Botany are thanked for their assistance in the field. South African National Parks (SANParks) are thanked for the opportunity to conduct the research in the Kalahari Gemsbok National Park. The field surveys of 2016 were successfully conducted with the assistance of SANParks and South African Environmental Observation Network employees. The anonymous reviewers and editor are also thanked for their valuable contributions to this manuscript. Competing interests The authors declare that they have no financial or personal relationships that may have inappropriately influenced them in writing this article. Authors' contributions N.v.R. donated the data set to South African Environmental Observation Network. The authors provided financial and/or institutional support and conducted numerous field surveys over the years. H.v.d.M. and M.W.v.R. compiled the manuscript with valuable input from the remaining co-authors. Funding information Funding for this study was provided by the University of Pretoria, Centre for Wildlife Management and the National Research Foundation. References Barnes, M.E., 2001, 'Effects of large herbivores and fire on the regeneration of Acacia erioloba in Chobe National Park, Botswana', African Journal of Ecology 39, 340-350. https://doi.org/10.1046/j.1365-2028.2001.00325.x [ Links ] Cody, M.L., 2000, 'Slow-motion population dynamics in Mojave Desert perennial plants', Journal of Vegetation Science 11, 351-358. https://doi.org/10.2307/3236627 [ Links ] Condit, R., Sukumar, R., Hubbel, S. & Foster, R., 1998, 'Predicting population trends from size distributions: A direct test in a tropical tree community', American Naturalist 152, 495-509. https://doi.org/10.1086/286186 [ Links ] Everard, D.A., Midgley, J.J. & Van Wyk, G.F., 1994, 'Disturbance and the diversity of forests in Natal, South Africa: Lessons for their utilization', Strelitzia 1, 275-285. [ Links ] Gaugris, J.Y. & Van Rooyen, M.W., 2007, 'The structure and harvesting potential of the sand forest in Tshanini Game Reserve, South Africa', South African Journal of Botany 73, 611-622. https://doi.org/10.1016/j.sajb.2007.06.004 [ Links ] Gaugris, J.Y., Vasicek, C.A. & Van Rooyen, M.W., 2012, 'Herbivore and humans impact on woody species dynamics in Maputaland, South Africa', Forestry 4, 497-512. https://doi.org/10.1093/forestry/cps046 [ Links ] Gourlay, I.D., 1992, 'Age and growth rate determination of some African Acacia species', MSc dissertation, University of Oxford, London. [ Links ] Government Notice no. 1602, 2016, 'Notice of the list of protected tree species under the National Forests Act (1998) (Act no. 84 of 1998)', Government Printer, Republic of South Africa. [ Links ] Jeltsch, F., Moloney, K.A. & Milton, S.J., 1999, 'Detecting processes from snap-shot pattern - Lessons from tree spacing in the southern Kalahari', Oikos 85, 451-466. https://doi.org/10.2307/3546695 [ Links ] Lawley, V., Parrot, L., Lewis, M., Sinclair, R. & Ostendorf, B., 2013, 'Self-organization and complex dynamics of regenerating vegetation in an arid ecosystem: 82 years of recovery after grazing', Journal of Arid Environments 88, 156-164. https://doi.org/10.1016/j.jaridenv.2012.08.014 [ Links ] Leistner, O.A., 1967, 'The plant ecology of the southern Kalahari', Memoirs of the Botanical Survey of South Africa 38, 1-172. [ Links ] Lykke, A.M., 1998, 'Assessment of species composition change in savanna vegetation by means of woody plants' size class distributions and local information', Biodiversity and Conservation 7, 1261-1275. https://doi.org/10.1023/A:1008877819286 [ Links ] Malherbe, S.J., 1984, 'The geology of the Kalahari Gemsbok National Park', Koedoe 33-44. [ Links ] Menges, E.S., 2000, 'Population viability analyses in plants: Challenges and opportunities', Trends in Ecology & Evolution 15, 51-56. https://doi.org/10.1016/S0169-5347(99)01763-2 [ Links ] Midgley, J.J. & Bond, W.J., 2001, 'A synthesis of the demography of African Acacias', Journal of Tropical Ecology 17, 871-886. https://doi.org/10.1017/S026646740100164X [ Links ] Milton, S.J. & Dean, W.R.J., 1995, 'How useful is the keystone species concept, and can it be applied to Acacia erioloba in the Kalahari Desert?', Zeitschrift für Ökologie und Naturschutz 4, 147-156. [ Links ] Moustakas, A., Guenther, M., Wiegand, K., Mueller, K-H., Ward, D., Meyer, K.M. et al., 2006, 'Long-term mortality patterns of the deep-rooted Acacia erioloba: The middle class shall die!', Journal of Vegetation Science 17, 473-480. https://doi.org/10.1658/1100-9233(2006)17[473:LMPOTD]2.0.CO;2 [ Links ] Moustakas, A., Wiegand, K., Getzina, S., Ward, D., Meyer, K.M., Guenther, M. et al., 2008, 'Spacing patterns of an Acacia tree in the Kalahari over a 61-year period: How clumped becomes regular and vice versa', Acta oecologica 33, 355-364. https://doi.org/10.1016/j.actao.2008.01.008 [ Links ] Niklas, K.J., Midgley, J.J. & Rand, R.H., 2003, 'Tree size frequency distributions, plant diversity, age and community disturbance', Ecological Letters 6, 405-411. https://doi.org/10.1046/j.1461-0248.2003.00440.x [ Links ] Noy-Meir, I., 1973, 'Desert ecosystems: Environment and producers', Annual Review of Ecology and Systematics 4, 25-51. https://doi.org/10.1146/annurev.es.04.110173.000325 [ Links ] O'Connor, T.G., 1985, A synthesis of field experiments concerning the grass layer in the savanna regions of southern Africa, South African National Programmes Report No. 114, F.R.D., CSIR, Pretoria. [ Links ] Powell, E., 2005, What is happening to the camel thorns of Kathu?, Veld and Flora, Cape Town, pp. 34-35. [ Links ] Robertson, I. & Woodborne, S., 2002, Carbon isotopes confirm the competitive advantages of Prosopis over Acacia erioloba. Study of environmental change using isotope techniques, International Atomic Energy Agency, Vienna. IAEA-CSP-13/P. [ Links ] Schachtschneider, K. & February, E.C., 2013, 'Impact of Prosopis invasion on a keystone tree species in the Kalahari Desert', Plant Ecology 4, 597-605. https://doi.org/10.1007/s11258-013-0192-z [ Links ] Seymour, C., 2008, 'Grass, rainfall and herbivores as determinants of Acacia erioloba (Meyer) recruitment in an African Savanna', Plant Ecology 197, 131-138. https://doi.org/10.1007/s11258-007-9366-x [ Links ] Seymour, C.L. & Huyser, O., 2008, 'Fire and the demography of camelthorn (Acacia erioloba Meyer) in the southern Kalahari-evidence for a bonfire effect?', African Journal Ecology 46, 594-601. https://doi.org/10.1111/j.1365-2028.2007.00909.x [ Links ] Shadwell, E. & February, E., 2017, 'Effects of groundwater abstraction on two keystone tree species in an arid savanna national park', Peer J 5, e2923. https://doi.org/10.7717/peerj.2923 [ Links ] Silvertown, J. & Charlesworth, D., 2001, Introduction to plant population biology, 4th edn., Blackwell Science, Oxford, London. [ Links ] Slippers, B., Roux, J., Wingfield, M.J., Van der Walt, F.J.J., Jami, F., Mehl, J.W.M. et al., 2014, 'Confronting the constraints of morphological taxonomy in the Botryosphaeriales', Persoonia 33, 155-168. https://doi.org/10.3767/003158514X684780 [ Links ] Soil Classification Working Group, 1991, 'Soil classification: A taxonomic system for South Africa', Memoirs on the Agricultural Natural Resources of South Africa 15, 1-262. [ Links ] Stahle, D.W., Cleaveland, M.K., Haynes, G.A., Klimowicz, J., Ngwenya, P. & Mushove, P., 1996, 'Preliminary tree-ring investigations of indigenous trees in Zimbabwe', in P.T. Mushove, E.M. Shumba & F. Matose (eds.), Sustainable management of indigenous forests in the dry tropics. Proceedings of an International Conference in Kadoma, Zimbabwe, May 28-June 01, 1996, Zimbabwe Forestry Commission, Harare, pp. 57-61. [ Links ] Steenkamp, C.J., Vogel, J.C., Fuls, A., Van Rooyen, N. & Van Rooyen, M.W., 2008, 'Age determination of Acacia erioloba trees in the Kalahari', Journal of Arid Environments 72, 302-313. https://doi.org/10.1016/j.jaridenv.2007.07.015 [ Links ] Theron, G.K., Van Rooyen, N. & Van Rooyen, M.W., 1985, 'Vegetation structure and vitality in the lower Kuiseb', in B.J. Huntley (ed.), The Kuiseb environment: The development of a monitoring baseline, South African Scientific Programmes Report 106, pp. 81-91, Council for Scientific and Industrial Research, Pretoria. [ Links ] Van der Merwe, H. & Geldenhuys, C., 2017, 'Proposed long-term monitoring protocol and applications for Aloidendron dichotomum populations', South African Journal of Botany 109, 253-262. https://doi.org/10.1016/j.sajb.2017.01.008 [ Links ] Van der Walt, P.T &, Le Riche, E.A.N., 1984, 'The influence of veld fire on an Acacia erioloba community in the Kalahari Gemsbok National Park', Koedoe 103-106. [ Links ] Van Rooyen, T.H., 1984, 'The soils of the Kalahari Gemsbok National Park', Koedoe 27(suppl.) 45-61. https://doi.org/10.4102/koedoe.v27i2.568 [ Links ] Van Rooyen, M.W., Le Roux, A., Geldenhuys, C., Van Rooyen, N., Broodryk, N.L. & Van der Merwe, H., 2015, 'Long-term vegetation dynamics (40yr) in the Succulent Karoo, South Africa: Effects of rainfall and grazing', Applied Vegetation Science 18, 311-322. https://doi.org/10.1111/avsc.12150 [ Links ] Van Rooyen, N., Van Rensburg, D.J., Theron, G.K. & Bothma, J.d.P., 1984, 'A preliminary report on the dynamics of the vegetation of the Kalahari Gemsbok National Park', Koedoe 27(suppl.) 83-102. https://doi.org/10.4102/koedoe.v27i2.570 [ Links ] Van Rooyen, N. & Van Rooyen, M.W., 1998, 'Vegetation of the South-western arid Kalahari: An overview', Transactions of the Royal Society of South Africa 53, 113-140. https://doi.org/10.1080/00359199809520381 [ Links ] Van Rooyen, M.W., Van Rooyen, N., Bothma, J.d.P. & Van den Berg, H., 2008, 'Landscapes in the Kalahari Gemsbok National Park, South Africa', Koedoe 50, 99-112. https://doi.org/10.4102/koedoe.v50i1.154 [ Links ] Wiegand, K., Ward, D. & Saltz, D., 2005, 'Multi-scale patterns and bush encroachment in an arid savanna with a shallow soil layer', Journal of Vegetation Science 16, 311-320. https://doi.org/10.1111/j.1654-1103.2005.tb02369.x [ Links ] Zachariades, C., Hoffman, J.H. & Roberts, A.P., 2011, 'Biological control of Mesquite (Prosopis species) (Fabaceae) in South Africa', African Entomology 19, 402-415. https://doi.org/10.4001/003.019.0230 [ Links ] Received: 16 Mar. 2018 Appendix 1 SHORT COMMUNICATION Reproductive biology of the sausage tree (Kigelia africana) in Kruger National Park, South Africa Jah NamahI; Jeremy J. MidgleyI; Laurence M. KrugerI, II IDepartment of Biological Sciences, University of Cape Town, Cape Town, South Africa ABSTRACT Kigelia africana has large flowers that are vertebrate pollinated and very large fruits that are likely to be vertebrate dispersed. Our field surveys of size-class distributions of K. africana in the southern Kruger National Park (KNP) suggest a lack of recruitment. This is possibly the result of a failure of mutualistic relationships with vertebrate dispersers and/or pollinators. Breeding system experiments indicated that K. africana is an obligate out-crosser. Despite being primarily adapted for bat pollination, in KNP that K. africana is presently mainly pollinated by a diversity of largely facultatively nectarivorous bird species. Fruit-set is high, although trees isolated by > 50 m were found to suffer depressed seed output. Our preliminary investigation of dispersal suggests that fruits are largely ignored and are thus weakly attractive to potential dispersers. Seedlings placed out in the field in KNP suffered high levels (> 50%) of mortality compared to 17.5% in control plots. This threefold difference is the result of herbivory over a 2-month period. In summary, the adult centric population structure is probably not because of pollen or seed limitation but may result from dispersal limitation or excessive herbivory. Keywords: mutualisms; pollination; dispersal; Kigelia; sausage tree. Introduction The maintenance of mutualistic plant-animal interactions in and outside of conservation areas such as the Kruger National Park (KNP) has received relatively little attention compared to that devoted to disturbance by fire or herbivory. As an example, Midgley, Gallaher and Kruger (2012) and Midgley et al. (2015) recently argued that in KNP, elephants and squirrels are crucial to the dispersal and germination of marula (Sclerocarya birrea) and elephants are crucial for the dispersal and germination of torchwood (Balanites maughamii). Previously, Chapman, Chapman and Wrangham et al. (1992) argued for the importance of elephant dispersal of Balanites wilsoniana in Central Africa. Thus, the recruitment biology of certain trees in conservation areas would be threatened by the absence or decline of their elephant mutualists, for instance, through poaching for ivory. Another species that appears to be particularly dependent on vertebrate pollination and dispersal mutualists is the iconic sausage tree, Kigelia africana (Bignoniaceae). This species has exceptionally large, wine-coloured flowers and large, sausage-shaped fruits that can grow > 0.5 m long and weigh several kilograms. Despite its apparent reliance on vertebrate mutualists, its reproductive biology (from flower to seedling) and relation to its demography has been poorly researched. Kigelia africana flowers are considered to be chiropterophilous because they are large and open, robust and have a weak, unpleasant smell (Baker 1961). Flowers are visited by bats in some areas such as West Africa (Harris & Baker 1958; Pettersson, Ervik & Knudsen 2004), but there is no published evidence to date that they are visited by bats in Southern Africa (Johnson 2004), nor whether they require visits from pollinators to ensure seed-set. Although self-pollination is rare in the Bignoniaceae (e.g. Bertin, Barnes & Guttman 1989; Gentry, 1974), it remains to be seen whether selfing occurs in K. africana. In addition to potential pollinator or lack of out-crossed pollen impacts on seed-set, seed dispersal limitation or excessive seedling herbivory could also impact the reproductive biology of K. africana. There have been no published studies on the dispersal of the sausage tree, despite popular speculations such as dispersal by a large diversity of vertebrates including rodents, mega-herbivores, primates and birds (Wikipedia 2017). Ansell (1965) reported the presence of K. africana seeds in the stomachs of 7 out of 10 hippopotamus in Zambia. This would be compatible with the tree's riverine distribution but not with the well-known grass-herb diet of hippos. Based on his dietary analysis, Field (1970) found Ansell's (1965) observation unusual, in part because 'the hippo is ill-equipped to feed on these fruits'. However, because the seeds are soft and embedded in the fruits, it is possible that more seeds would survive hippo ingestion than ingestion by other animals such as ungulates or baboons. In addition, because the fruits do not float (Laurence Kruger, personal observation [pers. obs.]), it is likely that they do need a disperser. The final step of recruitment is seedling establishment and again there have been few studies of herbivory rates on K. africana to determine whether it is relatively palatable. The aim of this study was to consider the reproductive biology of this species, from flowering to seedling recruitment, in the context of its overall demography within an area of the KNP. Materials and methods Because K. africana grows mostly in riverine systems, demographic surveys were conducted along three rivers (N'waswitsontso, Sabie and N'waswitshaka) close to Skukuza in the KNP (see Figure 1). Sampling was conducted between October 2012 and December 2012. The pollination and breeding system experiments were conducted inside or close to Skukuza Village. Demography To determine size-class distributions, we used 10 stratified 500 m × 50 m transects on each of three riverbanks (see Figure 1), where we noted the diameter at breast height (dbh, 1.3 m) of each tree. The diameter of the smaller trees (< 1.3 m in height) was taken at the base. To determine whether elephants negatively impact K. africana, we noted the presence of elephant damage to the stem (as the estimated percentage of stem circumference damaged). We also counted the number of fruits per individual tree. The latter measurement concerns the previous year's seed-set. Because individual trees may be tall and are not easily climbed, we estimated total numbers of fruits in groups of five when the number of fruits exceeded 20. In out-crossing species, isolated individuals may suffer depressed seed-set because of pollen limitation. We therefore also measured the distance in metres to the nearest mature conspecific individual using a range finder. Reproductive biology Pollination studies were conducted in Skukuza Village for safety reasons because many flowers needed to be observed, bagged or unbagged before dawn or after dusk. We expected fruit bats (especially Wahlberg's epauletted fruit bat, Epomophorus wahlbergi) to be the pollinator. These bats are widely observed roosting and feeding within Skukuza (Laurence Kruger, pers. obs.). Kigelia africana has a bilobed stigma, and the lobes are separate when the flower opens. As flowers only last one night (see below), we assumed that after the stigma lobes separate, the stigma is receptive. This was confirmed by seed-set results (see below). Freshly opened flowers from nine different trees (3-10 flowers per tree, depending on flower availability) in Skukuza were measured to quantify the nectar content and the timing of secretion. Buds were bagged before sampling, and freshly opened flowers were sampled at both dusk (n = 60) and dawn (n = 62) from all nine trees. We used a syringe to remove and measure the nectar. The sucrose equivalent concentration of the removed nectar was measured using an Eclipse refractometer. To determine floral visitors, we also put up eight motion-sensitive camera traps (Little Acorn TM1550): five in three sausage trees in Skukuza and three in two sausage trees in the more natural area of the nearby Tinga area (see Figure 1) from 20 September to 05 October 2012. The cameras were focused on opened inflorescences and the footage was checked every day, before refocusing the camera traps on newly opened flowers. We also observed individual trees in Skukuza Village for visitation, both in the evenings and at dawn, during the period September through October 2012. To determine the impacts of various pollinators on fruit sets, bags from bagged flowers from 13 individual trees were opened and closed at specific times and with all four treatments (nocturnal, diurnal, open-pollination and total exclusion) being applied to all trees. These experiments were conducted within Skukuza Village from 24 September to 04 October 2012. To estimate the role of both diurnal (birds and mammals) and nocturnal pollinators (bats and galago species), bagged flowers were opened for a day or a night. To assess the contribution of birds to pollination, 150 bagged flowers were opened at dawn and left for 1 h, after which they were all rebagged. To estimate the role of nocturnal animals, 150 bagged flowers were opened at dusk and were all rebagged 1 h before dawn. To determine the impacts of total pollinator exclusion, 123 flowers were bagged in bud and remained bagged for 5 weeks, and 150 control flowers were open all day and all night. After the 5-week period, we visited the 13 trees and counted the number of developing fruits. As a further test of the role of birds, we determined whether pollen was actually transferred to flowers after visitation by birds. We bagged buds on three trees; on the following day, these bags were opened between 03:30 and 05:30 (at dawn) and the flowers were observed. Those flowers that were observed to have been visited by any bird specie were later examined for the presence of conspecific pollen on the stigma. To determine the breeding system, we bagged flower buds from 11 different trees from 01 October to 04 October 2012. Three treatments (crossed = 102 flowers, selfed = 102 and autogamy = 103) were applied to all trees and flowers rebagged following treatment. After the flowers opened and the stigma lobes separated, we applied cross or self-pollen to a set of 5-10 flowers per tree, using a fine paintbrush to remove pollen and place it on stigmas. The brush was cleaned and washed between each use to avoid contamination. To assess autogamy, flowers were bagged without any further manipulation. We revisited these 11 trees on 21 November 2012 to determine the number of developing fruits. Herbivory To determine whether herbivores are attracted to K. africana and, if so, what the levels of seedling herbivory are, we produced a number of seedlings. To do this in October 2012, 500 seeds were extracted from freshly fallen sausage fruits and planted in paper cups (see Figure 2a). The 483 seedlings that germinated (97% germination rate) were grown and hardened in the nursery at Skukuza for 7 weeks (see Figure 2b). Thereafter, 420 seedlings were planted into savanna vegetation in groups of 10 per plot (plot = 25 cm × 25 cm) (see Figure 2c). Eight plots (total n = 80 seedlings) were planted in savanna vegetation outside Skukuza Village where they were accessible to all herbivores, including mega-herbivores such as elephants. Eight plots were planted in savanna vegetation inside Skukuza Village, where mega-herbivores are largely excluded. However, the seedlings were accessible to ungulate herbivores such as impala. As controls for these two treatments, eight matched plots were planted outside and inside the village and in this case seedlings were protected by wire enclosures, where no mammalian herbivores could access the seedlings apart from insects (see Figure 2d). Finally, 10 plots were planted inside a partial herbivore enclosure in the village, where only very small animals such as rodents and insects had access. The planted seedlings were left for 2 months and in January 2013 we counted the number of live seedlings. The difference between control plots and herbivore exclusion plots indicates the role of large herbivores in seedling mortality. Seed dispersal We collected fallen sausage fruits and placed them in groups of three to five fruits at the base of seven adult sausage trees in undisturbed areas to attract any potential disperser. Four cameras were each focused on a fruit pile near Skukuza and three cameras near Tinga (see Figure 1). The cameras were deployed continuously for 3 months from November 2012 to January 2013. The fruit piles were then checked for removal at the end of the research. Although no fruits were removed, the footage was also inspected to determine whether any mammals inspected the fruit. Results Demography For the demographic survey, a total of 151 sausage trees were noted, with diameters ranging from 0.9 cm to 170 cm. We found the distribution of large individuals similarly biased on the three riverbanks. On N'waswitsontso, the ratio of recruitment (< 15 cm dbh): intermediate (> 15 cm and < 30 cm dbh), large (> 30 cm dbh) was 8:14:100 (n = 122), whereas on Sabie it was 0:1:25 (n = 26), with no recruits and 0:0:3 on N'waswitshaka (n = 3). The preponderance of large trees is demonstrated by the fact that of the 85% of trees that are > 30 cm dbh, 87% of these are > 100 cm dbh. Only 22.5% of the individuals were found to have elephant bark-stripping marks on them, and because these were largely minor, the average percentage damage across all stems was very low (< 1%). No trees were found to have been uprooted by the elephants. Some canopy trees were found to have been toppled over because of flooding. Most of these toppled trees were found to resprout strongly. Reproductive biology Of the 770 flowers used in the pollination experiments, 96.4% lasted only one night before the corolla dropped off, while the remaining 28 flowers persisted for two nights. All the flowers opened only slightly before, at or after dusk. When the corolla opened, nectar was present and both lobes of the bilobed stigma were separate. The stigma lobes closed or at least partially closed within 5 min - 15 min of being brushed with pollen. All the selfed flowers separated their stigma lobes again within an hour. Kigelia africana is an obligate out-crosser; no fruit formed when the flower was selfed or bagged (autonomous autogomy), whereas 81 of the 102 flowers that were crossed developed fruits. The average amount of nectar in bagged flowers measured at dusk just after they had opened was high (52.8 mL, s.d. = 14.2, n = 62), while the average in those measured at dawn after a night of having been opened but still bagged was low (14.8 mL, s.d. = 7.1, n = 60). We suspect this difference was because of a spillage of nectar (many bags had nectar on the bags and signs of damage to bags) by birds attempting to get at the nectar, rather than the reabsorption of nectar. The nectar had an average concentration of 15.9% (s.d. = 3.2) sucrose equivalent in the morning and 14.8% at dusk (s.d. = 3.2). Pollinators We identified 12 different bird species visiting the flowers, and 10 of these species were observed feeding on the nectar (see Table 1 and Figure 3). We noted as many as 15 different bird visitations to a single flower during a 1-h observation period. Out of 90 marked flowers observed to have been visited by birds in a 1-h period, 70% were later found to have pollen on their stigma, and only one flower had a missing stigma. This indicates that bird visitation causes pollen flow. Many flowers had major corolla lacerations such as large holes and ripped petals, presumably from bird claws. The camera footage captured several pollinators that were not directly observed. Table 2 summarises the potential pollinators observed (through cameras and direct observation) in the act of visiting the flowers as well as whether or not they fed on nectar (see Figure 3b-f). Bees were observed entering flowers to obtain nectar, but they were not perceived as potential pollinators as they did not touch the stigma. Neither during casual observations nor on camera were bats observed visiting flowers and we did not observe bat fur on stigmas. Of the 150 control flowers open during both the night and subsequent morning to all pollinators, 54.3% set fruits, whereas for those open during the day for birds and those open at night, these values were 42.5% and 6.3%, respectively. This nearly sevenfold difference indicates that birds are clearly the most important pollinating agents. Because we observed high bird attendance at flowers, the difference between the 80% of experimentally crossed flowers that set fruit, compared to only 54.3% of open flowers setting fruit, suggests that out-crossed pollen may be limiting. The minimum size for sexual maturity judged by the presence of fruits was 16.75 cm dbh. The maximum number of fruits per tree was 225, with 35% of the 151 trees producing 100 or more fruits. However, none of the 30 individual trees greater than 16.75 cm dbh but more than 45 m from another individual produced any fruits. Herbivory Over a 2-month period, mean mortality of K. africana seedlings was 17.5% in the control enclosures. This is more likely because of insect herbivores than because of drought as the experiment took place during the moist summer period. Mortality was 49.6% where all herbivores were present, suggesting this species is attractive to herbivores. The dominant herbivores were probably small herbivores (64.6% mortality) rather than ungulates (31.7% mortality). Dispersal No fruits were taken and, despite analysing a total of 30.2 h of video footage from the camera traps, we found no animals seriously encountering the fruits, although we did see elephants occasionally sniffing at, but ignoring, them. Discussion Despite a generous definition of a recruit (< 15 cm dbh), recruits were few and were only found on one of the three rivers sampled. The widespread presence of fruits, except on isolated trees, and the many tens of easily germinating seeds per fruit yet a general lack of small plants suggests a recruitment bottleneck. Whether this bottleneck is a result of abiotic factors (such as episodic wet periods) or biotic factors (such as low hippopotamus populations) needs further research. Although the fruits are large, our analysis found that they are relatively unattractive to most large herbivore dispersers, at least during summer. Although our germination rates of untreated seeds were high, this applies to seeds removed from fruits. Given the hard skin of the fruits and the soft nature of the seeds, it is unlikely that germination would take place in intact, undispersed, dried-out fruits. Similarly, we suspect that the soft seeds would not survive mastication by ungulates or elephants. Thus, germination initiation and dispersal limitation may be a part of the recruitment bottleneck, and dispersal experiments targeted at hippos would be valuable. Seedling herbivory is intense and could also be an important key to the 'missing' juvenile-size classes. However, at least at this stage, it cannot be argued that herbivory is excessive (i.e. more than could be reasonably expected). If it were shown that higher recruitment levels resulting from better seed dispersal were associated with disproportionately more seedlings escaping herbivory, then dispersal failure might explain the low recruitment. There are several indications that this species is an obligate out-crosser. Selfing resulted in zero fruit development; the stigma lobes reseparated after selfed pollen was placed on them, and isolated trees set few fruits. In addition, the style is longer than the anthers and this prevents pollen passively arriving on the stigma. Despite K. africana being an out-crosser and ostensibly bat-pollinated, in KNP it is heavily visited and successfully pollinated by generalist diurnal birds rather than nocturnal mammals. It is well known that not all bird-pollinated plants are pollinated by specialist nectarivores, such as sunbirds and hummingbirds (e.g. Johnson & Nicholson 2008). The situation with K. africana is different in that it has many bat-pollinated (not bird-pollinated) traits such as large, open, night-time opening flowers. Nevertheless, large amounts of sugary nectar that is easily accessible attract a diversity of diurnal vertebrate visitors to the flowers. Thus, surprisingly, a breakdown in bat pollination has probably not been an important factor in determining the skewed demography. Whether aspects of global change will negatively impact plant-animal interactions, and thus plant extinction, in nature reserves it is a complex question. For instance, this depends on how persistent the plants are and whether other mutualists can replace lost mutualisms, such as generalist birds having replaced bats as pollinators of K. africana in KNP. Some plants have survived long-term failed interactions (i.e. anachronistic mutualisms), such as where large animals were extinguished by expanding human populations (Janzen & Martin 1982). Survival of these anachronistic plants can result from the plants being highly persistent (sensu Bond & Midgley 2001) and in other cases if dispersal is rescued by domestic animals (Janzen & Martin 1982). We noted that toppled K. africana can resprout and therefore the species has a degree of persistence. Further work is needed on the dispersal of K. africana in other areas to determine its reliance on ingestion and dispersal for recruitment and local impacts of herbivores. Acknowledgements The authors thank SANParks for permission to work in KNP and the National Research Foundation for funding provided to J. Midgley. Competing interests The authors declare that they have no financial or personal relationships that may have inappropriately influenced them in writing this article. Authors' contributions J.J.M. designed this master's project and supervised the analyses and write-up. J.N. did all the fieldwork, analyses and writing. L.M.K. supervised and participated in the fieldwork. Funding information Funding for this study was provided by the National Research Foundation. References Ansell, W.F.H., 1965, 'Feeding habits of Hippopotamus amphibious Linn', Puka 3, 171. [ Links ] Baker, H.G., 1961, 'The adaptation of flowering plants to nocturnal and crepuscular pollinators', The Quarterly Review of Biology 36, 64-73. https://doi.org/10.1086/403276 [ Links ] Bertin, I.R., Barnes, C. & Guttman, I.S., 1989, 'Self-sterility and cryptic self-fertility in Campsis radicans (Bignoniaceae)', Botanical Gazette 150, 397-403. https://doi.org/10.1086/337785 [ Links ] Bond, J.W. & Midgley, J.J., 2001, 'Ecology of sprouting in woody plants: The persistence niche', Trends in Ecology and Evolution 16(1), 45-51. https://doi.org/10.1016/S0169-5347(00)02033-4 [ Links ] Chapman, L.J., Chapman, C.A. & Wrangham, R.W, 1992, 'Balanites wilsoniana: Elephant dependent dispersal?', Journal of Tropical Ecology 8(3), 275-283. https://doi.org/10.1017/S0266467400006519 [ Links ] Field, C.R., 1970, 'A study of the feeding habits of the hippopotamus (Hippopotamus amphibius Linn.) in the Queen Elizabeth National Park, Uganda, with some management implications', Zoologica Africana 5, 71-86. https://doi.org/10.1080/00445096.1970.11447382 [ Links ] Gentry, H.A., 1974, 'Coevolutionary patterns in Central American Bignoniaceae', Annals of the Missouri Botanical Garden 61, 728-759. https://doi.org/10.2307/2395026 [ Links ] Harris, B.J. & Baker, H.G., 1958, 'Pollination in Kigelia africana Benth', Journal of the West African Science Association 4, 25-30. [ Links ] Janzen, D.H. & Martin, P.S., 1982, 'Neotropical anachronisms: The fruits the gomphotheres ate', Science 215, 19-27. https://doi.org/10.1126/science.215.4528.19 [ Links ] Johnson, S.D., 2004, 'An overview of plant-pollinator relationships in southern Africa', International Journal of Tropical Insect Science 24, 45-54. https://doi.org/10.1079/IJT20043 [ Links ] Johnson, S.D. & Nicholson, S.W., 2008, 'Evolutionary associations between nectar properties and specificity in bird pollination systems', Biology Letters 4, 49-52. https://doi.org/10.1098/rsbl.2007.0496 [ Links ] Midgley, J.J., Gallaher, K. & Kruger, L.M., 2012. 'The role of the elephant (Loxodonta africana) and the tree squirrel (Paraxerus cepapi) in marula (Sclerocarya birrea) seed predation, dispersal and germination', Journal of Tropical Ecology 28, 227-231. https://doi.org/10.1017/S0266467411000654 [ Links ] Midgley, J.J., Kruger, L.M., Viljoen, S., Bijl, A. & Steenhuisen, S.-L., 2015, 'Fruit and seed traits of the elephant-dispersed African savanna plant Balanites maughamii', Journal of Tropical Ecology 31, 557-561. https://doi.org/10.1017/S0266467415000437 [ Links ] Pettersson, S., Ervik, F. & Knudsen, T.J., 2004, 'Floral scent of bat-pollinated species: West Africa vs. the new world', Biological Journal of the Linnean Society 82, 161-168. https://doi.org/10.1111/j.1095-8312.2004.00317.x [ Links ] Received: 11 Dec. 2017 ESSAY Koedoe: African Protected Area Conservation and Science - A retrospection: 1958 to 2018 Jane CarruthersI, II; Llewellyn C. FoxcroftII, III IDepartment of History, University of South Africa, Pretoria, South Africa ABSTRACT In 2018, Koedoe celebrated an unbroken publication record of 60 years. From uncertain beginnings in 1958, it is now a mature and important internationally recognised scientific journal focussing on conservation and science in national parks in South Africa and beyond into the African continent. After an overview of the emergence of national parks in the 20th century, this retrospective essay reflects on Koedoe's long and significant contribution to the field of national parks research and management. We identify and make easily available some of the seminal and influential articles that have appeared in the journal over this long time span. Principally relating to matters in national parks in South Africa, these articles (some coming from special issues of Koedoe) have been chosen for their variety as well as for the broader perspectives they open into the longer trajectory of national park conservation and management. Articles illustrate the evolution of paradigms from protectionist and species centric, to ecosystem focus, to complex socio-ecological systems and adaptive management. Conservationists, scientists and managers alike will benefit from an understanding of the transformations in their field over six decades together with appreciating the importance and usefulness of unpacking the intellectual journey of national park science in order to contextualise and enrich - even encourage and direct - present and future research. Keywords: biodiversity conservation; conservation journals; conservation science; ecology; environmental history; environmental science; South African National Parks. Introduction An anniversary is conventionally an occasion on which to celebrate, but it is also a time for reflection and for taking stock. The 60th anniversary of the publication record of the journal Koedoe: African Protected Area Conservation and Science is no exception. After six decades, Koedoe is a mature and important journal. For this commemorative retrospective issue we have decided to republish a number of papers on seminal work from the distant and more recent past that give a small taste of the contribution that Koedoe has made to the literature over 60 years. We also hope that this will tempt readers to turn to other articles in order to follow long-term threads in their own disciplines - as well as others - so as to appreciate how patterns have emerged and paradigms and priorities have changed. All too often science in the past is forgotten, or ignored, while some of the key work that has laid the foundation for future scientific endeavours lies in the rich knowledge accumulated over many decades. The 1950s were important in the history of national parks worldwide (Carruthers 2017), and the remarkable longevity of Koedoe is a tribute to the enthusiasm of biologists during that decade in South Africa. In 1958, it was a novelty - indeed a very bold step - to publish any research conducted in a national parks organisation, and it is greatly to the credit of South African National Parks (SANParks) that support for Koedoe has never wavered. National parks have a pedigree dating back to the 19th and early 20th centuries. However, it was only after World War II that, together with a rash of other institutions designed to herald a new era, the International Union for the Protection of Nature (IUPN) was founded at a meeting on 05 October 1948 at Fontainebleau, France, under the auspices of UNESCO (IUPN 1948). No delegate from southern Africa was present at that event, but before long there was strong engagement from the subcontinent. Throughout the 1950s and, indeed, beyond and into the present, South Africans - some affiliated to the National Parks Board (NPB), renamed SANParks in 1996 - played a role in shaping many of the International Union for the Conservation of Nature and Natural Resources' (IUCN) initiatives and policies as they carved a reputation for national park science at home. In 1958 at the 6th General Assembly in Athens, the International Union for the Conservation of Nature and Natural Resources (IUCN, to which the IUPN changed its name in 1956; IUCN 1956) established a Provisional Commission on National Parks (Resolution 247), planned regular world congresses and decided to compile a list of the world's national parks. Interestingly, however, there was then no mention of defining a national park or any other protected area, although this, together with other bureaucratic steps, was to come in time. A number of South Africans at the Athens meeting participated in a variety of committees; among them were Rocco Knobel, Director of the NPB, who was elected to the Executive Board, and his colleague, R.J. Labuschagne. Representatives of the Transvaal and Natal conservation authorities were also active. The minutes record discussion on the importance of scientific, especially ecological, research in matters relating to conservation (IUCN 1960). Within Africa, in 1953, the Bukavu conference of the IUPN had prioritised the protection of the fauna and flora of the continent. Importantly too, glimpses of the emerging disciplines of conservation science and, indeed the explosions of the environmental era, were increasingly visible in the 1950s. This was evident in South Africa, for example, with the introduction of various environmental or nature and wildlife conservation-oriented courses at universities, the establishment of the Percy Fitzpatrick Institute of African Ornithology (1959) and the Zoological Society of Southern Africa (1958). South African National Parks were in the vanguard of these developments with the establishment of the Biology Section of the Kruger National Park (KNP) in 1951. After a bruising internal commission of enquiry in 1952, and the consequent professionalisation of the NPB, stable management was critical to future scientific endeavour (Carruthers 2017). It was into this wider scientific and organisational environment that the first issue of Koedoe appeared as an annual journal. Koedoe, which is the Afrikaans name for Tragelaphus strepsiceros, 'kudu' in English, had become the emblem of the NPB in 1955. There was an English subtitle - the journal was bilingual - Journal for Scientific Research in the National Parks of the Union of South Africa (in Afrikaans, Tydskrif vir Wetenskaplike Navorsing in die Nasionale Parke van die Unie van Suid-Afrika). It is a matter of regret that there was no initial foreword or editor's message to explain exactly what Koedoe aimed to accomplish, and who the intended readership might be. National Parks Board liaison officer N.J. van der Merwe noted in 1962 that Koedoe was useful for exchanges and that the library in Skukuza had, by this means, received 92 scientific journals, 28 semi-scientific journals and 27 annual reports. This meant significant scientific material was available for research staff to use, thanks to the regular publication of Koedoe. A network had been established. The first issue of Koedoe was impressive, with articles about an expedition to the Lowveld from Mozambique in 1725, a list of mammals of the Mountain Zebra National Park, a mosquito survey and fire research in the KNP, hyena observations and seven articles on the animals of the Kalahari Gemsbok National Park (KGNP). Five contributions were in Afrikaans and eight in English. Only two, however, were by research staff in the employ of the NPB: A.M. Brynard (on conditions in the KGNP) and H.P. van der Schijff (fire research in the KNP). At the time, there were five national parks under the banner of the NPB: Kruger, Bontebok, Addo Elephant, Kalahari Gemsbok and Mountain Zebra, and the staff was very small; since then, the number of parks has grown to 19 and staff numbers have burgeoned. With the passing years Koedoe has become a highly respected, peer reviewed, open access academic journal of a kind that could never have been foreseen in the 1950s (Foxcroft 2008; Foxcroft & Herbst 2017). The credibility of Koedoe was further strengthened in 2013 when Koedoe received its first impact factor of 1.48, fluctuating to the current rating of 0.9 (Clavariate Analytics Journal Citation Reports). Moreover, although Koedoe has always welcomed contributions beyond national parks, its current subtitle African Protected Area Conservation and Science reflects its formally changed focus to cover the entire continent and all kinds of protected areas, not only national parks and not only about South Africa. Not surprisingly, the content of Koedoe has varied enormously in scope and quality since 1958: there have been substantial articles and extensive lists but also, often, short pieces of a page or two about an unusual sighting or a new record. Naturally, as a largely in-house journal until recently, the interest, importance, topicality or institutional relevance of an article has sometimes exceeded the value of the research it communicated. In addition, although research articles were mostly reviewed, professional, rigorous, peer review was not the requisite that it is now. Nonetheless, one must emphasise the novelty and importance of such an interdisciplinary research journal, as well as its pioneering role in providing a platform for disseminating the knowledge generated in or about national parks in our country. As a record of a long period of locality-based research, Koedoe is an incomparably rich resource, and it records the names of the most eminent scientists in South African national park science, both within SANParks and outside it. The short selection of just more than a dozen past articles included in this celebratory issue is, naturally, subjective, perhaps idiosyncratic. It was no easy task to decide what to include from the more than 1250 articles - for Koedoe is brim-full of interesting contributions, all of which have a point to make. However, we have focused on some of those that, in our view, capture changes in the emphasis, or type, of scientific research conducted in South Africa's national parks and the philosophy that underpinned research and management (see Figure 1). We have also sought out different disciplines and tried to convey a little of the variety of national parks that have been highlighted in Koedoe since 1958. In addition, we want to flag special issues of Koedoe, the contents of which examine a topic or national park in detail and that are certainly worth revisiting, even re-enacting. The earliest was in 1977, 'Proceedings of the symposium, "The state of nature conservation in southern Africa"', held to commemorate the 50th anniversary of the South African National Parks Act of 1926. The meeting was a large affair held in the KNP with about 200 delegates, of whom some 18 were black Africans, and there was one lone woman. Many parts of southern Africa had a presence, including Swaziland, Rhodesia, Lesotho and Botswana, as well as QwaQwa, Lebowa, 'Vendaland', 'Zululand', Ciskei and other 'self-governing' states in South Africa. The proceedings encompassed wilderness, education, private nature reserves, the status of nature conservation in various states and regions, tourism, marine parks, and botanical and zoological gardens. The 1977 symposium was path-breaking in including landscape planning as part of the general brief for protected areas, as was a call from the director of the newly established Department of Planning and the Environment, who urged national park authorities to work with all the other state departments so that nature conservation would become part of a coordinated national system of land-use planning. Of the many contributions to the 1977 symposium, one of the few to deal explicitly with research was U. de V. (Tol) Pienaar's (1977) 'Research objectives in South African National Parks'. For this reason, and as Pienaar was one of the foremost scientists and managers of the NPB, becoming warden of the KPN and later chief director of the NPB, it has a place in our selection. Pienaar (1977) ventured that: … the primary objectives of any research program in our national parks should therefore be a study of ecosystems and their interrelationships, with the objective of supplying the managerial basis for maintaining optimum conditions within the ecosystems, without endangering the interdependency of the components or the quality of the environment. (p. 39) The occasion recorded in Koedoe 1977 served as a mirror of the southern African nature conservation community at that time, and perhaps an analogous meeting for our era should be put on the agenda, given the immensity of the environmental, scientific and political changes since the 1970s and the challenges that confront the conservation science community in the 21st century. (Pienaar, U.d.V., 1977, 'Research objectives in South African National Parks', in Proceedings of a symposium on the state of nature conservation in southern Africa, Kruger National Park, 1976, G. de Graaff & P.T. van der Walt (eds.), supplement, Koedoe 20(2), 38-48. https://doi.org/10.4102/koedoe.v20i2.1266) A decade later, in 1986, another article in Koedoe also dealt with the wider principles of national park science. The author was Salomon Joubert, who was later to become warden of the KNP. In 'Management and research in relation to ecosystems of the Kruger National Park', Joubert (1986) maintained the KNP's commitment to preserving and perpetuating ecosystems. This was to be done because these 'living organisms' (biodiversity only entered the lexicon of Koedoe in 1995) counteracted the depletion of natural resources and provided recreational facilities for 'modern day technological man'. Management options were to be guided by the 'minimum intervention' principle, although other than emphasising monitoring, precisely how and when such intervention might be scientifically determined was left unstated. (Joubert, S.C.J., 1986, 'Management and research in relation to ecosystems of the Kruger National Park', Koedoe 29, 157-163. https://doi.org/10.4102/koedoe.v29i1.528) The increasing complexity of national park science was aired in an important special issue in 2011. By then the time had arrived - somewhat haltingly - for an entirely new approach to science and management in South Africa's national parks. As the old guard left with changes to the country in 1994, and many staff and board retirements coincided, a new generation of scientists and managers proved ready to strike out in a new direction. That change was made especially noticeable through the adoption of strategic adaptive management (SAM), in place of the command and control paradigm that had been introduced in the 1960s. Terminology began to change from 'national parks' and 'ecosystems' to be replaced by 'protected areas' and 'complex social ecological systems'. The 2011 special issue of Koedoe gave considerable attention to dissecting SAM, and we reproduce here the introduction to the volume by Dirk Roux and Llewellyn Foxcroft (2011). (Roux, D.J. & Foxcroft, L.C., 2011, 'The development and application of strategic adaptive management within South African National Parks', Koedoe 53(2), 5 pages. https://doi.org/10.4102/koedoe.v53i2.1049) Two other Koedoe special issues are also worth noting. In 1983 a symposium was held in Pretoria on the Kalahari ecosystem, and the voluminous proceedings were published the following year. The profile of the KGNP has faded in recent years, but it was once extremely high in NPB research circles, and the idea of an ecosystem-wide research think tank is certainly a worthwhile project even now. The large 1983 meeting was a tribute to Dr F.C. (Fritz) Eloff, chairman of the NPB since 1979 and soon to retire as professor of Zoology at the University of Pretoria. Eloff had taken a close interest in the lions of the KGNP and became a consultant for the Cat Specialist Group as well as for the Survival Service Commission (later renamed the 'Species Survival Commission') of the IUCN. The contents of this special issue were wide-ranging and included articles on geology and soil; water resources and vegetation; fire; mammal, bird and invertebrate studies; as well as a list of relevant publications on the KGNP. As Anthony Hall-Martin (1984) pointed out in his conclusion, the symposium and the publication provided a welcome synthesis of the state of knowledge about the KGNP, while also identifying important gaps. (Hall-Martin, A.J., 1984, 'Symposium on the Kalahari ecosystem: Summary and conclusions', in 'Proceedings of a Symposium on the Kalahari Ecosystem 1983', eds G. de Graaff and D.J. van Rensburg, supplement, Koedoe, 327-333. https://doi.org/10.4102/koedoe.v27i2.589) The second special issue that opens a window into national park science is more recent - 2014. Edited by Stephen McCool and Anna Spenceley (2014), two members of the IUCN's Tourism and Protected Areas Specialist Group, World Commission on Protected Areas, this highlighted the importance of tourism, as a research science, to aid funding and capacity-building. It further emphasised the importance of national parks to local communities and local and international visitors. The introductory article, 'Tourism and protected areas: A growing nexus of challenge and opportunity', is reproduced here. One article in the issue is of particular importance to South Africa, and it is pleasing to see the wide range of international case studies that are presented. (McCool, S. and Spenceley, A., 2014, 'Tourism and protected areas: A growing nexus of challenge and opportunity', in McCool, S. & Spenceley, A., eds, 'Tourism and protected areas: A growing nexus of challenge and opportunity', Koedoe 56(2), Art. #1221, 2 pages. https://dx.doi.org/10.4102/koedoe.v56i2.1221) South African National Parks were once well known (and vilified) internationally for policies that manipulated the environment, provided water, fresh seasonal grazing thanks to a regulated fire regime and that aimed to keep large mammal populations at predetermined annual levels. Koedoe appeared in the era when drugs and darting of wildlife became possible, and this soon became both refined and routine, enabling selected wild animals to be translocated and thus saved from extinction, to repopulate areas where they once occurred and to be culled. Between 1960 and 1990, Koedoe published nearly 20 articles on marking and darting, explaining the drugs applicable to certain species and their advantages and disadvantages. In preparation for the culling programme, Pienaar, van Wyk and Fairall (1966) published 'An aerial census of elephant and buffalo in the Kruger National Park and the implication thereof on intended management schemes' in Koedoe. Ending elephant culling was controversial and difficult as the Koedoe article by Whyte et al. (1999) explains. (Pienaar, U. de V., Van Wyk, P. & Fairall, N., 1966, 'An aerial census of elephant and buffalo in the Kruger National park and the implication thereof on intended management schemes', Koedoe 9, 40-107. https://doi.org/10.4102/koedoe.v9i1.781, and Whyte, I.J., Biggs, H.C., Gaylard, A. & Braack, L.E.O., 1999, 'A new policy for the management of the Kruger National Park elephant population', Koedoe 42(1), 111-32. https://doi.org/10.4102/koedoe.v42i1.228) The small group of scientists employed in the NPB, together with outside experts, generally invited, were diligent in publishing their work in Koedoe. It is not surprising that for at least the first 30 years, most articles dealt with individual species, of which mammal species were the most numerous by far. Other taxa were not, however, totally neglected: invertebrates, birds and fishes were included by way of checklists, surveys and species descriptions. Given the international focus on endangered animals, this listing of species and, where possible, recording their abundance or scarcity coincided with the initial publication of the IUCN Red Data Lists that began in 1964. A creative research article that brought together the elements of an ecosystem in a national park was that by Peter Novellie (1987). It has been influential, often cited, and is important for its relevance to an endangered species that NPB struggled for decades to preserve. (Novellie, P., 1987, 'Interrelationships between fire, grazing and grass cover at the Bontebok National Park', Koedoe 30, 1-17. https://doi.org/10.4102/koedoe.v30i1.498) Veld-burning (now called 'fire ecology') was given attention in the very first issue of Koedoe in 1958. In an extended article, Van der Schijff (1958) explained why regulated burning was necessary, using four veld types for his experiment. It is fascinating to compare his article with that 40 years later by van Wilgen, Biggs and Potgieter (1998). (Van der Schijff, H.P., 1958, 'Inleidende verslag oor veldbrandnarvorsing in die Nasionale Krugerwildtuin', Koedoe 1, 60-94. https://doi.org/10.4102/koedoe.v1i1.865 and Van Wilgen, B.W., Biggs H.C. & Potgieter, A.L.F., 1998, 'Fire management and research in the Kruger National Park, with suggestions on the detection of thresholds of potential concern', Koedoe 41, 69-87. https://doi.org/10.4102/koedoe.v41i1.248) Invasion ecology (or invasion biology) is a science that has become a priority within SANParks since 1958. Despite managing for a 'pristine' ecosystem, alien flora quickly invaded the KNP and other national parks, and a list was published in Koedoe in 1988. At that time, there were 156 alien plant species recorded in the KNP, of which 113 were considered 'invasive'. The authors, Ian Macdonald and Willem Gertenbach (Macdonald and Gertenbach 1988), warned that a coordinated regional campaign to control them would be required. The invasion of alien biota, however, seems unstoppable and it is salutary to compare the 1988 article with that by Foxcroft (2009) in Koedoe. (Macdonald, I.A.W. & Gertenbach, W.P.D., 1988, 'A list of alien plants in the Kruger National Park', Koedoe 31, 137-150. https://doi.org/10.4102/koedoe.v31i1.491, and Foxcroft, L.C., 2009, 'Developing thresholds of potential concern for invasive alien species: Hypotheses and concepts", Koedoe 51(1), Art. #157, 6 pages. https://doi.org/10.4102/koedoe.v51i1.157) The expansion of the national park system under SANParks over the past two decades has provided opportunities for a wider variety of scientific research for inclusion in Koedoe, although some of the newer parks have yet to find a research advocate and provide more than checklists of biota. The KNP continues to dominate Koedoe and indeed the research agenda of SANParks. However, as the Garden Route National Park took shape - including the lake systems - the protection and study of these water bodies became critically important. Ian Russell's (1999) article entitled 'Changes in the water quality of the Wilderness and Swartvlei lake systems, South Africa' is well worth reading, as is his (2002) article entitled 'Freshwater fishes of Tsitsikamma National Park'. (Russell, I.A., 2002, 'Freshwater fishes of Tsitsikamma National Park', Koedoe 45(2), 13-17. https://doi.org/10.4102/koedoe.v45i2.34, and Russell, I.A., 1999, 'Changes in the water quality of the Wilderness and Swartvlei lake systems, South Africa', Koedoe 42(1), 57-72. https://doi.org/10.4102/koedoe.v42i1.222) The very first article in the 1958 line-up in Koedoe was by Willem H.J. Punt (1958), a local antiquarian with a flair for colonialist micro-history, particularly the minutiae of how explorers opened up the southern African interior to 'white civilisation'. The object of Punt's attention was a group from the Netherlands that briefly penetrated the Lowveld from Lourenço Marques (Maputo) in Mozambique, thereby, in his view, initiating a European presence of long standing in the vicinity of the KNP. Naturally, this kind of historical research that valorised white conservation efforts chimed with the socio-political era of apartheid in the 1950s. Not until the 1990s was another historical perspective introduced to Koedoe with Jane Carruthers's (1993) article on the contributory role of Africans in national park developments. Regrettably, the number of papers in Koedoe on historical and archaeological topics relating to SANParks has diminished over the years, although these are critically important scientific disciplines in protected areas and humanise the landscape. (Punt, W.H.J., 1958, 'Die verkenning van die Krugerwildtuin deur die Hollandse Oos-Indiese Kompanje, 1725', Koedoe 1, 1-18. https://doi.org/10.4102/koedoe.v1i1.863, and Carruthers, J., 1993, '"Police boys" and poachers: Africans wildlife protection and national parks, the Transvaal 1902-1950', Koedoe 36(2), 11-22. https://doi.org/10.4102/koedoe.v36i2.371) [ Links ] Conclusion While a large portion of articles published in Koedoe have, understandably, emanated from Kruger, here we have included the Kalahari Gemsbok, Bontebok and Tsitsikamma (now Garden Route) National Parks to provide other perspectives. The Kalahari Gemsbok had a multifaceted and productive research programme, while work at Bontebok illustrates early grappling with an ecosystems approach - fire, grazing and grass interactions. The special issues of Koedoe were influential in that they brought together a wide range of thinking and research on specific and very relevant topics, thus providing accessible information that might, more often, only be found in a book. The 1977 symposium on the state of conservation resulted in a large workshop of practitioners who debated the merits and flaws of the science at the time and suggested possibilities for the future. Over the years, tourism has been the financial bedrock of national parks and the science around that discipline is an expanding and important field. Of equal importance is the need for humanity to interact with nature in an era when urbanisation is burgeoning, and this is provided by visitor access. The special issue on adaptive management is vitally important because it has been promoted in recent years as a favourable method of managing adaptive, complex social-ecological systems. SANParks has been hailed as a forerunner in the continued development and implementation of adaptive management and articles from the special issue have been downloaded ~225 000 times (as of March 2018). We hope that the articles we have highlighted will inspire readers to consult the older issues of the journal and that charting the changing contours of national park science will be informative and instructive, as well as illuminate how fresh and complex ecological fields, such as fire ecology and invasion biology, have emerged as large areas of research. No doubt, the learning process will continue. The ease of open access through the Koedoe website, and the publication of a number of indexes and statistical material, will make further search easy and rewarding. Change is a certainty, and we can be sure that the scientific record of today that is considered to be unassailable will also alter with time. Acknowledgements The authors thank the editor and anonymous reviewers for their comments. Competing interests The authors declare that they have no financial or personal relationships that may have inappropriately influenced them in writing this article. Authors' contributions J.C. identified the articles reviewed and wrote the first draft of the manuscript. L.C.F. collaborated on identifying the articles reviewed and wrote the manuscript. Funding information Koedoe is supported by South African National Parks. References Carruthers, J., 1993, '"Police boys" and poachers: Africans wildlife protection and national parks, the Transvaal 1902-1950', Koedoe 36(2), 11-22. https://doi.org/10.4102/koedoe.v36i2.371 Carruthers, J., 2017, National Park Science: A century of research in South Africa, Cambridge University Press, Cambridge, United Kingdom. [ Links ] Foxcroft, L.C. & Herbst, M., 2017, 'Status and trends in the global growth of Koedoe between 1958 and 2016', Koedoe 59(1), 5 pages. https://doi.org/10.4102/koedoe.v59i1.1500 [ Links ] Foxcroft, L.C., 2008, 'Fifty years of Koedoe: Current status and future directions', Koedoe 50(1), Art. #124, 2 pages. https://doi.org/10.4102/koedoe.v50i1.124 [ Links ] Foxcroft, L.C., 2009, 'Developing thresholds of potential concern for invasive alien species: Hypotheses and concepts", Koedoe 51(1), Art. #157, 6 pages. https://doi.org/10.4102/koedoe.v51i1.157 [ Links ] Hall-Martin, A.J., 1984, 'Symposium on the Kalahari ecosystem: Summary and conclusions', in Proceedings of a symposium on the Kalahari ecosystem 1983, G. de Graaff & D.J. van Rensburg (eds.), supplement, Koedoe 27(2), 327-333. https://doi.org/10.4102/koedoe.v27i2.589 [ Links ] IUCN (International Union for the Conservation of Nature and Natural Resources), 1960, Proceedings of the 6th General Assembly, Athens, 11-19 September 1958, (Brussels, IUCN, 1960), viewed 30 January 2019, from https://portals.iucn.org/library/efiles/documents/GA-6th-005.pdf. [ Links ] IUPN (International Union for the Protection of Nature), 1948, International Union for the Protection of Nature Established at Fountainebleau, 05 October 1948, viewed 30 January 2019, from https://portals.iucn.org/library/efiles/documents/1948-001.pdf [ Links ] Joubert, S.C.J., 1986, 'Management and research in relation to ecosystems of the Kruger National Park', Koedoe 29, 157-163. https://doi.org/10.4102/koedoe.v29i1.528 [ Links ] Macdonald, I.A.W. & Gertenbach, W.P.D., 1988, 'A list of alien plants in the Kruger National Park', Koedoe 31, 137-150. https://doi.org/10.4102/koedoe.v31i1.491 [ Links ] McCool, S. & Spenceley, A., 2014, 'Tourism and protected areas: A growing nexus of challenge and opportunity', in S. McCool & A. Spenceley (eds.), Tourism and protected areas: A growing nexus of challenge and opportunity, Koedoe 56(2), Art. #1221, 2 pages. https://doi.org/10.4102/koedoe.v56i2.1221 [ Links ] Novellie, P., 1987, 'Interrelationships between fire, grazing and grass cover at the Bontebok National Park', Koedoe 30, 1-17. https://doi.org/10.4102/koedoe.v30i1.498 [ Links ] Pienaar, U.d.V., 1977, 'Research objectives in South African National Parks', in Proceedings of a symposium on the state of nature conservation in southern Africa, Kruger National Park, 1976, G. de Graaff & P.T. van der Walt (eds.), supplement, Koedoe 20(2), 38-48. https://doi.org/10.4102/koedoe.v20i2.1266 [ Links ] Pienaar, U.d.V., Van Wyk, P. & Fairall, N., 1966, 'An aerial census of elephant and buffalo in the Kruger National park and the implication thereof on intended management schemes', Koedoe 9, 40-107. https://doi.org/10.4102/koedoe.v9i1.781 [ Links ] Punt, W.H.J., 1958, 'Die verkenning van die Krugerwildtuin deur die Hollandse Oos-Indiese Kompanje, 1725', Koedoe 1, 1-18. https://doi.org/10.4102/koedoe.v1i1.863 [ Links ] Roux, D.J. & Foxcroft, L.C., 2011, 'The development and application of strategic adaptive management within South African National Parks', Koedoe 53(2), 5 pages. https://doi.org/10.4102/koedoe.v53i2.1049 [ Links ] Russell, I.A., 2002, 'Freshwater fishes of Tsitsikamma National Park', Koedoe 45(2), 13-17. https://doi.org/10.4102/koedoe.v45i2.34 [ Links ] Russell, I.A., 1999, 'Changes in the water quality of the Wilderness and Swartvlei lake systems, South Africa', Koedoe 42(1), 57-72. https://doi.org/10.4102/koedoe.v42i1.222 [ Links ] Van der Schijff, H.P., 1958, 'Inleidende verslag oor veldbrandnarvorsing in die Nasionale Krugerwildtuin', Koedoe 1, 60-94. https://doi.org/10.4102/koedoe.v1i1.865 [ Links ] Van Wilgen, B.W., Biggs, H.C. & Potgieter, A.L.F., 1998, 'Fire management and research in the Kruger National Park, with suggestions on the detection of thresholds of potential concern', Koedoe 41, 69-87. https://doi.org/10.4102/koedoe.v41i1.248 [ Links ] Whyte, I.J., Biggs, H.C., Gaylard, A. & Braack, L.E.O., 1999, 'A new policy for the management of the Kruger National Park elephant population', Koedoe 42(1), 111-32. https://doi.org/10.4102/koedoe.v42i1.228 [ Links ] Received: 19 Sept. 2018 CHECKLIST A checklist of the termites of Kruger National Park, South Africa Brianna M. LindI; Andrew B. DaviesII IPlant and Environmental Sciences Department, New Mexico State University, New Mexico, United States ABSTRACT The protection of biodiversity is critical to ecosystem function and is a primary management goal for conservation areas globally. Maintaining a current inventory of known diversity is a central component of achieving this goal and serves as an essential starting point for future research endeavours. Since the first published survey of termites in South Africa's Kruger National Park (KNP) over 55 years ago, our understanding of termite diversity has expanded sufficiently to merit an update and formal checklist. Here we revise the inventory of termite diversity in KNP and summarise the taxonomic and functional diversity of termites in the park. A thorough review of recent termite research in KNP added 6 new genera and 13 species to what was found in Coaton's original survey, with one genus, Anenteotermes, recorded for the first time in southern Africa. Based on the updated species checklist, the majority of genera in the park belong to Feeding Group II (39%) and the Termitidae family (75%). Keywords: termite; Kruger National Park; feeding groups; diversity; savanna. Introduction A principal goal of most conservation areas is to conserve biodiversity in all its facets. To achieve this goal, scientists must first catalogue the known diversity of organisms to serve as a baseline for future conservation and research endeavours. This is particularly pertinent for groups that perform important ecological functions, such as termites. Termites are a prominent source of habitat heterogeneity in African savannas and have a substantial impact on ecosystem functioning (Jouquet et al. 2011; Sileshi et al. 2010). Termites are the dominant invertebrate decomposers in tropical forests and savannas (Collins 1981; Schuurman 2005), and, through their foraging activities, alter soil processes, redistribute nutrients and modify soil hydrology (Jouquet et al. 2011). These ecosystem alterations in turn affect vegetation distributions and assemblage composition (Davies, Baldeck & Asner 2016a; Joseph et al. 2014; Sileshi et al. 2010), resulting in a patchy landscape that alters both mammalian and insect herbivore foraging behaviour (Davies et al. 2016b, 2016c; Grant & Scholes 2006; Levick et al. 2010a). Considering its latitude, southern Africa has a surprisingly high diversity of termites, with over 50 genera present (Eggleton 2000; Uys 2002). The termite fauna of the region is generally considered to be well documented as a result of the National Survey of Isoptera conducted by W.G.H. Coaton and co-workers between 1956 and 1979. During this survey, almost every quarter-degree grid cell of South Africa, Swaziland, Zimbabwe and Namibia was sampled for termites. Much of the information gained from this survey appeared in a series of publications in Cimbebasia between 1971 and 1980 (Uys 2002), and collected specimens are currently located in the South African National Collection of Insects (Uys 2002). Kruger National Park (KNP), South Africa, was also included in these surveys, with a checklist of the park's termite fauna published in 1962 (Coaton 1962). However, since this time, a considerable amount of termite research has been conducted in KNP, warranting an update of the checklist in order to have a comprehensive and current inventory of termite diversity in the park. In his survey, Coaton collected 22 termite genera from four families within KNP (Coaton 1962). While the last few decades have seen a large increase in the number of studies investigating termite ecology in KNP, none have focused exclusively on termite taxonomy or sought to update the checklist, despite new genus and species records. Here we synthesise the termite occurrence records from published studies in KNP and compile an updated list of termite richness and functional diversity to facilitate better understanding of KNP's biodiversity, which will aid both management and future research endeavours. By characterising the park's termite assemblages, a fuller understanding of the fundamental roles termites play in critical ecosystem processes within Kruger's savannas can also be realised. Methods and materials Kruger National Park is located in low-lying savanna in the northeast corner of South Africa between the foot slopes of the Drakensberg Escarpment and Mozambican coastal plains (Venter, Scholes & Eckhardt et al. 2003). The region experiences high temperatures in the summer, mild winters and the majority of rainfall between October and April (ranging from ~300 mm/year in the north to ~700 mm/year in the south) (Venter et al. 2003). The park has two main underlying geologies, basalt in the east and granite in the west (Venter et al. 2003). Along with varying rainfall, these geologies contribute to a diverse range of soil types and influence vegetation patterns (Venter et al. 2003). Tree canopy cover ranges from 5% to 60%, and 75% of the park is covered by broad-leaved savanna with the remaining 25% composed of fine-leaved savanna (Venter et al. 2003). We conducted a comprehensive literature review of research involving termites in KNP by searching Web of Science and Google Scholar and compiled a list of termite genera and species sampled from each study. Termites were listed by family, subfamily, genus and species and categorised into feeding groups (FG) following Donovan, Eggleton and Bignell (2001) to characterise the assemblage. Feeding groups consist of four categories (I-IV) based on the level of decay of food items, which ranged from live plants to decayed organic material. Donovan et al. (2001) defines FGs to include a non-termitid group, FG-I, that feeds on dead wood and grass and three termitid groups that eat dead wood, litter and micro-epiphytes, FG-II, humus, FG-III, and soil minerals, FG-IV. Results Our literature review of 20 termite-related studies conducted in KNP (see Table 1) revealed that since Coaton's 1962 survey, six previously unlisted termite genera and 13 species have been sampled in the park (see Table 2). In addition, one sampled genus, Anenteotermes, had not been previously recorded in southern Africa. Three studies in particular contributed to checklist updates: Meyer et al. (1999); Davies et al. (2012); and Davies et al. (2014a). While termites from all southern African families are present in the park, the majority (75%) belong to the Termitidae family (see Figure 1a). In terms of FGs, FG-II makes up 40% of termite genera in the park, FG-I and FG-III each make up 25% and FG-IV, which is the least represented, makes up 10% (see Figure 1b). Discussion Termite ecology in KNP, and in savannas globally, has advanced substantively since Coaton's 1962 survey. Our literature review revealed 6 previously unrecorded genera and 13 previously unrecorded species in KNP. Termite diversity in KNP appears to mirror the generalised diversity pattern of termites in southern Africa, with relatively few genera in the Hodotermitidae, Kalotermitidae and Rhinotermitidae families, with the majority of termite diversity being found within the Termitidae family (Uys 2002). As knowledge about how termites affect the structure and function of savanna ecosystems continues to accumulate, it will be increasingly important to understand how different species and genera interact with and affect the environment. Maintaining an accurate record of the termites that occur in KNP is a critical first step to achieving this understanding and provides an essential baseline for ongoing research. There were two major research papers that contributed most significantly to updating the inventory of KNP's taxonomic diversity: Meyer et al. (1999), and Davies et al. (2012). Meyer et al. (1999) made substantial contributions to advancing our understanding of termite diversity in KNP through research that involved mapping the distribution and density of termite mounds in northern Kruger (Meyer et al. 1999, 2000a). Meyer et al. (1999) documented Macrotermes natalensis as the most abundant mound-building termite species in this region, which led to several follow-up studies on the species, including an investigation of intracolonial demography (Meyer et al. 2000), biomass (Meyer et al. 2001) and food consumption (Meyer et al. 2003). While Meyer's research into M. natalensis provides an excellent baseline for the ecological influence of this termite species in northern KNP, future research should strive to account for the full breath of foraging power (i.e. litter removal) that all FG-II termites effect in KNP. When FG-II termites are evaluated collectively, we may find that litter removal by termites competes with burning and herbivory and could in turn subsequently influence fire regimes and patterns. While Meyer et al. (1999) increased our knowledge of mound-building termites, Davies et al. (2012) employed a broad range of sampling strategies that captured the full range of termite families in the park. Davies et al. (2012) sampled termites across varying burning regimes across KNP and found that termites are broadly resilient to fire. They found that FG-II termites are dominant across KNP's rainfall gradient with the caveat that the proportion of other FGs changed with rainfall, with the greatest FG diversity in the wettest region, Pretoriuskop. This overall finding is similar to our synthesis, where we also found a dominance of FG-II termites in KNP. Davies et al. (2012) also documented a first record of the soil-feeding genus Anenteotermes (Sands 1998) in KNP and in southern Africa. Although this genus is known to range from semi-arid savanna to rainforests (Sands 1998), Davies et al. (2012) were the first to document the genus in southern Africa. Anenteotermes has previously been recorded from as far south as Malawi (Donovan et al. 2002) and is also well represented in central (e.g. Deblauwe et al. 2008; Eggleton et al. 1996) and east (e.g. Wanyonyi et al. 1984) Africa. Although we have added numerous additions to Coaton's original 1962 checklist, many of the specimens he sampled still await identification. As such, our 'new' findings compiled from recent research may be a consequence of a more comprehensive identification process rather than of sampling in a new environment. This highlights the lack of taxonomic resolution of termites (especially non-mound-building, soil-feeding termites) in Africa. Indeed, almost a third of termite genera in southern Africa are in need of taxonomic revision (Uys 2002). Because listing and categorising taxa is such an important component of conserving biodiversity and understanding ecosystems, a priority of future termite research should be to resolve these taxonomic difficulties (Wilson 2017). Deo-xyribonucleic acid metabarcoding, in conjunction with taxonomic and natural history data components, may facilitate enhanced taxonomic clarity and enable more species-level identifications. Conclusion Collectively, termites as an insect group play considerably important roles in the functioning of dryland and subtropical environments. Maintaining a termite checklist in KNP allows us to begin the important work of attributing what we understand as 'termite influence' to specific termite species and genera. It also provides an invaluable baseline for future research in the park and facilitates the implementation of biodiversity conservation, a key park management goal. The ecological significance and conservation value of insects in savannas has traditionally received little attention relative to vertebrates (Braack & Kryger 2003). Knowledge of termite diversity and assemblage composition will hopefully help bridge this gap and facilitate the consideration of this important insect group in ecosystem functioning and management planning. Moving forward, assessing termite diversity in ecologically relevant FGs, that have targeted and discernible ecosystem impacts, will advance research endeavours and allow for more realistic quantification of their roles in key processes such as vegetation dynamics, nutrient cycling, litter removal and fuel-load management. Acknowledgements The authors would like to thank Dr Niall Hanan for insightful comments on an earlier version of the manuscript. Competing interests The authors declare that they have no financial or personal relationships that may have inappropriately influenced them in writing this article. Authors' contributions B.M.L. and A.B.D. designed the study, analysed the data and wrote the article. References Braack, L.E.O., 1995, 'Seasonal activity of savanna termites during and after severe drought', Koedoe 38, 73-82. https://doi.org/10.4102/koedoe.v38i1.307 [ Links ] Braack, L.E.O. & Kryger, P., 2003, 'Insects and savanna heterogeneity', in J.T. Du Toit, K.H. Rogers & H.C. Biggs (eds.), The Kruger experience: Ecology and management of savanna heterogeneity, pp. 83-129, Island Press, Washington, DC. [ Links ] Coaton, W.G.H., 1962, 'Survey of the termites of the Kruger National Park', Koedoe 5, 144-168. https://doi.org/10.4102/koedoe.v5i1.842 [ Links ] Coetsee, C., Jacobs, S. & Govender, N., 2012, 'An overview of nitrogen cycling in a semiarid savanna: Some implications for management and conservation in a large African park', Environmental management 49, 387-402. https://doi.org/10.1007/s00267-011-9779-0 [ Links ] Collins, N.M., 1981, 'Populations, age structure, and survivorship of colonies of Macrotermes bellicosus (Isoptera: Macrotermitinae)', Journal of Animal Ecology 50, 293-311. https://doi.org/10.2307/4046 [ Links ] Davies, A.B., Baldeck, C.A. & Asner, G.P., 2016a, 'Termite mounds alter the spatial distribution of African savanna tree species', Journal of Biogeography 43, 301-313. https://doi.org/10.1111/jbi.12633 [ Links ] Davies, A.B., Eggleton, P., Van Rensburg, B.J. & Parr, C.L., 2012, 'The pyrodiversity-biodiversity hypothesis: A test with savanna termite assemblages', Journal of Applied Ecology 49, 422-430. https://doi.org/10.1111/j.1365-2664.2012.02107.x [ Links ] Davies, A.B., Eggleton, P., Van Rensburg, B.J. & Parr, C.L., 2013, 'Assessing the relative efficiency of termite sampling methods along a rainfall gradient in African savannas', Biotropica 45, 474-479. https://doi.org/10.1111/btp.12030 [ Links ] Davies, A.B., Eggleton, P., Van Rensburg, B.J. & Parr, C.L., 2015, 'Seasonal activity patterns of African savanna termites vary across a rainfall gradient', Insectes Sociaux 62, 157-165. https://doi.org/10.1007/s00040-014-0386-y [ Links ] Davies, A.B., Levick, S.R., Asner, G.P., Robertson, M.P., Van Rensburg, B.J. & Parr, C.L., 2014a, 'Spatial variability and abiotic determinants of termite mounds throughout a savanna catchment', Ecography 37, 852-862. https://doi.org/10.1111/ecog.00532 [ Links ] Davies, A.B., Levick, S.R., Robertson, M.P., Van Rensburg, B.J., Asner, G.P. & Parr, C.L., 2016b, 'Termite mounds differ in their importance for herbivores across savanna types, seasons and spatial scales', Oikos 125, 726-734. https://doi.org/10.1111/oik.02742 [ Links ] Davies, A.B., Robertson, M.P., Levick, S.R., Asner, G.P., Van Rensburg, B.J. & Parr, C.L., 2014, 'Variable effects of termite mounds on African savanna grass communities across a rainfall gradient', Journal of Vegetation Science 25, 1405-1416. https://doi.org/10.1111/jvs.12200 [ Links ] Davies, A.B., Van Rensburg, B.J., Robertson, M.P., Levick, S.R., Asner, G.P. & Parr, C.L., 2016c, 'Seasonal variation in the relative dominance of herbivore guilds in an African savanna', Ecology 97, 1618-1624. https://doi.org/10.1890/15-1905.1 [ Links ] Deblauwe, I., Dibog, L., Missoup, A.D., Dupain, J., Van Elsacker, L., Dekoninck, W. et al., 2008, 'Spatial scales affecting termite diversity in tropical lowland rainforest: A case study in southeast Cameroon', African Journal of Ecology 46, 5-18. https://doi.org/10.1111/j.1365-2028.2007.00790.x [ Links ] Donovan, S.E., Eggleton, P. & Bignell, D.E., 2001, 'Gut content analysis and a new feeding group classification of termites', Ecological Entomology 26, 356-366. https://doi.org/10.1046/j.1365-2311.2001.00342.x [ Links ] Donovan, S.E., Eggleton, P. & Martin, A., 2002, 'Species composition of termites of the Nyika plateau forests, northern Malawi, over an altitudinal gradient', African Journal of Ecology 40, 379-385. https://doi.org/10.1046/j.1365-2028.2002.00397.x [ Links ] Eggleton, P., 2000, 'Global patterns of termite diversity', in T. Abe & M. Higashi (eds.), Termites: Evolution, sociality, symbioses, ecology, pp. 25-51, Springer, Netherlands. [ Links ] Eggleton, P., Bignell, D.E., Sands, W.A., Mawdsley, N.A., Lawton, J.H., Wood, T.G. et al., 1996, 'The diversity, abundance and biomass of termites under differing levels of disturbance in the Mbalmayo Forest Reserve, southern Cameroon', Philosophical Transactions of the Royal Society of London B 351, 51-68. https://doi.org/10.1098/rstb.1996.0004 [ Links ] Grant, C.C. & Scholes, M.C., 2006, 'The importance of nutrient hot-spots in the conservation and management of large wild mammalian herbivores in semi-arid savannas', Biological Conservation 130, 426-437. https://doi.org/10.1016/j.biocon.2006.01.004 [ Links ] Joseph, G.S., Seymour, C.L., Coetzee, B.W.T., Ndlovu, M., De La Torre, A., Suttle, R. et al., 2016, 'Microclimates mitigate against hot temperatures in dryland ecosystems: Termite mounds as an example', Ecosphere 7, 1-10. https://doi.org/10.1002/ecs2.1509 [ Links ] Joseph, G.S., Seymour, C.L., Cumming, G.S., Cumming, D.H. & Mahlangu, Z., 2014, 'Termite mounds increase functional diversity of woody plants in African savannas', Ecosystems 17, 808-819. https://doi.org/10.1007/s10021-014-9761-9 [ Links ] Jouquet, P., Traoré, S., Choosai, C., Hartmann, C. & Bignell, D., 2011, 'Influence of termites on ecosystem functioning. Ecosystem services provided by termites', European Journal of Soil Biology 47, 215-222. https://doi.org/10.1016/j.ejsobi.2011.05.005 [ Links ] Levick, S.R., Asner, G.P., Chadwick, O.A., Khomo, L.M., Rogers, K.H., Hartshorn, A.S. et al., 2010b, 'Regional insight into savanna hydrogeomorphology from termite mounds', Nature Communications 1, 1-7. https://doi.org/10.1038/ncomms1066 [ Links ] Levick, S.R., Asner, G.P., Kennedy-Bowdoin, T. & Knapp, D.E., 2010a, 'The spatial extent of termite influences on herbivore browsing in an African savanna', Biological Conservation 143, 2462-2467. https://doi.org/10.1016/j.biocon.2010.06.012 [ Links ] Meyer, V.W., Braack, L.E.O. & Biggs, H.C., 2000, 'Distribution and density of Cubitermes Wasmann (Isoptera: Termitidae) mounds in the northern Kruger National Park', Koedoe 43, 57-65. https://doi.org/10.4102/koedoe.v43i1.208 [ Links ] Meyer, V.W., Braack, L.E.O., Biggs, H.C. & Ebersohn, C., 1999, 'Distribution and density of termite mounds in the northern Kruger National Park, with specific reference to those constructed by Macrotermes Holmgren (Isoptera: Termitidae)', African Entomology 7, 123-130. [ Links ] Meyer, V.W., Crewe, R.M. & Braack, L.E.O., 2003, 'Estimates of food consumption by the fungus-growing termite Macrotermes natalensis in a South African savanna-woodland: News and views', South African Journal of Science 99, 207-208. [ Links ] Meyer, V.W., Crewe, R.M., Braack, L.E.O., Groeneveld, H.T. & Van der Linde, M.J., 2000, 'Intracolonial demography of the mound-building termite Macrotermes natalensis (Haviland)(Isoptera, Termitidae) in the northern Kruger National Park, South Africa', Insectes Sociaux 47, 390-397. [ Links ] Meyer, V.W., Crewe, R.M., Braack, L.E.O., Groeneveld, H.T. & Van der Linde, M.J., 2001, 'Biomass of Macrotermes natalensis in the northern Kruger National Park, South Africa- the effects of land characteristics', Sociobiology 38, 431-448. [ Links ] Sands, W.A., 1998, The identification of worker castes of termite genera from soils of Africa and the Middle East, CAB International, Wallingford, UK. [ Links ] Schuurman, G., 2005, 'Decomposition rates and termite assemblage composition in semiarid Africa', Ecology 86, 1236-1249. https://doi.org/10.1890/03-0570 [ Links ] Sileshi, G.W., Arshad, M.A., Konaté, S. & Nkunika, P.O., 2010, 'Termite induced heterogeneity in African savanna vegetation: Mechanisms and patterns', Journal of Vegetation Science 21, 923-937. https://doi.org/10.1111/j.1654-1103.2010.01197.x [ Links ] Sponheimer, M., Lee-Thorp, J., De Ruiter, D., Codron, D., Codron, J., Baugh, A.T. et al., 2005, 'Hominins, sedges, and termites: New carbon isotope data from the Sterkfontein valley and Kruger National Park', Journal of Human Evolution 48, 301-312. https://doi.org/10.1016/j.jhevol.2004.11.008 [ Links ] Uys, V.M., 2002, A guide to the termite genera of southern Africa, Plant Protection Research Institute Handbook No. 15, Agricultural Research Council, Pretoria. [ Links ] Venter, F.J., Scholes, R.J. & Eckhardt, H.C., 2003, 'The abiotic template and its associated vegetation pattern', in J.T. Du Toit, K.H. Rogers & H.C. Biggs (eds.), The Kruger experience: Ecology and management of savanna heterogeneity, pp. 83-129, Island Press, Washington, DC. [ Links ] Wanyonyi, K., Darlington, J.P.E.C. & Bagine, R.K.N.B., 1984, 'Checklist of the species of termite (Isoptera) recorded from east Africa', Journal of the East Africa Natural History Society and National Museum 181, 1-12. [ Links ] Wilson, E.O., 2017, 'Biodiversity research requires more boots on the ground', Nature Ecology & Evolution 1, 1590. https://doi.org/10.1038/s41559-017-0360-y [ Links ] Received: 14 Mar. 2018 ORIGINAL RESEARCH Estimating conservation effectiveness across protected areas in Limpopo Province, South Africa Luna MilatovićI; Brandon P. AnthonyI; Anthony SwemmerII IDepartment of Environmental Sciences and Policy, Central European University, Budapest, Hungary ABSTRACT Protected areas (PAs) are considered the cornerstone of biodiversity conservation, and their establishment is often used to demonstrate the success of conservation policies. However, despite the increase in number and extent of PAs, global trends of biodiversity loss remain largely unchanged. It has become apparent that simply establishing a PA is not enough, and effective management is equally important for achieving conservation success. The importance of management monitoring and evaluation systems has been recognised by numerous institutions, triggering the development of various conservation performance assessment frameworks and tools, each varying in their accuracy, scale and application. Modified threat reduction assessment (MTRA) was selected to evaluate the management effectiveness of the Letaba Ranch Nature Reserve (LRNR), which serves as a buffer area of the Kruger National Park (KNP), South Africa, and two KNP sections bordering it (Mahlangeni and Phalaborwa). The aim of this research was to determine the nature of threats to biodiversity and their changes between 2013 and 2017 in all three sites. The research revealed 13 threats and determined negative MTRA indices of −33.6% in the LRNR and −14.7% in the Phalaborwa section, but a 13.2% reduction in threats in the Mahlangeni section. Combined with the results of geospatial visualisation of changes in threats, we suggest that the LRNR is not sufficiently meeting the objective of supporting the ecological integrity of the KNP, but further exposes it to threats, and that MTRAs can be useful for measuring and comparing threats across PA boundaries. Keywords: protected areas; conservation success; management effectiveness; threat reduction assessment; biodiversity; buffer zone. Introduction As we enter what many scientists call the Earth's six mass extinction (McCallum 2015; Pimm et al. 2014; Thomas et al. 2004), the importance of biodiversity conservation is more apparent than ever. Declines in biodiversity are associated with changes that are reducing or homogenising biological diversity at many levels, from genes to habitats and ecosystems (Gaston & Spicer 2004). Probably the most efficient and widespread tool developed in response to the biodiversity crisis is the establishment of protected areas (PAs). Today, there are 202 467 designated terrestrial and inland water PAs, covering 14.7% of the land surface (UNEP-WCMC & IUCN 2016). However, despite the increased number and extent of the protected area (PA) portfolio over recent decades (Chape et al. 2005), biodiversity loss continues (Bertzky et al. 2012) and, in some cases, even within PAs (Craigie et al. 2010; Françoso et al. 2015; Laurance et al. 2012). This has led to the growing recognition that effective management of PAs is at least as important as their size, number and physical characteristics (IUCN-WCPA 2009; Leverington et al. 2010). There is therefore a need for management effectiveness evaluation (MEE) which can assist PA management staff to assess their current management strategies, and identify shortcomings and successes, so they can modify interventions and allocate resources more efficiently (Salafsky & Margoluis 1999). Monitoring is a crucial component of any evaluation needed for detecting changes and tracking progress towards management objectives (Tucker 2005). Protected Area Management Effectiveness (PAME) schemes were developed as a way of examining PA performance using management indicators (Hockings & Phillips 1999) and gained momentum by the obligations for Convention on Biological Diversity signatory countries to achieve management effectiveness assessments for 60% of their PAs by 2015 (CBD 2010). Although there are many approaches and tools used to evaluate management effectiveness, no single PAME evaluation system is suitable for all PAs, and the aims and circumstances under which PAME is conducted are very diverse. In fact, there are more than 50 different MEE methodologies (Leverington et al. 2010), most of which are modified standard approaches adapted to specific local conditions (Hockings 2003). Threat reduction assessment (TRA), developed by Salafsky and Margoluis (1999), measures management effectiveness indirectly by concentrating on changes in direct biodiversity threats within a PA. Threat reduction assessment is particularly useful where little or no baseline data exist on biodiversity, and when comparing this across sites, it yields a more focused and detailed approach on direct threats to biodiversity and conservation than other widely used MEE tools. It is used to measure outcomes and identify effective management strategies, while overcoming the limitations of using biological indicators (Salafsky & Margoluis 1999). The tool was later modified (modified threat reduction assessment [MTRA]) to assess changes in threats more accurately by allowing for the inclusion of worsening or emerging threats - a recognised deficiency in the original tool (Anthony 2008). Republic of South Africa The Republic of South Africa (RSA) covers a total land surface area of 1 221 037 km2 (UN 2017) and is listed by Conservation International as one of the 17 megadiverse countries of the world, because of its highly diverse ecosystems, species richness and endemism (Driver et al. 2011). However, its biodiversity is under increasing pressure because of inter alia loss and degradation of natural habitats, overexploitation of natural resources (including poaching) and invasive alien species (IAS) (Driver et al. 2011). The Republic of South Africa has a number of national policies and legislative frameworks addressing conservation and management of natural resources and biodiversity. The National Environmental Management: Protected Areas Act of 2004 (NEM: PAA) is the main legislative document concerning the protection of the RSA's biodiversity and conservation, while the National Biodiversity Framework (DEAT 2009) serves to align conservation efforts across institutions. Another important aspect of PAs in RSA is the recently legally recognised concept of buffer zones around PAs, outlined in the Biodiversity Policy and Strategy for South Africa: Strategy on Buffer Zones for National Parks (Notice 106 of 2012). Globally, the concept originated by a growing realisation that PAs cannot be managed as static, isolated islands, but are often subsets of larger ecosystems (Hansen et al. 2011), and that the long-term conservation success of PAs can be enhanced only when socio-ecological relationships with the surrounding landscape are considered (Bengtsson et al. 2003; Palomo et al. 2014). This includes a heightened appreciation of effective reserve sizes, ecological flows in and out of PAs, crucial habitats as well as negative edge effects from PA peripheries (Hansen & DeFries 2007). Buffer zones gained momentum as a conservation tool in the 1970s through UNESCO's Man and Biosphere Programme (UNESCO 1974), which introduced the zoning hierarchy of buffer areas: the first layer of protection around the core area is the buffer zone which is surrounded by a transition area, where a greater level of land use is allowed. The principal idea is to safeguard areas that have biodiversity conservation as their primary objective (core areas) from harmful external impacts, while allowing a certain level of sustainable human activities that are consistent with the protection of the core area. This is particularly relevant for RSA's PAs, many of which are located in densely populated and impoverished parts of the country. The Strategy on Buffer Zones for National Parks, adopted in 2012, outlines a clear mission 'to best protect the integrity of national parks, their purpose and values while enabling sustainable benefits to those persons and communities living next to the national parks'. Therefore, the strategy presents not only an invaluable contribution to the protection of PAs but also a tool for increased inclusion of the local community. There are a number of different forms of buffer zones, all with somewhat different objectives, including the so-called buffer parks around the Kruger National Park (KNP). This mosaic of buffer areas around the KNP, and how they contribute to ecosystem resilience, can only be better understood when both governance structures and broader socio-ecological processes are considered together in monitoring and management (Cumming and Allen 2017; Cumming et al. 2015). Although previous studies have explored large-scale, satellite-based land use transformations just south of our study area (Coetzer et al. 2013), and threat mitigation by the KNP and Limpopo Province to the north (Anthony 2008), our study is the first to compare finer scale threats across adjacent PAs with differing governance structures in the region. Methodology Study area Kruger National Park The Kruger National Park (KNP) covers approximately 20 000 km2 in the north-eastern part of RSA and attracts over 1 million visitors annually. The Kruger National Park's biodiversity is significant because of its size, distinctive landscapes and geological diversity (SANParks 2018). One of the key features of the KNP is its protection of 150 mammal species (SANParks 2018), including many of the Earth's remaining megafauna populations (Ripple et al. 2016). The park is divided into 22 sections, each managed under a common KNP Management Plan. Owing to their location, the Phalaborwa and Mahlangeni sections were selected for this study (Figure 1). The Mahlangeni section covers an area of approximately 1160 km2 of mopane-dominated woodlands on granite (Gertenbach 1983), whereas the Phalaborwa section is slightly smaller, covering 1035 km2 of similar vegetation (Gertenbach 1983). One of the park's entry gates (Phalaborwa) is located in this section. Letaba Ranch Nature Reserve The Letaba Ranch Nature Reserve (LRNR) is a provincial nature reserve located in the Ba-Phalaborwa and Greater Giyani municipalities of the Mopani district in the Limpopo Province, covering an area of 420 km2. It is positioned along the western boundary of the KNP, north of the Phalaborwa Gate, and serves as a buffer between the park and settlements and agricultural areas to the west. Fences between the LRNR and the KNP were dismantled in 2006 (Swemmer & Mmethi 2016), allowing the free movement of fauna between the PAs. Under the most recent management plan (LEDET 2013), a number of management issues have been highlighted inter alia susceptibility to drought, unsustainable hunting and invasive species control. The Mthimkhulu Nature Reserve (MNR), a community-owned nature reserve of 63.49 km2 bordering the LRNR to the north, is managed by the same provincial authority (LEDET 2013) under the same management plan and is thus treated as part of the LRNR here. Modified threat reduction assessment tool To evaluate management effectiveness in the selected sites, it was important to utilise a suitable PAME tool. Modified threat reduction assessment was chosen as it allows for comparison between sites, does not require previously collected baseline data, is relatively easy to apply, facilitates management monitoring without highly trained staff and is cost-effective (Anthony 2008; Salafsky & Margoluis 1999). Previously conducted MTRAs have identified group discussions as the most effective way of applying the tool, with a workshop style being particularly fitting (Anthony 2008; Matar & Anthony 2010). The Kruger National Park section rangers and the LRNR managers were invited to participate and were provided with information on criteria for workshop participant selection, that is, experience working in the area during the entire assessment period; intimate knowledge of the site; and familiarity with concepts such as biodiversity, habitat conditions and ecosystem services. Three workshops were conducted: two in the Mahlangeni and Phalaborwa sections of the KNP, and one in the LRNR. Each workshop commenced with a presentation introducing the methodology, key concepts and definitions, as well as a step-by-step explanation of the workshop. The MTRA assessed the area of 5 km from the border inside the Mahlangeni and Phalaborwa sections of the KNP (assumed by workshop participants to adequately account for border effects) and the whole of the LRNR. The assessment period was selected to be from 2013, the year the LRNR adopted its 5-year Strategic Plan (LEDET 2013), until present (May 2017). The same timeframe was used for the KNP to allow for comparison. Utilising the IUCN Standard Lexicon of Threats (Salafsky et al. 2008), participants were instructed to identify and list direct threats present at the beginning of the assessment period in their area and any emerging threats over the assessment period. After developing the final list, the top ten threats were chosen and categorised according to the IUCN lexicon. Participants were asked to describe the specifics of the identified threats in their area to minimise the possible loss of information resulting from threat standardisation (Anthony 2008) and consulting the lexicon if required. Participants were then asked to agree on detailed definitions of the identified threats and determine what a 100% reduction of that threat would be. The moderator defined a 100% threat reduction 'as complete eradication of a given threat', following Anthony (2008), who notes that any other definition may cause ambiguity. However, if participants recognised that total threat elimination is not feasible, a different definition of 100% reduction was made. The participants were then asked to rank each threat in regard to its area, intensity and urgency. The scoring scale was defined depending on the number of identified threats, with number 1 being the minimum score without the possibility of equal scoring. Participants were advised in advance to consult any reports to minimise subjectivity and increase validity of the method. Criteria scores were summed to calculate a 'total ranking' for each individual threat. Participants were then asked to review the rankings and decide if this is the true representation of the threats in their area, allowing them to modify their rankings and increase the legitimacy of the results. Participants were then given time to independently estimate (as a percentage) to what degree the threat had increased or decreased over the assessment period. After group discussion, they corporately decided on the final percentage for each threat (Anthony 2008). If the threat had been mitigated, they gave a positive score, with the top score being +100% if the threat had been eliminated. If a threat had worsened since the start date, the score was negative and had no lower bound. If a threat was absent at the assessment start date, but emerged since then, that threat was given a score of −100%. Dividing the sum of the raw scores for each threat by the total possible rankings of all the threats and multiplying by 100 computed the threat reduction index: Results Letaba Ranch Nature Reserve The reserve management team identified 10 major threats to the reserve's biodiversity (Table 1-A1). The MTRA index of −33.6% indicated that total threats had worsened since 2013. This was largely because of two newly emerged threats, '(sand) mining' and 'drought', which were given a score of −100% accordingly (Figure 2b). The threat of 'problematic native species' had doubled since 2013, which contributed heavily to the negative overall index. Despite a reduction of 5%, (mostly illegal) 'hunting' was recognised as the top threat, followed by 'drought' and 'fishing', the latter remaining unchanged according to the management team. The threats of 'invasive alien species' and 'wood harvesting' had both halved, while pollution from 'agricultural effluents' from surrounding crop land and 'garbage and solid waste' had worsened. Rangers also recognised 'dams' and 'illegal fishing' in the reserve as threats, but identified no change during the assessment period. Mahlangeni There was a moderate improvement of 13.2% in the MTRA index for Mahlangeni, as a result of the reduction of three of seven identified threats (Table 2-A1; Figure 2b). Despite considerable reduction (+49%), 'hunting' still emerged as the top threat, followed by 'fishing' that had worsened (−50%), and 'invasive alien species' that had been significantly mitigated (+70%). 'Mining' and 'garbage and solid waste' were both identified as worsening threats, originating from outside the park. Lastly, 'utility and service lines' within the KNP were not perceived as a serious problem, and the impact of their threat remained constant. Phalaborwa Management staff identified five threats (Table 3-A1; Figure 2a). 'Hunting' and 'fire' had declined; however 'hunting' remained the top threat in 2017 in terms of the area affected, intensity and urgency. 'Air pollution' from a nearby mine remained the same, as did the threat of 'utility and service lines'. On the contrary, the problem of 'invasive alien species' had worsened and was given a score of −200%, which was primarily responsible for the negative overall MTRA index of −14.67%. Discussion Knowledge gained (threats and drivers) A number of threats that were identified in more than one site (Table 1) and their spatial organisation, as delineated from the threat maps, provide insights into their source(s) and reasons for change. Although our study identified a total of 13 threats, we focus on five categorical threats common across at least two sites, which we believe are functionally linked. Hunting and collection of terrestrial animals was recognised in all three sites as the top threat. In the LRNR, the management team expressed concern about poaching, commercial hunting activities and hunting quotas given to neighbouring communities. Poaching was identified as the dominant threat in the reserve, and it was alleged that this illegal activity is usually carried out by people living adjacent to the reserve, who hunt for bushmeat as a source of food or as a source of income. Most of the subsistence poaching is carried out using snares, targeting impala (Aepyceros melampus), kudu (Tragelaphus strepsiceros) and buffalo (Syncerus caffer). A select group of poachers target elephants (Loxodonta africana) and rhinos (Ceratotherium simum simum) which move freely into the reserve from the KNP. Apart from poaching, hunting quotas given to the communities present a threat as they are purportedly not scientific estimates of sustainable levels of offtakes, an issue previously identified as a challenge in the LRNR Strategic Plan (LEDET 2013). Irregularities concerning issuing of these quotas and hunting rights have been investigated by the Letaba Herald (2015), a local newspaper and EMS Foundation (2016), which published its findings in a report prepared for CITES CoP 2017. Both sources list individuals being involved with reselling of hunting rights in a network underpinned by corruption in the reserve. No official statements regarding the issue were made by the Limpopo Department of Economic Development, Environment and Tourism (LEDET), and these claims are based on grey information. However, it is important to keep this in mind to understand the context in which the reserve is being managed. Commercial hunting in the reserve, which was previously common, ceased in 2015, but is likely to resume according to workshop participants. The light reduction in the threat of poaching was ascribed to the increased frequency of patrols by the rangers. In Mahlangeni, poaching for bushmeat, ivory, rhino horns and vulture poisoning was identified, as well as illegal harvesting of mopani caterpillars (Imbrasia belina). Rangers from the Phalaborwa section identified rhino poaching as the dominant threat, while there was a concern that poaching for ivory would likely become the prevailing threat in the future. In addition to anti-poaching measures, the reduction of the threat in both sections can be explained by the fact that there are far fewer rhinos in the area than in 2013. According to both management teams, the number of poachers recorded in the area decreased in accordance with a decline in rhino numbers. The threat maps illustrate a potential pattern that could help understand poachers' entrance points into the KNP. In Mahlangeni, areas in which poaching incidents were recorded are prevalent in the southern portion of the assessed area, which borders the northern half of the LRNR (Figure 2a, b). Similarly, the Phalaborwa management team identified a high-intensity poaching zone in the far north of the section, which borders the southern half of the LRNR (Figure 2a, b). The Letaba Ranch Nature Reserve therefore appears to function as a gateway for poachers into the KNP, rather than a buffer that restricts the movement of poachers. This reflects the widely held perception of poor management practices and law enforcement within the LRNR. Invasive alien species was also recognised in all three sites as one of the top four threats, with the situation improving in the LRNR and Mahlangeni since 2013 but deteriorating in Phalaborwa. In Mahlangeni, invasive alien plants occur primarily along the Letaba River which flows between the two sections. Periodic flooding of this river results in frequent colonisation of exposed river banks for a variety of alien plant species. While the Phalaborwa section also borders this river, rangers were more concerned with Indian myna (Acridotheres tristis) and large patches of alien vegetation that have emerged in terrestrial areas since 2013, contributing to the doubling of this threat for this section. Rangers ascribed the −200% worsening of IAS to staff shortages in the section, claiming that there are not enough people to regularly clear alien plants. In the LRNR, the extent and intensity of IAS invasion are not as well researched as in the KNP, but there are several known patches along the Groot Letaba River (Figure 2a, b). In Mahlangeni, rangers attributed the 70% reduction in the IAS threat to successful control completed in the same manner as in the LRNR, on an ad hoc basis (LEDET 2013). However, the threat map for Mahlangeni did not reflect this, with only a minimal decrease in area in 2017 compared to 2013 but with continued urgency and intensity of the problem (Figure 2b). The geospatial data for fishing indicated that illegal fishing in Mahlangeni only takes place on the western side of the section, again suggesting that the LRNR acts as a conduit for illegal fishermen into the KNP. The Letaba Ranch Nature Reserve rangers indicated no specific areas where fishing was prevalent and spatially defined the threat as present along the entire length of the two largest rivers flowing through the reserve. The discrepancy, between the MTRA results and extent of fishing, indicated on the threat maps implies that rangers either overestimated the reduction in this threat or have a poorer ability of spatially describing the threat. Garbage and solid waste were recognised as a threat in both the LRNR and the Mahlangeni section of the KNP. It was identified as a threat to wildlife, which may get entangled in waste or die from consuming it. In the LRNR, garbage is being dumped across the fence into the LRNR (Figure 2a, b). The western part of the reserve is primarily (but not only) being affected, probably because the fence is more easily accessible from the road that runs along the border. Rangers try to collect as much garbage as they can during patrols, but this is not a priority. In Mahlangeni, solid waste is brought into the section by the Klein Letaba River from outside the park. During the dry season, when the management staff start eradicating IAS along the river, they also collect deposited garbage. Again, direct threats that originate from outside our study sites should be addressed by relevant authorities both within and outside the PAs. Finally, in all three sites, rangers identified fire as crucial to the health of savanna ecosystems, as long as it is managed and controlled. However, (illegal) runaway fires were identified as a threat in both sections of the KNP. Possible causes of these uncontrolled fires could be fires lit in the rural and urban areas, as well as along the roads to the west of the study area, which can then spread to the east because of westerly winds in the spring, or fires lit by poachers. Additional management challenges The large increases for most threats found in the study suggest that management of both the buffer reserve and the studied sections of the KNP should be improved. Discussions with rangers and managers revealed that governance is a key problem in the LRNR, particularly in the northern MNR part. According to the strategic plan (LEDET 2013), that portion of the reserve should be managed jointly with the Mthimkhulu community and a co-management agreement was being drafted in 2013. However, during the MTRA workshop, it was clear that the LEDET management staff from the LRNR have a strong opinion that only they manage the entire area and made no mention of a co-management agreement or any sort of cooperation between the LEDET and the community. Interviews conducted with the community Chief and Mthimkhulu reserve manager suggest that the community is not benefitting from the reserve; hunting quotas are currently non-existent and they do not receive any other sort of compensation. The community also employs its own guards who supervise the north entrance to the reserve and conduct bike patrols. The fact that these stakeholders have a very different perception of the LRNR management constrains cohesion among managing institutions, increasing vulnerability to threats (as evidenced by negative MTRA index scores), and threatens the long-term resilience of both the LRNR and proximate sections of the KNP (Cumming et al. 2015). Poor governance seems to be the key reason why the LRNR does not function as an effective buffer, which has been demonstrated to inhibit conservation efforts both locally (Anthony, Scott & Antypas 2010) and in a wider variety of contexts (Lockwood 2010). In our case, questions concerning good governance principles of legitimacy, inclusiveness and connectivity emerged which necessitate further investigation now that their impacts on managing threats to biodiversity have been elucidated. It is clear that a more co-ordinated effort by diverse management institutions is needed in this buffer area which cannot be sidestepped if threat mitigation is to improve (Palomo et al. 2014). This is of particular importance if the KNP and the LEDET would like to enhance adaptive management as a key component of their overall management strategies (Gaylard & Ferreira 2011). Advantages and limitations of the modified threat reduction assessment Our study confirmed some advantages of the tool, mentioned in earlier studies where TRA was applied (Anthony 2008): it is not time-consuming (no workshop lasted longer than 3 h), does not require previously collected baseline data and enables all workshop participants' opinions to be taken into account, as the workshop moderator can facilitate the discussion and prevent individuals from dominating the discussion. In particular, the workshop setting allows for a more diversified group of participants, where rangers with different levels of experience and knowledge can contribute equally. In case of the MTRA, the added advantage of incorporating worsening and emerging threats into the assessment increases the accuracy and representativeness of the results, a point workshop participants also noted. We suggest that, where appropriate, the MTRA should be routinely utilised by PA management teams as a complementary MEE tool, integrating the geospatial exercise that can assist management teams in synthesising and communicating threat dynamics. There are some disadvantages with the MTRA method, particularly subjectivity in measurements (Anthony 2008; Margoluis & Salafsky 2001). For instance, the discrepancy between the MTRA results and the extent of fishing indicated on the threat maps implies that rangers either overestimated the reduction in this threat or have a poorer ability of spatially describing the threat. However, the high number of participants, although at times making the workshop execution more challenging, increased the objectivity and the validity of the results. Potential bias further originates from the susceptibility to memory loss (Papworth et al. 2009). Sending information about workshops beforehand, encouraging participants to bring supporting documentation about threats and choosing a shorter assessment period (5 years) were all strategies employed to minimise this bias (as suggested in Matar & Anthony 2010). Furthermore, when conducting TRAs, there is a risk of management staff overstating the threat reduction percentage in order to present their PA management as successful (Margoluis & Salafsky 2001), especially if being compared to other PAs. Nonetheless, this problem was not evident in either of the PAs, as workshop participants were willing to assign high negative scores to certain threats, without considering the final TRA index, and were not informed about the intention to conduct workshops in other PAs. Finally, the MTRA tool does not explicitly reveal reasons for threat dynamics (e.g. a decrease in poaching because of decline in rhino numbers) and should be followed by a thorough discussion with management teams. Capturing these nuances and the multifaceted legal and illegal drivers of these threats under the larger threat category remains an important requirement in the MTRA methodology (Anthony 2008) and allows management teams to devise appropriate interventions to address these threats. Spatially defining threats can be an extremely useful tool to incorporate into the MTRA as it allows enhanced analysis of the sources of identified threats in what Cumming et al. (2015) term the 'proximate institutional context' which, in our case, may extend beyond the LRNR and include other buffer areas of the KNP, and beyond. However, a caveat here is related to capacity. In some cases, rangers faced difficulties with spatially describing the threat suggesting either the need for more frequent training workshops or further restricting MTRA workshop participants to those competent in map reading. Based on our experience, in addition to the strategies addressed in Matar and Anthony (2010), we recommend the following: When administering the tool, it is vital to ensure all participants' focus and engagement during the workshop. In our case, some individuals dominated the discussion and restricted full participation of other attendees. Depending on context, it is important to ensure a suitable number of workshop participants (6-8) and plan extra time for workshops, allowing for ample explanations, protracted discussions and/or reaching consensus. During the workshops, to enhance data validity, it is crucial to ensure that any supporting reference material is requested beforehand, accessible and consulted. In cases where multi-level governance structures are in place across PAs, a combined follow-up workshop may be useful to coordinate findings from individual sites, which can contribute to more strategic and collaborative threat mitigation efforts. Conclusion Through the administration of a MTRA tool, a number of threats to biodiversity were explicated in the LRNR and two neighbouring sections of the KNP, Mahlangeni and Phalaborwa. Although some of these threats were reduced, the overall MTRA indices of −33.6% in the LRNR and −14.67% in Phalaborwa indicate that total threats have worsened since the beginning of the assessment period in these two sites. In Mahlangeni, there was a reduction in threats of 13.2%. Five of seven threats, spanning more than one assessment site and believed to be functionally related between the KNP and the LRNR, were discussed in this article. Threat mapping elucidated the probable facilitation of these threats between sites, for example, areas in which poaching incidents were recorded in the KNP are proximally prevalent in the portion of the assessed area which borders the LRNR and are likely facilitated by road networks. Our key finding that the LRNR is currently not serving as an effective buffer to the KNP, manifested in a wide variety of threats and facilitating access to the KNP, may, in large part, be because of poor governance. Further research is required to delineate the drivers and nuances behind this finding, as well as explore other factors which emerged in our study and which may contribute to its relatively poor performance including lack of funding, socio-political factions and confusion over governance responsibilities (Cumming et al. 2015). Acknowledgements The authors would like to thank all workshop participants from the Letaba Ranch Nature Reserve and the Kruger National Park management teams. They also thank the journal editor and two anonymous reviewers for comments on an earlier draft of this article. Competing interests The authors declare that they have no financial or personal relationships that may have inappropriately influenced them in writing this article. Authors' contributions L.M. and B.P.A. designed the research. L.M. carried out the fieldwork and L.M., B.P.A. and A.S. analysed the data and wrote the article. Funding information This research was funded by the Central European University, Master Research Support Program. References Anderson, B., 2012, 'Assessing biodiversity threat mitigation efficacy: A case study of Kakum Conservation Area (2004 to 2012)', Master of Science thesis, Central European University, Budapest. [ Links ] Anthony, B.P., 2008, 'Use of modified threat reduction assessments to estimate success of conservation measures within and adjacent to Kruger National Park, South Africa', Conservation Biology 22(6), 1497-1505. https://doi.org/10.1111/j.1523-1739.2008.01030.x [ Links ] Anthony, B.P., Scott, P. & Antypas, A., 2010, 'Sitting on the fence? Policies and practices in managing human-wildlife conflict in Limpopo Province, South Africa', Conservation & Society 8(3), 225-240. https://doi.org/10.4103/0972-4923.73812 [ Links ] Bengtsson, J., Angelstam, P., Elmqvist, T., Emanuelsson, U., Folke, C., Ihse, M. et al., 2003, 'Reserves, resilience and dynamic landscapes', Ambio 32(6), 389-396. https://doi.org/10.1579/0044-7447-32.6.389 [ Links ] Bertzky, B., Corrigan, C., Kemsey, J., Kenney, S., Ravilious, C., Besancon, C. et al., 2012, Protected Planet report 2012: Tracking progress towards global targets for protected areas, International Union for the Conservation of Nature (IUCN) and United Nations Environment Programme (UNEP)-World Conservation Monitoring Centre (WCMC), Gland and Cambridge. [ Links ] Chape, S., Harrison, J., Spalding, M. & Lysenko, I., 2005, 'Measuring the extent and effectiveness of protected areas as an indicator for meeting global biodiversity targets', Philosophical Transactions of the Royal Society A 360, 443-455. https://doi.org/10.1098/rstb.2004.1592 [ Links ] Coetzer, K.L., Erasmus, B.F.N., Witkowski, E.T.F. & Reyers, B., 2013, 'The race for space: Tracking land-cover transformation in a socio-ecological landscape, South Africa', Environmental Management 52(3), 595-611. https://doi.org/10.1007/s00267-013-0094-9 [ Links ] Convention on Biological Diversity (CBD), 2010, Conference of the Parties (COP) 10, Decision X/31. Protected Areas Section 19(a), viewed 20 June 2017, from http://www.cbd.int/decision/cop/default.shtml?id=12297. [ Links ] Craigie, I.D., Baillie, J.E.M., Balmford, A., Carbone, C., Collen, B., Green, R.E. et al., 2010, 'Large mammal population declines in Africa's protected areas', Biological Conservation 143, 2221-2228. https://doi.org/10.1016/j.biocon.2010.06.007 [ Links ] Cumming, G.S. & Allen, C.R., 2017, 'Protected areas as social-ecological systems: Perspectives from resilience and social-ecological systems theory', Ecological Applications 27(6), 1709-1717. https://doi.org/10.1002/eap.1584 [ Links ] Cumming, G.S., Allen, C.R., Ban, N.C., Biggs, D., Biggs, H.C., Cumming, D.H. et al., 2015, 'Understanding protected area resilience: A multi-scale, social-ecological approach', Ecological Applications 25(2), 299-319. https://doi.org/10.1890/13-2113.1 [ Links ] Department of Environmental Affairs and Tourism (DEAT), 2009, National Biodiversity Framework, Department of Environmental Affairs and Tourism, Pretoria. [ Links ] Driver, A., Sink, K.J., Nel, J.N., Holness, S., Van Niekerk, L., Daniels, F. et al., 2011, National biodiversity assessment 2011: An assessment of South Africa's biodiversity and ecosystems. Synthesis report, South African National Biodiversity Institute and Department of Environmental Affairs, Pretoria. [ Links ] EMS Foundation, 2016, Enough is enough: How South Africa's policies are killing Africa's wild animals. A document prepared for CITES COP 2017, EMS Foundation, Honeydew. [ Links ] Françoso, R.D., Brandão, R., Nogueira, C.C., Salmona, Y.B., Machado, R.B. & Colli, G.R., 2015, 'Habitat loss and the effectiveness of protected areas in the Cerrado biodiversity hotspot', Natureza & Conservação 13(1), 35-40. https://doi.org/10.1016/j.ncon.2015.04.001 [ Links ] Gaston, K.J. & Spicer, J.I., 2004, Biodiversity: An introduction, 2nd edn., Blackwell, Oxford, UK. [ Links ] Gaylard, A. & Ferreira, S., 2011, 'Advances and challenges in the implementation of strategic adaptive management beyond the Kruger National Park - Making linkages between science and biodiversity management', Koedoe 53(2), Art. #1005, 1-8. https://doi.org/10.4102/koedoe.v53i2.1005 [ Links ] Gertenbach, W.P.D., 1983, 'Landscapes of the Kruger National Park', Koedoe 26(1), 9-121. https://doi.org/10.4102/koedoe.v26i1.591 [ Links ] Hansen, A.J., Davis, C.R., Piekielek, N., Gross, J., Theobald, D.M., Goetz, S. et al., 2011, 'Delineating the ecosystems containing protected areas for monitoring and management', BioScience 61(5), 363-373. https://doi.org/10.1525/bio.2011.61.5.5 [ Links ] Hansen, A.J. & DeFries, R., 2007, 'Ecological mechanisms linking protected areas to surrounding lands', Ecological Applications 17(4), 974-988. https://doi.org/10.1890/05-1098 [ Links ] Hockings, M., 2003, 'Systems for assessing the effectiveness of management in protected areas', BioScience 53, 823-832. https://doi.org/10.1641/0006-3568(2003)053[0823:SFATEO]2.0.CO;2 [ Links ] Hockings, M. & Phillips, A., 1999, 'How well are we doing? Some thoughts on the effectiveness of protected areas', Parks 9(2), 5-14. [ Links ] International Union for the Conservation of Nature and Natural Resources (IUCN) - World Commission on Protected Areas (WCPA), 2009, WCPA Strategic Plan 2005-2012, IUCN, Gland. [ Links ] Laurance, W.F., Carolina Useche, D., Rendeiro, J., Kalka, M., Bradshaw, C.J.A., Sloan, S.P. et al., 2012, 'Averting biodiversity collapse in tropical forest protected areas', Nature 489(7415), 290-294. https://doi.org/10.1038/nature11318 [ Links ] Letaba Herald, 2015, 'Letaba Ranch: A nest of corruption', Letaba Herald, viewed 19 July 2018, from http://letabaherald.co.za/15823/letaba-ranch-a-nest-of-corruption/. [ Links ] Leverington, F., Costa, K.L., Courrau, J., Pavese, H., Nolte, C., Marr, M. et al., 2010, Management effectiveness evaluation in protected areas - A global study, 2nd edn., The University of Queensland, Brisbane. [ Links ] Limpopo Department of Economic Development, Environment and Tourism (LEDET), 2013, Five-year strategic plan for the Letaba Ranch Nature Reserve, Limpopo Province, South Africa, Limpopo Department of Economic Development, Environment and Tourism, Polokwane. [ Links ] Lockwood, M., 2010, 'Good governance for terrestrial protected areas: A framework, principles and performance outcomes', Journal of Environmental Management 91, 754-766. https://doi.org/10.1016/j.jenvman.2009.10.005 [ Links ] Margoluis, R. & Salafsky, N., 2001, Is out project succeeding? A guide to threat reduction assessment for conservation, Biodiversity Support Program, Washington D.C. [ Links ] Matar, D. & Anthony, B.P., 2010, 'Application of modified threat reduction assessments in Lebanon', Conservation Biology 24(5), 1174-1181. https://doi.org/10.1111/j.1523-1739.2010.01575.x [ Links ] McCallum, M.L., 2015, 'Vertebrate biodiversity losses point to a sixth mass extinction', Biodiversity and Conservation 24(10), 2.497-2519. https://doi.org/10.1007/s10531-015-0940-6 [ Links ] Palomo, I., Montes, C., Martín-López, B., González, J.A., García-Llorente, M., Alcorlo, P. et al., 2014, 'Incorporating the social-ecological approach in protected areas in the Anthropocene', BioScience 64(3), 181-191. https://doi.org/10.1093/biosci/bit033 [ Links ] Papworth, S.K., Rist, J., Coad, L. & Milner-Gulland, E.J., 2009, 'Evidence for shifting baseline syndrome in conservation', Conservation Letters 2, 93-100. https://doi.org/10.1111/j.1755-263X.2009.00049.x [ Links ] Pimm, S.L., Jenkins, C.N., Abell, R., Brooks, T.M., Gittleman, J.L., Joppa, L.N. et al., 2014, 'The biodiversity of species and their rates of extinction, distribution, and protection', Science 344(6187), 1246752. https://doi.org/10.1126/science.1246752 [ Links ] Ripple, W.J., Chapron, G., López-Bao, J.V., Durant, S.M., Macdonald, D.W., Lindsey, P.A. et al., 2016, 'Saving the world's terrestrial megafauna', Bioscience 66, 807-812. https://doi.org/10.1093/biosci/biw092 [ Links ] Salafsky, N. & Margoluis, R., 1999, 'Threat reduction assessment: A practical and cost-effective approach to evaluating conservation and development projects', Conservation Biology 13, 830-841. https://doi.org/10.1046/j.1523-1739.1999.98183.x [ Links ] Salafsky, N., Salzer, D., Stattersfield, A.J., Hilton-Taylor, C., Neugarten, R., Butchart, S.H.M. et al., 2008, 'A standard lexicon for biodiversity conservation: Unified classifications of threats and actions', Conservation Biology 22(4), 897-911. https://doi.org/10.1111/j.1523-1739.2008.00937.x [ Links ] South African National Parks (SANParks), 2018, Draft Kruger National Park Management Plan 2018-2028, South African National Parks, Skukuza. [ Links ] Swemmer, L.K. & Mmethi, A.H., 2016, Biodiversity for society - A reflection on the diversity of direct, local impacts (benefits and costs) of the Kruger National Park, South African National Parks, Muckleneuk, Pretoria. [ Links ] Thomas, J.A., Telfer, M.G., Roy, D.B., Preston, C.D., Greenwood, J.J.D., Asher, J. et al., 2004, 'Comparative losses of British butterflies, birds, and plants and the global extinction crisis', Science 303(5665), 1879-1881. https://doi.org/10.1126/science.1095046 [ Links ] Tucker, G., 2005, A review of biodiversity conservation performance measures, Earthwatch Institute, Oxford. [ Links ] United Nations (UN), 2017, UN data: A world of information, viewed 03 July 2017, from http://data.un.org/CountryProfile.aspx?crName=south%20africa. [ Links ] United Nations Educational, Scientific and Cultural Organization (UNESCO), 1974, Task force on criteria and guidelines for the choice and establishment of biosphere reserves, MAB Report Series 22, UNESCO, Bonn. [ Links ] United Nations Environment Programme's World Conservation Monitoring Centre (UNEP-WCMC) & International Union for Conservation of Nature (IUCN), 2016, Protected planet report 2016, UNEP-WCMC and IUCN, Cambridge and Gland. [ Links ] Received: 13 Mar. 2018 Appendix 1 ORIGINAL RESEARCH Changes in bird assemblages because of vegetation homogenisation in communal livestock systems Mathew A. HarrisI; Michael D. VoyseyI, II; Samantha-Leigh JamisonI; Michelle GreveI IDepartment of Plant and Soil Sciences, University of Pretoria, Pretoria, South Africa ABSTRACT Protected areas are intended to promote biodiversity representation and persistence; yet, whether they are effective in degraded landscapes where much of the original vegetation structure remains intact has received relatively little attention. We test whether avian assemblages in communal rangelands in savannas differ from savannas supporting a full complement of native herbivores and predators. Birds were surveyed in 36 transect counts conducted over 18 days. We also compare the vegetation structure between the two land-use types to assess whether differences in bird assemblages could be attributed to changes in vegetation structure. Bird assemblages were richer, had greater abundances and different compositions inside protected areas than rangelands. The median body mass of birds was larger inside than outside protected areas, and rangelands supported fewer grassland specialists, but more closed-canopy specialists. However, no differences in feeding guild composition were found between protected areas and communal rangelands. Additionally, vegetation structure, but not richness, differed between protected areas and communal rangelands: communal rangelands had higher densities of woody vegetation and shorter grass height than the protected areas. Our findings suggest that the altered vegetation structure in communal grazing camps has led to changes in the species richness and composition of bird communities and has been selected by closed-canopy specialists at the cost of open grassy specialists. Hunting in communal rangelands is likely to have resulted in the loss of large birds and in reductions in bird abundance in the rangelands. Therefore, land-use management that does not lead to irreversible landscape transformation can nevertheless result in changes in the diversity, composition and functioning of native assemblages. Keywords: avifauna; encroachment; functional composition; hunting; vegetation structure; conservation. Introduction It has been estimated that 52% of the Earth's surface has been modified by human activities such as food production, timber plantations and urban areas (Roser & Ritchie 2018). This has resulted in alterations in the structure and functioning of these systems (Chown 2010; Foley et al. 2005). With human population growth unlikely to stabilise in the 21st century (Gerland et al. 2014), the protection of natural habitats remains paramount for the conservation of biodiversity and the ecosystem services they provide (Dudley, Hockings & Stolton 2010). Even where primary components of habitats have been retained, unprotected landscapes have often been degraded and community assemblages have been altered via either direct (e.g. harvesting) or indirect (e.g. light pollution) impacts by humans, or both (Chown 2010; Gaston et al. 2008; Longcore & Rich 2004). Therefore, the designation and maintenance of protected areas (PAs) remains a key strategy for protecting biodiversity from such pressures globally (Gaston et al. 2008; Joppa & Pfaff 2009; Pimm et al. 2014). A substantial proportion (~40%) of the estimated annual global conservation budget is utilised for establishing, maintaining and improving PAs (Balmford et al. 2015; Chape et al. 2005; James, Gaston & Balmford 1999; Waldron et al. 2013). Yet, despite the enormous investment in PAs annually (~$10 billion, Waldron et al. 2013), only a limited number of studies have explicitly attempted to assess PA ecological effectiveness (e.g. Coetzee, Gaston & Chown 2014; Gray et al. 2016; Greve et al. 2011), with most studies evaluating PA effectiveness in terms of how well the PA prevents landscape cover change (e.g. Andam et al. 2008; Joppa, Loarie & Pimm 2008). However, this measure serves only as a proxy for PA performance, as it cannot capture the implications of land-use change for biodiversity features (Coetzee et al. 2014), especially when considering that the effectiveness of any given PA at conserving features of biodiversity is context specific and often depends on the extent and intensity of local pressures, for example fires or poaching. Thus, individual PAs often show localised differences in measures of their ecological effectiveness (Caro et al. 2009; Gaston et al. 2008; Gray et al. 2016; Laurance et al. 2012). The best measure of PA ecological effectiveness would be a comparison of the current overall biodiversity status for a PA with the biodiversity status that would have been if the PA had not been designated (Coetzee et al. 2014). However, a comparison of this nature cannot be achieved, as it is impossible to know what the biodiversity status of a particular area would have been had a PA not been established. Thus, an alternative is to assess biodiversity before and after PAs were established; but baseline data quantifying biodiversity before PA declaration are rare (see Laurance et al. 2011; Wegge et al. 2009). As a result, assessments of the effectiveness of PAs are assessed differently. For example PA effectiveness is measured based on management decisions and their effects on biodiversity within PAs. Others compare biodiversity features within PAs to areas in the immediate vicinity or to non-protected areas with similar characteristics, that is, using space for time substitutions (Geldmann et al. 2013). Essentially, biodiversity features of areas inside PAs are compared to biodiversity features outside PAs, as these areas would be similar were it not for their land-use designation (Coetzee et al. 2014; Gray et al. 2016; Greve et al. 2011). The assumption is that the areas inside PAs would have experienced land-use changes similar to those outside the PAs, had the PA not been established, and is thus used as a proxy measure of PA ecological effectiveness. The ecological effectiveness of PAs can be considered at different hierarchical and taxonomic levels of organisation of biodiversity, for example species (abundance), communities (richness and assemblage composition) and the functions they perform (Gaston et al. 2006). To maintain biodiversity, PAs must display representation, that is, support a diversity of species (or functions) within their boundaries, and they must allow for persistence of biodiversity and function, that is buffer biodiversity from perturbations (Margules & Pressey 2000) such as climate change (Stevens et al. 2016) or exploitation (Cullen, Bodmer & Pádua 2000). The literature on quantifying PA ecological effectiveness has often focused on comparing biodiversity in PAs to that of adjacent heavily transformed areas, for example agricultural fields, plantations and human settlements (Gardner et al. 2007; Jackson, Evans & Gaston 2009; Hoffmann et al. 2010; Greve et al. 2011; Geldmann et al. 2013). The impacts on biodiversity of areas that have undergone comparatively little habitat transformation remain less well understood (see Greve et al. 2011; Rayner et al. 2014; Sinclair, Mduma & Arcese 2002). Therefore, this study aims to compare the biodiversity features, species assemblages and functional composition of avian fauna within and outside neighbouring PAs, across what once was a homogenous vegetation type within the savanna biome. The land-use outside these PAs is communal rangelands (CRs), which are nearly completely uncultivated semi-natural rangelands, where collective ranching of livestock takes place (Palmer & Bennett 2013). Land-use within the PAs is categorised by minimal anthropogenic disturbance, with the areas being managed for the persistence of biodiversity. The CRs are extractive reserves where resources such as firewood are harvested, and the native herbivores have largely been replaced with livestock, mainly cattle. Several different ecological measures are compared between PAs and the surrounding CRs: species richness, abundance, species assemblage composition and functional differences. This work thus provides valuable insights into understanding how well PAs conserve various measures of biodiversity compared to slightly degraded unprotected habitats. It aids in the growing understanding of how PAs and their surrounding matrix areas can function in unison to conserve various biodiversity features and highlights some of the pressures faced by biodiversity in and around the exemplar Kruger National Park. Methods and materials Study region Surveys were conducted in the Lowveld savanna of South Africa around the Orpen region of the Kruger National Park and Manyeleti Game Reserve, and adjacent CRs belonging to the Mnisi Tribal Authority (Figure 1). Three sites were chosen for each of two different land-use types: PAs and CRs. Of the three study sites in the PAs, two were in the Kruger National Park - one near the Orpen Rest Camp and the other in the Kingfisherspruit section - and the third in the Manyeleti Game Reserve near the Khokomya dam. Communal rangeland sites were located south-west of Kruger and Manyeleti and consisted of three cattle grazing camps: Shorty, Athol and Gottenburg. Each CR site is associated with a village and stocked with varying densities of cattle, and occasionally goats are allowed into the camps to browse (Table 1-A1). Unlike the surrounding villages, the CR grazing camps have experienced no habitat loss per se. They are solely used for grazing and almost exclusively support native vegetation. We therefore consider the CRs to be degraded and not transformed (Rouget et al. 2006). All sites were located in the Gabbro Grassy Bushveld vegetation type, characterised by rich clayey soils, open-savanna, dense low-growing grass cover and scattered trees and shrubs (Mucina & Rutherford 2006). All sites in PAs and CRs were selected to occur on the Timbavati Gabbro intrusion; this was confirmed by using Google Earth imagery (Figure 1). All site selection was primarily based on the presence of entry gates within CRs and waterpoints within PAs. Communal rangeland sites were selected based on whether tribal leaders granted the researchers access to their rangeland. PA site selection was chosen based on proximity to the Orpen gate to ensure bird surveys were completed before 08:30 each morning. The direction of each transect varied depending on the positions of the gates (in CRs), the position of roads (in PAs) and to ensure positioning on the Gabbro soils. The sites in the PAs represent relatively pristine ecosystems that harbour a full set of native herbivores, and regular fires are used as a management strategy. In contrast, CRs are characterised by natural vegetation where wild herbivores have been excluded and replaced with cattle. Low densities of goats occasionally stray into the camps, where their activities are restricted to areas close to the gates. Fire has largely been excluded from CRs, although some wood extraction takes place in the area. The maximum distance between two study sites, namely Kingfisherspruit and Athol, was 30 km and the minimum distance was 4 km (between Athol and Shorty); thus all sites experience similar climatic conditions. Bird sampling All surveys were conducted during January and February 2017; therefore, our findings are representative of summer bird communities. At each of the six sites, three 1-km transects were laid out (Bibby, Jones & Marsden 2000). At each site, the three transects sampled radiated outwards from a focal area of high herbivore activity (i.e. a water point within PAs and a gate from which cattle could actively enter the CRs) (Figure 1-A1). The starting points of transects within a site were at least 150 m apart from one another, and distances between transects increased as one moved further along the transects, as the transects radiated out from one another (Figure 1-A1). The transects were set up to radiate out from focal points, which experience high herbivore activity, to areas of lower herbivore activity, to ensure the highest possible similarity in herbivore density for all transects. Each transect was walked twice on two different mornings and all birds along the transects were recorded. Before starting a transect, the observers waited at the start of the transect for 2 minutes to allow birds to become accustomed to their presence (Bibby et al. 2000). Then a steady pace was walked for the length of the transect (Bibby et al. 2000). The time it took to walk each transect was standardised to not exceed 60 minutes to ensure an equal sampling effort. The average time per transect was 51 minutes. A compass was used to ensure a constant direction was maintained, especially when the surrounding vegetation became thick. All bird observations were made by two observers (M.A.H. and M.D.V.). All birds that were seen or heard on either side of the transect were recorded (Bibby et al. 2000). The distance from the observer to the bird was visually estimated and the angle between the bird and the transect was measured using a compass (Bibby et al. 2000). Both observers' estimates were used to come to an estimated consensus on distance and angle. When birds of the same species occurred in parties, all individuals of the party were counted and recorded as one sighting, with the distance and angle being estimated to the centre of the party to ensure independence of observations (Bibby et al. 2000). The estimated distance from the observer and the angle from the transect line were used to calculate the perpendicular distance from the bird to the transect using Pythagoras theorem (Bibby et al. 2000). Only sightings within the 50 m limit of the transect line were retained (Bibby et al. 2000). Surveys were conducted on mornings between 06:00 and 08:30, during peak bird activity and vocalisation. Surveys were only conducted in mild weather; no transects were surveyed on mornings with high winds or heavy rain. Birds flying over the transect were not recorded (Bibby et al. 2000). The order of transect surveys was randomised as far as possible by land-use type. In addition, repeat samples of the same transect were temporally spaced out over the sampling period (i.e. not conducted on consecutive mornings) between the sampling dates of 09 January and 02 February 2017. Vegetation sampling The composition of avian assemblage in South African savannas is affected by differences in grass and woody vegetation structure (Hudson & Bouwman 2007; Krook, Bond & Hockey 2007; Skowno & Bond 2003). Thus, structural vegetation attributes were recorded for the first 500 m of each transect. Because of time constraints, only the first 500 m of each transect could be sampled. Structural changes in vegetation along the transects happened mostly at the start of the transects close to the water source or gate so that the vegetation measures generated within the first 500 m were fairly representative of the entire transect (Figures 2-A1 and Figure 3-A1). Every 10 m along the transect, a 0.5 m × 0.5 m plot was placed on the ground and the maximum leaf table height (the height of the tallest grass leaf material) of each grass species was recorded, from which the average maximum leaf table height per transect was calculated. In addition, at each plot along the transect all woody individuals greater than 0.5 m in height, within a 2 m radius from the centre of the plot, were recorded, from which the average density of woody individuals per transect was calculated (Voysey 2018). Analyses Sampling adequacy and species diversity The data for the two repeat surveys of each transect were pooled before all analyses. To determine sampling adequacy, transect-based species accumulation curves were constructed (Gotelli & Colwell 2001). Jackknife 1 and Jackknife 2 estimated species richness of the PAs and CRs were calculated to get an estimate of the total species richness by accounting for undetected species. Generalised linear mixed models (GLMMs) were used to test whether land-use type, that is PAs versus CRs, affect the species richness and overall abundance of birds. Structural vegetation variables (average maximum grass leaf table height of the first 500 m of the transect, and average density of woody vegetation above 0.5 m in height of the first 500 m of the transect) were incorporated as predictor variables in the models. Interaction terms of the two structural vegetation variables with land-use were included in the models to determine if their effect depended on land-use. Site was included as a random variable (McCulloch 1996). Models were fitted using a Poisson distribution and a log-link function (Zuur et al. 2009). A full model using all predictor variables was created (global model), from which the best subset model, based on the lowest Akaike information criterion (AIC), was obtained using the dredge function in R (Burnham & Anderson 2002). Bias in abundance or density estimates may occur because of differences in species detectability between land-use types; we thus tested whether land-use influenced species detectability (Coetzee & Chown 2016; Greve et al. 2011; Thomas et al. 2010) (Figures 4-A1 and 5-A1). Since several species were recorded rarely, it was impossible to create species detectability curves for every species. Therefore, a surrogate species approach, where similar species were grouped together, was used (Coetzee & Chown 2016; Greve et al. 2011; Thomas et al. 2010), using the same seven groups identified for the region by Coetzee and Chown (2016). A species detectability curve could not be fit for surrogate group 1 in CRs, that is large-bodied ground nesters, because only two observations were made in CRs. A Pearson correlation analysis was conducted to assess the goodness of fit between true and estimated density for each surrogate bird group, in each of the land-use types, following Coetzee and Chown (2016). This enabled us to determine if there were any differences in detectability between land-uses or the different surrogate bird species groups. Assemblage composition To compare bird species composition between the two land-use types, three approaches were used. First, the number of species that were shared and were unique to each land-use was calculated. Secondly, differences in bird composition between PAs and CRs were explored using non-metric multi-dimensional scaling (nMDS) plots based on species identity and abundance per transect. Species recorded only once were removed and the remaining data were plotted using a Bray-Curtis distance measure. Random restarts were used to obtain the best possible fit for the data in reduced dimensions. A stress plot was created to determine if the representation of the data in reduced dimensions was good or not. Finally, a permutational multivariate analysis of variance (PERMANOVA) was used to test whether land-use was a good predictor of bird species composition. Functional characteristics Body mass is an important characteristic of animals that correlates with many traits, such as reproduction rates and population densities (Brose et al. 2017), and often determines the level of exploitation experienced by a species (Brose et al. 2017; Cullen et al. 2000; Pimm et al. 2014). Therefore, we tested whether the median body mass of birds differed between land-uses (PAs vs. CRs). As the body mass distribution for birds is typically skewed, the median body mass is a more appropriate measure than the mean for analysing body mass data of assemblages (Meiri & Thomas 2007). Therefore, median bird mass was calculated per transect-based on the mass of each individual bird observed per transect in both surveys. Adult body masses for all species were obtained from Greve et al. (2008). We then tested whether median bird body mass per transect differed between land-use types (i.e. PAs vs. CRs) using a GLMM that was fitted with a Gaussian distribution and a log-link function (Zuur et al. 2009). Site was included as a random variable. Woody and grass structural vegetation attributes were additionally included as predictor variables in the model. The best subset model selection followed the same procedure as above (Zuur et al. 2009). Next, birds were assigned to one of five feeding guilds (carnivore, frugivore, mixed feeder, granivore or insectivore) based on diet information that was obtained from Hockey, Dean and Ryan (2005) and categorised by Jamison (2017). Additionally, species were categorised into four habitat preference classes based on whether they spend the majority of their time in open grassy areas, closed wooded areas or a mixture of both of these habitats. Category 1 represents grassland/open-savanna specialists and category 4 represents closed-savanna/thicket/forest specialists. Category 2 and 3 species associate with a mixture of the two types of habitats, however, associating with more open (category 2) or more closed (category 3) habitats, respectively. This categorisation was based on habitat association information from Hockey et al. (2005), following the categorisation of Péron and Altwegg (2015), except that categories were scaled the other way around. Compositional analyses (Aitchison 1982) were performed to test whether the compositions of the feeding guilds and habitat preference categories differed between PAs and CRs. In this analysis, each transect was treated as a vector (i.e. all five classes of feeding guilds [or habitat preference categories] of one transect represented a single composition). The composition, that is the proportion of each class within feeding guilds (or habitat preference categories), was calculated for each transect, per land-use type, within a multi-dimensional space, rather than as an arithmetic mean of each class individually. Separate cluster analyses were conducted for feeding guild and habitat preference category compositions to compare how similar PA and CR transects were in terms of their feeding guild and habitat preference category compositions, respectively. Cluster analyses grouped transects based on the similarity of their functional compositions in the multi-dimensional Euclidean space. Vegetation structure General linear mixed models (LMMs) were run to assess whether tree density and maximum leaf table height differed between land-use types (Zuur et al. 2009). For these analyses, tree density and maximum leaf table height were averaged per transect prior to analyses. Site was included as a random variable. All analyses were conducted in R, version 3.2.6 (R Core Team 2018), using the following packages for the various analyses: vegan (Oksanen et al. 2017) for rarefaction curves, species richness estimates and nMDS plot; Distance (Miller 2017) for detection curves and abundance estimates; lme4 (Bates et al. 2015) for LMMs and GLMMs; MuMIn (Barton 2017) for best subset model based on AIC; and compositions (Van den Boogaart, Tolosana & Bren 2014) for the compositional analysis framework. Ethical considerations The authors do not have any ethical considerations that need to be disclosed for the publication of this article. Results Species diversity The transect-based species accumulation curves for both PA and CR transects began flattening off, though neither reached an asymptote (Figure 6-A1), indicating that several species remained unsampled. Therefore, the raw species richness values for both PAs and CRs should be treated with some caution. Recorded species richness was larger for PAs (94) than for the CRs (74). Jackknife species richness estimates indicated that estimated total species richness was higher within PAs (Jackknife 1: 124.2 ± 11.7; Jackknife 2: 137.1) than within CRs (Jackknife 1: 105.1 ± 13.1; Jackknife 2: 124.8). A significant correlation was seen between the observed density and modelled density of birds for each surrogate group and each land-use (Pearson's r = 0.989; p < 0.001; n = 13) (Figure 7-A1). As a result, we consider the influence of species detectability and the detectability between land-uses as negligible in our study; thus, abundances were not adjusted for detectability (see Coetzee & Chown 2016; Greve et al. 2011; Thomas et al. 2010). The effect of land-use type on species richness was significant, but dependent on grass height (Table 1). Species richness did not change with grass height in PAs, but in CRs it increased with grass height (Figure 8-A1). In addition, species richness was significantly inversely related to increased levels of woody plant density greater than 0.5 m in height, for both CRs and PAs (Table 1, Figure 9-A1). The abundance of birds was significantly higher in PAs than in CRs (Figure 2a; Table 2-A1). In addition, bird abundance was significantly inversely related to increased grass height (Figure 10-A1; Table 2-A1). Assemblage composition Of the 117 species recorded, 48 were common to both land-uses, of which the most common species were the rattling cisticola (Cisticola chiniana), Cape turtle dove (Streptopelia capicola) and white-browed scrub robin (Cercotrichas leucophrys). Forty-four species were unique to PAs, most commonly Senegal lapwing (Vanellus lugubris), Swainson's spurfowl (Pternistes swainsonii) and magpie shrike (Corvinella melanoleuca). In contrast, only 25 species were unique to CRs (Figure 3; Table 3-A1), most commonly white-bellied sunbird (Cinnyris talatala), western cattle egret (Bubulcus ibis) and sombre greenbul (Andropadus importunus). Avian species assemblage composition differed substantially between PAs and CRs (Figure 2b). The PERMANOVA showed that PAs and CRs had significantly different avian species assemblages (global R = 0.335; p < 0.001). An almost equal number of plant species were shared between PAs and CRs as were unique to either PAs or CRs (Figure 11-A1). However, of the 88 species unique to either PAs or CRs, 30 were recorded only once. Functional composition The median body mass of birds was greater in PAs than in CRs (Figure 2c, Table 4-A1). No clear compositional grouping of transects by land-use types (PAs vs. CRs) existed based on feeding guild compositions (Figure 4a). In contrast, cluster analysis grouped communities from PAs and CRs into two distinct clusters based on bird habitat preference composition (Figure 4b). Protected areas had higher proportions of category 1 birds (open grassy habitat specialists, e.g. Senegal lapwing [Vanellus lugubris] and African pipit [Anthus cinnamomeus]), while CRs had higher proportions of category 4 birds (closed-canopy thicket/woodland habitat specialists, e.g. white-browed scrub robin [Cercotrichas leucophrys] and sombre greenbul [Andropadus importunus]) (Figure 12-A1). Indeed, of the species unique to PAs, 37% were category 1 birds, while in CRs this was only 16% (Figure 3). In contrast, PAs had 15% and CRs had 36% of their unique species classified as category 4 species. Vegetation structure Tree density was significantly higher in CRs (mean = 3050 trees per hectare) than in PAs (mean = 884 trees per hectare) (chi-square = 5.62, p = 0.018, df = 1). However, maximum leaf table height did not differ between land-use types (chi-square = 0.42, p = 0.52, df = 1). Maximum leaf table height in CRs was 12.66 cm ± 0.31 (mean ± SE) and in PAs it was 13.23 ± 0.43. Discussion We show that even when habitat change outside PAs involves habitat degradation instead of habitat loss because of transformation, it can still affect bird assemblages. Bird assemblages in PAs were richer, with greater abundances and different composition than assemblages in adjacent CRs. In addition, PAs supported larger bodied species and birds of different habitat preference categories, although there were no differences in the composition of feeding guilds between PAs and CRs. The differences in bird assemblages inside and outside PAs indicate either a significant relationship between formal conservation designation and assemblage structure or reflect declines in the favourability of conditions outside PAs (e.g. homogenisation of vegetation structure). In the Kruger to Canyons Biosphere Reserve, within which this study was conducted, human settlements have expanded by 36%, which has led to a 27% loss of intact savanna vegetation and a 30% increase in thicket vegetation (Coetzer et al. 2010). This will have affected bird assemblage composition. Floristically, areas within and outside the PAs surveyed here, are similar (Voysey 2018), yet structurally the areas outside the PAs have experienced significant levels of woody thickening over the last 70 years (Stevens et al. 2016), which has resulted in a homogenisation of the vegetation structure in CRs. Elsewhere, structural variation of both woody and grassy vegetation is the most important determinant of savanna avian assemblages (Hudson & Bouwman 2007; Krook et al. 2007; Sirami et al. 2009; Skowno & Bond 2003), and may explain why the more open and structurally heterogeneous vegetation of the PAs in this study supported a greater bird species richness, distinct species assemblage composition and a greater incidence of open habitat bird species. The greater avian diversity seen within the structurally more diverse PAs may partially be because of the availability of more niches associated with variable vegetation structure (Hudson & Bouwman 2007). The PAs showed more variation in grass height compared to CRs, where grass was constantly kept short, and showed little variation in grass height because of constant grazing by cattle in these areas (Figure 2-A1) (Voysey 2018). This may explain why increasing grass height had a positive impact on species richness outside PAs, but no effect within PAs: increasing grass height in CRs could provide new niches for birds, but more of the same niches in PAs. Other studies have shown that areas with heterogeneous grass height support more and different grassland bird species than areas that are heavily grazed to homogeneous short grass heights (Dias, Bastazini, & Gianuca 2014; Jacoboski, Paulsen & Hartz 2017). Increased woody vegetation density resulted in declines in the proportion of birds that associate with open grassy areas (category 1) and an increase in the proportion of birds that associate with closed-canopy woody vegetation (category 4). The loss of large open grassy patches outside the PAs because of the corresponding increases in woody vegetation and its effect on homogenising vegetation structure with CRs may explain the observed differences in the proportions of habitat preference categories between the two land-uses. This is in accordance with other studies that have found that woody thickening results in losses of grassland bird species which require open vegetation patches, while benefiting woodland species (Sirami et al. 2009; Skowno & Bond 2003). Indeed, closed-habitat specialists have increased across South Africa and its bordering countries: passerines that are open-savanna specialists have been declining, while closed-savanna specialists have increased across the region, particularly in the eastern parts of South Africa (Péron & Altwegg 2015), where bush encroachment is considered a serious threat (Stevens et al. 2016). Increased pressures on the avifauna (especially in the form of hunting) may have further contributed to the differences in bird assemblages inside and outside PAs. The CRs are extractive reserves for the surrounding villages, as such birds are actively hunted both with slingshots and traps (Vincent Khosa, pers. obs.; pers. comm., 18 January 2017). Elsewhere, hunting in communal areas has caused significant declines in bird numbers (Krook et al. 2007). It appears that people preferentially hunt for large-bodied ground nesters (surrogate species group 1, sensu Coetzee & Chown 2016) (e.g. crested francolin [Peliperdix sephaena] and helmeted guineafowl [Numida meleagris]) as only two observations of this species group were made within CRs, compared to the 117 observations in PAs. Indeed, larger bodied species are usually targeted disproportionately by hunting (Coetzee & Chown 2016; Cullen et al. 2000; Pimm et al. 2014). Thus, hunting pressure may not only contribute to a reduction in avian species richness and abundances, but may also explain why the median body mass of birds was higher in PAs than in CRs. Our results suggest that, because of the reduced human pressures within their boundaries, the PAs in this study are acting as important population source areas for some bird species that are exploited for hunting in the CRs, and possibly also for open habitat bird species (Hansen 2011). However, the CRs also support a rich diversity of savanna bird species (Table 3-A1). Indeed, heavier degradation and more intensive land-use have much greater detrimental impacts on biodiversity (Greve et al. 2011; Newbold et al. 2015). Therefore, the contribution of these areas, along with other unprotected areas globally, to the conservation of birds should not be underestimated (Cox & Underwood 2011). While our study assessed the ecological effectiveness of PAs, it did not assess effectiveness in the broader sense of the word. Overall effectiveness of PAs not only assesses PA contribution to biodiversity conservation, but also considers ecosystem services and social and cultural benefits to communities in and around PAs (Coad et al. 2008; Pringle 2017). Adjacent to the PAs considered in this study, community benefits of PAs are fairly limited; as a matter of fact, some communities incur costs as a result of the PAs (Anthony 2007; Spenceley & Goodwin 2008; Swemmer, Mmethi & Twine 2017). Therefore, ecological effectiveness does not automatically translate into other aspects of PA effectiveness. In a world of increasing population size and per capita food consumption, the need for agriculture, including pastoralism, has never been greater to ensure the well-being of rural communities. Hence, the need to ensure both biodiversity conservation and livelihoods is often considered in assessing PA effectiveness (Swemmer et al. 2017). Upgrading existing protected areas has been suggested as one of the mechanisms by which both biodiversity conservation and livelihood goals can be addressed in and around PAs (Pringle 2017). Some of the eight principles for upgrading PAs are already, or could be, implemented in this area. For example conservation policies already incorporate elements of being long-term and local: government provides long-term funding, and some people from the Mnisi community are employed by businesses associated with the PAs (V. Khosa, pers. comm., 18 January 2017), and involving the youth could raise awareness among younger generations. However, the community remains fairly impoverished, and other principles would be more difficult to implement. These include upsizing the Kruger National Park (KNP) (Pringle 2017). Around the CRs sampled here, the number and extent of human settlements, and the density of people living in settlements, has grown substantially over the last three decades (Coetzer et al. 2010; Giannecchini, Twine & Vogel 2007). Land remains very important for the livelihood of the local community. Therefore, it would be difficult to expand the KNP in this area because of possible wildlife-human conflicts (Anthony, Scott & Antypas 2010). However, these CRs could be viewed as a matrix or buffer area that serves to reduce external pressures on the PA network (Pringle 2017). For example, although there are some changes in bird and plant functional groups, composition and structure between the CRs and PAs, many species are also retained, and this region probably serves as an important area for gene flow and population sustainability for these species. In summary, as upgrading the PA network in this instance might not be a viable option, continued efforts to engage local people from the surrounding areas may be extremely important to see the benefits of, and create ownership for, the PA network in the region (Pringle 2017). This may help to ensure that the wider regional portfolio of birds and their habitats are maintained, so that the entire area, not just the PAs, serves to represent bird biodiversity and helps ensure the persistence of viable populations into the future. While we found that all measures of ecological effectiveness were higher in the PAs compared to surrounding CRs, other studies have found that some of these measures, such as species richness, are higher outside than inside PAs (Coetzee & Chown 2016; Greve et al. 2011). This does not necessarily mean that these PAs are not performing well to represent and conserve biodiversity within their boundaries, but rather that measures of ecological effectiveness are context-and scale-dependent. For example Coetzee and Chown (2016) suggest that a higher observed bird richness outside the KNP is because of the increased vegetation productivity of croplands which experience year-round irrigation, supporting higher numbers of birds than the PA, which experiences large drops in productivity in the dry season. Greve et al. (2011) find higher richness of birds outside than inside one PA, but also significant decreases in specialist guilds, at the expense of generalist guilds, indicating that changes in ecological effectiveness should be considered as a product of all measures. Even PAs that were not necessarily established to protect all of the biodiversity of an area still function as valuable repositories for biodiversity conservation (Greve et al. 2011). Finally, scale can affect the direction of differences in diversity between regions: for example areas with high spatial and temporal beta diversity will show low diversity if measured at local scale, but high diversity if measured at regional scale (Chiarucci et al. 2012). A number of limitations should be considered for this study. We have mainly attributed differences in bird assemblages in PAs and CRs to different land management types. We are confident that land-use plays an important role in explaining these differences. However, some differences in bird assemblages and vegetation characteristics of PAs and CRs may have been driven by the fact that animal densities differed between these land-use types (Voysey 2018), which was impossible to fully control in this study. Furthermore, our study was conducted in one location only; therefore, other regions or land-use types may have different outcomes (Coetzee & Chown 2016; Greve et al. 2011). Additionally, we assessed impacts of degradation in only one location. Other regions may show different trends, depending on land-use changes and community characteristics (Coetzee & Chown 2016; Greve et al. 2011). Finally, we assessed only mid-summer bird assemblages; winter and spring assemblages may show different responses to land-use. Of all the species we recorded, 17% were migrants. Conclusion In summary, landscape degradation, though not as extreme a process as landscape transformation, leads to changes in bird assemblages. Nevertheless, degraded habitats remain important habitats for a range of bird species, and their contribution to the protection of avian diversity should not be underestimated. Acknowledgements The authors thank the South African National Parks and Mpumalanga Tourism and Parks Agency for providing them with access to the research sites within the protected areas. A special thanks to field rangers Thomas Rikombe and Happy Magena. Tribal leaders of the Mnisi Tribal Authority are thanked for granting access to the three communal rangeland sites. A special thanks to Vincent Khosa for his support as field assistant in the communal rangeland sites. Competing interests The authors declare that they have no financial or personal relationships that may have inappropriately influenced them in writing this article. Authors' contributions M.A.H. led all aspects of the project. The project was conceptualised by M.G., who was involved in all aspects of the project. M.D.V. contributed to experimental design, advice regarding the project, fieldwork and analyses. S.-L.J. contributed to the data. All authors contributed to the writing of the manuscript. Funding information This work was funded by the South African National Research Foundation (grant no. 98889 and 110734). Data availability statement Data is available on request from the corresponding author. Disclaimer The views and opinions expressed in this article are those of the author(s) and do not necessarily reflect the official policy or position of any affiliated agency of the authors. References Aitchison, J., 1982, 'The statistical analysis of compositional data', Journal of the Royal Statistical Society: Series B 44(2), 139-177. https://doi.org/10.1111/j.2517-6161.1982.tb01195.x [ Links ] Andam, K.S., Ferraro, P.J., Pfaff, A., Sanchez-Azofeifa, G.A. & Robalino, J.A., 2008, 'Measuring the effectivness of protected area networks in reducing deforestation', Proceedings of the National Academy of Sciences of the United States of America 105(42), 16089-16094. https://doi.org/10.1073/pnas.0800437105 [ Links ] Anthony, B.P., 2007, 'The dual nature of parks: Attitudes of neighbouring communities towards Kruger National Park, South Africa', Environmental Conservation 34(3), 236-245. https://doi.org/10.1017/S0376892907004018 [ Links ] Anthony, B.P., Scott, P. & Antypas, A., 2010, 'Sitting on the fence? Policies and practices in managing human-wildlife conflict in Limpopo province, South Africa', Conservation and Society 8(3), 225-240. https://doi.org/10.4103/0972-4923.73812 [ Links ] Balmford, A., Green, J.M.H., Anderson, M., Beresford, J., Huang, C., Naidoo, R. et al., 2015, 'Walk on the wild side: Estimating the global magnitude of visits to protected areas', PLoS Biology, 13(2), e1002074. https://doi.org/10.1371/journal.pbio.1002074 [ Links ] Barton, K., 2017, MuMIn: Multi-Model inference, R package, version 1.40.0., viewed 15 October 2017, from https://CRAN.R-project.org/package=MuMIn [ Links ] Bates, D., Maechler, M., Bolker, B. & Walker, S., 2015, 'Fitting linear mixed-effects models using lme4', Journal of Statistical Software 67(2015), 1-48. https://doi.org/10.18637/jss.v067.i01 [ Links ] Bibby, C., Jones, M. & Marsden, S., 2000, Expedition field techniques: Bird surveys, BirdLife International, Cambridge. [ Links ] Brose, U., Blanchard, J.L., Eklof, A., Galiana, N., Hartvig, M., Kalinkat, R.H.M.G. et al., 2017, 'Predicting the consequences of species loss using size-structured biodiversity approaches', Biological Reviews 92(2), 684-697. https://doi.org/10.1111/brv.12250 [ Links ] Burnham, K.P. & Anderson, D.R., 2002, Model selection and mulitmodel inference, 2nd edn., Springer-Verlag, New York. [ Links ] Caro, T., Gardner, T.A., Stoner, C., Fitzherbert, E. & Davenport, T.R.B., 2009, 'Assessing the effectiveness of protected areas: Paradoxes call for pluralism in evaluating conservation performance', Diversity and Distributions 15(1), 178-182. https://doi.org/10.1111/j.1472-4642.2008.00522.x [ Links ] Chape, S., Harrison, J., Spalding, M. & Lysenko, I., 2005, 'Measuring the extent and effectiveness of protected areas as an indicator for meeting global biodiversity targets', Philosophical Transactions of the Royal Society B 360(1454), 443-455. https://doi.org/10.1098/rstb.2004.1592 [ Links ] Chiarucci, A., Bacaro, G., Filibeck, G., Landi, S., Machcherini, S. & Scoppola, A., 2012, 'Scale dependence of plant species richness in a network of protected areas', Biodiversity and Conservation 21(2), 503-516. https://doi.org/10.1007/s10531-011-0196-8 [ Links ] Chown, S.L., 2010, 'Temporal biodiversity change in transformed landscapes: A southern African perspective', Philosophical Transactions of the Royal Society B 365(1558), 3729-3742. https://doi.org/10.1098/rstb.2010.0274 [ Links ] Coad, L., Campbell, A., Miles, L. & Humphries, K., 2008, The costs and benefits of protected areas for livelihoods: A review of the current literature, Working paper, UNEP World Conservation Monitoring Centre, Cambridge, UK. [ Links ] Coetzee, B.W.T. & Chown, S.L., 2016, 'Land-use change promotes avian diversity at the expense of species with unique traits', Ecology and Evolution 6(21), 7610-7622. https://doi.org/10.1002/ece3.2389 [ Links ] Coetzee, B.W.T., Gaston, K.J. & Chown, S.L., 2014, 'Local scale comparisons of biodiversity as a test for global protected area ecological performance: A meta-analysis', PLoS One 9(8), e105824. https://doi.org/10.1371/journal.pone.0105824 [ Links ] Coetzer, K.L., Erasmus, B.F.N., Witkowski, E.T.F. & Bachoo, A.K., 2010, 'Land-cover change in the Kruger to Canyons Biosphere Reserve (1993-2006): A first step towards creating a conservation plan for the subregion, South African Journal of Science 106(7/8), 1-10. https://doi.org/10.4102/sajs.v106i7/8.221 [ Links ] Cox, R.L. & Underwood, E.C., 2011, 'The importance of conserving biodiversity outside protected areas in Mediterranean ecosystems', PLoS One 6(1), e14508. https://doi.org/10.1371/journal.pone.0014508 [ Links ] Cullen, L., Bodmer, R.E. & Pádua, C.V., 2000, 'Effects of hunting in habitat fragments of the Atlantic forests, Brazil', Biological Conservation 95(1), 49-56. https://doi.org/10.1016/S0006-3207(00)00011-2 [ Links ] Dias, R.A., Bastazini, V.A.G. & Gianuca, A.T., 2014, 'Bird-habitat associations in costal rangelands of southern Brazil', Iheringia Série Zoologia 104(1), 200-208. https://doi.org/10.1590/1678-476620141042200208 [ Links ] Dudley, N., Hockings, M. & Stolton, S., 2010, 'Precious places: Getting the arguments right', in S. Stolton & N. Dudley (eds.), Arguments for protected areas: Multiple benefits for conservation and use, pp. 253-265, Earthscan Ltd, London. [ Links ] Foley, J.A., DeFries, R., Asner, J.P., Barford, C., Bonan, G., Carpenter, S.R. et al., 2005, 'Global consequences of land use', Science 309(5737), 570-574. https://doi.org/10.1126/science.1111772 [ Links ] Gardner, T. A., Caro, T., Fitzherbert, E.B., Banda, T. & Lalbhai P., 2007, 'Conservation value of multiple-use areas in East Africa', Conservation Biology 21(6), 1516-1525. https://doi.org/10.1111/j.1523-1739.2007.00794.x [ Links ] Gaston, K.J., Charman, K., Jackson, S.F., Armsworth, P.R., Bonn, A., Briers, R.A. et al., 2006, 'The ecological effectiveness of protected areas: The United Kingdom', Biological Conservation 132(1), 76-87. https://doi.org/10.1016/j.biocon.2006.03.013 [ Links ] Gaston, K.J., Jackson, S.F., Cantú-Salazar, L. & Cruz-Piñón, G., 2008, 'The ecological performance of protected areas', Annual Review of Ecology, Evolution, and Systematics 39(1), 93-113. https://doi.org/10.1146/annurev.ecolsys.39.110707.173529 [ Links ] Geldmann, J., Barnes, M., Coad, L., Craigie, I.D., Hockings, M. & Burgess, N.D., 2013, 'Effectivness of terrestrial protected areas in reducing habitat loss and population declines', Biological Conservation 16(1), 230-238. https://doi.org/10.1016/j.biocon.2013.02.018 [ Links ] Gerland, P., Raftery, A.E., Ševčíková, H., Li, N., Gu, D., Spoorenberg, T. et al., 2014, 'World population stabilization unlikely this century', Science 346(6206), 234-239. https://doi.org/10.1126/science.1257469 [ Links ] Giannecchini, M., Twine, W. & Vogel, C., 2007, 'Land-cover change and human-environment interactions in a rural cultural landscape in South Africa', The Geographical Journal 173(1), 26-42. https://doi.org/10.1111/j.1475-4959.2007.00227.x [ Links ] Gotelli, N. & Colwell, R.K., 2001, 'Quantifying biodiversity: Procedures and pitfalls in the measurement and comparison of species richness', Ecology Letters 4(4), 379-391. https://doi.org/10.1046/j.1461-0248.2001.00230.x [ Links ] Gray, C.L., Hill, S.L., Newbold, T., Hudson, L.N., Borger, L., Contu, S. et al., 2016, 'Local biodiversity is higher inside than outside terrestrial protected areas worldwide', Nature Communications 7, 12306. https://doi.org/10.1038/ncomms12306 [ Links ] Greve, M., Chown, S.L., Van Rensburg, B.J., Dallimer, M. & Gaston, K.J., 2011, 'The ecological effectiveness of protected areas: A case study for South African birds', Animal Conservation 14(3), 295-305. https://doi.org/10.1111/j.1469-1795.2010.00429.x [ Links ] Greve, M., Gaston, K.J., Van Rensburg, B.J. & Chown, S.L., 2008, 'Environmental factors, regional body size distributions and spatial variation in body size of local avian assemblages', Global Ecology and Biogeography 17(4), 514-523. https://doi.org/10.1111/j.1466-8238.2008.00388.x [ Links ] Hansen, A.J., 2011, 'Contribution of source-sink theory to protected area science', in J. Liu, V. Hall, A. Morzillo & J. Wiens (eds.), Sources, sinks and sustainability across landscapes, pp. 339-360, Cambridge University Press, Cambridge. [ Links ] Hockey, P.A.R., Dean, W.R.J. & Ryan, P.G., 2005, Roberts birds of southern Africa, Trustees of the John Voelcker Bird Book Fund, Cape Town. [ Links ] Hoffmann, M., Hilton-Taylor, C., Angulo, A., Bohm, M., Brooks, T.M., Butchart, S.H. et al., 2010. 'The impact of conservation on the status of the world's vertebrates', Science 330(6010), 1503-1509. https://doi.org/10.1126/science.1194442 [ Links ] Hudson, A. & Bouwman, H., 2007, 'Different land-use types affect bird communities in the Kalahari, South Africa', African Journal of Ecology 45(3), 423-430. https://doi.org/10.1111/j.1365-2028.2006.00750.x [ Links ] Jackson, S.F., Evans, K.L. & Gaston, K.J., 2009, 'Statutory protected areas and avian species richness in Britain', Biodiversity and Conservation 18(8), 2143-2151. https://doi.org/10.1007/s10531-009-9578-6 [ Links ] Jacoboski, L.I., Paulsen, R.K. & Hartz, S.M., 2017, 'Bird-grassland associations in protected and non-protected areas in southern Brazil', Perspectives in Ecology and Conservation, 15(2), 109-114. https://doi.org/10.1016/j.pecon.2017.05.002 [ Links ] James, A.N., Gaston, K.J. & Balmford, A., 1999, 'Balancing the earth's accounts', Nature 401(6751), 323-324. https://doi.org/10.1038/43774 [ Links ] Jamison, S.-L. 2017, 'Unlocking bird-tree relationships: Exploring biogeographical patterns across southern Africa', MSc thesis, Dept. of Plant and Soil Sciences, University of Pretoria. [ Links ] Joppa, L.N., Loarie, S.R. & Pimm, S.L., 2008, 'On the protection of "protected areas"', Proceedings of the National Academy of Sciences of the United States of America 105(18), 6673-6678. https://doi.org/10.1073/pnas.0802471105 [ Links ] Joppa, L.N. & Pfaff, A., 2009, 'High and far: Biases in the location of protected areas', PLoS One 4(12):e8273. https://doi.org/10.1371/journal.pone.0008273 [ Links ] Krook, K., Bond, W.J. & Hockey, P.A.R., 2007, 'The effect of grassland shifts on the avifauna of a South African savanna', Ostrich 78(2), 271-279. https://doi.org/10.2989/OSTRICH.2007.78.2.24.104 [ Links ] Laurance, W.F., Camargo, J.L.C., Luizão, R.C.C., Laurance, S.G., Pimm, S.L., Bruna, E.M. et al., 2011, 'The fate of Amazonian forest fragments: A 32-year investigation', Biological Conservation 144(1), 56-67. https://doi.org/10.1016/j.biocon.2010.09.021 [ Links ] Laurance, W.F., Useche, D.C., Rendeiro, J., Kalka, M., Bradshaw, C.J., Sloan, S.P. et al, 2012, 'Averting biodiversity collapse in tropical forest protected areas', Nature 489(7415), 290-294. [ Links ] Longcore, T. & Rich, C., 2004, 'Ecological light pollution', Frontiers in Ecology and the Environment 2(4), 191-198. https://doi.org/10.1890/1540-9295(2004)002[0191:ELP]2.0.CO;2 [ Links ] Margules, C.R. & Pressey, R.L., 2000, 'Systematic conservation planning', Nature 405(6783), 243-254. https://doi.org/10.1038/35012251 [ Links ] McCulloch, C.E., 1996, 'An introduction to generalized linear mixed models', Applied Statistics in Agriculture 10(1), 1-17. https://doi.org/10.4148/2475-7772.1314 [ Links ] Meiri, S. & Thomas, G., 2007, 'The geography of body size - challenges of the interspecific approach', Global Ecology and Biogeography 16(6), 689-693. https://doi.org/10.1111/j.1466-8238.2007.00343.x [ Links ] Miller, D.L., 2017, Distance: Distance sampling detection function and abundance estimation, R package, version 0.9.7., viewed 03 August 2017, from https://CRAN.R-project.org/package=Distance [ Links ] Mpumalanga Department of Agriculture and Land Administration, 1997, Institute for Soil, Climate and Water - Soils clay layer for Mpumalanga part of the Kruger National Park (KNP), received from SANParks GIS Lab, September 2018. [ Links ] Mucina, L. & Rutherford, M.C. (eds.), 2006, The vegetation of South Africa, Lesotho and Swaziland, Strelitzia 19, Pretoria. [ Links ] Newbold, T., Hudson, L.N., Hill, S.L.L., Contu, S., Lysenko, I., Senior, R.A. et al. 2015, 'Global effects of land use on local terrestrial biodiversity', Nature 520(7545), 45-50. https://doi.org/10.1038/nature14324 [ Links ] Oksanen, J., Blanchet, F.G., Friendly, M., Kindt, R., Solymos, P., Henry, M. et al., 2017, Vegan: Community ecology package, R package, version 2.4-3., viewed 18 July 2017, from https://CRAN.R-project.org/package=vegan [ Links ] Palmer, A.R. & Bennett, J.E., 2013, 'Degradation of communal rangelands in South Africa towards an improved understanding to inform policy', African Journal of Range and Forage Science 30(1-2), 57-63. https://doi.org/10.2989/10220119.2013.779596 [ Links ] Péron, G. & Altwegg, R., 2015, 'Twenty-five years of change in southern African passerine diversity: Nonclimatic factors of change', Global Change Biology 21(9), 3347-3355. https://doi.org/10.1111/gcb.12909 [ Links ] Pimm, S. L., Jenkins, C.N., Abell, R., Brooks, T.M., Gittleman, J.L., Joppa, L.N. et al., 2014, 'The biodiversity of species and their rates of extinction, distribution, and protection', Science 344(6187), 987-999. https://doi.org/10.1126/science.1246752 [ Links ] Pringle, R.M., 2017, 'Upgrading protected areas to conserve wild biodiversity', Nature 546(7656), 91-99. https://doi.org/10.1038/nature22902 [ Links ] R Core Team, 2018, R: A language and environment for statistical computing, version 3.5.0, computer program, R Foundation for Statistical Computing, Vienna, Austria. [ Links ] Rayner, L., Lindenmayer, D.B., Wood, J.T., Gibbons, P. & Manning, A.D., 2014, 'Are protected areas maintaining bird diversity?', Ecography 37(1), 43-53. https://doi.org/10.1111/j.1600-0587.2013.00388.x [ Links ] Roser, M. & Ritchie, H., 2018, 'Yields and land use in agriculture', in OurWorldInData.org, viewed 29 November 2018, from https://ourworldindata.org/yields-and-land-use-in-agriculture [ Links ] Rouget, M., Jonas, Z., Cowling, R.M., Desmet, P.G., Driver, A., Mucina, L. et al. 2006, 'Ecosystem status and protection levels of vegetation types', in L. Mucina & M.C. Rutherford (eds.), The vegetation of South Africa, Lesotho and Swaziland, pp. 724-737, Strelitzia 19, Pretoria. [ Links ] Sinclair, A.R., Mduma, S.A. & Arcese, P., 2002, 'Protected areas as biodiversity benchmarks for human impact: Agriculture and the Serengeti avifauna', Proceedings: Biological Sciences 269(1508), 2401-2405. https://doi.org/10.1098/rspb.2002.2116 [ Links ] Sirami, C., Seymour, C., Midgley, G. & Barnard, P., 2009, 'The impact of shrub encroachment on savanna bird diversity from local to regional scale', Diversity and Distributions 15(6), 948-957. https://doi.org/10.1111/j.1472-4642.2009.00612.x [ Links ] Skowno, A.L. & Bond, W.J., 2003, 'Bird community composition in an actively managed savanna reserve, importance of vegetation structure and vegetation composition', Biodiversity and Conservation 12(11), 2279-2294. https://doi.org/10.1023/A:1024545531463 [ Links ] Spenceley, A. & Goodwin, H., 2008, 'Nature-based tourism and poverty alleviation: Impacts of private sector and parastatal enterprises in and around Kruger National Park, South Africa', Current Issues in Tourism 10(2-3), 255-277, https://doi.org/10.2167/cit305.0 [ Links ] Stevens, N., Erasmus, B.F., Archibald, S. & Bond, W.J., 2016, 'Woody encroachment over 70 years in South African savannahs: Overgrazing, global change or extinction aftershock?', Philosophical Transactions of the Royal Society B 371(1703), 20150437. https://doi.org/10.1098/rstb.2015.0437 [ Links ] Swemmer, L., Mmethi, H. & Twine, W., 2017, 'Tracing the cost/benefit pathway of protected areas: A case study of the Kruger National Park, South Africa', Ecosystem Services 28, 162-172. https://doi.org/10.1016/j.ecoser.2017.09.002 [ Links ] Thomas, L., Buckland, S.T., Rexstad, E.A., Laake, J.L., Strindberg, S. & Hedley, S.L., 2010, 'Distance software: Design and analysis of distance sampling surveys for estimating population size', Journal of Applied Ecology 47(5), 5-14. https://doi.org/10.1111/j.1365-2664.2009.01737.x [ Links ] Van den Boogaart, K.G., Tolosana, R. & Bren, M., 2014, Compositions: Compositional data analysis, R package, version 1.40-1, viewed 22 September 2017, from https://CRAN.R-project.org/package=compositions [ Links ] Voysey, M.D., 2018, 'The influence of wildlife and livestock herbivore assemblages on grazing lawn flora', MSc thesis, Dept. of Plant and Soil Sciences, University of Pretoria. [ Links ] Waldron, A., Mooers, A.O., Miller, D.C., Nibbelink, N., Redding, D., Kuhn, T.S. et al., 2013, 'Targeting global conservation funding to limit immediate biodiversity declines', Proceedings of the National Academy of Sciences of the United States of America 10(29), 12144-12148. https://doi.org/10.1073/pnas.1221370110 [ Links ] Wegge, P., Odden, M., Pokharel, C.P. & Storaas, T., 2009, 'Predator-prey relationships and responses of ungulates and their predators to the establishment of protected areas: A case study of tigers, leopards and their prey in Bardia National Park, Nepal', Biological Conservation 142, 189-202. https://doi.org/10.1016/j.biocon.2008.10.020 [ Links ] Zuur, A., Ieno, E.N., Walker, N., Saveliev, A.A. & Smith, G.M., 2009, Mixed effects models and extensions in ecology with R, Springer-Verlag, New York. [ Links ] Received: 21 May 2018 Appendix 1 ORIGINAL RESEARCH A bimodal pollination system enhances reproductive potential of translocated populations of an endangered grassland succulent Peter G. JansenI; Stefan J. SiebertI; Frances SiebertI; Johnnie van den BergI; Anine JordaanII IUnit for Environmental Sciences and Management, North-West University, Potchefstroom, South Africa ABSTRACT A major concern during the translocation of higher plant species is related to habitat suitability and the availability of pollination services. Should these not meet the requirements of the plant, then successful reproduction and establishment cannot occur. We studied an endangered succulent, Frithia humilis, which had previously been translocated to typical and atypical habitats, to assess the occurrence of potential pollinators at these sites. Insects visiting F. humilis flowers and showing signs of pollen were captured, preserved and studied using a scanning electron microscope. Pollen of F. humilis was searched for. Abundance and diversity patterns of these pollen carriers across edaphic habitats of translocated populations were compared with those in a natural occurring population. Pollination success of guilds was compared amongst translocated F. humilis populations by considering the number of seedlings in a new season. Across F. humilis populations, Hymenopteran species had the largest pollen loads, making this a Melittophilous pollination system, typical for the Aizoaceae. Additionally, Anemophilous syndrome was described for translocation sites which provide reserve pollinators. Fruit formation was more favourable in suitable edaphic habitat on Ecca sandstones. Presence of seedlings at both translocation sites was indicative of successful pollination events of the self-incompatible species, but recruitment was proportionally higher in suitable habitat. Habitat suitability, in the case of this threatened species, is more of a limiting factor than pollination services after a translocation event. Keywords: Aizoaceae; coal mining; conservation ecology; Frithia humilis; mesembryanthemaceae. Introduction Frithia humilis Burgoyne is an endangered, cryptic, dwarf succulent in the Aizoaceae (Burgoyne & Krynauw 2005; Burgoyne, Smith & Du Plessis 2000). It is endemic to the Rand Highveld Grassland of Gauteng and Mpumalanga in South Africa, specifically the area between Bronkhortspruit, Ogies and Middelburg. Here it is restricted to flat sandstone plates of the Dwyka and Ecca formations in microhabitats comprising aggregates of weathered rock and organic materials (Burgoyne & Hoffman 2011). The succulent leaves of the species generally grow from beneath the soil surface (a typical window plant), seldom protruding more than 20 mm above ground level. The leaves are contractile, allowing the plant to retract into the soil where it is protected from desiccation and frost in the winter months (Burgoyne et al. 2000). Consequently, leaves of this species are only visible during active growth, specifically when flowering during the summer months (Figure 1a). In 2008, a population of F. humilis was discovered at a coal mine in the north of eMalahleni after a mining license had already been granted (Harris et al. 2014). In situ conservation was impossible because of the destructive nature of open-cast mining practices. Considering the species' endangered status (Burgoyne & Krynauw 2005), translocation was regarded as a last resort to save the population (Godefroid et al. 2011; Gordon 1994). Translocation is the process whereby a population of living organisms is deliberately moved from one area to another suitable habitat within its existing distribution range (IUCN 2013). Consequently, conservation agencies translocated the population to pre-selected receptor sites (Burgoyne & Hoffmann 2011). A rapid pre-translocation habitat assessment was conducted to assess the suitability of receptor sites in terms of substrate, ecological integrity, genetic impacts and long-term protection (Burgoyne & Hoffmann 2011). A major critique of such rapid assessments is that in-depth assessments of pollinators are generally lacking (Forup et al. 2008), putting the translocated population at risk, especially in the case of a self-incompatible species such as F. humilis (Harris, Van den Berg & Siebert 2016). However, it could be argued that by the very nature of a translocation the number of plant individuals should be high enough to attract pollinators from elsewhere in the distribution range and provide for their dietary requirements (Menz et al. 2011). The translocation of F. humilis provided an ideal opportunity to test whether the pollination guild of the translocated populations is similar to that of a naturally occurring population. Knowledge of this provides a measure to gauge whether a population is only reproducing because of chance pollination, or it persists because of effective pollination (Montalvo et al. 1997). A poorly functioning pollination system can have several genetic consequences (Armstrong & Seddon 2008; Montalvo et al. 1997; Moritz 1999) and may sooner or later affect population viability, eventually leading to population extinction (Kearns & Inouye 1997). Johnson (2010) has called for pollination research in South Africa to improve our understanding of the role of pollination niches for the maintenance of plant species diversity in a rapidly changing environment. This study heeds the call to supplement existing knowledge concerning the pollinators of F. humilis (Harris et al. 2016). It highlights the importance of pollination studies in translocation initiatives and provides insight into the status of a biotic factor that could limit reproductive success after a founder population was established in a harsh environment. Flowers of Frithia humilis The flowers of F. humilis are 15 mm-20 mm in diameter and white with a yellow centre (Figure 1a, b). The petals, especially towards the tip, are occasionally tinged pink. Flowers are either carried on very short stalks or are entirely stalkless. The pollen is yellow and tricolpate (Figure 2). The sepals resemble the leaves and form a short tube (Burgoyne et al. 2000). Frithia flowers are self-incompatible (Burgoyne et al. 2000), a common characteristic of South African Aizoaceae (Mayer & Pufal 2007). After pollination the flowers turn yellow or pink before expiring (Figure 1b), which may serve as an indication to pollinators that the flower is pollinated and without reward (Burgoyne et al. 2000). Based on familial pollination syndromes (Hartmann 1991), F. humilis flowers could be Melittophilous because they are wide open, petals are shiny, whitish and open diurnally (from mid-morning to mid-afternoon) for several days. Pollen is less abundant than in most Melittophilous species but easily accessible. Further support for this syndrome is the self-incompatible sexual phase, with flowers reported to have a distinct male phase (protandrous) followed by a female phase approximately 4 days later (Hammer 1995; Hartmann 1991). Stigmata are initially shorter than stamens, elongating and emerging only at the beginning of the female phase when the male phase ends. Research method and design Study area and site selection Two sites were chosen as receptor sites based on pre-selected criteria (Burgoyne & Hoffmann 2011) for plants translocated from a coal mine (Figure 3). Half of the affected population was translocated to typical Ecca Group sandstone which corresponded with the geology of the donor site. The other half of the population was translocated to less ideal outcrops of the sedimentary Wilge River Formation of the Waterberg Group to test whether other related rock types could serve as an alternative should mining activities warrant future translocations (Harris et al. 2014). Insect observations Qualitative observations for pollinators were made at the receptor sites of Goedvertrouwdt and Eagle's Rock, and a large, natural population at Ezemvelo Nature Reserve. As the flowers open only on sunny days, observations were made on non-overcast days of March 2016 and insects that visited the flowers were collected by hand. One observation session (of 3.5 h) was performed per day to coincide with the flowering time of the species for each population, on 3 suitable days (Table 1). Three 1-m2 patches with most flowers were visually estimated and demarcated at each site for observation. One person per patch observed for pollinators for the entire period of anthesis from 11:30 to 15:00. Thus 10.5 h of observation was conducted per population. Insects alighting or foraging on flowers were captured using an insect net and those species observed for the first time were euthanised in a killing jar with ethyl acetate. These specimens and a set of duplicates were then stored in individually marked containers for later identification and pollen assessments. Repeat visitors of the same species were only counted and released. Verification of pollen and insect identification All euthanised specimens were photographed with a Nikon AZ1000 stereomicroscope to assist in identification and scanned for pollen grains. Particular attention was paid to the head and legs, where pollen was most likely to be found. Those specimens carrying pollen were sputter-coated with a thin gold-palladium layer and inspected under an FEI Quanta FEG 250 scanning electron microscope (SEM) and micrographs of relevant pollen loads were taken. Duplicate insect specimens were pinned and labelled as prescribed by Uys and Urban (2006) and submitted to the Biosystematics Division of the Plant Protection Research Institute of the Agricultural Research Council (ARC) for identification (Appendix 1). Identification to species level was hampered by the taxonomic impediment whereby large numbers of species still require classification or have gone undiscovered (Eardley, Gikungu & Schwarz 2009). Verification of F. humilis pollen was based on pollen micrographs in Burgoyne et al. (2000). Plant counts In each of the three subplots per population, all the adult plants and flowers were counted according to the technique described by Harris et al. (2014). The fruits were counted per subplot 30 days later. To estimate seed set per capsule in each subplot, 20 capsules were removed from plants bordering on the subplot (after 6 months) and the seeds were counted to determine the mean number of seeds per capsule. The sites were revisited after the first follow-up rains in October 2017 to count the seedlings per subplot. Ethical considerations Ethical clearance was obtained from the North-West University. This article followed all ethical standards for research without direct contact with human or animal subjects. Results Pollinator diversity A total of 46 insects were captured whilst alighting on F. humilis flowers. These comprised nine different species of which six were hymenopterans and three were dipterans (Table 2). No lepidopterans were captured during this survey although species were observed making darting visits to Frithia flowers. Harris et al. (2016) did record two butterfly species alighting on Frithia flowers but these were void of pollen. At Goedvertrouwdt, 14 individuals belonging to six species were recorded, with Exoprosopa eluta (Loew) (Hymenoptera: Bombyliidae) being the most frequent visitor (five records) of Frithia flowers (Table 2). Species of Lipotriches (Gerstaecker) (Hymenoptera: Bombyliidae) and Quartinia (André) (Hymenoptera: Vespidae) were recorded the most at Eagle's Rock Private Estate (Table 2). At Ezemvelo Nature Reserve, 26 individuals (four species) were captured, with Amegilla fallax (Smith) (Hymenoptera: Apidae) and E. eluta accounting for 65% of the visitations (Table 2). Pollen carriers Harris et al. (2016) already provided evidence that the bees Amegilla fallax and Megachile niveofasciata (Friese) (Hymenoptera: Megachilidae), together with the bee fly E. eluta, carry F. humilis pollen. Scanning electron microscope evidence reported here was, therefore, specifically aimed at the five newly captured flower visitors and also on recaptured Lipotriches sp. previously identified as a potential pollen carrier by Harris et al. (2016). Frithia pollen was found in varying amounts on the selected insect specimens and these species are therefore considered pollen carriers (Table 2). Some pollen grains were visible on Notolomatia sp. (Figure 4), on and immediately adjacent to the mouth parts. Although only three pollen grains were found on the abdomen of Paragus sp. (Figure 5), a significant clump of Frithia pollen was found directly on the anus of the specimen. Pollen found on the Quartinia sp. (Figure 6) was sparsely distributed over its entire body. Copious amounts of pollen were found beneath the mouth parts of the Ammophila sp. (Figure 7). Halictidae specimens (Seladonea sp. and Lipotriches sp.) (Figures 8 and 9) were carrying copious amounts of Frithia pollen, particularly in their pollen baskets. Pollination system The two translocation sites and the control populations were situated in an area of approximately 200 km2. Within this area, three bee species (A. fallax, Lipotriches sp. and M. niveofasciata) were recorded from at least two of the sites (Figure 10) and a bee fly species, E. eluta, was recorded from all three sites (Table 2). The 39 flower visits by these four species accounted for 85% of all recorded visitations. This indicates that the pollination system of F. humilis is dominated by generalist bee pollinators that carry medium to high loads of pollen. Although the bee fly was a more regular flower visitor (14 visits), its pollen load was low (Table 2). Reserve pollinators were observed at Goedvertrouwdt and Eagle Rock Private Estate (Figure 10). These pollinators were mostly flies and wasps and generally had medium to low pollen loads. A sweat bee (Seladonea sp.) was only recorded from Goedvertrouwdt and had a high pollen load. These five reserve pollinators accounted for 15% of flower visitations. Pollination success When mature plants, flowers, fruits and seedlings were compared across sites per 1 m2, Ezemvelo Nature Reserve had significantly higher numbers, as would be expected for a natural population (Table 3). However, no significant differences were recorded between the typical and atypical habitats. Plants from Ezemvelo Nature Reserve had the highest number of flowers as a percentage of total number of mature plants, with fruit set as a percentage of flowers the highest for the sites at Goedvertrouwdt and Ezemvelo Nature Reserve (Table 3). As this study was conducted 7 years after translocation, it may be assumed that the seed bank would make a minor contribution to recruitment and that recent seed production is a consequence of recent flowering seasons. Based on this premise, seedling emergence at Goedvertrouwdt receptor site as a percentage of seed numbers was considerably higher than that of the control population and is indicative of viable seed (Table 3). Considering the 7-year time span since translocation, the presence of six pollinators (Figure 10) and seedlings, it can be deduced that effective pollination is taking place. Discussion Flower visitation and pollen carriers Exoprosopa and Notolomatia of the Bombyliidae are primarily Afrotropical in occurrence (Greathead & Evenhuis 2001). Larvae are either predators or parasitoids, whilst adult flies in most genera are adapted for nectar feeding. Female flies also feed on pollen for reproductive purposes and many of them have special adaptations for the collection of pollen (Greathead et al. 2006). Bombyliidae are most active during sunny middays that coincide with the anthesis of F. humilis. Little is known about their role as pollinators; it is generally believed that most of them are generalists (Szucsich & Krenn 2002) although some specialised relationships are known (Johnson & Steiner 1997). The small number of pollen grains on the Notolomatia specimen could be a consequence of the species or individuals (the inherent interested in pollen), the gender of the specimen (male flies may not be as interested in pollen, if at all) and the fact that the specimen was captured as soon as it landed on the flower, thereby shortening its potential visitation time. Larvae of the hover fly genus Paragus (Diptera: Syrphidae) are recognised as aphid predators (Hayat & Claussen 1997), whilst adult flies are nectar feeders. Female flies consume pollen because it is a rich protein source necessary for reproduction (Haslett 1989). Even if pollen is consumed and digested by all syrphids, it still retains its shape after passing through the gut, making identification possible (Holloway 1976). This explains the large cluster of pollen grains from F. humilis and other plant species on the anus of the specimen. The specimen only foraged for a short period before it was captured. Although the pollen load was low on the insect itself, the pollen cluster on the anus suggested that it had recently fed on F. humilis pollen. The Halictidae, represented by the species Lipotriches and Seladonea in this study, is the second largest family of bees with over 3500 members. Many of them are pollen specialists with distinctive adaptations for collecting nectar and/or pollen from a small number of closely related plant species (Danforth et al. 2008). In southern Africa, these non-apis bees visit numerous plant families but the most predominant is the Aizoaceae, along with Asteraceae, Fabaceae and Zygophyllaceae (Gess & Gess 2004a). Gess and Gess (2004a) reported that as many as 13 different plant families may be visited by a single species but visitation records pointed to preferences for certain families. Seladonea sp., for example, seemed to prefer Asteraceae compared with other families. However, when considering the species richness and diversity of the Halictidae, along with their polylectic manner of feeding, it can be concluded with a reasonable degree of certainty that they are important pollinators for many seed-bearing plants (Dikmen 2007). All of the collected Halictidae specimens displayed a typical pollen collection behaviour, which explains the copious amounts of pollen observed on their bodies and in their pollen baskets. Ammophila is a genus of thread-waisted wasps in the Sphecidae well known to be parasitic and predatory in nature. Preferences for specific flowers are known amongst the genera of Sphecidae but such relationships are not as strong as in bees or masarids (Bohart & Menke 1976). Spechids, in general, feed on a variety of food including nectar, honeydew and bodily fluids of their prey. Genera with short tongues seek nectar from flowers with short corollas such as the Apiaceae, Asteraceae, Euphorbiaceae and Polygonaceae (Gess & Gess 1991). Ammophila has elongated mouthparts that enable it to feed on a greater variety of flowers. Flowers known to be visited by Ammophila include Acanthaceae, Apiaceae and Lamiaceae (Gess & Gess 1991; Herrera 1989; Weaving 1989). The captured Ammophila specimen was observed to make precise efforts to probe the nectaries of the F. humilis flower by circumnavigating the flower in such a way to ensure contact between the anthers and the underside of its mouth parts where pollen grains were found. All species of pollen wasps (Vespidae), including those belonging to the genus Quartinia, are nectar feeders and pollen collectors (Gess & Gess 2010). Of the 40 species recorded to visit flowers, 75% preferred the Aizoaceae. Quartinia is also generally regarded as an effective pollinator for many Aizoaceae species and numerous specialised relationships have been noted (Gess & Gess 2004b, 2010). During the survey, one of the Quartinia specimens continued to forage in a F. humilis flower even after the hand net was placed over it and the flower. Even though little pollen was found on the specimen, the fact that all species of Quartinia are pollen feeders and collectors indicate that this genus may be an efficient reserve pollinator of F. humilis (Gess & Gess 2010). Pollination system Although few specimens (46 individuals) of pollen carriers were captured during this study, our observations provided enough evidence to support the hypothesis presented by Hartmann (1991) that F. humilis belongs to the Melittophilous syndrome, thus being pollinated mostly by bee and bee-like pollinators. This was especially the case for the natural F. humilis population at Ezemvelo Nature Reserve, where bee pollinators were predominant. At translocated sites, additional observations were made of flies and the Ammophila wasps which support the presence of Anemophilous syndrome and imply a bimodal pollination system. These 'reserve' pollinators (Johnson, Harris & Procheş 2009) associated with the Anemophilous syndrome provide plausible alternatives for the translocated populations. However, it must be cautioned that even though specimens might carry F. humilis pollen, it does not conclusively prove that any of these species are pollinators. In addition, the amount of pollen on a pollinator's body is regarded as an unreliable determinant of efficiency (Adler & Irwin 2006). Identifying a primary pollinator depends on the pollination efficiency of the species, which is defined as the amount of con-specific pollen transferred to a stigma in any one visit (Inouye et al. 1994). However, determining pollination efficiency is problematic because pollination is a highly variable ecological interaction and can be influenced by factors such as pollinator abundance across years, flower visit duration and frequency, contact with flower parts as well as pollen removal and deposition (Ivey, Martinez & Wyatt 2003). With this in mind, the bees Amegilla fallax, Megachile niveofasciata and Lipotriches sp. that form part of the Melittophilous syndrome are cautiously proposed as primary pollinators of F. humilis because of their higher visitation frequencies and larger pollen loads. The sweat bee, Seladonea sp., could also be a primary pollinator because of its higher observed pollen loads, despite only being observed twice. Whilst pollen load may not be a direct indication of pollination efficiency, the larger pollen loads of bees compared with other F. humilis visitors were particularly evident on SEM micrographs. The number of observations recorded as visitation frequency is also in favour of bees compared with the various other species. One generalist pollinator, E. eluta, was observed at all sites but is likely an inefficient pollinator because of the limited amount of pollen found only on the eyes (Harris et al. 2016). Further evidence for bee pollination is supported by the pollination system of a closely related species, Bergeranthus multiceps (Aizoaceae), from spring and autumn rainfall areas of the Eastern Cape Province, South Africa. This plant is also self-incompatible and flowers open between 15:30 and 18:30. Bees were determined to be the most important pollinators to this species, placing it in the Melittophilous syndrome (Peter et al. 2004). Other potential pollinators included butterflies, bees and hover flies belonging to the families Bombyliidae, Tachinidae and Syrphidae (Peter et al. 2004). This study and Harris et al. (2016) made similar observations for F. humilis. Pollination syndromes may maximise successful pollination by a specific species whilst still reserving the option for chance pollination by a less suitable species. The non-Melittophilous Frithia pollen carriers are suggested to be reserve pollinators because of their frequent visits and exclusive occurrence in translocated populations. They are primarily wasp and fly species that form part of an Anemophilous syndrome. Whilst bees may be primary pollinators, the small size and isolation of F. humilis populations supports the idea that F. humilis is a generalist rather than a specialist, and it can rely on reserve pollinators as its flower structure allows pollination by a different syndrome. A bimodal pollination system has also been identified previously for a member of the Ruschioideae in the Aizoaceae (Zietsman 2013). Pollination efficacy Pollination was equally successful at the natural and translocated Goedvertrouwdt populations although flower density differed (Harris et al. 2014). This is in accordance with the flower density hypothesis (Pufal et al. 2008). Flower density is known to have a strong influence on pollinator visits (Kunin 1997) but the size of the population had little effect on pollination efficacy. In other words, more flowers do not imply higher proportional frequencies of pollination. Seedling recruitment per seed quantity was the highest for Goedvertrouwdt, but this could be ascribed to lower plant densities and more suitable niches (Eriksson & Ehrlen 1992). Eagle's Rock has a different geology and as expected did not have ideal conditions for seedling germination and establishment (Harris et al. 2014). The presence of seedlings, therefore, is no indication of pollination efficacy but only that successful pollination takes place. This indicates that at least some of the pollen carriers recorded in this study are also pollinators. Implications for translocation science This study showed that plant populations translocated to atypical habitats and geology had lower levels of fruit formation despite having higher levels of flowering compared to translocated populations of typical habitat. Site selection is important and should be performed carefully to avoid plant stressors and nutrient deficiencies which may affect plant and flower health, and the availability of pollen (Mayer 2004). Reduced flowering can affect the number of pollinators that may visit a population and might limit outcrossing in small populations resulting in pollen transfer between relatives or not being pollinated at all (Kearns & Inouye 1997). The sparsely populated translocated sites had higher levels of fruit set and seedling occurrence per individual than the natural population. This shows that it is important to consider transplant density for xenogamous species, as too high densities influence the available pollinators and could result in many unpollinated flowers, which could restrict geneflow in the newly established population. Pufal et al. (2008) suggested that decreased density of flowers increases pollination success and fruit set per plant as pollinators are known to be scarce, with a few taxa accounting for most of the flowers at a site (Herrera 1989). Translocation requires relocating a species to areas within its existing distribution range (IUCN 2013). This study has shown that generalist pollinators of F. humilis occur throughout its natural distribution range and are common and mobile enough to locate newly established populations. Translocation is therefore a low risk conservation option in terms of generalist plant species. Pollination is further enhanced by the bimodal pollination system that is characteristic for some of members of the Aizoaceae (Zietsman 2013), which makes them resilient to shifts within their distribution range. Conclusion Nine arthropod species have now been confirmed as F. humilis pollen carriers. Hymenopteran species had the largest pollen loads in pollen baskets and on front legs. This positioning of pollen ensures contact with the stigmata of the open flowers of F. humilis and could result in effective pollination. The pollination system is Melittophilous as would be expected for the family, with an Anemophilous syndrome providing reserve pollinators at translocation sites. The presence of seedlings at both translocation sites was indicative of successful pollination by insects of this self-incompatible species. Pollination of flowers was proportionally similar between the varying population densities of natural and translocated populations on Ecca sandstone. This indicated that flower density did not influence fruit formation in this species. When the two translocated populations were compared, it was evident that fruit formation was more effective on Ecca sandstone. This indicated that reproductive success of this edaphic specialist decreases on non-typical rock habitats. Micro-habitat conditions, planting density and locality within the species' natural distribution range require an in-depth understanding before sites are selected to enhance pollination probability. However, even if predictions based on this are not accurate, it can be assumed that generalist and 'reserve' pollinators are widespread and abundant enough to locate translocated populations of F. humilis within the natural distribution range of the species. It can be concluded that pollinators are not limiting factors when this species is translocated. Acknowledgements The authors thank Dr Duncan MacFayden (Manager: Research and Conservation at E. Oppenheimer & Son) for providing access to the Frithia population at Ezemvelo Nature Reserve. They are grateful to the landowners for providing access to translocated populations at Eagle's Rock Private Estate and Goedvertrouwdt Farm and giving permission to collect insect specimens on their properties. Mr Scott van Eeden prepared the locality map and Mr Koos Smit photographed the species in habitat. Competing interests The authors declare that they have no financial or personal relationships that may have inappropriately influenced them in writing this article. Authors' contributions P.G.J. conducted fieldwork and species identification and wrote part of the manuscript. S.J.S. designed the study, conducted initial surveys and wrote part of the manuscript. F.S. contributed to the writing of the manuscript and data analyses. J.v.d.B. performed sorting of arthropod material and coordinated the identification of pollinators. A.J. conducted scanning electron microscopy. Funding information Financial assistance for this study was provided by the National Research Foundation (Grant UID: 103370). Data availability statement Data sharing is applicable to this article as new data were created or analysed in this study. Disclaimer Opinions expressed and conclusions arrived at in the article are those of the authors and are not necessarily to be attributed to the National Research Foundation (NRF). References Adler, L.S. & Irwin, R.E., 2006, 'Comparison of pollen transfer dynamics by multiple floral visitors: Experiments with pollen and fluorescent dye', Annals of Botany 97(1), 141-150. https://doi.org/10.1093/aob/mcj012 [ Links ] Armstrong, D.P. & Seddon, P.J., 2008, 'Directions in reintroduction biology', Trends in Ecology and Evolution 23(1), 20-25. https://doi.org/10.1016/j.tree.2007.10.003 [ Links ] Bohart, R.M. & Menke, A.S., 1976, Sphecid wasps of the world: A generic revision, University of California Press, Berkeley. [ Links ] Burgoyne, P.M., Smith, G.F. & Du Plessis, F., 2000, 'Notes on the genus Frithia (Mesembryanthemaceae) and the description of a new species, F. humilis, in South Africa', Bothalia 30(1), 1-7. https://doi.org/10.4102/abc.v30i1.531 [ Links ] Burgoyne, P.M. & Krynauw, S., 2005, Frithia humilis Burgoyne, National Assessment: Red List of South African Plants version 2017.1, South African National Biodiversity Institute, viewed 19 March 2018, from http://redlist.sanbi.org/species.php?species=126-3. [ Links ] Burgoyne, P.M. & Hoffmann, A., 2011, 'Frithia humilis - notes on the translocation of a Red Listed succulent', Aloe 48(2), 38-42. [ Links ] Danforth, B.N., Eardley, C., Packer, L., Walker, K., Pauly, A. & Randrianambinintsoa, F.J., 2008, 'Phylogeny of Halicitidae with an emphasis on the African Halictinae', Apidologie 39(1), 86-101. https://doi.org/10.1051/apido:2008002 [ Links ] Dikmen, F., 2007, 'The role and the importance of the family Halictidae (Apiformes: Apoidea) in pollination of natural and agricultural vegetation', Mellifera 7, 16-19. [ Links ] Eardley, C.D., Gikungu, M. & Schwarz, M.P., 2009, 'Bee conservation in Sub-Saharan Africa and Madagascar: Diversity, status and threats', Apidologie 40(3), 355-366. https://doi.org/10.1051/apido/2009016 [ Links ] Eriksson, O. & Ehrlén, J., 1992, 'Seed and microsite limitation of recruitment in plant populations', Oecologia 91(3), 360-364. https://doi.org/10.1007/BF00317624 [ Links ] Forup, M.L., Henson, K.S., Craze, P.G. & Memmott, J., 2008, 'The restoration of ecological interactions: Plant-pollinator networks on ancient and restored heathlands', Journal of Applied Ecology 45(3), 742-752. https://doi.org/10.1111/j.1365-2664.2007.01390.x [ Links ] Gess, F.W. & Gess, S.K., 1991, 'A preliminary survey of the aculeate wasps and the bees of the lower reaches of the Nossob River Valley, Kalahari Gemsbok National Park, South Africa', Koedoe 34(2), 77-88. https://doi.org/10.4102/koedoe.v34i2.424 [ Links ] Gess, S.K. & Gess, F.W., 2004a, 'A comparative overview of flower visiting by non-Apis bees in the semi-arid to arid areas of southern Africa', Journal of the Kansas Entomological Society 77, 602-618. https://doi.org/10.2317/E7.1 [ Links ] Gess, S.K. & Gess, F.W., 2004b, 'Distributions of flower associations of pollen wasps (Vespidae: Masarinae) in southern Africa', Journal of Arid Environments 57(1), 17-44. https://doi.org/10.1016/S0140-1963(03)00093-4 [ Links ] Gess, S.K. & Gess, F.W., 2010, Pollen wasps and flowers in southern Africa, SANBI Biodiversity Series 18, South African National Biodiversity Institute, Pretoria. [ Links ] Godefroid, S., Piazza, C., Rossi, G., Buord, S., Stevens, A.D., Aguraiuja, R. et al., 2011, 'How successful are plant species reintroductions?', Biological Conservation 144(2), 672-682. https://doi.org/10.1016/j.biocon.2010.10.003 [ Links ] Gordon, D., 1994, 'Translocation of species into conservation areas: A key for natural resource managers', Natural Areas Journal 14(1), 31-37. [ Links ] Greathead, D.J. & Evenhuis, N.L., 2001, 'Annotated keys to the genera of African Bombylioidea (Diptera: Bombyliidae; Mythicomyiidae)', African Invertebrates 42(1), 105-224. [ Links ] Greathead, D.J., Lovell, S., Barraclough, D., Slotow, R., Hamer, M. & Herbert, D., 2006, 'An ecological and conservation assessment of the fauna of Bombyliidae (Diptera) occurring in the Mkhuze, Phinda and False Bay reserves, KwaZulu-Natal, South Africa', African Invertebrates 47(1), 185-206. [ Links ] Hammer, S., 1995, 'Mastering the art of growing mesembs', Cactus and Succulent Journal 67, 195-247. [ Links ] Harris, E., Siebert, S.J., Smit, J.H.L. & Van den Berg, J., 2014, 'Translocation of an endangered succulent plant species from sandstone outcrops earmarked for coal mining', Journal of the Southern African Institute of Mining and Metallurgy 114(11), 904-912. [ Links ] Harris, E., Van den Berg, J. & Siebert, S.J., 2016, 'Notes on the pollinators of Frithia humilis Burgoyne, an endangered Highveld succulent', African Entomology 24(1), 250-256. https://doi.org/10.4001/003.024.0250 [ Links ] Hartmann, H.E.K., 1991, 'Mesembryanthema', Contributions from the Bolus Herbarium 13, 75-157. [ Links ] Haslett, J.R., 1989, 'Adult feeding by holometabolous insects: Pollen and nectar as complementary nutrient sources for Rhingia campestris (Diptera: Syrphidae)', Oecologia 81(3), 361-363. https://doi.org/10.1007/BF00377084 [ Links ] Hayat, R. & Claussen, C., 1997, 'A new species and new records of the genus Paragus Latreille, 1804 from Turkey (Diptera: Syrphidae)', Zoology in the Middle East 14(1), 99-108. https://doi.org/10.1080/09397140.1997.10637710 [ Links ] Herrera, C.M., 1989, 'Pollinator abundance, morphology, and lower visitation rate: Analysis of the "quantity" component in a plant-pollinator system', Oecologia 80(2), 241-248. https://doi.org/10.1007/BF00380158 [ Links ] Holloway, B.A., 1976, 'Pollen-feeding in hover-flies (Diptera: Syrphidae)', New Zealand Journal of Zoology 3(4), 339-350. https://doi.org/10.1080/03014223.1976.9517924 [ Links ] Inouye, D.W., Gill, D.E., Dudash, M.R. & Fenster, C.B., 1994, 'A model and lexicon for pollen fate', American Journal of Botany 81(12), 1517-1530. https://doi.org/10.1002/j.1537-2197.1994.tb11462.x [ Links ] International Union for Conservation of Nature (IUCN), 2013, Guidelines for reintroductions and other conservation translocations, IUCN, Gland. [ Links ] Ivey, C.T., Martinez, P. & Wyatt, R., 2003, 'Variation in pollinator effectiveness in swamp milkweed, Asclepias incarnata (Apocynaceae)', American Journal of Botany 90(2), 214-225. https://doi.org/10.3732/ajb.90.2.214 [ Links ] Johnson, S.D. & Steiner, K.E., 1997, 'Long-tongued fly pollination and evolution of floral spur length in the Disa draconis complex (Orchidaceae)', Evolution 51(1), 45-53. https://doi.org/10.1111/j.1558-5646.1997.tb02387.x [ Links ] Johnson, S.D., 2010, 'The pollination niche and its role in the diversification and maintenance of the southern African flora', Philosophical Transactions of the Royal Society B 365(1539), 499-516. https://doi.org/10.1098/rstb.2009.0243 [ Links ] Johnson, S.D., Harris, L.F. & Procheş, Ş., 2009, 'Pollination and breeding systems of selected wildflowers in a southern African grassland community', South African Journal of Botany 75(4), 630-645. https://doi.org/10.1016/j.sajb.2009.07.011 [ Links ] Kearns, C.A. & Inouye, D.W., 1997, 'Pollinators, flowering plants, and conservation biology', Bioscience 47(5), 297-307. https://doi.org/10.2307/1313191 [ Links ] Kunin, W.E., 1997, 'Population size and density effects in pollination: Pollinator foraging and plant reproductive success in experimental arrays of Brassica kaber', Journal of Ecology 85(2), 225-234. https://doi.org/10.2307/2960653 [ Links ] Mayer, C., 2004, 'Pollination services under different grazing intensities', International Journal of Tropical Insect Science 24(1), 96-103. https://doi.org/10.1079/IJT20047 [ Links ] Mayer, C. & Pufal, G., 2007, 'Investigation of breeding systems for four Aizoaceae species in Namaqualand, South Africa', South African Journal of Botany 73(4), 657-660. https://doi.org/10.1016/j.sajb.2007.06.001 [ Links ] Menz, M.H.M., Phillips, R.D., Winfree, R., Kremen, C., Aizen, M.A., Johnson, S.D. et al., 2011, 'Reconnecting plants and pollinators: Challenges in the restoration of pollination mutualisms', Trends in Plant Science 16(1), 4-12. https://doi.org/10.1016/j.tplants.2010.09.006 [ Links ] Montalvo, A.M., Williams, S.L., Rice, K.J., Buchmann, S.L., Cory, C., Handel, S.N. et al., 1997, 'Restoration biology: A population biology perspective', Restoration Ecology 5(4), 277-290. https://doi.org/10.1046/j.1526-100X.1997.00542.x [ Links ] Moritz, C., 1999, 'Conservation units and translocations: Strategies for conserving evolutionary processes', Hereditas 130(3), 217-228. https://doi.org/10.1111/j.1601-5223.1999.00217.x [ Links ] Peter, C.I., Dold, A.P., Barker, N.P. & Ripley, B.S., 2004, 'Pollination biology of Bergeranthus multiceps (Aizoaceae) with preliminary observations of repeated flower opening and closure', South African Journal of Science 100(11-12), 624-629. [ Links ] Pufal, G., Mayer, C., Porembski, S. & Jürgens, N., 2008, 'Factors affecting fruit set in Aizoaceae species of the Succulent Karoo', Basic and Applied Ecology 9(4), 401-409. https://doi.org/10.1016/j.baae.2007.06.001 [ Links ] Szucsich, N.U. & Krenn, H.W., 2002, 'Flies and concealed nectar sources: Morphological innovations in the proboscis of Bobyliidae (Diptera)', Acta Zoologica 83(3), 183-192. https://doi.org/10.1046/j.1463-6395.2002.00111.x [ Links ] Weaving, A.J.S., 1989, 'Nesting strategies in some southern African species of Ammophila (Hymenoptera: Sphecidae)', Journal of Natural History 23(1), 1-16. https://doi.org/10.1080/00222938900770011 [ Links ] Uys, V.M. & Urban, R.P., 2006, How to collect and preserve insects and arachnids, 2nd edn., Plant Protection Research Institute, Queenswood. [ Links ] Zietsman, P.C., 2013, 'Reproductive biology of Stomatium bolusiae (Aizoaceae: Ruschioideae)', Bothalia 43(1), 23-27. https://doi.org/10.4102/abc.v43i1.83 [ Links ] Received: 27 Nov. 2018 REVIEW ARTICLE The management dilemma: Removing elephants to save large trees Michelle D. HenleyI, II; Robin M. CookII IApplied Behavioural Ecology and Ecosystem Research Unit, School of Environmental Sciences, University of South Africa, Pretoria, South Africa ABSTRACT The loss of large trees (> 5 m in height) in Africa's protected areas is often attributed to the impact by savanna elephants (Loxodonta africana). Concerns have been raised over large tree mortality levels in protected areas such as South Africa's Kruger National Park (KNP) and in the past, the need to manage its elephant population in order to preserve large trees and biodiversity as a whole. Our review aims to synthesise and discuss the complexities of managing elephants' effects on the landscape to ensure the survival of large trees, as well as the application purposes of the various lethal and non-lethal elephant mitigation strategies. We further critically evaluate past management strategies, which have solely focused on controlling elephant numbers to protect large trees. Past mitigation strategies focused on managing elephant impact by directly reducing elephant numbers. However, maintaining elephant numbers at a pre-determined carrying capacity level did not prevent the loss of large trees. Research on large tree survival in African savannas has continually exposed the complexity of the situation, as large tree survival is influenced at various demographic stages. In some cases, a coalescence of historical factors may have resulted in what could be perceived as an aesthetically appealing savanna for managers and tourists alike. Furthermore, the past high density of surface water within the KNP homogenised elephant impact on large trees by increasing the encounter rate between elephants and large trees. Our review evaluates how current mitigation strategies have shifted from purely managing elephant numbers to managing elephant distribution across impact gradients, thereby promoting heterogeneity within the system. Additionally, we discuss each mitigation strategy's occurrence at various landscape scales and its advantages and disadvantages when used to manage impact of elephant on large trees. Keywords: elephant impact; conceptual model; Kruger National Park; Loxodonta africana; mitigation strategies; spatial and temporal distribution. Introduction In South Africa, where savanna elephant (Loxodonta africana) populations and large trees have co-existed on fenced-off landscapes such as within the Kruger National Park (KNP), the impact of elephants on large trees is viewed by some as unsustainable (Asner et al. 2016; Edge et al. 2017). State officials and conservation managers are continuously involved in discussions concerned with managing the impacts of elephants in an attempt to protect large trees and maintain the natural system in an 'ideal' state, usually based on colonial historical records (Kerley et al. 2008) or driven by tourist perceptions or expectations of an aesthetic landscape (Edge et al. 2017). These records, however, coincide with the near-extermination of elephants in South Africa from over 100 000 individuals, as a consequence of recreational and subsistence hunting (Whyte 2001). Furthermore, an outbreak of rinderpest in the 19th century resulted in a herbivore population crash, decreasing the numbers of smaller browsers that would usually feed on tree seedlings (Skarpe et al. 2004). In the post-culling era, elephant numbers have steadily increased (Ferreira, Greaver & Simms 2017), although their distribution ranges have decreased as a result of fencing off protected areas (Whyte 2001). South Africa is therefore dealing with the complexities of managing increasing elephant numbers in restricted ranges or landscapes with homogenous resource distribution, where an 'ideal' environmental state is the conservation goal to benefit tourism. The present management strategy of the South African National Parks is focused on how elephants use their resources in relation to their distribution rather than absolute elephant numbers (Ferreira et al. 2017; SANParks 2012). The interplay between elephants and large trees is complex to the extent that no single species or factor can be thought of as solely responsible for what is essentially a multifaceted ecological process (Greyling 2004). The aims of this review were to evaluate management methods to protect trees from elephant effects, in both small and large protected areas. We thereby firstly discuss the importance of large trees and how elephants interact with them, followed by a critical evaluation of the past management practices to reduce elephant numbers for protection of large trees. Lastly, we discuss the available management options to address the concern for the loss of large trees within a framework that highlights the various factors that potentially cause concern and the complexities of addressing a single mechanism within a heterogeneous landscape. Why are large trees important? Large trees (> 5 m in height) have a particular aesthetic significance to both the public and conservation managers (Shannon et al. 2008), being considered as important landscape features where they occur (Edge et al. 2017; Owen-Smith et al. 2006). The addition or reduction of large trees across a threshold is thus an indication of changing ecological states (Dublin, Sinclair & McGlade 1990). Importantly, a change in ecological state is not necessarily negative, as environments of a degraded nature may be recovering from past management practices (Young 2000). Large trees have important ecosystem functions and play a significant role in the cycling of nutrients (Ludwig, De Kroon & Prins 2008), reduction of evapotranspiration and conductance for species which occur below the crowns of trees (Belsky 1994), as well as providing a forage source for fauna (Kerley & Landman 2006). Other than providing food and shelter, large trees provide nesting sites for both vultures and raptors (Vogel et al. 2014). Elephant - large tree interactions Elephants impact trees in a variety of means, ranging from bark-stripping and branch breakage, towards more destructive impacts such as uprooting and stem snapping (Greyling 2004). The type and intensity of elephant impacts are determined by a variety of factors, including tree species (Shannon et al. 2008), tree height (Cook et al. 2017) and elephant sexual dimorphism (Greyling 2004). Elephants have particular forage preferences for species, including the marula (Sclerocarya birrea), knobthorn (Senegalia nigrescens) and red bushwillow (Combretum apiculatum) trees (Shannon et al. 2008). Tree height can exacerbate elephant impact. For example, marula trees between 5 m and 11 m in height are more vulnerable to uprooting and stem snapping when compared with trees above 11 m (Cook et al. 2017). Elephant bulls, being larger bodied, have heavier impacts on food species compared to cows (Greyling 2004). More recent studies focused on the positive ecological/biodiversity consequences of elephant disturbance regimes (Guldemond, Purdon & Van Aarde 2017). The ability of elephants to modify and alter woody structure, however, can increase habitat complexity by modifying the woody structure (Sianga et al. 2017). The feeding habits of elephants can lead to 'hedging effects' on certain tree species (Lombard et al. 2001; Styles & Skinner 2000), which increase trees' vulnerability to both insect invasions and fire damage due to a reduction in tree height, volume or exposed inner tissues (Jacobs & Biggs 2002). The impact of elephants above a certain threshold can lead to loss of particular tree species within a landscape, as well as a decrease in the landscape's structural diversity (Asner et al. 2016; Eckhardt, Van Wilgen & Biggs 2000; McCleery et al. 2018). Some studies have found that elephants can have a negative influence on biodiversity (Kerley & Landman 2006; McCleery et al. 2018) and woody canopy cover within protected areas (Asner et al. 2016). Extensive elephant feeding habits can displace black rhinoceros (Kerley & Landman 2014), which leads to increased predation of meso-herbivores owing to the opening of habitat (Tambling et al. 2013) and decreased foraging opportunities for micro-herbivores (Hrabar & Du Toit 2014). McCleery et al. (2018) have found that the combination of fires and elephant impact can lead to the removal of large trees in southern African savannas, decreasing the diversity of birds, bats and terrestrial small mammals. Elephants play an important role in the propagation of large trees, in terms of both dispersal and germination of tree seeds. Mature bulls can transport seeds to a maximum distance of 65 km away from their source (Bunney, Bond & Henley 2017). Concurrently, the acid treatment in their digestive system promotes the germination of seeds (Cochrane 2003), while the deposition of seeds in parcels of organic mulch further promotes germination (Cochrane 2003). These processes are promoted by the inefficiency of elephants' digestive systems and their ability to produce 14-20 droppings per day with each defecation weighing around 11 kg, thereby enabling them to comfortably produce at least 150 kg of wet dung a day (Owen-Smith 1988). Elephants also modify the landscape as ecosystem engineers, major tree pruners, effective composting agents and seed dispersers, thereby increasing biological diversity on a micro-scale (Valeix et al. 2011). Depending on the level of impact, this process has been found to increase the nutrient quality of impacted plants, escalate the overall biodiversity of the landscape and promote a mosaic of elephant impact-tolerant plant species closer to water points (Gaylard 2015; Kohi et al. 2011). Hence, landscapes used by elephants will have altered vegetation structure, which leads to a higher diversity of ants, reptiles and frogs through the creation of micro-habitats (Nasseri, McBrayer & Schulte 2010; Palmer et al. 2008). The pruning activities of elephants can stimulate plant growth and also stimulate shoot production in height levels accessible for other browsers, thereby promoting foraging opportunities for other herbivores (Mograbi et al. 2017). Thus, further research is required on the management methods available for reducing elephant impact on the environment, and how biodiversity responds to changes in levels of elephant impact over time. A critique of the justification used to reduce elephant numbers to save large trees The precautionary principle The precautionary principle, originated in Germany, describes the need to 'control inputs even before a causal link has been established by absolutely clear scientific evidence' (O'Riordan 2013), thereby applying a management action before damage is shown. Hence, there is no requirement to quantify damage before management action is applied (Milne 1993). This process therefore largely ignores rigorous scientific testing of certain hypotheses and outcomes, and base decisions on value judgements as opposed to adaptive management strategies (Rodgers 2005). The precautionary principle has always been in favour of protecting large trees in the KNP, whether by means of culling elephants, manipulating elephant distributions through waterhole closures or directly protecting trees through mitigation methods (SANParks 2012). The safety margins provided by the precautionary principle favour a static environmental state within thresholds of potential concern, which may not always be applicable in a dynamic ecosystem (Maltby 2000). Carrying capacity: A popular misconception Between 1967 and 1994, elephant culling programmes in the KNP focused on maintaining the population at one elephant per square mile (0.4 elephants/km2) (Whyte 2001). The idea that the KNP can only maintain an elephant population of 7000 elephants has become entrenched in the minds of the general public, ignoring the concept that a carrying capacity of a static nature does not hold true in a complex ecological system (McLeod 1997). This entrenched mindset has brought about concerns of a potential overpopulation of elephants in the KNP, with the current elephant number at over 20 000 (Pretorius, Garaï & Bates 2018). However, the revised elephant management plan (SANParks 2012) has shifted from focusing on elephant numbers as a whole, to maintaining ecological processes that uphold ecosystems through manipulating the environment to create a gradient of elephant effects across the system (Ferreira et al. 2017; Guldemond et al. 2017). Elephants' spatio-temporal usage of the landscape differs in accordance to resource availability, influencing the distribution of elephant effects (Gaylard 2015). As elephants do not make use of the landscape uniformly, heterogeneity is promoted across areas of high and low elephant impact (Kerley et al. 2008). Management initiatives based on outdated agricultural concepts, for example carrying capacity, can no longer be implemented while a number of long-term studies have been initiated. Fence-line contrasts Exclosures and enclosures in an ecological system represent boundaries of continuums, allowing managers to evaluate which factors may influence the desired landscape they wish to achieve by comparing it with a similar landscape lacking the same drivers of change (Cowling & Kerley 2002). The northern KNP's 300-hectare roan antelope enclosure (N'waxitshumbe enclosure) has commonly been used for comparisons on how elephants and other herbivores have impacted the area's marula trees (Jacobs & Biggs 2002). What is evident is that large marula trees still disappeared from the landscape after many years of culling, even though the enclosure's fence was erected at the same time the KNP initiated elephant culling operations (Jacobs & Biggs 2002). Elephant culling only slowed the mortality rate of some large tree species, which illustrates how elephants have an impact on their preferred species regardless of their density (Owen-Smith 2005). A lack of browsers in the roan enclosure supported the recruitment of marula seedlings into older age classes (Hofmeyr 2003), while browsers outside the enclosure such as impala (Aepyceros melampus) are known to heavily 'predate' large tree seedlings (Skarpe et al. 2004). Therefore, recruitment constraints of large trees can be attributed to herbivory at various age- and size-classes by a variety of ungulates, other than elephants (Helm & Witkowski 2012). Furthermore, carefully lit and controlled fires within the enclosure favoured young trees escaping the 'fire-trap', while other large trees in the enclosure have died as a result of natural attrition (Hofmeyr & Eckhardt 2005). The absence of a direct relationship between the number of elephants and proportion of dead marula trees during the years of culling suggests that elephants are not solely responsible for the decline of marula trees, and that factors influencing the trees at various life history and demographic stages need to be considered within a broader ecological context (Kruger & Grant 2005). A growing body of evidence indicates that a complex nature exists between elephant impact (Asner et al. 2016), fire regimes (Smit et al. 2016) and climate change (Bond & Midgley 2012) on treefall rates and bush encroachment in southern African savannas. Tsavo and Chobe National Parks: The importance of historical perspectives Conflicting views exist over the temporary woodland loss in Tsavo National Park (TNP) owing to elephant impact (Chamaille-Jammes & Fritz 2005; Leuthold 1977; Parker 1983). Although the Commiphora woodlands were drastically decreased in the early 1970s (Leuthold 1977), significant recruitment and regeneration have occurred (Gillson 2004). Changes in species diversity within the TNP are largely undocumented (Owen-Smith 1988), as a decrease in browsing species during the temporary woodland loss was balanced by increased numbers of open grassland grazers (Parker 1983). Importantly, authorities are witnessing changes to landscapes where densities and sizes of established large trees may be representative of a time of low elephant numbers due to ivory poaching at the turn of the previous century. Current, observed changes and fluctuations in vegetation types may be due to ecosystems returning to state where elephant numbers were more prevalent (Owen-Smith 1988). Furthermore, in the Chobe National Park (CNP), correlation does not necessarily imply causation, as is the case with elephant densities and changes to the vegetation's structural diversity. Species such as impala which have been recovering from the rinderpest outbreak in the late 1800s may be preventing the CNP's woodland regeneration and recruitment through high levels of seedling herbivory (Skarpe et al. 2004; Skarpe, Du Toit & Moe 2014). According to population models, the CNP elephant population is increasing towards densities experienced prior to the 19th century ivory trade (Parker & Graham 1989). Likewise, vegetation structure and diversity may thus be reverting back to previous states under higher densities of elephants, making the prevention of this process an impractical management task (Robson et al. 2017). Vegetation impact by elephants in the CNP is localised, however, with scientific research failing to find overall concerns for a loss of biodiversity at a large scale (Owen-Smith 2005). Hence, no authentic reports have documented irreversible elephant impact by elephants on the CNP ecosystem (Owen-Smith 2005; Guldemond et al. 2017; Van Aarde et al. 2005). Mitigation strategies amid the many factors potentially influencing the loss of large trees In the past, the biodiversity objectives of the KNP were realised through the reduction in elephant numbers by culling operations (Whyte 2001). However, elephants represent only one facet of a multifaceted ecological process when it comes to survival rates of large trees (Figure 1). Elephant density alone does not explain demographics of large trees (Guldemond et al. 2017). This is in part due to many factors involved in the survival and recruitment rates of large trees (Helm, Scott & Witkowski 2011), as well as the spatial distribution of elephants (Sianga et al. 2017). Elephant encounter rate and residence time with large trees are influenced by their density, as well as their spatial distribution (O'Connor, Goodman & Clegg 2007). The spatial distribution of elephants in turn depends on a variety of factors. These include both forage (Young, Ferreira & Van Aarde 2009) and water availability (De Knegt et al. 2011), rainfall (Birkett et al. 2012), the thermal environment (Kinahan, Pimm & Van Aarde 2007), fire (Woolley et al. 2008), roads when used as footpaths by elephants or because of increased forage productivity on their verges (Smit & Asner 2012), fences (Vanak, Thaker & Slotow 2010), terrain ruggedness (Wall, Douglas-Hamilton & Vollrath 2006) and the social and safety benefits of the areas they occupy (De Knegt et al. 2011). Elephants, fire, soil and elevation have been found to be the main determinants of tree extirpation, but the rates of extirpation are also dependent on the plant species being affected (Asner et al. 2016; O'Connor et al. 2007). Species such as the mopane tree (Colophospermum mopane) are able to re-coppice post-elephant impact (Styles & Skinner 2000), while the weak coppicing abilities of knobthorn trees leave them more vulnerable to elephant impact (MacGregor & O'Connor 2004). Despite current increased atmospheric carbon dioxide levels, which promote the growth of woody vegetation, there is little bush encroachment where there are elephants and high-intensity fires (Stevens et al. 2016). Overall, large tree survival rates are thus influenced by the heterogeneity of the landscape in terms of elephant use and the interplay with differences in fire intensity. Although elephant management interventions should not be considered in isolation from other drivers influencing large tree population dynamics, a number of options are still applicable if the management objective is to protect large trees. The mitigation strategies presented here focus on the ecological consequences without considering ethical concerns and can be divided into the following three types: Strategies aimed at directly affecting elephant numbers either (1) lethally or (2) by making use of non-lethal methods such as contraceptives or translocation (Figure 1: block 1a & 1b of mitigation measures, Table 1). Lethal methods for population reduction: Past approaches have aimed at directly reducing elephant numbers with particular reference to culling and translocation. However, controlling an elephant population at an arbitrarily placed number prevents density-dependence feedbacks from playing a natural role in reducing the population's growth rate (Owen-Smith 2005; Robson & Van Aarde 2018). Culling of a population which is experiencing an exponential growth phase will habitually result in an increase in the birth rates of the population, as the availability of food per head is increased (Caughley 1983). Furthermore, inter-regional movements of elephants have been observed into areas where elephants have been previously culled, nullifying the intentional plan of protecting the vegetation through culling (Van Aarde et al. 2005). Definition of zones where culling operations are meant to take place have also been found to mismatch the actual spatial and temporal movements of elephants (Delsink et al. 2013). Elephant numbers can also be affected by poaching (Wittemyer et al. 2014), disease outbreak (Grobler et al. 1995) and drought (Loveridge et al. 2006), but these population control measures remain undesirable as they are often unexpected and notoriously difficult to manage. Poaching, in particular, has led to the demise of one-third of the African continental elephant population in the space of 7 years across primarily Central and East Africa (Chase et al. 2016; Wittemyer et al. 2014). Recently, poaching has also increased in the southern African states with the KNP experiencing the highest poaching incidents in decades (Lindsay et al. 2017). Legal hunting has been suggested as a means to control elephant numbers; however, hunting is a highly selective activity, as bulls of particular age categories and with sought-after physical traits are targeted (Stalmans, Attwell & Estes 2002). For these reasons, hunting has not been listed as a population control method as it could result in undesirable skewed sex ratios and age structures within populations (Milner, Nilsen & Andreassen 2007). Non-lethal methods for population reduction: Non-lethal methods used to control elephant numbers include the use of contraceptives (Delsink et al. 2007) and translocation (Grobler et al. 2008). The success of contraception as a management tool to control population numbers has been shown in a number of reserves in South Africa, including the Greater Makalali Private Game Reserve and Tembe Elephant Park (Bertschinger et al. 2018). Translocation, however, is dependent on new available space for elephants, which is a limiting factor in South Africa (Grobler et al. 2008). Depending on the scale of the operation, translocation, as a means of reducing elephant numbers, may also have the same effect on elephant growth rates as culling had in the past (Caughley 1983). Both these non-lethal methods are currently of prime importance in smaller reserves with limited options for expansion or dispersal of animals and high tourism investment. Strategies aimed at manipulating the environment to influence the spatial distribution of elephants (Figure 1: block 2 of mitigation measures, Table 1). Overall, elephant impact is regulated by resource abundance and thereby, this impact can be spatially and temporarily altered by modifying how accessible resources are to elephants, thus promoting heterogeneity (Sianga et al. 2017). Modified elephant impact, both spatially and temporally, leads to greater levels of biodiversity on a regional scale (Gaylard 2005; Sianga et al. 2017). Surface water availability is an important driving factor behind elephant distributions (Gaylard, Owen-Smith & Redfern 2003). A scarcity of water can result in refugia localities for particular plant species (Eckhardt et al. 2000), as elephant movement ranges are naturally heterogeneous in accordance with surface water distribution (Gaylard et al. 2003). Elephant impact is thus homogenised in areas containing a high density of water points, as movement ranges are spatially and temporally reduced (Gaylard 2015). Smit, Grant and Whyte (2007) found that bulls in the KNP are more likely to occur further from natural rivers in comparison to breeding herds, making use of the availability of artificial waterholes to expand their spatial range. The KNP has used the closure and spatial distribution of artificial waterholes to manipulate elephant movement ranges, as well as their impact on vegetation (Ferreira et al. 2017; Macfadyen et al. 2019; O'Connor et al. 2007; Shannon et al. 2008). Intense levels of impact occur around the surface water points, while impact decreases as distance to surface water increases (Gaylard 2005). Sianga et al. (2017) found that large tree populations were abundant > 10 km from surface water in the Okavango Delta and Linyanti Swamps. Furthermore, the eventual scarcity of resources around a limited supply of water could lead to a situation where an elephant population that is double its size but increasing at half its rate would result in the same surplus of individuals (Owen-Smith 2005; Robson & Van Aarde 2018). Waterhole closure in the KNP has already reduced the annual population growth rate from 6.5% to 4.2% over a 12-year period (Ferreira et al. 2017). It has, however, been suggested that a lag phase may occur between the closure of waterholes and a reduction in elephant impact on trees in the KNP (SANParks 2012). Furthermore, this method may not be viable in small protected areas where it is not spatially realistic to create gradients of elephant impact. Importantly though, reducing waterholes can also reduce the residency of water-dependent browsers of seedlings, such as impala (Skarpe et al. 2004). Reducing environmental pressures on the seedlings of large trees will aid in the recruitment of mature individuals. Other methods used to manipulate elephants' distribution include the use of barriers or hard boundaries. Fences are the most commonly used barriers, but a variety of other barrier types can also be implemented (SANParks 2012). In open systems, elephants can adapt their behaviour when exposed to temporal and spatial variability of resources (Owen-Smith 2005). The colonisation of new areas by less risk-adverse bulls (Whyte 2001) could be of great value in alleviating impact on vegetation within current home ranges, as bulls exert greater levels of impact on the vegetation in comparison to cows and calves (Greyling 2004). This dispersal can be temporally delayed, as Druce et al. (2008) found that older elephant bulls in South Africa's Phinda Private Game Reserve took 1 month to move into two neighbouring reserves following the dropping of fences, while younger bulls and breeding herds took 5 to 8 months to follow. Dispersal of elephants can be a result of increased densities of elephants and this process could be disrupted by pre-emptive culling, which does not allow source areas to reach the required densities, which would encourage dispersal. Dispersal movements can be further encouraged by ensuring that important movement corridors, identified through the movements of collared individuals, are kept open and protected (Douglas-Hamilton, Krink & Vollrath 2005). Elephants may also avoid areas if deemed unsafe. Fear landscapes can influence elephant distribution patterns as elephants avoid areas where threats to their safety are perceived as spatially predictable, but the timing and type of threat remains unpredictable (Cromsigt et al. 2013). Indeed, the density of elephants immediately decreased in zones where culling had commenced in KNP, before elephants immigrated back to these zones within the following years (Van Aarde, Whyte & Pimm 1999). Conversely, safety benefits can thus be used as one method to attract elephants to particular areas. Hence, environmental manipulation could be applied and monitored in an adaptive management approach to encourage elephants into particular areas where their population growth rates would be limited by natural processes (Robson & Van Aarde 2018). Strategies aimed at directly protecting the resource, for example large trees (Figure 1: block 3 of mitigation measures, Table 1). Tree sanctuaries can be formed from the direct protection of the resource (i.e. large trees). In addition to preserving the aesthetic importance of landscape features such as large trees, mature specimens could serve as important seed banks for future recruitment programmes (Western & Maitumo 2004). Wire-netting tree trunks have been found to increase the survival rate of large trees as the technique essentially prevents bark-stripping by elephants. However, treated trees do remain susceptible to branch breakage, uprooting or main stem snapping, albeit at lower frequencies (Derham, Henley & Schulte 2016). The use of African honeybees (Apis mellifera subsp. scutellata) has proved to be a highly effective, albeit costly, mitigation method for protecting individual trees from elephant impact (Cook et al. 2018). Potentially, the costs can be offset by the production of honey and the additional pollination services obtained from active beehives. Other methods used to protect large trees involve the packing of rocks and pyramids around the base of a tree to a distance of up to 5 m from the stem (SANParks 2012). The efficacy of this technique has not been quantified in the scientific literature, although anecdotal evidence indicates that it could be effective if laid out correctly. Importantly, methods that directly protect the individual tree will have a small spatial effect, but no lag time with regard to their effectiveness. These methods are applicable in both small and large protected areas where individual trees are in need of protection. Lastly, the artificial propagation of seedlings of woody species favoured by elephants in exclusion experiments can be viewed as another method to increase the density of food plants while reducing encounter rates with elephants (Hofmeyr 2005). This method, while not yet tried in South Africa, provides an alternative option to lowering elephant densities to achieve the same effect. Experimental exclosures in the Mapungubwe National Park have demonstrated the potential of artificial propagation as a means of assisting big tree regeneration (Scholtz 2007). Artificial propagation has further been used to help diminish human-elephant conflict in Thailand (Van de Water & Matteson 2018). Elephant meta-population management Each of the proposed mitigation strategies have certain advantages and disadvantages associated with them (Table 1), many of which also need to be evaluated from an ethics perspective (broadly listed from most severe to least severe ethical concern in Figure 1 and Table 1), as increased interference and disruption of intact social systems can occur when moving from strategy three to strategy one. However, elephants are continually exposed to a wide range of stresses across the landscape, and their response to such stressors can be used to evaluate the ethics and effectiveness of proposed mitigation strategies. Understanding how elephants respond to human-induced fear (Douglas-Hamilton et al. 2005) and resource manipulation (Purdon & Van Aarde 2017) will be important when mitigation strategies are implemented. In the Great Limpopo Transfrontier Park (GLTP, 37 572 km2), all three abovementioned mitigation strategies are being carried out across the system. The density of elephant poaching is the highest in the Limpopo National Park (Lunstrum 2014), which would affect elephant densities and create sink areas driven by fear (Van Aarde & Jackson 2007). These landscapes of fear influence both the density and spatial distribution of elephants concurrently, albeit undesirably because poaching is known to disrupt the social structure and demographics of the population and is hard to control (Jones et al. 2018). Future research is required to evaluate the effect that poaching in the Limpopo National Park and the slow increase within the KNP will have on the higher elephant population density and vegetation composition found within the KNP and neighbouring reserves. Key to elephant management within the KNP would be to increase the safety benefits within the neighbouring Limpopo National Park to which elephants will naturally respond in keeping with seasons and as this reserve only has a seasonal and natural spread of available surface water. Historically, the KNP reduced elephant numbers through culling and although these practices are no longer implemented partly because they were unsuccessful in achieving the desired outcome - for example the protection of large trees - the KNP is experiencing some of the highest poaching records in its history (Lindsay et al. 2017). However, as the KNP still has an expanding elephant population (Ferreira et al. 2017), management is preferentially focusing on the second mitigation strategy by primarily controlling elephant distribution through artificial waterhole closure and have already closed two-thirds of the 365 artificial waterholes and 50 earth dams since it began its water stabilisation programme in the early 1930s (Purdon & Van Aarde 2017; SANParks 2012). The Associated Private Nature Reserves (APNR) to the west of the KNP have a saturated water landscape and also a high density of landowners and lodges (Peel 2009). The landscape use implemented in this self-funded protected area may thus not lend itself to the aforementioned mitigation strategies. The APNR have, however, successfully implemented various mitigation strategies aimed at directly protecting the resource (large trees) such as wire-netting (Derham et al. 2016), African honeybees (Cook et al. 2018) and rocks and pyramids (Henley & Cook 2018). In smaller reserves (< 1000 km2), elephant range size is often a function of the size of the reserve (Roux 2006). The manipulation or closure of waterholes may have a limited effect on reducing elephant impact on large trees in the APNR due to the immense number of waterholes distributed across private properties. As previously discussed, translocation may be a temporary option, although limited by the number of reserves that can support elephant populations (Grobler et al. 2008). Smaller reserves should focus on methods that directly protect large trees from elephant impact (Table 1) and investigate the potential of contraception for managing their elephant numbers (Table 1). Botanical reserves that exclude elephants from particular floral communities within smaller reserves can also ensure the survival of large tree species and their seed banks (Lombard et al. 2001). Efforts should also be focused on large tree regeneration and recruitment, by considering factors such as seed predation (Helm et al. 2011), seedling herbivory (Skarpe et al. 2004) and fires (Smit et al. 2016), which are known to affect large tree survival, even in the absence of elephants (Helm & Witkowski 2012). Conclusion Conservation managers are faced with the difficulties of fulfilling their mandate of protecting biodiversity in human-dominated landscapes and what biodiversity should be protected where objectives may be in conflict. Can large trees and elephants coexist and what strategies should managers implement to optimise biodiversity goals? These strategies should reflect on (1) implementing limited or no interventions when ecological processes are playing out (Biggs et al. 2008), (2) restoring ecological processes and opportunities if the landscape is termed 'degraded' (Wassenaar, Ferreira & Van Aarde 2007), and (3) mimicking desired ecological processes if restoration is not possible (SANParks 2012). Hence, an adaptive management plan needs to consider and continually evaluate whether the proposed mitigation strategy will lead to the desired effect with: the least amount of interference to operating ecological processes both within the proposed area where the management action is to be applied, as well as in the surrounding landscape the least financial expenditure in terms of implementation for sustainability of the mitigation strategy the most practically implementable methods for both short-term and long-term tree survival the most ethical approach, in terms of either pain/trauma caused to individual elephants themselves or the disruption of their social relationships, in keeping with the Norms and Standards for Managing Elephants in South Africa (DEAT 2008). This is particularly true in areas dependent on tourism as socially disrupted populations could increase safety risks for tourists. The three possible mitigation strategies available to potentially protect large trees can each be evaluated given the size of the reserve and historical perspectives. Protected areas such as the KNP, which forms part of a large open system, have opted for environmental manipulation as the management strategy. Although environmental manipulation may be viable for a reserve of this size, it may not prove appropriate in smaller protected areas. Here, a combination of directly protecting the resource (large trees) from elephant impact, in combination with translocations or contraceptive programmes, may prove more appropriate. Acknowledgements We would like to acknowledge various scientists who through the years have helped to shape these thoughts. In particular: Prof. Norman Owen-Smith, Prof. Johan du Toit, Prof. William Bond, Prof. Hennie Lotter and Dr Sam Ferreira. Competing interests The authors declare that they have no financial or personal relationships that may have inappropriately influenced them in writing this article. Authors' contributions M.D.H. was responsible for conceptualising the manuscript, writing the text and creating the conceptual model. R.M.C. was responsible for literature reviews and contributing towards the manuscript's text. Both authors reviewed drafts and approved the final draft of the manuscript. Ethical considerations This article followed all ethical standards for research without direct contact with human or animal subjects. Funding information Funding was received from the United States Fish and Wildlife Service, the Oak Foundation and many other smaller funders and private donors. Data availability statement Data sharing is not applicable to this article as no new data were created or analysed in this study. Disclaimer The views and opinions expressed in this article are those of the authors and do not necessarily reflect the official policy or position of any affiliated agency of the authors. References Asner, G.P., Vaughn, N., Smit, I.P. & Levick, S., 2016, 'Ecosystem-scale effects of megafauna in African savannas', Ecography 39(2), 240-252. https://doi.org/10.1111/ecog.01640 [ Links ] Belsky, A.J., 1994, 'Influences of trees on savanna productivity: Tests of shade, nutrients, and tree-grass competition', Ecology 75(4), 922-932. https://doi.org/10.2307/1939416 [ Links ] Bertschinger, H.J., Delsink, A., Van Altena, J.J. & Kirkpatrick, J.F., 2018, 'Porcine zona pellucida vaccine immunocontraception of African elephant (Loxodonta africana) cows: A review of 22 years of research', Bothalia - African Biodiversity & Conservation 48(2), 1-8. https://doi.org/10.4102/abc.v48i2.2324 [ Links ] Biggs, H.C., Slotow, R., Scholes, B., Carruthers, J., Van Aarde, R., Kerley, G. et al., 2008, 'Towards integrated decision-making for elephant management', in R.J. Scholes & K.G. Mennell (eds.), Assessment of South African elephant management, pp. 537-586, Witwatersrand University Press, Johannesburg. [ Links ] Birkett, P.J., Vanak, A.T., Muggeo, V.M., Ferreira, S.M. & Slotow, R., 2012, 'Animal perception of seasonal thresholds: Changes in elephant movement in relation to rainfall patterns', PLoS One 7(6), e38363. https://doi.org/10.1371/journal.pone.0003546 [ Links ] Bond, W.J. & Midgley, G.F., 2012, 'Carbon dioxide and the uneasy interactions of trees and savannah grasses', Philosophical Transactions of the Royal Society B: Biological Sciences 367(1588), 601-612. https://doi.org/10.1098/rstb.2011.0182 [ Links ] Bunney, K., Bond, W.J. & Henley, M., 2017, 'Seed dispersal kernel of the largest surviving megaherbivore - The African savanna elephant', Biotropica 49(3), 395-401. https://doi.org/10.1111/btp.12423 [ Links ] Caughley, G., 1983, 'Dynamics of large mammals and their relevance to culling', in R.N. Owen-Smith (ed.), Management of large mammals in African conservation areas, Proceedings of a Symposium Pretoria, South Africa, April 1982. Pretoria: Cooperative Scientific Programmes, Council for Scientific and Industrial Research, Pretoria. [ Links ] Chamaille-Jammes, S. & Fritz, H., 2005, 'Rainfall drivers of dry season savanna productivity', in C.C. Grant (ed.), Elephant effects on biodiversity: An assessment of current knowledge and understanding as a basis for elephant management in SANParks, South African National Parks, p. 22, Scientific Services, Skukuza, Scientific Report 3/2005. [ Links ] Chase, M.J., Schlossberg, S., Griffin, C.R., Bouché, P.J., Djene, S.W., Elkan, P.W. et al., 2016, 'Continent-wide survey reveals massive decline in African savannah elephants', Peer Journal 4, e2354. https://doi.org/10.7717/peerj.2354 [ Links ] Cochrane, E.P., 2003, 'The need to be eaten: Balanites wilsoniana with and without elephant seed-dispersal', Journal of Tropical Ecology 19(5), 579-589. https://doi.org/10.1017/S0266467403003638 [ Links ] Cook, R.M., Parrini, F., King, L.E., Witkowski, E.T.F. & Henley, M.D., 2018, 'African honeybees as a mitigation method for elephant impact on trees', Biological Conservation 217, 329-336. https://doi.org/10.1016/j.biocon.2017.11.024 [ Links ] Cook, R.M., Witkowski, E.T.F., Helm, C.V., Henley, M.D. & Parrini, F., 2017, 'Recent exposure to African elephants after a century of exclusion: Rapid accumulation of marula tree impact and mortality, and poor regeneration', Forest Ecology and Management 401, 107-116. https://doi.org/10.1016/j.foreco.2017.07.006 [ Links ] Cowling, R. & Kerley, G.I.H., 2002, 'Impacts of elephants on the flora and vegetation of subtropical thicket in the Eastern Cape', in Elephant conservation and management in the Eastern Cape: Workshop Proceedings, pp. 55-72, Terrestrial Ecology Research Unit, University of Port Elizabeth, Port Elizabeth, South Africa, Report (No. 35). [ Links ] Cromsigt, J.P., Kuijper, D.P., Adam, M., Beschta, R.L., Churski, M., Eycott, A. et al., 2013, 'Hunting for fear: Innovating management of human-wildlife conflicts', Journal of Applied Ecology 50(3), 544-549. https://doi.org/10.1111/1365-2664.12076 [ Links ] DEAT, 2008, 'National environmental management: Biodiversity act, 2004 (act no. 10 of 2004) national norms and standards for the management of elephants in South Africa', Staatskoerant 30833(251), 3-39. [ Links ] De Knegt, H.J., Van Langevelde, F., Skidmore, A.K., Delsink, A., Slotow, R., Henley, S. et al., 2011, 'The spatial scaling of habitat selection by African elephants', Journal of Animal Ecology 80(1), 270-281. https://doi.org/10.1111/j.1365-2656.2010.01764.x [ Links ] Delsink, A.K., Van Altena, J.J., Grobler, D., Bertschinger, H.J., Kirkpatrick, J.F. & Slotow, R., 2007, 'Implementing immunocontraception in free-ranging African elephants at Makalali Conservancy', Journal of the South African Veterinary Association 78(1), 25-30. http://hdl.handle.net/10520/EJC99704 [ Links ] Delsink, A., Vanak, A.T., Ferreira, S. & Slotow, R., 2013, 'Biologically relevant scales in large mammal management policies', Biological Conservation 167(2013), 116-126. https://doi.org/10.1016/j.biocon.2013.07.035 [ Links ] Derham, K., Henley, M.D. & Schulte, B.A., 2016, 'Wire netting reduces African elephant (Loxodonta africana) impact to selected trees in South Africa', Koedoe 58(1), 1-7. https://doi.org/10.4102/koedoe.v58i1.1327 [ Links ] Douglas-Hamilton, I., Krink, T. & Vollrath, F., 2005, 'Movements and corridors of African elephants in relation to protected areas', Naturwissenschaften 92(4), 158-163. https://doi.org/10.1007/s00114-004-0606-9 [ Links ] Druce, D.J., Shannon, G., Page, B.R., Grant, R. & Slotow, R., 2008, 'Ecological thresholds in the savanna landscape: Developing a protocol for monitoring the change in composition and utilisation of large trees', PLoS One 3(12), e3979. https://doi.org/10.1371/journal.pone.0003979 [ Links ] Dublin, H.T., Sinclair, A.R. & McGlade, J., 1990, 'Elephants and fire as causes of multiple stable states in the Serengeti-Mara woodlands', The Journal of Animal Ecology 59(3), 1147-1164. https://doi.org/10.2307/5037 [ Links ] Eckhardt, H.C., Van Wilgen, B.W. & Biggs, H.C., 2000, 'Trends in woody vegetation cover in the Kruger National Park, South Africa, between 1940 and 1998', African Journal of Ecology 38(2), 108-115. https://doi.org/10.1046/j.1365-2028.2000.00217.x [ Links ] Edge, A., Henley, M., Daday, J. & Schulte, B.A., 2017, 'Examining human perception of elephants and large trees for insights into conservation of an African savanna ecosystem', Human Dimensions of Wildlife 22(3), 231-245. https://doi.org/10.1080/10871209.2017.1298168 [ Links ] Ferreira, S.M., Greaver, C. & Simms, C., 2017, 'Elephant population growth in Kruger National Park, South Africa, under a landscape management approach', Koedoe 59(1), 1-6. https://doi.or/10.4102/koedoe.v59i1.1427 [ Links ] Gaylard, A., 2015, 'Adopting a heterogeneity paradigm for understanding and managing elephants for biodiversity: A case study in riparian woodlands in Kruger National Park', PhD thesis, Faculty of Science, University of the Witwatersrand, Johannesburg, South Africa, viewed 20 May 2018, from http://hdl.handle.net/10539/19327. [ Links ] Gaylard, A., Owen-Smith, R.N. & Redfern, J., 2003, 'Surface water availability: Implications for heterogeneity and ecosystem processes', in R.J. Scholes & K.G. Mendell (eds.), Elephant management: A scientific assessment for South Africa, pp. 171-188, Witwatersrand University Press, Johannesburg. [ Links ] Gillson, L., 2004, 'Testing non-equilibrium theories in savannas: 1400 years of vegetation change in Tsavo National Park, Kenya', Ecological Complexity 1(4), 281-298. https://doi.org/10.1016/j.ecocom.2004.06.001 [ Links ] Greyling, M.D., 2004, 'Sex and age related distinctions in the feeding ecology of the African elephant, Loxodonta africana', PhD thesis, Faculty of Science, University of the Witwatersrand, Johannesburg, viewed 14 April 2018, from http://hdl.handle.net/10539/7489. [ Links ] Grobler, D.G., Raath, J.P., Keet, D.F., Gerdes, G.H., Barnard, B.J.H., Kriek, N.P.J. et al., 1995, 'An outbreak of encephalomyocarditis-virus infection in free-ranging African elephants in the Kruger National Park', Onderstepoort Journal of Veterinary Research 62(2), 97-108. [ Links ] Grobler, D.G., Van Altena, J.J., Malan, J.H. & Mackey, R.L., 2008, 'Elephant translocation', in R.J. Scholes & K.G. Mendell (eds.), Elephant management: A scientific assessment for South Africa, pp. 241-256, Witwatersrand University Press, Johannesburg. [ Links ] Guldemond, R.A., Purdon, A. & Van Aarde, R.J., 2017, 'A systematic review of elephant impact across Africa', PLoS One 12(6), e0178935. https://doi.org/10.1371/journal.pone.0178935 [ Links ] Helm, C.V., Scott, S.L. & Witkowski, E.T.F., 2011, 'Reproductive potential and seed fate of Sclerocarya birrea subsp. caffra (marula) in the low altitude savannas of South Africa', South African Journal of Botany 77(3), 650-664. https://doi.org/10.1016/j.sajb.2011.02.003 [ Links ] Helm, C.V. & Witkowski, E.T.F., 2012, 'Characterising wide spatial variation in population size structure of a keystone African savanna tree', Forest Ecology and Management 263, 175-188. https://doi.org/10.1016/j.foreco.2011.09.024 [ Links ] Henley, M.D. & Cook, R.M., 2018, Elephants & big trees: Mitigation methods, Unpublished report to the Associated Private Nature Reserves, 25 p. [ Links ] Hofmeyr, M., 2003, The spatial demography of elephant impacts on selected tree species in the Kruger National Park, Unpublished report to the US Fish and Wildlife, Skukuza, 43 p. [ Links ] Hofmeyr, M., 2005, 'Spatial demography of selected tree species in the Kruger National Park in relation to elephant impacts', in C.C. Grant (ed.), Elephant effects on biodiversity: An assessment of current knowledge and understanding as a basis for elephant management in SANParks, South African National Parks, pp. 61-67, Scientific Services, Skukuza, Scientific Report 3/2005. [ Links ] Hofmeyr, M. & Eckhardt, H., 2005, 'Changes in vegetation in the KNP related to elephant activity', in C.C. Grant (ed.), Elephant effects on biodiversity: An assessment of current knowledge and understanding as a basis for elephant management in SANParks, South African National Parks, pp. 50-57, Scientific Services, Skukuza. Scientific Report 3/2005. [ Links ] Hrabar, H. & Du Toit, J.T., 2014, 'Interactions between megaherbivores and microherbivores: Elephant browsing reduces host plant quality for caterpillars', Ecosphere 5(1), 1-6. https://doi.org/10.1890/ES13-00173.1 [ Links ] Jacobs, O.S. & Biggs, R., 2002, 'The status and population structure of the marula in the Kruger National Park', South African Journal of Wildlife Research 32(1), 1-12. https://doi.org/10520/EJC117144 [ Links ] Jones, T., Cusack, J.J., Pozo, R.A., Smit, J., Mkuburo, L., Baran, P. et al., 2018, 'Age structure as an indicator of poaching pressure: Insights from rapid assessments of elephant populations across space and time', Ecological Indicators 88, 115-125. https://doi.org/10.1016/j.ecolind.2018.01.030 [ Links ] Kerley, G.I.H., Landman, M., Kruger, L., Owen-Smith, N., Balfour, D., De Boer, W.F. et al., 2008, 'Effects of elephant on ecosystems and biodiversity', in R.J. Scholes & K.G. Mendell (eds.), Elephant management: A scientific assessment for South Africa, pp. 146-205, Witwatersrand University Press, Johannesburg. [ Links ] Kerley, G.I.H. & Landman, M., 2006, 'The impacts of elephants on biodiversity in the Eastern Cape Subtropical Thickets', South African Journal of Science 102(9-10), 395-402, viewed 20 May 2018, from http://hdl.handle.net/10520/EJC96608 [ Links ] Kinahan, A.A., Pimm, S.L. & Van Aarde, R.J., 2007, 'Ambient temperature as a determinant of landscape use in the savanna elephant', Loxodonta africana. Journal of Thermal Biology 32(1), 47-58. https://doi.org/10.1016/j.jtherbio.2006.09.002 [ Links ] Kohi, E.M., De Boer, W.F., Peel, M.J., Slotow, R., Van der Waal, C., Heitkönig, I.M., Skidmore, A. & Prins, H.H., 2011, 'African elephants Loxodonta africana amplify browse heterogeneity in African savanna', Biotropica 43(6),711-721. https://doi.org/10.1111/j.1744-7429.2010.00724.x [ Links ] Kruger, L. & Grant, R., 2005, 'Chapter summary and conclusion', in C.C. Grant (ed.), Elephant effects on biodiversity: An assessment of current knowledge and understanding as a basis for elephant management in SANParks, South African National Parks, pp. 194-202, Scientific Services, Skukuza, Scientific Report 3/2005. [ Links ] Leuthold, W., 1977, 'Spatial organization and strategy of habitat utilization of elephants in Tsavo National Park, Kenya', Zeitschrift fur Saugetierkunde 42(6), 358-379. [ Links ] Lindsay, K., Chase, M., Landen, K. & Nowak, K., 2017, 'The shared nature of Africa's elephants', Biological Conservation 215, 260-267. https://doi.org/10.1016/j.biocon.2017.08.021 [ Links ] Lombard, A.T., Johnson, C.F., Cowling, R.M. & Pressey, R.L., 2001, 'Protecting plants from elephants: Botanical reserve scenarios within the Addo Elephant National Park, South Africa', Biological Conservation 102(2), 191-203. https://doi.org/10.1016/S0006-3207(01)00056-8 [ Links ] Loveridge, A.J., Hunt, J.E., Murindagomo, F. & Macdonald, D.W., 2006, 'Influence of drought on predation of elephant (Loxodonta africana) calves by lions (Panthera leo) in an African wooded savannah', Journal of Zoology 270(3), 523-530. https://doi.org/10.1111/j.1469-7998.2006.00181.x [ Links ] Ludwig, F., De Kroon, H. & Prins, H.H., 2008, 'Impacts of savanna trees on forage quality for a large African herbivore', Oecologia 155(3), 487-496. https://doi.org/10.1007/s00442-007-0878-9 [ Links ] Lunstrum, E., 2014, 'Green militarization: Anti-poaching efforts and the spatial contours of Kruger National Park', Annals of the Association of American Geographers 104(4), 816-832. https://doi.org/10.1080/00045608.2014.912545 [ Links ] MacFadyen, S., Hui, C., Verburg, P.H. & Teeffelen, A.J.A., 2019, 'Spatiotemporal distribution dynamics of elephants in response to density, rainfall, rivers and fire in Kruger National Park, South Africa', Diveristy and Distributions 25(6), 880-894. https://doi.org/10.1111/ddi.12907 [ Links ] MacGregor, S.D. & O'Connor, T.G., 2004, 'Response of Acacia tortilis to utilization by elephants in a semi-arid African savanna', South African Journal of Wildlife Research 34(1), 55-66, viewed 13 May 2018, from http://hdl.handle.net/10520/EJC117183. [ Links ] Maltby, E., 2000, 'Ecosystem approach: From principle to practice', Ecosystem Service and Sustainable Watershed Management in North China International Conference, China, 23rd-25th August, pp. 23-25. [ Links ] McCleery, R., Monadjem, A., Baiser, B., Fletcher, Jr., R., Vickers, K. & Kruger, L., 2018, 'Animal diversity declines with broad-scale homogenization of canopy cover in African savannas', Biological Conservation 226(2018), 54-62. https://doi.org/10.1016/j.biocon.2018.07.020 [ Links ] McLeod, S.R., 1997, 'Is the concept of carrying capacity useful in variable environments?', Oikos 79, 529-542. https://doi.org/10.2307/3546897 [ Links ] Millspaugh, J.J., Burke, T., Van Dyk, G.U.S., Slotow, R.O.B., Washburn, B.E. & Woods, R.J., 2007, 'Stress response of working African elephants to transportation and safari adventures', The Journal of Wildlife Management 71(4), 1257-1260. https://doi.org/10.2193/2006-015 [ Links ] Milne, A., 1993, 'The perils of green pessimism', New Scientist 138(1877), 34-37. [ Links ] Milner, J.M., Nilsen, E.B. & Andreassen, H.P., 2007, 'Demographic side effects of selective hunting in ungulates and carnivores', Conservation Biology 21(1), 36-47. https://doi.org/10.1111/j.1523-1739.2006.00591.x [ Links ] Mograbi, P.J., Asner, G.P., Witkowski, E.T., Erasmus, B.F., Wessels, K.J., Mathieu, R. et al., 2017, 'Humans and elephants as treefall drivers in African savannas', Ecography 40(11), 1274-1284. https://doi.org/10.1111/ecog.02549 [ Links ] Nasseri, N.A., McBrayer, L.D. & Schulte, B.A., 2011, 'The impact of tree modification by African elephant (Loxodonta africana) on herpetofaunal species richness in northern Tanzania', African Journal of Ecology 49(2), 133-140. https://doi.org/10.1111/j.1365-2028.2010.01238.x [ Links ] O'Connor, T.G., Goodman, P.S. & Clegg, B., 2007, 'A functional hypothesis of the threat of local extirpation of woody plant species by elephant in Africa', Biological Conservation 136(3), 329-345. https://doi.org/10.1016/j.biocon.2006.12.014 [ Links ] O'Riordan, T., 2013, Interpreting the precautionary principle, Routledge, Abingdon. [ Links ] Owen-Smith, R.N., 1988, Megaherbivores - The influence of very large body size on ecology, Cambridge University Press, Cambridge. [ Links ] Owen-Smith, R.N., 2005, 'Ecosystem resources influencing elephant populations', in C.C. Grant (ed.), Elephant effects on biodiversity: An assessment of current knowledge and understanding as a basis for elephant management in SANParks, South African National Parks, pp. 41-42, Scientific Services, Skukuza, Scientific Report 3/2005. [ Links ] Owen-Smith, N., Slotow, R., Kerley, G.I.H., Van Aarde, R.J. & Page, B., 2006, 'A scientific perspective on the management of elephants in the Kruger National Park and elsewhere: Elephant conservation', South African Journal of Science 102(9), 389-394. [ Links ] Palmer, T.M., Stanton, M.L., Young, T.P., Goheen, J.R., Pringle, R.M. & Karban, R., 2008, 'Breakdown of an ant-plant mutualism follows the loss of large herbivores from an African savanna', Science 319(5860), 192-195. https://doi/10.1126/science.1151579 [ Links ] Parker, I.S.C., 1983, 'The Tsavo story: An ecological case history', in R.N. Owen-Smith (ed.), Management of large mammals in African conservation areas, pp. 37-49, Haum, Pretoria. [ Links ] Parker, I.S.C. & Graham, A.D., 1989, 'Elephant decline (Part I) downward trends in African elephant distribution and numbers', International Journal of Environmental Studies 34(4), 287-305. https://doi.org/10.1080/00207238908710539 [ Links ] Peel, M., 2009, Management plan: Associated private nature reserves, Unpublished land owner document, 271 p. [ Links ] Pretorius, Y., Garaï, M.E. & Bates, L.A., 2018, 'The status of African elephant Loxodonta africana populations in South Africa', Oryx 1-7. https://doi.org/10.1017/S0030605317001454 [ Links ] Purdon, A. & Van Aarde, R.J., 2017, 'Water provisioning in Kruger National Park alters elephant spatial utilisation patterns', Journal of Arid Environments 141, 45-51. https://doi.org/10.1016/j.jaridenv.2017.01.014 [ Links ] Robson, A.S., Trimble, M.J., Purdon, A., Young-Overton, K.D., Pimm, S.L. & Van Aarde, R.J., 2017, 'Savanna elephant numbers are only a quarter of their expected values', PLoS One 12(4), e0175942. https://doi.org/10.1371/journal.pone.0175942 [ Links ] Robson, A.S. & Van Aarde, R.J., 2018, 'Changes in elephant conservation management promote density-dependent habitat selection in the Kruger National Park', Animal Conservation 21(4), 302-312. https://doi.org/10.1016/j.jaridenv.2017.01.014 [ Links ] Rode, K.D., Chiyo, P.I., Chapman, C.A. & McDowell, L.R., 2006, 'Nutritional ecology of elephants in Kibale National Park, Uganda, and its relationship with crop-raiding behaviour', Journal of Tropical Ecology 22(4), 441-449. https://doi.org/10.1017/S0266467406003233 [ Links ] Rodgers, K.H., 2005, 'Elephant and biodiversity - A synthesis of current understanding of the role and management of elephant in savanna ecosystems. Outcomes of the Science workshop, Luiperdskloof', in C.C. Grant (ed.), Elephant effects on biodiversity: An assessment of current knowledge and understanding as a basis for elephant management in SANParks, South African National Parks, pp. 227-234, Scientific Services, Skukuza. Scientific Report 3/2005. [ Links ] Roux, C., 2006, 'Feeding ecology, space use and habitat selection of elephants in two enclosed game reserves in the Eastern Cape Province, South Africa', Doctoral dissertation, Rhodes University. [ Links ] SANParks, 2012, Elephant management plan. Kruger National Park. 2013-2022, SANParks, Skukuza, South Africa. [ Links ] Scholtz, T., 2007, 'The evaluation of the establishment and growth of indigenous trees to restore deforested riparian areas in the Mapungubwe National Park, South Africa', Doctoral dissertation, North-West University, viewed 04 April 2019, from http://hdl.handle.net/10394/1842. [ Links ] Shannon, G., Druce, D.J., Page, B.R., Eckhardt, H.C., Grant, R. & Slotow, R., 2008, 'The utilization of large savanna trees by elephant in southern Kruger National Park', Journal of Tropical Ecology 24(3), 281-289. https://doi.org/10.1017/S0266467408004951 [ Links ] Shannon, G., Slotow, R., Durant, S.M., Sayialel, K.N., Poole, J., Moss, C. et al., 2013, 'Effects of social disruption in elephants persist decades after culling', Frontiers in Zoology 10(1), 62. https://doi.org/10.1186/1742-9994-10-62 [ Links ] Sianga, K., Van Telgen, M., Vrooman, J., Fynn, R.W. & Van Langevelde, F., 2017, 'Spatial refuges buffer landscapes against homogenisation and degradation by large herbivore populations and facilitate vegetation heterogeneity', Koedoe 59(2), 1-13. https://doi.org/10.4102/koedoe.v59i2.1434 [ Links ] Skarpe, C., Aarrestad, P.A., Andreassen, H.P., Dhillion, S.S., Dimakatso, T., Du Toit, J.T. et al., 2004, 'The return of the giants: Ecological effects of an increasing elephant population', AMBIO: A Journal of the Human Environment 33(6), 276-282. https://doi.org/10.1579/0044-7447-33.6.276 [ Links ] Skarpe, C., Du Toit, J.T. & Moe, S.R., 2014, Elephants and savanna woodland ecosystems: A study from Chobe National Park, Botswana, John Wiley & Sons, London. [ Links ] Smit, I.P.J. & Asner, G.P., 2012, 'Roads increase woody cover under varying geological, rainfall and fire regimes in African savanna', Journal of Arid Environments 80, 74-80. https://doi.org/10.1016/j.jaridenv.2011.11.026 [ Links ] Smit, I.P., Asner, G.P., Govender, N., Vaughn, N.R. & Van Wilgen, B.W., 2016, 'An examination of the potential efficacy of high-intensity fires for reversing woody encroachment in savannas', Journal of Applied Ecology 53(5), 1623-1633. https://doi.org/10.1111/1365-2664.12738 [ Links ] Smit, I.P.J., Grant, C.C. & Whyte, I.J., 2007, 'Elephants and water provision: What are the management links?', Diversity and Distributions 13(6), 666-669. https://doi.org/10.1111/j.1472-4642.2007.00403.x [ Links ] Stalmans, M., Attwell, B. & Estes, L., 2002, Hunting in the Associated Private Nature Reserves. Environmental Impact Assessment Process. Draft Scoping Report to the Department of Finance and Economic Development (Limpopo Provincial Government), 74 p. [ Links ] Stevens, N., Erasmus, B.F.N., Archibald, S. & Bond, W.J., 2016, 'Woody encroachment over 70 years in South African savannahs: Overgrazing, global change or extinction aftershock?', Philosophical Transactions of the Royal Society B 371(1703), 20150437. https://doi.org/10.1098/rstb.2015.0437 [ Links ] Styles, C.V. & Skinner, J.D., 2000, 'The influence of large mammalian herbivores on growth form and utilization of mopane trees, Colophospermum mopane, in Botswana's Northern Tuli Game Reserve', African Journal of Ecology 38(2), 95-101. https://doi.org/10.1046/j.1365-2028.2000.00216.x [ Links ] Tambling, C.J., Minnie, L., Adendorff, J. & Kerley, G.I., 2013, 'Elephants facilitate impact of large predators on small ungulate prey species', Basic and Applied Ecology 14(8), 694-701. https://doi.org/10.1016/j.baae.2013.09.010 [ Links ] Valeix, M., Fritz, H., Sabatier, R., Murindagomo, F., Cumming, D. & Duncan, P., 2011, 'Elephant-induced structural changes in the vegetation and habitat selection by large herbivores in an African savanna', Biological Conservation 144(2), 902-912. https://doi.org/10.1016/j.biocon.2010.10.029 [ Links ] Vanak, A.T., Thaker, M. & Slotow, R., 2010, 'Do fences create an edge-effect on the movement patterns of a highly mobile mega-herbivore?', Biological Conservation 143(11), 2631-2637. https://doi.org/10.1016/j.biocon.2010.07.005 [ Links ] Van Aarde, R.J. & Jackson, T.P., 2007, 'Megaparks for metapopulations: Addressing the causes of locally high elephant numbers in southern Africa', Biological Conservation 134(3), 289-297. https://doi.org/10.1016/j.biocon.2006.08.027 [ Links ] Van Aarde, R.J., Jackson, T.P., Guldemond, R.A.R., Kinahan, A.A., De Beer, Y., Shrader, A.M. et al., 2005, 'Elephants and their management in the Kruger National Park', in C.C. Grant (ed.), Elephant effects on biodiversity: An assessment of current knowledge and understanding as a basis for elephant management in SANParks, South African National Parks, pp. 220-223, Scientific Services, Skukuza. Scientific Report 3/2005. [ Links ] Van Aarde, R., Whyte, I. & Pimm, S., 1999, 'Culling and the dynamics of the Kruger National Park African elephant population', Animal Conservation Forum 2(4), 287-294. [ Links ] Van de Water, A. & Matteson, K., 2018, 'Human-elephant conflict in western Thailand: Socio-economic drivers and potential mitigation strategies', PLoS One 13(6), e0194736. https://doi.org/10.1371/journal.pone.0194736 [ Links ] Vogel, S.M., Henley, M.D., Rode, S.C., Van de Vyver, D., Meares, K.F., Simmons, G. et al., 2014, 'Elephant (Loxodonta africana) impact on trees used by nesting vultures and raptors in South Africa', African Journal of Ecology 52(4), 458-465. http://dx.doi.org/10.1111/aje.12140 [ Links ] Wall, J., Douglas-Hamilton, I. & Vollrath, F., 2006, 'Elephants avoid costly mountaineering', Current Biology 16(14), R527-R529. https://doi.org/10.1016/j.cub.2006.06.049 [ Links ] Wassenaar, T.D., Ferreira, S.M. & Van Aarde, R.J., 2007, 'Flagging aberrant sites and assemblages in restoration projects', Restoration Ecology 15(1), 68-76. https://doi.org/10.1111/j.1526-100X.2006.00191.x [ Links ] Western, D. & Maitumo, D., 2004, 'Woodland loss and restoration in a savanna park: A 20-year experiment', African Journal of Ecology 42(2), 111-121. https://doi.org/10.1111/j.1365-2028.2004.00506.x [ Links ] Wittemyer, G., Northrup, J.M., Blanc, J., Douglas-Hamilton, I., Omondi, P. & Burnham, K.P., 2014, 'Illegal killing for ivory drives global decline in African elephants', Proceedings of the National Academy of Sciences 111(36), 13117-13121. https://doi.org/10.1073/pnas.1403984111 [ Links ] Whyte, I.J., 2001, 'Conservation management of the Kruger National Park elephant population', PhD thesis, University of Pretoria, Pretoria, viewed 11 May 2018, from http://hdl.handle.net/20.500.11892/174640. [ Links ] Woolley, L.A., Millspaugh, J.J., Woods, R.J., Van Rensburg, S.J., Mackey, R.L., Page, B. et al., 2008, 'Population and individual elephant response to a catastrophic fire in Pilanesberg National Park', PLoS One 3(9), e3233. https://doi.org/10.1371/journal.pone.0003233 [ Links ] Young, K.D., Ferreira, S.M. & Van Aarde, R.J., 2009, 'Elephant spatial use in wet and dry savannas of southern Africa', Journal of Zoology 278(3), 189-205. https://doi.org/10.1111/j.1469-7998.2009.00568.x [ Links ] Young, T.P., 2000, 'Restoration ecology and conservation biology', Biological Conservation 92(1), 73-83. https://doi.org/10.1016/S0006-3207(99)00057-9 [ Links ] Received: 20 Dec. 2018 Williams, D., Patterson, M., Roggenbuck, J. & Watson, A., 1992, 'Beyond the commodity metaphor: Examining emotional and symbolic attachment to place', Leisure Sciences 14, 29-46. https://doi.org/10.1080/01490409209513155 [ Links ] Williams, D. & Stewart, S., 1998, 'Sense of place: An elusive concept that is finding a home in ecosystem management', Journal of Forestry 96, 18-23. [ Links ] Williams, D. & Vaske, J., 2003, 'The measurement of place attachment: Validity and generalizability of a psychometric approach', Forest Science 49(6), 830-840. [ Links ] Yuksel, A., Yuksel, F. & Bilim, Y., 2010, 'Destination attachment: Effects on customer satisfaction and cognitive, affective and connative loyalty', Tourism Management 31(2), 274-284. https://doi.org/10.1016/j.tourman.2009.03.007 [ Links ] Received: 25 Oct. 2018 ORIGINAL RESEARCH Ecology of palustrine wetlands in Lesotho: Vegetation classification, description and environmental factors Peter ChatangaI, II; Erwin J.J. SiebenI ISchool of Agricultural, Earth and Environmental Sciences, University of KwaZulu-Natal, Westville, Durban, South Africa ABSTRACT The description and classification of wetland vegetation is important for water resource management and biodiversity conservation as it provides an understanding of the wetland vegetation-environment relationships and information to interpret spatial variation in plant communities. This study discusses the vegetation of the palustrine wetlands of Lesotho based on a phytosociological approach. Data on vegetation and various environmental variables were collected using the Braun-Blanquet method and a standardised protocol developed for environmental information of wetlands in South Africa. The data were analysed mainly by clustering and ordination techniques. Twenty-two communities were found by the classification of the wetland vegetation. These communities were found to be diverse in terms of species richness. The ordination revealed that the wetland vegetation is mainly influenced by altitude, longitude, slope, soil parent material, landscape, inundation, potassium content, soil texture, total organic carbon, nitrogen, electrical conductivity and latitude. Regarding species composition and diversity, plant communities in the Highlands were more diverse and were distinctively different from those in the Lowlands. High-altitude communities were also found to be dominated mainly by C3 plants, while those at low altitudes exhibited the dominance of C4 species. Some communities were either restricted to the Highlands or Lowlands but others exhibited a wide ecological amplitude and occurred over an extensive altitudinal range. The diversity of most of the wetlands, coupled with their restricted habitat, distribution at high altitudes and their role in supplying ecosystem services that include water resources, highlights the high conservation value associated with these wetlands, particularly in the face of climate change and loss of biodiversity. Keywords: anthropogenic; biodiversity conservation; canonical ordination; climate change; Maloti-Drakensberg; plant community; palustrine wetlands; phytosociology; vegetation classification. Introduction Palustrine wetlands, which cover about 6% of the earth's land surface, are among the most ecologically sensitive ecosystems and very important globally because of their unique role in biogeochemical cycles (Junk et al. 2013; Mitsch & Gosselink 2015). Because they support azonal vegetation that is distinct from the surrounding vegetation (Mucina & Rutherford 2006; Sieben et al. 2016), wetlands are ecological 'islands' within terrestrial environments in different landscapes across the globe. The distinction results from the prolonged water logging that causes oxygen deficiency (hypoxia) or its total absence (anoxia) in the wetland soil, with subsequent chemical changes in soil characteristics (Gopal 2015; Mitsch & Gosselink 2015). Mucina and Rutherford (2006) observed that the presence of water, whether seasonal or permanent, is the primary factor in creating wetland habitats and associated vegetation. Nonetheless, it is not wetness per se that primarily influences the geochemistry and morphology of wetland soils, but rather the anaerobic conditions that result from prolonged soil saturation or flooding (Collins 2005; Kotze et al. 1996). Montane palustrine wetlands are a special sub-division of freshwater palustrine wetlands that are embedded within terrestrial ecosystems in mountain areas (Mucina & Rutherford 2006). These wetlands are often rich in endemics because many species remain isolated in high-altitude habitats (Junk et al. 2013). By providing a wide spectrum of ecosystem services, these ecosystems are of high ecological and socio-economic importance (Chatterjee et al. 2010). High-altitude wetlands provide essential ecosystem services which help to sustain human life, conserve biodiversity, preserve the hydrological regime and combat the impacts of climate change and are thereby key to water, food and ecological security (Singha 2011). Montane wetlands are located in the headwaters of major river basins, providing water for many trans-boundary rivers and play an important role in the ecology and hydrology of the local environment and downstream systems. They also play a fundamental role in the overall global and regional water cycles (Russi et al. 2013; Sieben, Mtshali & Janks 2014). The montane wetlands of Lesotho are important for the supply of ecosystem services, including biodiversity conservation, water resources, livestock grazing, harvestable plant products and environmental regulation. Lesotho forms an important hydrological reservoir and watershed for several countries in Southern Africa (Nüsser & Grab 2002). For example, the montane wetlands in the country form part of the headwaters of one of the most important international watercourses in Southern Africa, the Senqu-Orange River (ORASECOM 2015), which is not only important for Lesotho, but also for South Africa and Namibia. Lesotho falls entirely within the catchment of this river system (ORASECOM 2015) and the country is drained by the river and its tributaries. Moreover, the high-altitude wetlands of Lesotho are critical in maintaining the water levels not only in dams supporting the Lesotho Highlands Water Project (LHWP), which transfers water to South Africa (Grab & Deschamps 2004), but also in those supplying the local population. Directly and indirectly, wetlands in Lesotho are estimated to contribute about 22% of the country's gross domestic products (GDPs) and 30% of the total employment in the country (Department of Environment 2014). Furthermore, by providing freshwater that is transferred to the most densely populated and industrialised area of Gauteng, the wetlands in Lesotho also play a key role in the South African economy. The most ubiquitous and conspicuous feature of the wetland environment, which also plays a critical role in wetland ecosystem functioning, is the vegetation (Cronk & Fennessy 2001; Gopal 2016). As a result, the description of wetland habitats based on vegetation and the associated classifications are useful in strategic planning for the conservation of wetlands (Mitsch & Gosselink 2015). Plants are such a critical component of wetlands that they are the most widely supported biotic indicator for assessing wetland condition (Collins 2005). Accordingly, vegetation is the most suitable feature to consider over a broad range of wetland habitats (Sieben et al. 2014). Within a single wetland, a large diversity of habitats may occur, and as a result, large differences in the types of vegetation may be observed in the same wetland (Mitsch & Gosselink 2000). Therefore, wetland habitats can be classified based on the plant communities in the system (Collins 2005; Sieben, Kotze & Morris 2010a). Plant species occurring in a wetland can be used as indicators of environmental conditions and ecological changes taking place in the system (Mitsch & Gosselink 2015) because wetland vegetation is azonal (Brand, Du Preez & Brown 2013) and responds quickly to local environmental changes (Cronk & Fennessy 2001). Because the plant community gives a characterisation of habitat units within a wetland and also serves as habitat for associated animals, a detailed wetland vegetation description for a given wetland can be used as a proxy for the system's biodiversity in general, highlighting the conservation value of the wetland (Sieben et al. 2016). Accordingly, the determination of wetland plants that are useful as biological indicators has become increasingly important for use in monitoring the integrity of specific wetlands (Sieben et al. 2014). Wetland typology provides useful information for water resource management and biodiversity conservation (Sieben et al. 2014). Given the importance of wetlands, recent studies (Moor et al. 2017; Sieben et al. 2016) have emphasised the need for more information about their species composition, ecology and distribution. Although many studies have been carried out in the wetlands of surrounding South Africa (e.g. Brand et al. 2013; Sieben et al. 2014, 2016), no recent detailed countrywide survey has been conducted on the wetland vegetation of Lesotho. The current study is the first to provide a characterisation of the wetland vegetation in detail, covering many wetlands in the country. The aims of this study for the palustrine wetlands of Lesotho are: · to produce a phytosociological classification and name the wetland plant communities · to map the distribution of the vegetation of the palustrine wetlands using the phytosociological method · to explore and describe the wetland vegetation-environment relationships. Materials and methods Study design The vegetation of the palustrine wetlands of Lesotho was characterised using a phytosociological approach. The selection of wetlands for sampling was performed in such a way that as much wetland variation as possible in the country was captured with the available time and resources. An attempt was also made to include wetlands in protected areas such as national parks and nature reserves. Fieldwork was carried out during the wet (summer) season, which commenced in February 2017 and ended in March 2018. The study focused on accessible wetlands. In general, the method followed Sieben et al. (2014) to make the results compatible with the South African National Wetland Vegetation Database. Although many wetlands are showing signs of degradation, where wetland density was high and the systems showed little observable variation, large or near-pristine wetlands were selected for the assessment. Depending on the location, each wetland was classified as pristine, rural or urban (Table 1). A 3 × 3 m representative sample plot (quadrat) was then located randomly in each visually distinct and homogenous vegetation type of each selected wetland where different attributes of the vegetation and environment were measured and recorded. This plot size has been recommended for grassy wetlands in Southern Africa (Brown et al. 2013; Sieben et al. 2014). The same plot size has also been recommended for overgrazed grasslands (Brown et al. 2013), a situation that is common in some parts of Lesotho where wetland disturbance by livestock grazing and trampling is widespread. The number of plots per wetland was dependent on the number of observable distinct and homogenous vegetation units within the wetland. Assessment of vegetation and environmental variables In each plot, the Braun-Blanquet method, a protocol often used for collecting vegetation data in South Africa (Brown et al. 2013; Sieben et al. 2014), was used for vegetation assessment. Because this method has been applied in South Africa for several decades, it is possible to make comparisons between current and historical data (Brown et al. 2013), which allows for effective plant community comparisons. The method involves assessing wetland vegetation in a stratified manner where plots are placed randomly in each distinct plant community and the species composition is recorded by determining the species present, as well as estimating the cover for each species using a cover-abundance scale. Placing vegetation plots in a stratified manner ensures that as much variation as possible in the wetland is captured, including the different categories of indicators species - obligate wetland (OBL), facultative wetland (FACW), facultative (FAC), facultative upland (FACU) and obligate upland (UPL) (Mitsch & Gosselink 2015). Vegetation structure was described by making estimations of the proportion of the plot covered by vegetation and visually estimating the average height of the vegetation. In case of inundation, the average vegetation height was estimated from the soil surface (Sieben et al. 2014). During the survey, the plant species were identified with the help of botanical field guides (Pooley 2003; Van Oudtshoorn 2014) and those that could not be identified in the field were collected and later taken to the Roma Herbarium (ROML) at the National University of Lesotho for identification. For each plot, in addition to the vegetation attributes, a standardised protocol developed for environmental information of wetlands in South Africa was also used to systematically measure or assess a number of environmental variables that have been recommended for wetlands (Sieben et al. 2014). In at least one plot per wetland, a soil sample was collected from the top 15 cm of the soil (vegetation rooting zone) using a soil auger. Both vegetation and environmental data were recorded in a wetland field data collection form (Online Appendix 5). Because of the limited funding for the study, soil sampling was limited to one plot per wetland. The plot chosen for soil sampling would be the one representing the most widespread distinct community in the wetland. The samples were packaged in airtight (zipped) plastic bags for further analysis as recommended by Stohlgren et al. (1998). The soil samples were air-dried for at least 48 h and later analysed for different variables (Table 1). The soil analyses were performed by the analytical laboratory service of the Institute for Commercial Forestry Research in Pietermaritzburg, South Africa. The environmental and soil variables included in the study, as well as the methods used for their measurement or assessment, are briefly described (Table 1). While most variables were measured or assessed on site in all vegetation plots, additional soil variables (indicated with an asterisk in Table 1) were measured in the laboratory and only on those plots where soil samples were collected. After describing the plots in each wetland, as much of the wetland would be surveyed to record species occurring within the wetland system but were not encountered in the plots. This was in an attempt to ensure a species list that is as complete as possible for the wetland system for additional floristic analysis. Data analysis Both vegetation and environmental data were captured in Microsoft Excel spreadsheets from which they were imported into PC-Ord (Mjm Software Design, Gleneden Beach. OR, United States) and CANOCO (Microcomputer Power, Ithaca, NY, United States) programmes for analysis. Prior to importing into these programs for analysis, the Braun-Blanquet vegetation cover values were converted into percentage cover (Mueller-Dombois & Ellenberg 1974; Omar, Maroyi & Van Tol 2016; Van der Maarel 1979). ArcGIS version 10.2 was used to map the distribution range of the wetland vegetation plots in the study area and to determine the distribution range of the wetland plant communities in Lesotho. Based on the recommendations by Brown et al. (2013), species richness, diversity and evenness were determined. For each plot, these were determined by calculating Shannon-Weiner index (H′) and evenness index (E), as well as listing the species. The fraction of the plot that was occupied by species i was referred to as pi, and this value is an indication of the relative abundance of species i. The pi was used to calculate the H′ and E, which are surrogates of species diversity, by the following formulae (Ludwig & Reynolds 1988): where pi is the proportion of species i and ln is the natural logarithm. where s is the species richness (number of species). To elucidate the ecological patterns in the vegetation of the palustrine wetlands of Lesotho, a number of multivariate statistical techniques were employed. For the data analyses of this multivariate ecological community, three main types of analyses were employed: (1) hierarchical cluster analysis (HCA), (2) indicator species analysis (ISA) and (3) canonical correspondence analysis (CCA). These were performed mainly following Sieben et al. (2014). Classification and indicator species analysis Cluster analysis was used to classify sites with respect to similarity or dissimilarity (Van Tongeren 1995). Classification makes the use of similarity between vegetation plots such that plots which are more similar in species composition are grouped together. Classification facilitates the description and ecological interpretation of plant communities from a large amount of vegetation data. Classification and description of vegetation not only provide an understanding of the vegetation-environment relationships, but also information to interpret the spatial variation between plant communities (Clegg & O'Connor 2012). Accordingly, to obtain vegetation typology of the palustrine wetlands of Lesotho, agglomerative HCA was performed on vegetation data to identify homogenous plant communities in the wetlands. This would enable vegetation plots that are similar in species composition to be grouped together, with emphasis on the relationships between them (McCune & Mefford 2011; Van Tongeren 1995). The classification was performed by grouping vegetation plots based on species composition and abundance data. PC-Ord version 6.0 was used for the classification (McCune & Mefford 2011). Non-transformed percentage plant cover data were used for the clustering. The best interpretable classification was produced by the combination of the Sørenson's (Bray-Curtis) similarity index and Ward's linkage method. The Ward's method has been reported to have an advantage of producing clearly defined clusters (Pla et al. 2012). The plant communities obtained were named following the guidelines by Brown et al. (2013). However, in cases where there was no clear dominant, the name was derived from the description (structure and distribution) of the community. Indicator species analysis was used as an objective criterion for determining the optimal number of clusters in the final dendrogram. This was achieved by repeating the clustering algorithm while varying the number of clusters (Dufrêne & Legendre 1997) and the number that gave the lowest average p-value of the indicator species was used in the final dendrogram (Peck 2010). The ISA was also used in characterising different wetland plant communities obtained from the final clusters. Indicator species with indicator values (IVs) greater than 20 and significant (p ≤ 0.05) in the Monte Carlo permutation test were considered real indicators (Sieben et al. 2016) and were therefore listed for each cluster. The ISA is often used to test the fidelity (faithfulness) of a species to a given community. The Monte Carlo permutation test (also available in PC-Ord) was also used to test for the statistical significance of the fidelity of the indicator species to the communities (Dufrêne & Legendre 1997). The ISA was also conducted in PC-Ord. For each community obtained from the classification, the median and range for species richness, diversity index, and evenness and means for vegetation height and cover were determined. Ordination Another important feature of the analysis was the relationship between wetland plant communities and explanatory variables. Consequently, to examine the influence of environmental variables and gradients on wetland vegetation, the vegetation and environmental variable data and the plant communities obtained from the classification were subjected to canonical ordination (Ter Braak & Šmilauer 1998). This was performed twice: (1) constrained CCA on all vegetation plots using species abundance data and environmental variables and (2) constrained CCA only on those vegetation plots where soil samples had been taken, using species abundance data and more detailed explanatory data. Data of log-transformed percentage plant cover were used for the ordination. The choice for CCA for the ordination was based on the fact that the vegetation data were compositional and the gradient was greater than four units (Lepš & Šmilauer 2003). The canonical ordination was performed using CANOCO version 5.11 (Ter Braak & Šmilauer 1998). The statistical significance of the constrained ordination (relationship of communities with environmental variables) was tested using the unrestricted Monte Carlo permutation test available in CANOCO (Ter Braak 1995). The primary objective of canonical ordination is to detect the main pattern in the species-environment or community-environment relationships (Ter Braak 1995). The CCA helps to detect patterns of variation in the species data that can be explained best by the supplied environmental variables (McGarigal, Cushman & Stafford 2000). In the ordination output, the total variation in the data set is the sum of all the eigenvalues of all axes. The proportion of this total variation that is explained by the supplied explanatory variables is described as the variation explained and is the sum of all canonical eigenvalues divided by the total variation (Ter Braak 1995). In the ordination diagram, each arrow points in the direction of the steepest increase in the explanatory variable with its length proportional to its importance in explaining the variation, while the angle between the arrows indicates the correlation between individual variables (Ter Braak & Šmilauer 1998). Results Overall, 150 vegetation plots from 30 palustrine wetlands in Lesotho were analysed in this study (Figure 1). A total of 312 plant species belonging to 51 families occurred in the wetlands (Online Appendix 1 - Table 1-A1[a] and [b]). Of the 312 species, 276 were encountered in the 150 plots and the remaining 36 species occurred within the wetlands but outside the plots (Online Appendix 1 - Table 1-A1[a]; Online Appendix 2 - Table 1-A2). Five most dominant families, accounting for most of the species occurring in the wetlands, were Poaceae (20.19%), Asteraceae (19.23%), Cyperaceae (14.10%), Scrophulariaceae (4.17%) and Polygonaceae (3.85%) (Online Appendix 1 - Table 1-A1 [b]). From these results, it can be observed that three (Poaceae, Asteraceae and Cyperaceae) out of the 51 families account for 53.52% of all the species occurring in these wetlands. While the species richness of whole wetland units ranged between 10 and 53, the number of species per 3 × 3 m plot ranged from 1 (monospecific communities, e.g. community 19) to 27 (highly diverse communities, e.g. communities 3 and 4), with a median species richness of about 14. The highest median number of species for whole wetland units (41.5) was recorded in the Highlands and the lowest (26) in the Lowlands. The five most frequently occurring species in the wetlands all represent different families (Ranunculaceae, Leguminosae, Asteraceae, Poaceae and Cyperaceae) (Online Appendix 1 - Table 1-A1[a] and [b]). The type of metabolism (C3/C4) is also indicated in Online Appendix 1 - Table 1-A1[a] for some of the species. The species that were collected during fieldwork were deposited in the ROML at the National University of Lesotho. Classification Clustering of all the vegetation plots produced 22 distinct communities (Figure 2). The 22 communities are described in terms of their dominant species, indicator species and the associated IVs (Table 2). These communities were also grouped into five main clusters (wetland types), four highland wetland types (wetland types 1-4) and one lowland type (wetland type 5). While most of the high-altitude communities exhibited the dominance of C3 plants, most of the dominants in the low-altitude communities were C4 species. Exceptions are communities such as Schoenoplectus paludicola, Potamogeton thunbergii and Typha domingensis-Phragmites australis, which, although dominated by C3 plants, occurred at low altitudes. However, a mixture of C3 and C4 plants dominated the communities with a wide ecological amplitude (see Online Appendix 1 - Table 1-A1[a] for metabolic pathways of some of the species). The synoptic table for the classification of the wetland vegetation is provided in Online Appendix 2 - Table 1-A2. Ordination The CCA ordination diagram for all vegetation plots is presented in Figure 3. In this ordination, the total variation is 25.483 and the environmental variables supplied account for 18.11% of this. The first axis of the ordination is positively correlated with altitude, longitude, soil parent material and peat but negatively associated with landscape, inundation and aspect. Communities located on the right side of the ordination diagram (i.e. communities 1, 3, 5, 7, 10 and 20) are associated with near-pristine and high-altitude areas that are underlain by basalt and located in the eastern part of the country. Communities on the left side of the diagram (i.e. communities 6, 15, 16, 17, 18, 21 and 22) are associated with more inundated wetlands in the western lowland and more urbanised areas of the country that are underlain by sandstone. These communities are also associated with a shallower water column. The second axis of the ordination is best explained by slope but wetness and soil depth are also important factors. However, some communities occur on a wide range of altitudinal gradient and these include communities 12, 13 and 14. Thirty of the 150 vegetation plots had detailed soil data and this subset of the vegetation plots represents 15 of the 22 plant communities presented in Figure 2. Figure 4 presents the CCA ordination diagram for this subset of the vegetation plots. The total variation was 10.051 and 65.40% of this could be explained by the supplied explanatory variables. The first axis is positively correlated with potassium and percentage clay but is negatively correlated with altitude, longitude, total organic carbon, nitrogen, sulphur, percentage sand and sodium. While potassium and percentage clay have a strong positive correlation, total organic carbon, nitrogen, sulphur, percentage sand and longitude also have a strong positive correlation. The second axis is negatively correlated with latitude and positively associated with electrical conductivity, soil depth, magnesium and calcium content. Communities on the left side of the ordination diagram (i.e. communities 1, 3, 4, 8, 19 and 20) are in high-altitude areas and are associated with sand soils with high organic carbon, nitrogen, sulphur and sodium content and those on the right side (i.e. communities 9, 13, 17, 18, 21 and 22) are in the Lowlands and on soils with high potassium and clay levels. Those communities on the upper part of the ordination diagram, including communities 8, 9, 11, 12, 17, 19 and 20, are associated with high levels of electrical conductivity, calcium and magnesium, as well as deeper so Description and distribution of wetland plant communities The 22 plant communities were further described in terms of their most dominant species, structure, diversity and environmental conditions (Table 3). Species that are protected by law in the country are also highlighted in Table 3. Online Appendix 3 - Figure 5 presents some of these communities and Online Appendix 4 provides a further description of all the communities. The distribution range of the wetland vegetation in Lesotho is presented in Figure 1. Discussion The earliest studies on the palustrine wetlands of Lesotho were carried out in the early 1960s and 1970s (Guillarmod 1962; Van Zinderen Bakker & Werger 1974). Since then, other studies conducted in the country (Du Preez & Brown 2011; Grab & Deschamps 2004; Meakins & Duckett 1993) were mainly carried out on small areas, focusing on specific or a few wetlands. The current study has provided the most recent and more comprehensive assessment of the palustrine wetlands in the country by providing a classification and description of the wetland vegetation. The wetland vegetation has been classified into 22 communities, which are influenced mainly by altitude, longitude, slope, soil parent material, landscape, inundation, peat, soil potassium, clay, total organic carbon, nitrogen, sulphur, electrical conductivity, calcium, soil depth, wetness, magnesium, aspect and latitude. The wetlands were found to be occurring mainly in those areas where topography allows wetland conditions to develop (mostly in flat areas); mainly on the summit plateau and in the Lowlands. Nonetheless, it is noteworthy that there may be more communities in the country than the number reported here because only 150 plots from 30 wetlands were analysed in this study, although this forms an important starting point for documenting and classifying the wetland vegetation for Lesotho. Despite Lesotho being entirely Afromontane, the study found a clear distinction between wetlands that are found in the Highlands and those in the Lowlands, in terms of diversity, species making up the communities and structure of the communities (Table 3). While the highland wetlands (types 1-4) are mainly south-facing, those in the Lowlands (type 5) are mainly north-facing. Differences exist between the north- and south-facing slopes because of distinct solar radiation patterns. The resulting ecological differences that include snow cover duration and moisture conditions between the moister and colder south-facing slopes and the drier and warmer north-facing slopes contribute to the observed differences in vegetation types (Nüsser 2002). Indicators of wetland type 5 are typical lowland wetland plants. This wetland type is comparable to the most widespread and common type of wetlands in South Africa, the temperate grassy wetlands (Sieben et al. 2014). One of the highland wetland types (type 4) comprises wetlands that are found in the small high-altitude area underlain by sandstone and limited to the eastern edge of Lesotho (Sehlabathebe National Park). These wetlands are also located on very steep slopes. However, this wetland type was under-sampled in this study as it was represented by only two wetlands and nine vegetation plots. Despite the country's high altitude (1388-3482 m asl) and rugged terrain, qualifying it to be entirely Afromontane (Carbutt & Edwards 2015), some of the communities in the Lowlands also fit into the temperate grassy wetland vegetation of Sieben et al. (2017a) and the eastern temperate freshwater wetlands of Mucina and Rutherford (2006). All the wetlands surveyed in the current study can broadly be classified as the freshwater wetland vegetation type of Mucina and Rutherford (2006), which is further divided into eastern temperate freshwater wetlands (AZf 3), Drakensberg wetlands (AZf 4) and Lesotho mires (AZf 5). The dominance of Poaceae, Asteraceae, Cyperaceae and Scrophulariaceae families observed in the current study has also been reported in the entire Maloti-Drakensberg region and the surrounding areas, although Asteraceae was the most dominant in the latter (Chatanga et al. 2019). The current study also concurs with Sieben, Glen and Muasya (2017b) who report that Poaceae is the most common plant family in the South African wetlands based on species richness. However, of the five most dominant plant families recorded in the current study, two (Asteraceae and Scrophulariaceae) have higher than average levels of endemism in the Maloti-Drakensberg region (Cowling & Hilton-Taylor 1994). High levels of endemism in the high-altitude environments such as the Maloti-Drakensberg are attributed to the many small-scale microhabitats and a wide range of edaphic conditions that develop as a result of slope and aspect (Brand, Scott-Shaw & O'Connor 2019). The five most common species in the study all represent different families. This implies that the wetland vegetation in the country is phylogenetically diverse and this is unlike the situation in South Africa where the five most common wetland plant species are all grasses (Poaceae) (Sieben et al. 2014). The high altitude that characterises the greater part of Lesotho could account for this high diversity, and montane wetlands have been identified as some of the most species-rich in South Africa (Sieben et al. 2014). While the high-altitude montane wetland communities in Lesotho are more diverse and are virtually never a monoculture, the lowland wetland communities are generally less diverse and sometimes monospecific communities. In lowland wetlands, it is common for just one or two species to dominate the entire wetland plant community (Boutin & Keddy 1993; Sieben et al. 2010a). This trend, also exhibited in the current study, is contrary to the decline in species richness with altitude, which has widely been recognised as a general law of ecology (Rosenzweig 1995). However, the large number of species and communities recorded in this study generally reflects the high diversity of wetland habitats in the country, although the highest diversity is associated with higher altitudes. It is noteworthy that exceptions such as Kniphofia caulescens and Carex cognata communities usually exhibit lower diversity than other communities at such higher elevations. This suggests that the dominant species in these communities are so adapted to the harsh high-altitude conditions that they have developed a very large competitive effect on local resources and act as a habitat filter by excluding the less competitive species (Maire et al. 2012). It is also noteworthy that the Lowlands is the area subjected to more anthropogenic pressures that include cultivation, urbanisation and conversion to other forms of land use and this threatens the wetlands in this part of the country. The higher species richness and diversity in the Highlands highlights that these wetland habitats are more diverse than those in the Lowlands. This could be attributable, in part, to the fact that most of the dominant species in the high-altitude montane wetlands of the country are non-clonal (Table 3). Clonal plants are species that can reproduce vegetatively by sprouting from stolons or rhizomes, forming stands of individuals of that species (Song & Dong 2002). Typical clonal plants include Phragmites and Typha spp. that form dense rhizome mats and outcompete other non-clonal species. These findings corroborate Sieben et al. (2010b, 2017b) who suggest that, unlike lowland wetlands, high-altitude wetlands are unusual in that they are richer in species and particularly non-clonal species. Moreover, because the usually dominant wetland plants cannot cope well with the low temperatures characterising high-altitude environments, they cannot be as dominant as usual, leaving many vacant niches that then become available for colonisation by other plants (Sieben et al. 2010b). Furthermore, in wetland environments, the abundance of clonal plants has been reported to be negatively associated with the overall plant species diversity, as well as with altitude (Song & Dong 2002). The high diversity can also be attributed to the steep gradients in the landscape and harsh climatic conditions that create unique habitats in the mountains of Lesotho (Pooley 2003). The high diversity can further be ascribed to the underlying basaltic parent material. Mucina and Rutherford (2006) observe that the seepage water in these high-altitude wetlands is eutrophic as the underlying basalt is rich in nutrients. This also influences the floristic composition and community structure of the wetlands. These results are consistent with observations by Sieben et al. (2010a) who acknowledge the significant number of wetland community types in the montane areas of Lesotho. The high floristic diversity observed in the current study is also consistent with findings from the high-altitude montane wetlands of Alborz Mountains, Iran (Kamrani et al. 2011; Naqinezhad et al. 2009). The ordination of the vegetation data for all plots reveals that the explanatory environmental variables supplied could explain only about 18.11% of the total variation. This highlights that the remaining variation could be explained by the environmental factors which were not included in the analysis, such as precipitation (assessed only indirectly through longitude) and wetland water quality. It may also be that plants colonise wetland habitats by chance (Chesson 2000). However, the degree of variation explained in the ordination is comparable to similar studies in the wetlands of South Africa (Sieben et al. 2016, 2017a). Moreover, Brand et al. (2013) highlight that substrate and hydrogeological conditions play a bigger role in influencing the floristic composition, structure and dynamics in high-altitude montane wetlands than microclimate. The inclusion of soil variables in the analysis increased the proportion of the total variation explained by the supplied variables from 18.11% to 65.40%. Thus, the inclusion of soil data in the analysis significantly improves wetland vegetation-environment assessments. The degree of variation explained in the ordination with soil data is significantly higher than that reported for the South African wetlands (Sieben et al. 2016, 2017a). Nevertheless, the amount of variation explained after the inclusion of soil data could also have improved because the data set was smaller (30 vegetation plots). While the second axis is positively associated with slope, it is negatively correlated with the wetness and soil depth. This implies that communities on the lower part of the ordination diagram are associated with wetter habitats with deeper soils, while those on the upper part are associated with steeper slopes. The former include communities such as C. cognata-Juncus effusus, while the latter include communities such as Merxmuellera macowanii, which are often associated with hillslope seepages. The correlation between wetness and soil depth, which are both negatively correlated with slope, could be attributed to the soil deposition and water accumulation that is often consistent with fairly flat habitats. Altitude, longitude, slope, wetness, soil parent material, landscape, peat, inundation, aspect, soil depth and wetness have been observed to be very important factors explaining the distribution and variation of the wetland vegetation in this study. Abundance of peat is also strongly correlated with altitude and longitude. Because most of these Afromontane wetlands are often located on a slope at high altitudes, they are unique (Mucina & Rutherford 2006; Sieben et al. 2014). A temperature drop of 1 °C has been estimated for every 125 m gain in altitude in Lesotho and the Maloti-Drakensberg region (Pomela et al. 2000). Such steep environmental gradients over short distances (Körner, Paulsen & Spehn 2011) in Afromontane areas are associated with huge spatial variation in physical features and this results in remarkable variation in terms of species diversity and distribution (Kotze & O'Connor 2000). As a result, increasing altitude corresponds with a decrease in temperature and an increase in rainfall (Mucina & Rutherford 2006) and the greater part of Lesotho is generally much higher and colder than the surrounding areas (Sieben et al. 2014). The hypoxia or anoxia in the wetlands, coupled with the low temperature and pH, often associated with these high-altitude wetlands, reduces the rate of decomposition and favours the accumulation of organic matter and peat formation (Chatterjee et al. 2010; Gopal 2016). Therefore, lower temperatures, higher rainfall and other environmental conditions associated with high altitudes also create habitats that can harbour unique vegetation (Sieben et al. 2014). Through its influence on temperature and rainfall, altitude is a suitable surrogate measure for climate in Lesotho and the Maloti-Drakensberg region, which represents an indirect gradient (Sieben et al. 2010a). The strong correlation between longitude and altitude can therefore be explained by the fact that altitude generally increases on moving from west to east in Lesotho and rainfall also increases with altitude and with increasing longitude (Cowling & Hilton-Taylor 1994; Mucina & Rutherford 2006). The high altitudes of Lesotho are mainly associated with abundant orographic rainfall, which results in many springs and seepage zones (Mucina & Rutherford 2006; Sieben et al. 2014). The influence of altitude and wetness on high-altitude wetland vegetation has also been reported in South Africa (Kotze & O'Connor 2000; Mucina & Rutherford 2006; Sieben et al. 2010a, 2010b), southern Brazil (Rolon & Maltchik 2006) and in Cumbria, UK (Jones, Li & Maberly 2003). The importance of both altitude and slope gradients on the floristic composition of high-altitude montane wetlands has also been reported in Bulgaria, south-eastern Europe (Hájková, Hájek & Apostolova 2006) and in the Alborz Mountains, India (Kamrani et al. 2011; Naqinezhad et al. 2009). Although a negative correlation between altitude and wetness was observed in this study, altitude operates at a larger scale, whereas wetness operates on a local scale. It is nevertheless noteworthy that, while some communities are restricted to either the Highlands or Lowlands, others seem to have a wide ecological amplitude. These include Eragrostis plana-Pennisetum sphacelatum, Eleocharis dregeana and Eragrostis planiculmis communities. Furthermore, some species, such as Ranunculus meyeri Harv., have been reported to occur at low abundances at lower altitudes but achieve greater cover at higher altitudes as they gain a competitive advantage because of the lower temperatures that reduce the vigour of the usually more competitive species (Sieben et al. 2010b). Because some of the plant communities recorded in this study are restricted to the highest altitudes, occurring at the summit plateaus, they are likely to disappear in the face of climate change as they cannot migrate any further up (Bentley, Robertson & Barker 2019; Lee et al. 2015). While high-altitude communities (e.g. Limosella grandiflora-Haplocarpha nervosa, Agrostis bergiana and Cotula paludosa- R. meyeri communities) were also associated with soils that are high in total organic carbon, nitrogen and sulphur, the habitat soils for the low-altitude communities (e.g. Cynodon incompletus, Eleocharis limosa, S. paludicola and E. dregeana communities) were high in potassium and clay percentage. However, the negative correlation of potassium with altitude is contrary to Mucina and Rutherford (2006) who report that the high-altitude areas are associated with high potassium levels. In the current study, communities such as C. cognata, Gunnera perpensa and E. plana-P. sphacelatum were also found to be associated with high soil magnesium, calcium and electrical conductivity. The importance of potassium, electrical conductivity and clay percentage in influencing high-altitude montane wetland vegetation is consistent with findings from a similar study on the wetlands of the Alborz Mountains, India (Kamrani et al. 2011). Because of the low temperature and basaltic parent material, the soils in the mountains of Lesotho are high in organic matter and generally nutrient-rich, with a high water-retention capacity (Mucina & Rutherford 2006). However, the soils found in the Lowlands are considered to be generally nutrient-poor (Maro 2011). Conservation value and impacts of climate change Some of the species encountered in this study are protected by law in Lesotho (Table 3), which highlights the fact that they are threatened. The wetlands of Lesotho contribute significantly not only to biodiversity, but also provide a wide spectrum of ecosystem services, particularly in terms of water resources and livestock grazing. They are the headwaters of the five major, economically important rivers in the country, namely the Maliba-matšo, Senqu-Orange, Mohokare (Caledon), Makhaleng and Senqunyane, which also feed the LHWP dams (Department of Environment 2014). They play a major role in sustaining the perennial flow of water and regulating the water quality of the rivers that flow into the Atlantic Ocean (Pooley 2003). However, all the mountain areas in the country are drained through the Senqu-Orange River and its tributaries (Backéus & Grab 1995), the most important and most developed shared river system in Southern Africa. For South Africa, the water is tapped mainly through the LHWP. In fact, the Lesotho Highlands water is of national importance to the South African population as a significant portion of the agriculture in the arid regions of the country is watered from the aqueducts from the dams on the Senqu-Orange River. Because of their high carbon sequestration and storage capacity, the conservation of these wetlands can also play a role in mitigating global climate change. Peatlands are the second most important reservoir of carbon on earth after oceans (Russi et al. 2013). Climate change predictions highlight that much of Southern Africa will become drier (Mitchell 2013). Based on climate change modelling, by 2025, Namibia will probably experience problems of water quality and availability, Lesotho will be water-stressed and South Africa will be facing absolute water scarcity (SADC 2008). Accordingly, the conservation of these wetlands becomes indispensable. The wetlands of Lesotho are a critical resource for livestock grazing, especially in summer when thousands of cattle, sheep and goats are seen grazing on these sensitive ecosystems (Du Preez & Brown 2011; Van Zinderen Bakker & Werger 1974). In fact, much of the grazing in the mountains of Lesotho takes place within wetlands because they harbour the most palatable vegetation (Grab & Deschamps 2004). The Basotho are now sometimes observed keeping their livestock in the mountains throughout the year. This is contrary to their tradition of mostly inhabiting the Lowlands and taking their herds of livestock to the mountains in summer and returning them to the Lowlands during winter (Meakins & Duckett 1993). Thus, the value of these wetlands as a grazing resource is increasingly becoming greater. The widespread degradation and loss of wetlands, mainly because of grazing and trampling by cattle, sheep and goats, has been reported quite extensively since the 1960s (e.g. Backéus & Grab 1995; Du Preez & Brown 2011; Guillarmod 1962; Van Zinderen Bakker & Werger 1974). Most of the communities described here are threatened by grazing and trampling except for the M. macowanii community, which is unpalatable. It is painfully unpleasant to walk through the community because of the sharp tips of the dominant M. macowanii (Stapf) Conert. At least eight invasive alien species have been recorded in the wetlands and these include Paspalum dilatatum Poir., Cirsium vulgare (Savi) Ten., Cyperus esculentus L., Hypochaeris radicata L. and P. clandestinum Hochst. ex Chiov. While some of them occurred more frequently (e.g. P. dilatatum occurred in 16% of the plots and was the 11th most frequent species in the study), others occurred in relatively low frequencies (Online Appendix 1 - Table 1-A1[a]) but in large stands in a given wetland (e.g. C. vulgare). Paspalum dilatatum was found to be the fourth most dominant wetland species in South Africa, occurring in 9.1% of all the wetland vegetation plots in the country's database (Sieben et al. 2014). Invasive alien plants are not only among the major drivers of wetland degradation and loss in sub-Saharan Africa (Mitchell 2013), but also use wetlands as corridors to penetrate even terrestrial plant communities (Mucina & Rutherford 2006). The wetlands are further threatened mainly by the economic development associated with damming, mining and infrastructure development. Therefore, the unsustainable utilisation of the water and other resources, as well as other anthropogenic activities, in the different catchments of the country, would have an adverse effect on the wetlands and concomitantly diminish their capacity to supply the water resources. Nevertheless, montane wetlands generally remain less impacted than those in the Lowlands where human pressure is higher (Lee et al. 2015), although wetlands in general are among the most threatened ecosystems globally (Millennium Ecosystem Assessment 2005; Russi et al. 2013). Consequently, montane wetlands also serve as repositories and refugia for biodiversity and are regarded as biodiversity hot spots (Chatterjee et al. 2010). These wetlands can also potentially be threatened by climate change, which has been predicted to significantly alter the availability of water for individual montane wetlands and give rise to substantial shifts in the distribution and composition of wetlands in montane landscapes (Lee et al. 2015). Widespread ecological transitions have been reported to be likely at higher elevations because montane regions exhibit greater sensitivity to climate change (Bentley et al. 2019; Ryan et al. 2014). This will concomitantly give rise to widespread changes in the functioning of these wetlands and their delivery of ecosystem services. Projections have also indicated that climate change will cause potentially severe threats on peat-forming wetlands (Essl et al. 2012; Lee et al. 2015). The Maloti-Drakensberg area has been reported to be highly vulnerable to climate change (Brand et al. 2019). In the Maloti-Drakensberg, environmental domains that are defined by climate variables are projected to change substantially as a result of climate change, particularly an increase in temperature and a concomitant decline in water availability (Brand et al. 2019). Most of the species in the Maloti-Drakensberg are already at the highest altitudes and cannot shift any higher (Bentley et al. 2019). Furthermore, the pattern of increasing dominance of C3 plants in communities with increasing altitude, which is evident in this study and consistent with the findings of Kotze and O'Connor (2000) in KwaZulu-Natal, South Africa, highlights a threat to the high-altitude communities because C3 will be replaced with C4 plants as the climate changes. Conclusion Given their important role in water resources, livestock grazing and harbouring rare and endemic species, as well as unique biodiversity, the wetlands described in the current study are of high conservation value in Southern Africa, particularly in the face of increased water scarcity, climate change and unprecedented loss of biodiversity. Accordingly, the wetlands of Lesotho play a critical role in providing ecosystem services at the local, national and regional scales. As a result, the government of Lesotho and the Orange-Senqu River Commission (ORASECOM) have a responsibility in terms of scaling-up the efforts towards the protection of these wetlands for the sustainable provision of the benefits obtained from them. Because the wetland vegetation of a particular wetland can be used as a proxy for biodiversity of the wetland, understanding the wetland vegetation-environment patterns is important for the successful conservation planning of these ecosystems. Therefore, the current study has provided baseline information, which can be useful for monitoring the wetland vegetation and concomitantly the wetlands, which are vital for the water resources of Lesotho, South Africa and Namibia. Acknowledgements The authors would like to thank Khotso Kobisi and Moretloa J. Polaki who helped in identifying some of the species. The authors also thank Tumelo Tjale who helped in collecting part of the data. Competing interests The authors declare that they have no competing interests that may have inappropriately influenced them in writing this article. Authors' contributions P.C. led the conceptualisation of the study and conducted fieldwork, laboratory analysis and data analysis and wrote the manuscript. E.J.J.S. helped in conceptualising the study, conducting fieldwork and manuscript writing. Ethical considerations This article followed all ethical standards for research without direct contact with human or animal subjects. Funding information The study was funded by the University of KwaZulu-Natal and the National University of Lesotho. Data availability statement Permission to conduct the study was obtained from the Lesotho Department of Environment. Disclaimer The views expressed in this article are the authors' own and not an official position of their institutions or funders. References Backéus, I. & Grab, S., 1995, 'Mires in Lesotho', Gunneria 70, 243-250. [ Links ] Bentley, L.K., Robertson, M.P. & Barker, N.P., 2019, 'Range contraction to a higher elevation: The likely future of the montane vegetation in South Africa and Lesotho', Biodiversity and Conservation 28(1), 131-153. https://doi.org/10.1007/s10531-018-1643-6 [ Links ] Boutin, C. & Keddy, P.A., 1993, 'A functional classification of wetland plants', Journal of Vegetation Science 4(5), 591-600. https://doi.org/10.2307/3236124 [ Links ] Brand, R.F., Du Preez, P.J. & Brown, L.R., 2013, 'High altitude montane wetland vegetation classification of the Eastern Free State, South Africa', South African Journal of Botany 88(September), 223-236. https://doi.org/10.1016/j.sajb.2013.07.011 [ Links ] Brand, R.F., Scott-Shaw, C.R. & O'Connor, T.G., 2019, 'The alpine flora on inselberg summits in the Maloti-Drakensberg Park, KwaZulu-Natal, South Africa', Bothalia-African Biodiversity & Conservation 49(1), 1-15. https://doi.org/10.4102/abc.v49i1.2386 [ Links ] Brown, L.R., Du Preez, P.J., Bezuidenhout, H., Bredenkamp, G.J., Mostert, T.H.C. & Collins, N.B., 2013, 'Guidelines for phytosociological classifications and descriptions of vegetation in Southern Africa', Koedoe 55(1), Art. #1103, 1-10. https://doi:10.4102/koedoe.v55i1.1103 [ Links ] Carbutt, C. & Edwards, T.J., 2015, 'Reconciling ecological and phytogeographical spatial boundaries to clarify the limits of the montane and alpine regions of sub-Sahelian Africa', South African Journal of Botany 98(May), 64-75. https://doi.org/10.1016/j.sajb.2015.01.014 [ Links ] Chatanga, P., Kotze, D.C., Janks, M. & Sieben, E.J.J., 2019, 'Classification, description and environmental factors of montane wetland vegetation of the Maloti-Drakensberg region and the surrounding areas', South African Journal of Botany 125(September), 221-233. https://doi.org/10.1016/j.sajb.2019.04.028 [ Links ] Chatterjee, A., Blom, E., Gujja, B., Jacimovic, R., Beevers, L., O'Keeffe, J. et al., 2010, 'WWF initiatives to study the impact of climate change on Himalayan high-altitude wetlands (HAWs)', Mountain Research and Development 30(1), 42-52. https://doi.org/10.1659/MRD-JOURNAL-D-09-00091.1 [ Links ] Chesson, P., 2000, 'General theory of competitive coexistence in spatially-varying environments', Theoretical Population Biology 58(3), 211-237. https://doi.org/10.1006/tpbi.2000.1486 [ Links ] Clegg, B.W. & O'Connor, T.G., 2012, 'The vegetation of Malilangwe Wildlife Reserve, south-eastern Zimbabwe', African Journal of Range & Forage Science 29(3), 109-131. https://doi.org/10.2989/10220119.2012.744352 [ Links ] Collins, N.B., 2005, Wetlands: The basics and some more, Free State Department of Tourism, Environmental and Economic Affairs, Bloemfontein, viewed 07 April 2017, from https://www.dwa.gov.za/iwqs/rhp/provinces/freestate/wetlands_basics&more.pdf. [ Links ] Cowling, R.M. & Hilton-Taylor, C., 1994, 'Patterns of plant diversity and endemism in Southern Africa: An overview', in B.J. Huntley (ed.), Botanical diversity in Southern Africa, pp. 31-52, Botanical Research Institute, Pretoria. [ Links ] Cronk, J.K. & Fennessy, M.S., 2001, Wetland plants: Biology and ecology, Lewis Publishers, Boca Raton, FL. [ Links ] Department of Environment, 2014, Lesotho environment outlook report 2014: Environment for national prosperity, Ministry of Tourism, Environment and Culture, Maseru, Lesotho, 280 p. [ Links ] Dufrêne, M. & Legendre, P., 1997, 'Species assemblages and indicator species: The need for a flexible asymmetrical approach', Ecological Monographs 67(3), 345-366. https://doi.org/10.2307/2963459 [ Links ] Du Preez, P.J. & Brown, L.R., 2011, 'Impact of domestic animals on ecosystem integrity of Lesotho high altitude peatlands', in O. Grillo & G. Venora (eds.), Ecosystems biodiversity, pp. 249-271, InTech, Rijeka, Croatia. [ Links ] Essl, F., Dullinger, S., Moser, D., Rabitsch, W. & Kleinbauer, I., 2012, 'Vulnerability of mires under climate change: Implications for nature conservation and climate change adaptation', Biodiversity and Conservation 21(3), 655-669. https://doi.org/10.1007/s10531-011-0206-x [ Links ] Gopal, B. (ed.), 2015, Guidelines for rapid assessment of biodiversity and ecosystem services of wetlands, version 1.0, Asia-Pacific Network for Global Change Research (APN-GCR), Kobe, Japan, and National Institute of Ecology, New Delhi, 134 p. [ Links ] Gopal, B., 2016, 'Should "wetlands" cover all aquatic ecosystems and do macrophytes make a difference to their ecosystem services?', Folia Geobotanica 51(3), 209-226. https://doi.org/10.1007/s12224-016-9248-x [ Links ] Grab, S.W. & Deschamps, C.L., 2004, 'Geomorphological and geoecological controls and processes following gully development in alpine mires, Lesotho', Arctic, Antarctic, and Alpine Research 36(1), 49-58. https://doi.org/10.1657/1523-0430(2004)036[0049:GAGCAP]2.0.CO;2 [ Links ] Guillarmod, A.J., 1962, 'The bogs and sponges of the Basutoland Mountains', South African Journal of Science 58(6), 179-182. [ Links ] Hájková, P., Hájek, M. & Apostolova, I., 2006, 'Diversity of wetland vegetation in the Bulgarian high mountains, main gradients and context-dependence of the pH role', Plant Ecology 184(1), 111-130. https://doi.org/10.1007/s11258-005-9056-5 [ Links ] Jones, J.I., Li, W. & Maberly, S.C., 2003, 'Area, altitude and aquatic plant diversity', Ecography 26(4), 411-420. https://doi.org/10.1034/j.1600-0587.2003.03554.x [ Links ] Junk, W.J., An, S., Finlayson, C.M., Gopal, B., Květ, J., Mitchell, S.A. et al., 2013, 'Current state of knowledge regarding the world's wetlands and their future under global climate change: A synthesis', Aquatic Sciences 75(1), 151-167. https://doi.org/10.1007/s00027-012-0278-z [ Links ] Kamrani, A., Jalili, A., Naqinezhad, A., Attar, F., Maassoumi, A.A. & Shaw, S.C., 2011, 'Relationships between environmental variables and vegetation across mountain wetland sites, N. Iran', Biologia 66(1), 76-87. https://doi.org/10.2478/s11756-010-0127-2 [ Links ] Körner, C., Paulsen, J. & Spehn, E.M., 2011, 'A definition of mountains and their bioclimatic belts for global comparisons of biodiversity data', Alpine Botany 121(2), 73-78. https://doi.org/10.1007/s00035-011-0094-4 [ Links ] Kotze, D.C. & O'Connor, T.G., 2000, 'Vegetation variation within and among palustrine wetlands along an altitudinal gradient in KwaZulu-Natal, South Africa', Plant Ecology 146(1), 77-96. https://doi.org/10.1023/a:1009812300843 [ Links ] Kotze, D.C., Klug, J.R., Hughes, J.C. & Breen, C.M., 1996, 'Improved criteria for classifying hydric soils in South Africa', South African Journal of Plant and Soil 13(3), 67-73. https://doi.org/10.1080/02571862.1996.10634378 [ Links ] Lee, S.-Y., Ryan, M.E., Hamlet, A.F., Palen, W.J., Lawler, J.J. & Halabisky, M., 2015, 'Projecting the hydrologic impacts of climate change on montane wetlands', PLoS ONE 10(9), e0136385. https://doi.org/10.1371/journal.pone.0136385 [ Links ] Leketa, K., Migwi, M., Crane, E., Upton, K., Ó Dochartaigh, B. & Bellwood-Howard, I., 2018, Africa groundwater atlas: Hydrogeology of Lesotho. British Geological Survey, viewed 06 August 2018, from http://earthwise.bgs.ac.uk/index.php/Hydrogeology_of_Lesotho. [ Links ] Lepš, J. & Šmilauer, P., 2003, Multivariate analysis of ecological data using CANOCO, Cambridge University Press, Cambridge. [ Links ] Ludwig, J.A. & Reynolds, J.F., 1988, Statistical ecology: A primer on methods and computing, John Wiley and Sons, New York. [ Links ] Maire, V., Gross, N., Börger, L., Proulx, R., Wirth, C., Da Silveira Pontes, L. et al., 2012, 'Habitat filtering and niche differentiation jointly explain species relative abundance within grassland communities along fertility and disturbance gradients', New Phytologist 196(2), 497-509. https://doi.org/10.1111/j.1469-8137.2012.04287.x [ Links ] Maro, P., 2011, Environmental change in Lesotho: An analysis of the causes and consequences of land-use change in the Lowland Region, Springer, London. [ Links ] McCune, B. & Mefford, M.J., 2011, PC-ORD. Multivariate analysis of ecological data. Version 6.0, MjM Software Design, Gleneden Beach, OR. [ Links ] McGarigal, K., Cushman, S. & Stafford, S., 2000, Multivariate statistics for wildlife and ecology research, Springer-Verlag Inc., New York. [ Links ] Meakins, R.H. & Duckett, J.D., 1993, 'Vanishing bogs of the Mountain Kingdom', Veld and Flora 79(2), 49-51. [ Links ] Millennium Ecosystem Assessment, 2005, Ecosystems and human well-being: Wetlands and water synthesis, World Resources Institute, Washington, DC. [ Links ] Mitchell, S.A., 2013, 'The status of wetlands, threats and the predicted effect of global climate change: The situation in sub-Saharan Africa', Aquatic Sciences 75(1), 95-112. https://doi.org/10.1007/s00027-012-0259-2 [ Links ] Mitsch, W.J. & Gosselink, J.G., 2000, 'The value of wetlands: Importance of scale and landscape setting', Ecological Economics 35(1), 25-33. https://doi.org/10.1016/S0921-8009(00)00165-8 [ Links ] Mitsch, W.J. & Gosselink, J.G., 2015, Wetlands, 5th edn., Wiley, Hoboken, NJ. [ Links ] Moor, H., Rydin, H., Hylander, K., Nilsson, M.B., Lindborg, R. & Norberg, J., 2017, 'Towards a trait-based ecology of wetland vegetation', Journal of Ecology 105(6), 1623-1635. https://doi.org/10.1111/1365-2745.12734 [ Links ] Mucina, L. & Rutherford, M.C. (eds.), 2006, The vegetation of South Africa, Lesotho and Swaziland, Strelitzia 19, South African National Biodiversity Institute (SANBI), Pretoria. [ Links ] Mueller-Dombois, D. & Ellenberg, H., 1974, Aims and methods of vegetation ecology, John Wiley and Sons, New York. [ Links ] Mugomeri, E., Chatanga, P., Raditladi, T. & Tarirai, C., 2016, 'Ethnobotanical study and conservation status of local medicinal plants: Towards a repository and monograph of herbal medicines in Lesotho', African Journal of Traditional, Complementary & Alternative Medicines 13(1), 138-151. https://doi.org/10.4314/ajtcam.v13i1.20 [ Links ] Naqinezhad, A., Jalili, A., Attar, F., Ghahreman, A., Wheeler, B.D., Hodgson, J.G. et al., 2009, 'Floristic characteristics of the wetland sites on dry southern slopes of the Alborz Mts., N. Iran: The role of altitude in floristic composition', Flora - Morphology, Distribution, Functional Ecology of Plants 204(4), 254-269. https://doi.org/10.1016/j.flora.2008.02.004 [ Links ] Nüsser, M., 2002, 'Pastoral utilization and land cover change: A case study from the Sanqebethu Valley, eastern Lesotho', Erdkunde 56(2), 207-221. https://doi.org/10.3112/erdkunde.2002.02.07 [ Links ] Nüsser, M. & Grab, S., 2002, 'Land degradation and soil erosion in the eastern highlands of Lesotho, Southern Africa', DIE ERDE 133, 291-311. [ Links ] Ollis, D., Snaddon, K., Job, N. & Mbona, N., 2013, Classification system for wetlands and other aquatic ecosystems in South Africa. User manual: Inland systems. SANBI biodiversity series 22, South African National Biodiversity Institute, Pretoria. [ Links ] Omar, M.Y., Maroyi, A. & Van Tol, J.J., 2016, 'Floral diversity, composition and distribution in a montane wetland in Hogsback, the Eastern Cape Province, South Africa', Pakistan Journal of Botany 48(5), 1861-1870. [ Links ] ORASECOM, 2015, Orange-Senqu River Commission 15 years 2000-2015, Orange-Senqu River Commission, Gauteng, 60 p. [ Links ] Peck, J.E., 2010, Step-by-step using PC-Ord. Multivariate analysis for community ecologists, MjM Software Design, Gleneden Beach, OR. [ Links ] Pla, L., Casanoves, F. & Di Rienzo, J., 2012, Functional diversity indices, Springer, London. [ Links ] Pomela, E.M., Mokuku, C., Maabataung, S., Phororo, R., Makoae, M., Majoro, M. et al., 2000, Biological diversity in Lesotho: A country study, National Environmental Secratariat, Government of Lesotho, Maseru. [ Links ] Pooley, E., 2003, Mountain flowers: A field guide to the flora of the Drakensberg and Lesotho, 1st edn., Flora Publications Trust, Durban, 320 p.-illus., col. illus. [ Links ] Rolon, A.S. & Maltchik, L., 2006, 'Environmental factors as predictors of aquatic macrophyte richness and composition in wetlands of southern Brazil', Hydrobiologia 556(1), 221-231. https://doi.org/10.1007/s10750-005-1364-1 [ Links ] Rosenzweig, M.L., 1995, Species diversity in space and time, Cambridge University Press, Cambridge. [ Links ] Russi, D., Ten Brink, P., Farmer, A., Badura, T., Coates, D., Förster, J. et al., 2013, The economics of ecosystems and biodiversity for water and wetlands, IEEP, London. [ Links ] Ryan, M.E., Palen, W.J., Adams, M.J. & Rochefort, R.M., 2014, 'Amphibians in the climate vise: Loss and restoration of resilience of montane wetland ecosystems in the western US', Frontiers in Ecology and the Environment 12(4), 232-240. https://doi.org/10.1890/130145 [ Links ] SADC, 2008, Southern Africa environment outlook, SADC, SARDC, IUCN & UNEP, Gaborone. [ Links ] Sieben, E.J.J., Collins, N.B., Kotze, D.C., Mofutsanyana, S.S. & Janks, M., 2017a, 'Temperate grassy wetlands of South Africa: Description, classification and explanatory environmental factors', South African Journal of Botany 113(November), 68-76. https://doi.org/10.1016/j.sajb.2017.07.009 [ Links ] Sieben, E.J.J., Glen, R.P. & Muasya, A.M., 2017b, 'The wetland flora of South Africa: Occurrence patterns, frequency and dominance across a diverse landscape', Aquatic Botany 142(September), 112-118. https://doi.org/10.1016/j.aquabot.2017.03.003 [ Links ] Sieben, E.J.J., Kotze, D.C. & Morris, C.D., 2010a, 'Floristic composition of wetlands of the South African section of the Maloti-Drakensberg Transfrontier Park', Bothalia 40(1), 117-134. https://doi.org/10.4102/abc.v40i1.201 [ Links ] Sieben, E.J.J., Morris, C.D., Kotze, D.C. & Muasya, A.M., 2010b, 'Changes in plant form and function across altitudinal and wetness gradients in the wetlands of the Maloti-Drakensberg, South Africa', Plant Ecology 207(1), 107-119. https://doi.org/10.1007/s11258-009-9657-5 [ Links ] Sieben, E.J.J., Mtshali, H. & Janks, M., 2014, National wetland vegetation database: Classification and analysis of wetland vegetation types for conservation planning and monitoring, Report no. WRC 1980/1/14, Water Research Commission (WRC), Pretoria, South Africa, 255 p. [ Links ] Sieben, E.J.J., Nyambeni, T., Mtshali, H., Corry, F.T.J., Venter, C.E., MacKenzie, D.R. et al., 2016, 'The herbaceous vegetation of subtropical freshwater wetlands in South Africa: Classification, description and explanatory environmental factors', South African Journal of Botany 104(May), 158-166. https://doi.org/10.1016/j.sajb.2015.11.005 [ Links ] Singha, V., 2011, High altitude wetlands project: A retrospective, WWF, Kathmandu, Nepal. [ Links ] Song, M. & Dong, M., 2002, 'Clonal plants and plant species diversity in wetland ecosystems in China', Journal of Vegetation Science 13(2), 237-244. https://doi.org/10.1111/j.1654-1103.2002.tb02044.x [ Links ] Stohlgren, T.J., Bull, K.A., Otsuki, Y., Villa, C.A. & Lee, M., 1998, 'Riparian zones as havens for exotic plant species in the central grasslands', Plant Ecology 138(1), 113-125. https://doi.org/10.1023/A:1009764909413 [ Links ] Ter Braak, C.J.F., 1995, 'Ordination', in R.H.G. Jongman, C.J.F. ter Braak & O.F.R. van Tongeren (eds.), Data analysis in community and landscape ecology, pp. 91-173, Cambridge University Press, Cambridge. [ Links ] Ter Braak, C.J.F. & Šmilauer, P., 1998, Canoco reference manual and user's guide to Canoco for Windows: Software for canonical community ordination (version 4), Microcomputer Power, Ithaca, NY. [ Links ] Van der Maarel, E., 1979, 'Transformation of cover-abundance values in phytosociology and its effects on community similarity', Vegetatio 39(2), 97-114. https://doi.org/10.1007/bf00052021 [ Links ] Van Oudtshoorn, F., 2014, Guide to grasses of Southern Africa, 3rd edn., Briza Publications, Pretoria. [ Links ] Van Tongeren, O.F.R., 1995, 'Cluster analysis', in R.H.G. Jongman, C.J.F. ter Braak & O.F.R. van Tongeren (eds.), Data analysis in community and landscape ecology, pp. 174-212, Cambridge University Press, Cambridge. [ Links ] Van Zinderen Bakker, E.M. & Werger, M.J.A., 1974, 'Environment, vegetation and phytogeography of the high-altitude bogs of Lesotho', Vegetatio 29(1), 37-49. https://doi.org/10.1007/BF02390894 [ Links ] Received: 18 Apr. 2019 SHORT COMMUNICATION The genetic status of the introduced giraffe population in Central South Africa Marika E. van NiekerkI; Francois DeaconII; Paul J. GroblerI IDepartment of Genetics, University of the Free State, Bloemfontein, South Africa Introduction There has been no reliable historical evidence of giraffe occurring naturally in the Free State Province in Central South Africa (Dagg 1962; Deacon & Parker 2016; Sydney 1965). Although Lynch (1983) mentioned the possibility of the natural distribution of giraffe in the East and Western Free State, there is no concrete evidence that giraffe existed earlier than this in the Free State (Ansell 1968). According to Griesel (1961), Hirst (1966), Lambrechts (1974) and Terblanche and Kok (1995), translocations of the species into protected areas and private land in the Free State Province happened in any case, sometimes regardless of the natural habitat preferences of giraffe (Castley, Boshof & Kerley 2001; Deacon & Tutchings 2019). These authors also affirmed that giraffe had, however, occurred naturally westwards of the Free State, in the Northern Cape Province. The introduced status of the giraffe population in Central South Africa, and in particular the Free State Province, thus raises questions regarding the origin and the taxonomic status of these animals. Although giraffe is an introduced species in the Free State Province, it is also a reality that extralimital populations of large mammals add value to ecotourism in self-financing private protected areas (Maciejewski & Kerley 2014) and are therefore kept on many properties. Extralimital animals can also still add conservation value by contributing to long-term population survival, while extralimital populations could in some cases nevertheless be a reservoir of valuable genetic resources. The newly created ownership in wildlife species not only contributes to diversity in wildlife species for ecotourism, but also assists to protect valuable and key resource areas and habitat for all fauna and flora. Giraffe taxonomy and subspecies status have been the subject of much debate over the last century. It should also be noted that there have been only limited representation from South African populations in the reported studies. Bercovitch and Deacon (2015, 2017) stated that there are currently at least four different taxonomic classifications for giraffe with the current global acceptance of nine subspecies (Muller et al. 2016). Most recently, Fennessy et al. (2016) and Winter et al. (2018) suggested a new taxonomy for giraffe with four genetically distinct giraffe species instead of one, but this has not been accepted by the International Union for Conservation of Nature (IUCN) who requested more evidence and a larger sample size; and the status quo at least for now is one species with nine subspecies (Bercovitch et al. 2017). It should also be noted that the aforementioned genetic studies have only limited representation from South African populations. Irrespective of the exact classification system used (one or four species), all the current classification systems include recognition of a 'South African giraffe' (Giraffa camelopardalis giraffe/G. giraffa giraffa) and the 'Angolan giraffe' (Giraffa camelopardalis angolensis [G. c. angolensis]/Giraffa giraffa angolensis [G. g. angolensis]). Fennessy et al. (2016) suggested that South Africa harbours only the South African giraffe. However, Deacon and Parker (2016) state that the Angolan giraffe has been translocated from Namibia to countries such as Botswana and South Africa, and some game ranches might contain a mixture of subspecies, or even hybrid giraffe. The extent of historical natural migration of animals between regions is also not known. The available data on historical and current distribution ranges of South African giraffe are shown in Figure 1 (based on the IUCN Red List assessment of Muller et al. 2018). In addition to taxonomic considerations, genetic diversity within giraffe populations in the region is also a potential cause for concern (Deacon & Tutchings 2019). In the Free State Province, giraffe are almost invariably found in small populations, for reasons of habitat availability or because they may not be utilised as intensively as some other wildlife species. The number of giraffe found on farms thus ranges from populations numbering 10-30 down to populations with single pairs of animals, with the potential risk of decreased genetic diversity and ultimately reduced fitness or adaptability. Management strategies to maintain diversity is needed, but, conversely, the necessary translocations needed to conserve genetic diversity could hold risks if the taxa involved are significantly different, in line with theory on the mixing of distinct taxonomic units (Crandall et al. 2000; Moritz 2002) and outbreeding depression (Edmands 2006). With little being known about the effect of extralimital introductions and fragmentation in giraffe populations in Central South Africa, the aim of the current project was to determine the genetic structure of giraffe in Central South Africa relative to the wider southern African population, and also obtain an estimate of genetic diversity within and between individual giraffe populations. Methods Study sites and sample collection We collected samples from three groups: (1) A total of 34 giraffe were sampled across 10 privately owned herds in the Free State Province (FS-Private). The census population size (N) of these groups ranged from 2 to 30+; and the ultimate origins of the animals in these populations are unknown other than the fact that founding involved several sources and that translocations among populations have occurred in recent times. (2) As representative of giraffe in public protected herds from the Province, nine giraffe were sampled from the Willem Pretorius Provincial Nature Reserve (N=21). Two groups of founders sourced from the Limpopo Province and one group from the KwaZulu-Natal Province were originally used to start this population (FS-Protected area). (3) Finally, four giraffe were sampled from a privately owned herd in the adjacent Northern Cape Province (N = 20). Eight individuals were translocated to this locality from Namibia in 1971, with another six individuals translocated from the then Transvaal Province in northern-eastern South Africa in 1973. We used dung as the preferred sample type, to minimise stress on the individuals, as well as for cost purposes, ethical considerations and ease of access to populations. The procedure followed at each locality was as follows: once a giraffe was found, it was observed until defecation had occurred. The exact spot was noted; the giraffe was characterised using size, sex and patterns on its body to prevent duplicate sampling; and the sample retrieved. Samples were stored in 96% ethanol and at -20 °C as soon as possible after collection. A small number of skeletal muscle and blood samples available opportunistically for specific localities were also included. Genetic analysis Deoxyribonucleic acid (DNA) was extracted using the Zymo Research ZR Fecal DNA MiniPrep™ kit used for dung samples, the Zymo Research Quick-DNA™ FFPE MiniPrep kit for tissue samples and the Roche High Pure PCR Template Preparation kit used for blood samples. A NanoDrop® ND-1000 Spectrophotometer was used to determine the quantity and quality of extracted DNA. We sequenced sections of the cytochrome b (Cytb) and displacement loop (D-loop) mitochondrial DNA (mtDNA) regions. The Cytb primers used were from a study done by Bock et al. (2014): forward - GTG GAA GGC GAA GAA TCG; reverse - GAA AAA CCA TCG TTG TCG T; with the sequences of primers used for the D-loop region sourced from a study done by Seymour (2001): forward - CCC AAA GCT GAA GTT CTA TT; reverse - CAA TAA CTG TAT GTA CTA TG-3′. PCR reactions were based on the Kapa2G™ Robust HotStart ReadyMix PCR Kit for the Cytb region, with the Ampliqon TEMPase Hot Master Mix A Kit used for the D-loop region. Annealing temperatures were 62 °C and 50 °C, respectively. Polymerase chain reaction (PCR) products were cleaned using the Biospin PCR Purification Kit (Bio-Rad), followed by sequencing (in both directions) using the ABI PRISM® BigDye® Terminator version 3.1 Cycle Sequencing Kit and standard conditions. Products were cleaned using the ZR DNA Sequencing Clean-up™ Kit, before running on either an ABI3130 or 3500 Genetic Analyser. Data analysis Geneious Pro version 4.7.4 software (Kearse et al. 2012) was used to view, assemble and align all sequences. Mega v7.0.26 software (Kumar, Stecher & Tamura 2016) was utilised to identify the best model of substitution for each mtDNA region separately. The haplotypes for Cytb and the D-loop region were then combined into a concatenated dataset for all subsequent analyses. Phylogenetic trees were constructed using a maximum likelihood (ML) approach, with 1000 bootstrap replications (in MEGA software). To complement the phylogenetic analysis, Network version 5.0.1.1 software (Fluxus Engineering 2019, www.fluxux-engineering.com) was used to construct haplotype networks, using a median-joining approach. Genetic divergence between populations was quantified as the average number of nucleotide differences between populations (Dxy), from DNA Sequence Polymorphism (DnaSP) version 5 (Rozas et al. 2003), and genetic diversity within each group using haplotype diversity (Hd) and nucleotide diversity (π) from DnaSP software. As a reference database for G. c. giraffa and G. c. angolensis, the concatenated mtDNA D-loop and Cytb sequences used by Winter et al. (2018) were made available by these authors. The latter authors also provided sequences for G. c. peralta and G. c. tippelskilchi, to use as an out-group. Ethical considerations The methods employed during this study were approved by the Interfaculty Animal Ethics Committee of the University of the Free State (Numbers: UFS-AED2015/0050 and UFS-AED2015/0066). Collection of samples was sanctioned under permits issued by DESTEA (Permit number: 01/30305) and the Northern Cape Department of Environment and Nature Conservation (Permit number: FAUNA 0729/2017 and FAUNA 0730/2017). Section 20 veterinary approval for the collection, transport and storage of samples was obtained from the National Department of Agriculture, Forestry and Fisheries (DAFF), with approval number 12/11/1/4. Results After alignment of sequences and trimming to equal length, a sequence length of 405 base pairs (bp) was used for further analysis of the Cytb gene, with 275 bp available for the D-loop region. The two Cytb haplotypes observed have been submitted to the GenBank database as MH033837 and MH033838, and the 10 haplotypes for the D-loop region as MH033839 to MH033848. Our concatenated sequences were aligned with the reference sequences (total 1556 bp and all sequences trimmed to the shared 680 bp. The data for the two mtDNA regions were tested separately to determine the model of substitution, and both regions were best described by a Tamura 3-parameter model of substitution. A phylogenetic tree, based on the concatenated dataset and an ML approach, is presented in Figure 2a. All the G. c. giraffa reference sequences form a clade with 75% bootstrap support, separate from G. c. angolensis. This cluster also contains all the giraffe samples from the Free State protected area and 14 giraffe samples from private farms in the Free State Province. All other giraffe samples from the private farms in the Free State Province, comprising 21 individuals, cluster with G. c. angolensis, as do the four samples from the Northern Cape. The reference G. c. peralta and G. c. tippelskirchi haplotypes formed a distinct cluster with 100% bootstrap support. The trend from the ML tree is confirmed in the haplotype network presented in Figure 2b. Haplotypes of G. c. angolensis and G. c. giraffa form distinct clusters, with giraffe from a Free State protected area clustering with G. c. giraffa and with giraffe from private populations grouping with one or the other subspecies. The average number of nucleotide differences between reference sample sets of G. c. giraffa and G. c. angolensis was Dxy = 0.033. This value was regarded as representative of the difference between pure populations of the two subspecies and was therefore used as a yardstick to gauge the relative magnitude of values obtained for pairwise comparisons between each of the studied populations and the two subspecies. The population from the Free State protected area showed comparatively low differentiation from G. c. giraffa, with Dxy = 0.014, but with Dxy = 0.020 when compared with G. c. angolensis. The Northern Cape population showed close identity with G. c. angolensis, with Dxy = 0.004, but Dxy between the Northern Cape group and G. c. giraffa was much higher at 0.034, thus equalling the distance between G. c. giraffa and G. c. angolensis. The Dxy value between the privately owned giraffes and G. c. giraffa and G. c. angolensis was 0.028 and 0.009, respectively. Levels of genetic diversity within groups were as follows (with format - number of haplotypes/number of polymorphic sites/haplotype diversity [Hd] and nucleotide diversity [π]): FS-private populations - 10/19/0.814/0.011; FS-protected area - 2/1/0.389/0.001 and Northern Cape - 2/1/0.667/0.008. By comparison, values for the reference datasets were G. c. giraffa - 7/6/0.508/0.001 and G. c. angolensis - 7/6/0.844/π = 0.003. Discussion Although we were not able to sequence the full length of mtDNA used by Winter et al. (2018), results from the current study provided valuable new data on the status of the giraffe population in Central South Africa. Based on the concatenated mtDNA Cytb and D-loop dataset used, a total of 23 individuals classified as G. c. giraffa. These animals originated from a Provincial Nature Reserve and six private game farms. This is in line with expectations that locally sampled individuals would have mtDNA lineages of what is currently regarded as the South African giraffe subspecies. Unexpectedly, 24 individuals from the present study classified as G. c. angolensis. This outcome suggests that a significant number of individuals with mtDNA lineages of the Angolan giraffe rather than the South African giraffe are present in the Central South African giraffe population. We note that those individuals displaying G. c. angolensis haplotypes may also be hybrids, either first generation or more advanced generations, resulting from initial crosses involving G. c. giraffa males and G. c. angolensis females. (Conversely, some of the individuals classified as G. c. giraffa may also be hybrids, with male G. c. angolensis individuals in their pedigrees.) Population-genetic analysis based on the average number of nucleotide differences between groups confirmed that the overall privately owned giraffe herds in Central South Africa show an unexpected identity with G. c. angolensis. There are two possible scenarios to explain the observation of a G. c. angolensis lineage in South African populations, based on artificial translocations and unrecorded historical migrations. The giraffe is a popular game ranching species, and there has been substantial commercial movement of the animal around the sub-continent (Deacon & Parker 2016). The findings that some of the giraffe sampled in the Free State are potentially Angolan giraffe may exemplify how the subspecies has been given a more southern distribution to what was previously thought, through translocations. This can be partly explained by the close historical and current link between South Africa and Namibia, with substantial translocation of game animals between the two countries, and individuals of G. c. angolensis may have found their way into South Africa along this route. For example, the Kglagadi Transfrontier Park contains both introduced G. c. angolensis and G. c. giraffa (Deacon & Tutchings 2019). We note that game breeders may not be aware of the subspecies status of the giraffe on their properties because this is not currently a publicised conservation concern, and rather focus on maintaining viable populations through introductions from readily available sources. In an alternative scenario, the current results may suggest that a re-evaluation of subspecies distribution in the region is necessary. In this scenario, G. c. angolensis detected in South Africa may in fact be part of a natural continuum of diversity of lineages existing within and between the two subspecies. Winter et al. (2018) discuss how the historically assumed distribution of the subspecies ranged, and that the current distribution of G. c. angolensis ranges over a wider span than what was previously thought. Bock et al. (2014) found several deviations from expected subspecies distribution. For example, two giraffe that had been assumed to be South African giraffe grouped with Angolan. A large number of giraffe sampled were from the Chobe National Park, Nxai Pans, Vumbura Concession and Moremi Game Reserve in northern Botswana, and Bwabwata National Park in northeastern Namibia. Namibian localities assumed to have G. c. angolensis grouped with G. c. giraffa from the Khamab Kalahari Reserve in South Africa. These authors state that the assignment of giraffe to the incorrect subspecies could be because of either natural migration or human-induced translocation. In their study, Bock et al. (2014) also found that the South African giraffe were also distributed further north than the previously assumed range. Furthermore, Winter et al. (2018) found that the Angolan giraffe had a more eastern distribution than the previously known distribution. There is thus a need for a finer grained study of natural populations, to determine the true borders of subspecies and lineages, and to better understand the spectrum of pure genotypes for both the South African and Angolan giraffe. Within the South African giraffe population, differences between historic origin populations (Kruger National Park) in comparison to translocated populations such as the individuals in Central South Africa should be investigated. The observed levels of genetic diversity supported our conclusion on the taxonomic status of the groups studied. The population from a public protected area showed least diversity of all groups studied, despite being a sizeable population in the context of this study. However, this population also showed close identity with G. c. giraffa, which has lower diversity compared to G. c. angolensis. Conversely, a small sample of animals from the Northern Cape showed high diversity and also showed close identity to G. c. angolensis, which has higher diversity compared to G. c. giraffa. The highest level of genetic diversity recorded in this study - higher than values estimated for either pure G. c. giraffa or G. c. angolensis - was found in the pooled sample set for privately owned giraffe in the Free State Province. Grobler et al. (2018) showed that hybridisation may result in artificially elevated levels of genetic diversity. The high extant levels of diversity found in the privately owned herds may thus reflect a mix of haplotypes of both G. c. giraffa and G. c. angolensis. In addition to providing new data on subspecies status, the results from the current study have significant implications for the conservation of genetic diversity in small giraffe populations in Central South Africa. Some of the individual populations sampled consisted of four or fewer giraffe, sometimes founded using animals bought from a single source population and with all animals bought at the same time. These, and many similar small giraffe populations in Central South Africa, cannot reasonably be expected to add significant numbers of additional giraffe to their populations because of the size of the areas and habitat availability (carrying capacity). Exchange of animals among populations may thus have significant advantages in inducing gene flow. However, this suggested management approach is based on the premise that uncontrolled exchanges are permissible from a taxonomic point of view, that is, that all extant animals classify to the same subspecies or another appropriate unit for conservation. The latter requirement is, however, clearly not met by the extant Free State giraffe populations, based on the trends reported in the preceding sections. The data presented here provide evidence that both subspecies from southern Africa are present in populations sampled from Central South Africa. This could reflect either translocations or the fact that the borders of the subspecies' ranges are not clearly defined. For future study, we suggest that sampling and analysis be expanded to provide further data on subspecies' distribution and possible admixture. In this regard, museum samples could also be used to elucidate the range of each mtDNA haplotype, and microsatellite makers will provide more precise data on admixture, especially where male mtDNA is not detected in hybrids. Finally, the adaptive significance of genetic differences between subspecies should be investigated. Acknowledgements The authors thank all private landowners and the Free State Department of Economic, Small Business Development, Tourism and Environmental Affairs (DESTEA) for permission to sample populations. The authors thank two anonymous reviewers for their constructive comments that improved the article. Competing interests The authors declare that they have no financial or personal relationships that may have inappropriately influenced them in writing this article. Authors' contributions F.D. and P.J.G. conceptualised the study. M.E.v.N. conducted fieldwork and performed all laboratory analysis. P.J.G. and M.E.v.N. conducted statistical analysis. All the authors contributed to writing this article. Funding information The study was partly financed through the National Research Foundation incentive funding to P.J.G. Data availability statement Sequences generated for this study are available from GenBank. Disclaimer The views and opinions expressed in this article are the authors' own and not an official position of the institution or funder. References Ansell, W.F.H., 1968, 'Part 15. Order Artiodactyla', in J. Meester & H.W. Setzer (eds.), The mammals of Africa: An identification manual, pp. 1-84, Smithsonian Institution Press, Washington, DC, https://doi.org/10.1111/j.1096-3642.1965.tb00081.x [ Links ] Bercovitch, F.B., Berry, P.S.M., Dagg, A., Deacon, F., Doherty, J.B., Lee, D. et al., 2017, 'How many giraffe species exist?' Current Biology 27, R123-R138, https://doi:10.1016/j.cub.2016.12.039 [ Links ] Bercovitch, F.B. & Deacon, F., 2015, 'Gazing at a giraffe gyroscope: Where are we going?' African Journal of Ecology 53, 135-146. https://doi.org/10.1111/aje.12222 [ Links ] Bock, F., Fennessy, J., Bidon, T., Tutchings, A., Marais, A., Deacon, F. et al., 2014, 'Mitochondrial sequences reveal a clear separation between Angolan and South African giraffe along a cryptic rift valley', BMC Evolutionary Biology 14, 219. https://doi.org/10.1186/s12862-014-0219-7 [ Links ] Castley, J.G., Boshof, F, A.F. & Kerley, G.I.H., 2001, 'Compromising South Africa's natural biodiversity - Inappropriate herbivore introductions', South African Journal of Science 97, 334-348. https://hdl.handle.net/10520/EJC97379 [ Links ] Crandall, K.A., Bininda-Edmonds, O.R.P., Mace, G.M. & Wayne, R.K., 2000, 'Considering evolutionary processes in conservation biology: An alternative to "evolutionarily significant units"', Trends in Ecology and Evolution 15, 290-295. https://doi.org/10.1016/S0169-5347001876-0 [ Links ] Dagg, A.I., 1962, 'The distribution of the giraffe in Africa', Mammalia 26, 497-505. https://doi.org/10.1515/mamm-1962-0405 [ Links ] Deacon, F. & Parker, D., 2016, 'A conservation assessment of Giraffa camelopardalis giraffa', in M.F. Child, L. Roxburgh, E. Do Linh San, D. Raimondo & H.T. Davies-Mostert (eds.), The red list of mammals of South Africa, Swaziland and Lesotho, pp. 1-9, South African National Biodiversity Institute and Endangered Wildlife Trust, South Africa. [ Links ] Deacon, F. & Tutchings, A., 2019, 'The South African giraffe Giraffa camelopardalis giraffa: A conservation success story', Oryx 53(1), 45-48. https://doi.org/10.1017/S0030605317001612 [ Links ] Edmands, S., 2006, 'Between a rock and a hard place: Evaluating the relative risks of inbreeding and outbreeding for conservation and management', Molecular Ecology 16, 463-475. https://doi.org/10.1111/j.1365-294X.2006.03148.x [ Links ] Fennessy, J., Bidon, T., Reuss, F., Kumar, V., Elkan, P., Nilsson, M.A. et al., 2016, 'Multi-locus analyses reveal four giraffe species instead of one', Current Biology 26(18), 2543-2549. https://doi:10.1016/j.cub.2016.07.036 [ Links ] Griesel, J., 1961, 'A new game sanctuary for the Orange Free State, The Willem Pretorius Game Reserve', African Wildlife 15(2), 121-125. [ Links ] Grobler, J.P., Van Wyk, A.M., Dalton, D.L., Jansen Van Vurren, B. & Kotze, A., 2018, 'Assessing introgressive hybridization between Blue wildebeest (Connochaetes taurinus) and Black wildebeest (Connochaetes gnou) from South Africa', Conservation Genetics 19, 981-993. https://doi.org/10.1007/s10592-018-1071-x [ Links ] Hirst, S.M., 1966, Immobilization of the Transvaal giraffe Giraffa camelopardalis giraffa using an oripavin derivative', Journal of the South African Veterinary Association 37, 85. [ Links ] Kearse, M., Moir, R., Wilson, A., Stones-Havas, S., Cheung, M., Sturrock, S. et al., 2012, 'Geneious Basic: An integrated and extendable desktop software platform for the organization and analysis of sequence data', Bioinformatics 28(12), 1647-1649. https://doi.org/10.1093/bioinformatics/bts199 [ Links ] Kumar, S., Stecher, G. & Tamura, K., 2016, 'MEGA7: Molecular evolutionary genetics analysis version 7.0.', Molecular Biology and Evolution 33(7), 1870-1874. https://doi.org/10.1093/molbev/msw054 [ Links ] Lambrechts, A.W., 1974, 'The numerical status of sixteen game species in the Transvaal, excluding the Kruger National Park', Journal of the South African Wildlife Management Association 4, 95-102. https://hdl.handle.net/10520/AJA03794369 [ Links ] Lynch, C.D., 1983, 'The mammals of the Orange Free State', Memoirs van die Nasionale Museum Bloemfontein 18, 1-218. [ Links ] Maciejewski, K. & Kerley, G.I.H., 2014, 'Understanding tourists' preference for mammal species in private protected areas: Is there a case for extralimital species for ecotourism?', PLoS One 9(2), e88192. https://doi.org/10.1371/journal.pone.0088192 [ Links ] Moritz, C., 2002, 'Strategies to protect biological diversity and the evolutionary processes that sustain it', Systematic Biology 51, 238-254. https://doi:10.1080/10635150252899752 [ Links ] Muller, Z., Bercovitch, F., Brand, R., Brown, D., Brown, M., Bolger, D. et al., 2018, Giraffa amelopardalis (amended version of 2016 assessment), The IUCN Red List of Threatened Species 2018: e.T9194A136266699, viewed 28 June 2018 from https://www.iucnredlist.org/species/9194/136266699n. [ Links ] Muller, Z., Bercovitch, F., Fennessy, J., Brown, D., Brand, R., Brown, M. et al., 2016, Giraffa camelopardalis, The IUCN Red List of Threatened Species 2016: e.T9194A51140239, viewed 08 December 2016 from www.iucnredlist.org. [ Links ] Rozas, J., Sánchez-Delbarrio, J.C., Messeguer, X. & Rozas, R., 2003, 'DnaSP, DNA polymorphism analyses by the coalescent and other methods', Bioinformatics 19, 2496-2497. https://doi.org/0.1093/bioinformatics/btg359 [ Links ] Seymour, R.S., 2001, 'Patterns of subspecies diversity in the giraffe, Giraffa camelopardalis (L. 1758): Comparison of systematic methods and their implications for conservation policy', PhD thesis, University of Kent, Canterbury. https://ethos.bl.uk/OrderDetails.do?uin=uk.bl.ethos.275008 [ Links ] Sydney, J., 1965, 'The past and present distribution of some African ungulates', Proceeding of the Zoological Society of London 30, 139-167. https://doi.org/10.1017/S0030605300006815 [ Links ] Terblanche, H.J. & Kok, O.B., 1995, 'Die voorkoms van wild in die Oranje-Vrystaat', Navorsinge van die Nasionale Museum Bloemfontein 11(4), 61-100. https://hdl.handle.net/10520/AJA00679208_1465 [ Links ] Winter, S., Fennessy, J., Fennessy, S. & Janke, A., 2018, 'Matrilineal population structure and distribution of the Angolan giraffe in the Namib desert and beyond', Ecological Genetics and Genomics 7-8, 1-5. https://doi.org/10.1016/j.egg.2018.03.003 [ Links ] Received: 22 Mar. 2019 ORIGINAL RESEARCH The feasibility of national parks in South Africa endorsing a community development agenda: The case of Mokala National Park and two neighbouring rural communities Hendri CoetzeeI; Werner NellII IInstitutional Sustainability and Community Impact Office and Unit for Environmental Sciences and Management, North-West University, South Africa ABSTRACT This article explores the feasibility of South African National Parks (SANParks) endorsing a community development agenda, using Mokala National Park (MNP) and two neighbouring rural communities as case study. A three-phase sequential exploratory, mixed-methods approach was followed: an initial exploratory qualitative phase aimed at identifying the development needs of the two communities; a quantitative phase aimed at verifying and quantifying the identified needs; and a final qualitative phase (with a minor quantitative component) to determine what parks can reasonably achieve in terms of community development based on their available resources, capacity and expertise. Qualitative data were collected via semi-structured interviews (Phase 1: n = 22; Phase 3: n = 6), which were thematically analysed. Quantitative data were collected via a structured questionnaire (Phase 2: n = 484; Phase 3: n = 6) and analysed using SPSS 23. Findings revealed that the communities' most significant needs centred on employment opportunities; improved healthcare, service delivery and waste management; and education. Community members also expressed the need for improved community policing, safety and security; social services; agricultural support and training; general skills development and training; local leadership; recreational facilities; local economic development and conservation initiatives. Results from the third phase of the study suggest that parks such as MNP can realistically only address some of the identified community needs significantly; primarily job creation (via temporary employment), skills development, local economic development, support of local conservation (especially via environmental education) and, to a lesser extent, agricultural support and training and permanent job creation. Introduction National parks can potentially play an important role in rural community development. This sentiment is shared by researchers from all over the world, including Africa (Newmark & Hough 2000; Petursson & Vedeld 2017), the Americas (Machlis & Field 2000; Nelson & Serafin 2013), Europe (Barrow 2015; Lundmark, Fredman & Sandell 2010), Asia (Kusters et al. 2006; Tisdell 1999) and Australia (Stolton & Dunley 2015). This notion is also supported by a recent report by the Global Environmental Fund's Scientific and Technical Advisory Panel (Pullin 2014), which outlines the impacts that protected areas (e.g. national parks) can have on rural communities, especially with regard to environmental capital (e.g. resource use and access to land), economic and social capital, health and inequality. The idea of national parks adopting a developmental agenda stems from a paradigm shift away from traditional forms of conservation (preservation) to more contemporary forms that encompass both conservation and development objectives (Anthony 2007). This led to what is widely known today as community-based conservation (CBC) (Berkes 2007). The underlying principle of this combined approach is that poor rural communities should benefit directly from conservation (Cock & Fig 2000). Several variations of the approach developed over the years, including (1) that communities should develop their own traditional or cultural land into conservation areas (IUCN 2010; Stevens 2014); (2) that communities should support protected areas and, in return, that they ought to benefit from job creation, skills development and other types of development in their communities (Bennet 2014; Pelser, Redelinghuis & Velelo 2013); (3) that communities should be allowed to harvest grass, wood, medicinal plants and other natural resources from parks (Cock & Fig 2000; SANParks 2016); and (4) the use of 'trade-offs', where certain areas (and the biodiversity contained therein) are protected whilst other parts of the park are made available for development (Rights & Resource Initiative 2015). Mokala National Park (MNP), which serves as a case study in this article, is a good example of a trade-off approach being applied within a South African context, as it is basically a 'trade-off park'1 in the place of the former Vaalbos National Park that was handed back to a local community as part of a land restitution case (SANParks 2017). Elements of these variations to CBC can also be found in the latest version of SANParks' 5-year strategic management plan (2015/2016-2019/2020) and, more specifically, in its strategic outcome-orientated Goal 3, in terms of which SANParks' goal is (SANParks 2016): [t]o foster an efficient, effective and development oriented public service and an empowered, fair and inclusive citizenship that will enable the creation of decent employment through inclusive economic growth, vibrant, equitable and sustainable rural communities. (p. 28) As outlined in the document, this plan is underpinned by the current national government's 'five key pillars', which include job creation, rural development, education and health, as well as a reduction in the levels of crime in society. SANParks adopted a vision 'Connecting to Society' (SANParks 2012), created a Social Ecology Unit (Swemmer & Taljaard 2011), expanded the scope of its people and conservation programme and added several programmes aimed at promoting access and benefit-sharing, socio-economic development and improved living conditions for local communities adjacent to national parks. This encompasses the implementation of national government's expanded public works programmes (EPWP) (e.g. working for water, land, wetlands, the coast, fire, etc.), value-adding industries, wildlife economy, the development of small, medium and micro-sized enterprises (SMMEs) and a number of social investment programmes at almost all of the national parks (SANParks 2012). It is not difficult to justify national parks in South Africa endorsing a development agenda. From a conservation perspective, an interdependence between biodiversity and sustainable rural development is needed (Faasen 2006), and much has been written about the threat of unsustainable land-use practices as well as the impact that resource-poor, hunger-stricken rural communities may have on biodiversity and wildlife (Vira & Kontoleon 2010). From a development perspective, this approach also makes sense as parks are scattered throughout South Africa, often in deep rural areas where government cannot always address all the needs in these communities, which are often resource-poor and desperate for help and support from others (Flora, Flora & Gasteyer 2015; Mohan 2009). The benefits of a CBC approach, as well as the costs thereof and the challenges it poses, have been widely reported (Botha, Witkofski & Cock 2007; Murphee & Hulme 2001; Western, Wright & Strum 2013). Most authors seem to concur that CBC, at best, has only achieved mixed results (Berkes 2004; Conley & Moote 2003; Mansuri & Rao 2004). Many reasons for this have been given (Cox, Arnold & Villamayor-Tomas 2010), which centre mainly around the fact that community development objectives and conservation objectives are often incompatible and that the benefits derived from community-conservation partnerships are often one-sided, primarily benefitting a conservation rather than a community development agenda (Emerton 2001). One possible strategy to investigate and address these concerns further is to assess the actual needs of communities adjacent to national parks empirically (Wells & McShane 2004) in light of existing literature as well as on the basis of a qualitative exploration pertaining to national parks' current and proposed community development strategies as well as their pool of available resources, skills et cetera. This would enable the feasibility of various development initiatives to be assessed in the light of empirical evidence about what specific communities identify as their particular needs, which, in turn, will allow for distinctions to be made in terms of the viability of specific strategies as outlined in existing SANParks documentation. Furthermore, this approach could potentially address the one-sidedness of the relationship between parks and communities by ensuring that the development side of CBC initiatives articulates self-identified community needs. Although SANParks has already adopted a developmental approach, given limitations such as restrictions on specific development-related skills and expertise (Berkes 2007; Biggs et al. 2014; Pelser et al. 2013) that fall outside the typical skills required for park personnel, capacity and resources, the extent to which national parks can play a substantive role in community development needs to be investigated. To address these questions, a sequential exploratory, mixed-methods study was conducted in two rural communities (Ritchie and Ratanang) near MNP in order to explore what the typical developmental needs within communities situated near a national park are. This was followed by an additional qualitative study (with a minor quantitative component) aimed at exploring MNP's available capacity, skills and expertise and current CBC initiatives. Following this, the identified community needs were evaluated in the light of a theoretical and empirical investigation of SANParks' CBC initiatives as well as the organisation's capacity, resources and expertise with the intention to assess the feasibility of such needs being addressed by parks such as MNP. Research method and design Study area Mokala National Park is situated in a semi-arid part of central South Africa near Kimberley in the Northern Cape Province (Figure 1). Ritchie, with a total estimated population size of 3504 (Stats-SA 2011), is situated on the Northern Cape side of the border near Modderrivier, an area that falls within the Frances Baard District Municipality and Sol Plaatjies Local Municipality, whilst Ratanang, with a total estimated population size of 4213 (Stats-SA 2011), borders Jacobsdal, which is located on the Free State side of the border and falls within the Xhariep District and Letsemeng Local Municipality (see Figure 1). The largest portion of the population in both areas classify themselves as mixed race and speak mostly Afrikaans (Stats-SA 2011). The two communities were selected as they are the communities closest to Mokala. Design A mixed-methods approach, based on a pragmatic paradigm (Creswell & Plano Clark 2007; Johnson, Onwuegbuze & Turner 2007), was followed in the present study, which was executed in three sequential phases: an initial exploratory qualitative phase aimed at identifying the development needs in the two communities; a quantitative phase, where a structured survey was developed and administered to verify and quantify the needs that were identified during the first phase; and a final qualitative phase (with a minor quantitative component) to determine what parks can reasonably achieve based on their available resources, capacity and expertise. This type of approach is widely accepted as one of the most useful approaches to research, because it provides multiple perspectives on a given topic (Creswell 2003) and also affords researchers the opportunity to further explore and explain quantitative results, which, according to Tashakkori and Teddlie (2003), will add richness, depth and greater credibility to any study. Participants During the course of the study, three different groups of participants were recruited. A similar procedure was followed during the first (n = 22) and third (n = 6) qualitative phases of the study, where participants were purposively selected (Creswell 2013) based on their knowledge and experience relevant to the research aims. This approach was supplemented with a snowball sampling strategy, where initially selected participants were requested to refer the researchers to other potential participants who met the sampling criteria (Creswell 2013). The purposive sampling criteria that were set for the first phase required that participants had to be active participants in, or residents of, one of the two communities and had to occupy a central or leadership role in the community. The community leaders were identified via snowball sampling. The initial sample was comprised of two staff members from MNP, two staff members from SANParks, two ward councillors, a school principal, two local policemen, two nurses heading up community clinics and the two social workers appointed to work in these communities. An additional number of nine community members representing different stakeholder groups (e.g. youth, elderly, women, etc.) were recruited by means of typical instance sampling (Tracy 2013). Four hundred and eighty-four participants participated in the second, quantitative phase of the study. Of these, 300 resided in Ritchie (the larger of the two communities) and 184 in Ratanang. A systematic sampling frame (Creswell 2003) was used in order to ensure that all areas of each community were surveyed. Using this approach, every nth household (determined by the total number of participants required for the study in relation to the number of households in each community) was surveyed in each community. The mean age of the participants was 35.97 years (SD = 14.18), with ages ranging from 18 to 86 years. Other relevant demographic information pertaining to the sample is presented in Table 1. During the third phase, six participants were purposively selected (Tracy 2013) on the basis of having first-hand experience in what MNP or SANParks can realistically achieve in the development space. The participants consisted of a very experienced park manager who managed several national parks in South Africa, a People and Conservation officer who had also worked in multiple parks, the head of the park interface programme, a section ranger and two scientists from SANParks' regional office in Kimberley who worked in all the parks in the arid node. Procedure and ethics The first phase of the study took place in early 2016 after ethics clearance was obtained from the North-West University's Human Research Ethics Committee (NWU-00342-15-S1). Once entry into the community had been negotiated, semi-structured interviews were conducted with key participants by the authors and, based on the findings, a structured questionnaire was developed that was subsequently administered to residents of the two communities during the second phase of the study, which took place 1 year later. Eighteen fieldworkers (8 from Ritchie and 10 from Ratanang) were recruited from the respective communities and subsequently trained to administer the survey. Fieldworkers were compensated financially for their services. Informed consent was obtained from all participants. Data were collected over a period of 1 week. Privacy and confidentiality (which are also covered in the informed consent form) were protected by conducting the interviews in a place where the participants felt comfortable (e.g. their homestead) and by making sure that no one other than the researcher had access to the participant's identifiable characteristics linked to specific results. Furthermore, fieldworkers were required to sign confidentiality agreements. Completed questionnaires were inspected on receipt to ensure completeness and correctness and were subsequently taken to the North-West University's Statistical Consultation Services for data capturing and analysis. During the third qualitative phase of the study, an interview guide and a structured questionnaire were developed based on the results of phases 1 and 2 and were subsequently utilised to gather data from six purposively selected senior members of MNP and SANParks. In total, the project involved 4 full weeks of fieldwork, which spanned a period of 3 years. Data gathering methods During the first (qualitative) phase of the study, data were gathered by means of semi-structured interviews with purposively selected members of the two communities. An interview guide (Tracy 2013) was used to facilitate the interviews. In particular, all participants were asked what they believed to be the most pressing needs in their respective communities. During the second (quantitative) phase of the study, a structured survey was developed on the basis of the themes that were identified from the first set of semi-structured interviews as outlined previously (see Table 2 for the complete list of items). This strategy was followed in order to ensure that the scale was contextually sensitive and that the items on the scale tapped into actual community needs, as well as to enable the qualitatively identified needs to be empirically quantified and verified. Specifically, participants were requested to rate each of the listed needs on a five-point Likert scale ranging from 1 ('no need') to 5 ('a very big need'). In addition, the survey was structured to gather biographical data pertaining to participants' gender, age, race and employment status. During the third qualitative phase of the study, data were gathered by means of an interview schedule and structured questionnaire, which were developed on the basis of the findings that emerged from phases 1 and 2 of the study. Participants were requested to rate a list of community needs on a five-point Likert scale (ranging from 1 = 'not at all' to 5 = 'to a great extent') based on their professional view of the extent to which parks like MNP could potentially address each specific need. Participants were then requested to qualitatively elaborate on the reason for their ratings via semi-structured interviews or questionnaires. Data analysis Qualitative data derived from phases 1 and 3 of the study were analysed by means of thematic content analysis (Creswell 2003; Tracy 2013). The transcribed data were first read multiple times to ensure immersion in the data, after which data were inductively coded by assigning a brief descriptive label to each segment of text. Based on conceptual similarities, codes were grouped together into categories and overarching themes. These themes formed the basis for the development of the structured survey, which was used to gather data during the second round of the study. Quantitative data were statistically analysed using SPSS 23 (Field 2005). Descriptive statistics (means and measures of central tendency) were calculated for all items. Results Phase 1: Identified community needs The framework developed by Sirgy et al. (2009) was used to cluster the 17 themes and subthemes that were identified via the thematic analysis of the semi-structured interviews (Phase 1) under the four categories: business services, government services and non-profit-related services, as well as community conditions. Table 2 summarises the main findings that emerged from the analysis and illustrates each with a relevant excerpt from the interviews. Phase 2: Empirical verification and quantification of community needs On the basis of the qualitative themes outlined in the previous section, a structured questionnaire was developed and subsequently administered during the second phase of the study. The survey results (see Table 3) confirmed that all the needs that were identified during the qualitative phase of the study are actual needs in the communities, whilst it also enabled the empirical quantification of the relative strength and prevalence of these needs. According to the participants from both communities, the need for job opportunities was the most pressing (mean = 4.16, SD = 1.22). This was confirmed by the fact that 53.3% of adult participants surveyed were unemployed (see Table 1). The second biggest need was for improved healthcare services (mean = 4.1, SD = 1.14). This was followed by a number of government-related services such as the need for improved infrastructure (mean = 4.09; SD = 1.14), improved waste management (mean = 4.08; SD = 1.13), improved municipal service delivery (mean = 4.07; SD = 1.11), improved safety and security (mean = 4.03; SD = 1.30), improved community policing (mean = 4.00; SD = 1.24), skills development and training (mean = 3.96; SD = 1.27) and improved social services (mean = 3.96; SD = 1.11). Residents of both communities also felt that there was a significant need for an improvement in public education in their communities, both in terms of the quality and quantity of available educational institutions (mean = 3.95, SD = 1.09). The survey results also indicate that residents of Ritchie and Ratanang experienced the need for enhanced conservation of their local environments (mean = 3.91, SD = 1.2). A marked need for recreational and sporting facilities is evident not only from the survey results (mean = 3.9, SD = 1.2) but was particularly emphasised during the semi-structured interviews that were conducted with community members. Other needs such as improved local leadership, agricultural support and training and the need for local economic development also achieved an above-average score. Phase 3: Extent to which Mokala National Park and South African National Parks can potentially address identified community development needs During the third phase of the study, semi-structured qualitative interviews as well as structured and unstructured questionnaires were used to gather data from purposively selected staff members from MNP and SANParks as well as other experts in relation to the extent to which parks such as MNP can potentially address the development needs that were identified by the communities. Whilst the sample was small, given the expertise of the participants and the need to identify the relative feasibility of each need being addressed, it was deemed to be of value to quantitatively assess all participants' views on the feasibility of each need being addressed (which was done on a five-point scale ranging from 1 = 'not at all' to 5 = 'to a great extent'). This rating was used as the basis for a qualitative exploration of why the participant assigned the given score. Participants' responses to the survey are reflected in Table 4. Following on Table 4, the needs - in order of their ranked importance and based on the themes derived from the qualitative data - will be discussed in greater detail. More temporary job and employment opportunities According to the participants, the biggest direct impact that MNP and SANParks can potentially have is via temporary job or employment opportunities (mean = 4.00). As sketched by one of the participants: 'Mokala currently employs nine contractors and each contractor employs 10 or 11 people. This means that nearly 100 contract workers are currently working on one of the Expanded Public Works Programme (EPWP)/Biodiversity Social Project (BSP) activities in the park, for example infrastructure projects, working for ecosystems, working for water, environmental monitors, et cetera.' (Participant 22, male, park manager) According to the same participant, these temporary job opportunities are creating employment in all national parks in South Africa. The participant also commented that these projects have a lot of potential to address needs related to employment, because the projects' lifecycle typically extends over a period of 2 to 3 years and are often repeated, based on the availability of funding and the need for such services. The participants also indicated that another opportunity for job creation in parks is to offer concessions to private investors, for example, by outsourcing a park's restaurants, shops, et cetera. According to one of the participants, some of the larger parks such as the Kruger National Park (KNP) are already engaging in this practice, resulting in an increase in the availability of jobs for people from local communities. However, as pointed out by the same participant, this is currently not a feasible strategy at MNP because the park is very remote, its restaurant is not showing much of a profit and accommodation for staff is limited. Local conservation initiatives According to expert participants, the second biggest potential impact that MNP and SANParks could have is in the local conservation space, especially via environmental education (EE). Not only is this in line with SANParks' primary mandate, but SANParks already has dedicated staff who can attend to this (its People and Conservation staff) and has a whole array of educational material on hand. As one participant pointed out, 'SANParks also has a fully developed curriculum for environmental education and it has specific programmes aimed at stimulating local conservation initiatives such as its Kids in Park programme' (Participant 23, female, People and Conservation officer). According to the same participant, part of MNP's efforts to stimulate local conservation initiatives includes taking children from local communities to visit the park for up to 2 to 3 days to learn and to be exposed to natural environments and wildlife. This programme, according to another participant (Participant 25, male, head of the park interface programme), has been rolled out at all the local schools in the area. Skills development and training The third biggest potential impact that MNP and SANParks can have is via skills development and training. This is largely because of the government-funded BSP/EPWP programmes. According to the participants, training is specifically budgeted for in each of these projects because it is mandatory to train community members temporarily employed through BSP/EPWP in a variety of fields like health, safety and first aid. Furthermore, given that many of these projects are often infrastructure related, for example, building staff accommodation at and erecting a new entrance gate for MNP's Lilydale Camp, participants have the opportunity to acquire practical skills pertaining to the construction industry, which they can subsequently apply in their own communities in support of development (e.g. building various structures). According to the participants, contractor development also formed an important part of skills development (business management, health and safety, etc.) in the past, the idea being that SANParks should help to empower contractors so that they can secure other job opportunities (contracts) once their contracts with SANParks have expired. Local economic development According to one of the participants, MNP spends a portion of its budget in the local economies of Jacobsdal and Modderrivier, but the majority of its budget is spent in Kimberley: 'We do buy local as far as possible. However, some of the foods are not locally available. We therefore have to get it from Kimberley' (Participant 22, male, park manager). However, according to the same participant, Mokala, like all other parks, spends a large portion of its budget on human resources. According to him, at least some of the staff reside in local communities, implying that they also spend a portion of their income at local shops in towns near parks. As such, parks likely have a significant indirect impact on local economic development by means of the disposable income their employees spend in these communities. Another potential option, according to the same participant, is to focus on supply-chain development. He explained that MNP currently purchases all the meat it uses in its restaurant from a local butcher near the park. Most of the dry food is, however, bought in Kimberley. According to him, much more can be done to identify, source and register local suppliers. In fact, MNP recently undertook an exercise to meet and register local service providers. A potential obstacle that was identified in this process is that suppliers have to be registered on a government database. However, this process is reported to be fairly rapid and inexpensive and, as such, need not pose an undue obstacle to local community members registering their businesses as suppliers. In this regard, national parks like MNP can and have played a supportive role by assisting new service providers with the registration process. Agricultural support and training According to the participants, MNP and some of the other national parks are in the process of providing agricultural support and training to local communities. This is currently happening in the Salt Lake community near Mokala. Other parks, such as the Karoo National Park, also focused on this in the past with the help of external service providers. In this regard, the participants felt that the People and Conservation officers can make a huge contribution and that basic skills can be transferred to local communities near parks, which, in turn, can contribute to food security in these communities. Another participant also indicated that yet another way in which SANParks currently supports agriculture is through its wildlife economy programme, an initiative whereby SANParks gives animals to upcoming farmers on loan to build up their own breeding stock for commercial purposes. MNP is also taking part in this initiative. More permanent job and employment opportunities The participants indicated that MNP and SANParks' capacity to provide permanent job opportunities is limited (mean = 2.33). This state of affairs was confirmed in the present study where only two individuals from the Ritchie community were reported to be employed by MNP and only one resident was employed by SANParks' regional office in Kimberley. This, according to the participants, can be ascribed to the fact that Mokala is still a developing park and small compared to other parks: 'There are some expectations, but Mokala is a small park compared to Kruger and can only contribute a small fraction' (Participant 23, female, People and Conservation officer). According to another participant, the creation of job opportunities in parks will also depend on the staff turnover at the parks (via natural attrition, resignations and retirements). This, according to him, is relatively low at present, thus limiting the capacity of parks like MNP to address this need in a feasible manner. Another limiting factor that has an influence on the creation of job opportunities, according to the participants, is that some of the higher (more specialised) post levels require some formal education (graduate or postgraduate qualification), which ordinary community members from local communities often do not have. One of the participants also indicated that in her experience, local community members are not aware of the employment opportunities that exist in parks. As a result, MNP is in the process of implementing the Yes Programme, which is a programme by the national government that is aimed at creating awareness among the youth of the type of job opportunities that exist in parks and within other government institutions. Improved quality and quantity of education The participants agreed that they, as a park and as part of SANParks, will not be able to improve the quality of education offered by local primary and secondary schools, nor the quantity of those schools in the area. They did, however, concede that SANParks can support the curriculum by providing context and practical exposure to school children, especially via their EE programmes and initiatives. Recreation facilities and activities According to one of the participants, SANParks can play a supporting role in the development of municipalities' Integrated Development Plans, especially when it comes to providing inputs regarding the development of urban parks and open spaces. A second option, according to the participants, is for communities to make use of the free-entrance week that is normally offered by all national parks in South Africa in the course of September. Yet another alternative mentioned by Participant 22 is to make use of the honorary ranger's project that, among others, involves hosting an annual mountain bike race in MNP. This initiative, according to him, has a lot of potential to involve developmental groups from the local community. Improved waste management Although MNP, and parks in general, cannot take the responsibility for waste management outside the park or in local communities, the participants indicated that improved waste management is a need that they share with local communities. One of the participants also indicated that MNP is in the process of developing a recycling plant at the park. According to him, this can potentially provide opportunities for local communities. However, given that there are no waste depots or landfill sites near the park, all waste will have to be transported to the town of Kimberley over a distance of 90 km, which is likely to affect the feasibility of this strategy adversely from a community development perspective. Access to tertiary education According to the participants, SANParks at present only offers bursaries to its own staff and their children, which implies that even though some of these employees do reside in local communities, the capacity to address this need is limited. However, SANParks also has a junior scientist programme that provides opportunities for upcoming scientists to obtain a master's degree or PhD. According to one of the participants, the programme started in KNP and will be expanded to other parks as well. In addition, SANParks is providing in-service training to graduates with a diploma or degree in conservation, and some of the beneficiaries have even been absorbed as section or field rangers or biotechnicians. Improved infrastructure The participants indicated that it would be difficult (if not impossible) for them as a park to address the larger infrastructural needs of their surrounding communities. However, according to them, SANParks does have a socio-economic development department that assists with some of the infrastructure needs in communities (e.g. at schools and with regards to libraries). These interventions are funded by a percentage of the conservation fees that are paid by tourists. Improved leadership Here, too, the participants agreed that SANParks cannot really make a significant direct contribution. However, according to one of the participants, SANParks is making an indirect contribution through its Kids in Parks programme, because this programme is aimed at instilling leadership ethics at an early age, especially with regards to the disciplines of conservation and biodiversity. Improved municipal service delivery The participants indicated that they, as a park and SANParks in general, will not be able to address needs related to service delivery in local communities outside the park. The participants were fairly unanimous that this is the responsibility of local municipalities. Improved community safety, security and policing Participants felt that the need for improved safety and security and better policing in communities cannot be feasibly addressed by SANParks to any significant extent. Nevertheless, given that parks do indeed take measures to ensure security both inside the park and along their boundaries, it stands to reason that their immediate neighbours must be benefitting from these measures to some degree. Establishing more schools The participants unanimously felt that MNP and SANParks will not be able to make a significant contribution towards the actual building of more schools. Improved availability of and/or access to healthcare services (e.g. clinics) Participants indicated that the need for improved availability of and/or access to healthcare is a need they share with local communities. According to them, some of their staff members have to travel all the way to Kimberley to get treatment and/or chronic medication. Because the park is quite a distance from Kimberley, this involves hours of travel and adversely affects productivity. Negotiations with the department of health to build a clinic nearby or in the park are currently underway. Nevertheless, participants indicated that SANParks' direct potential contribution to addressing this need is minimal. Improved social services (e.g. social workers) All the participants agreed that addressing the need for improved social services falls completely outside their mandate and capacity. Discussion This study investigated the feasibility of national parks in South Africa endorsing a community development agenda, using MNP and two neighbouring communities as case study. A sequential mixed-methods approach was followed, comprising three phases that spanned a 3-year period. In relation to the first two phases of the study, which aimed to investigate community needs both qualitatively and quantitatively, findings revealed that the communities' most significant needs centre around employment opportunities; improved healthcare, service delivery and waste management; an improvement in the quality of and access to primary and secondary education opportunities (i.e. schools); and more opportunities for local residents to afford and access tertiary education opportunities. Community members also expressed the need for improved community policing, safety and security; social services and agricultural support and training as well as general skills development and training, local leadership, recreational facilities, local economic development and conservation initiatives. As will be outlined in the section to follow, the results from the third phase of the study suggest that MNP (and SANParks in general) could realistically only address some of the identified community needs to a significant degree. The need for employment opportunities as well as the need for skills development and training ranked tops among those identified by the communities targeted in this study. Given that studies by Tepela and Omara-Ojungu (2012) in communities near KNP and by Pelser et al. (2013) near the Golden Gate Highlands National Park revealed similar results, it should come as no surprise that addressing the high unemployment rate in South Africa - identified as one of the 'five key pillars' of national government - has been adopted as a key element in SANParks' vision. In reaction to national government's call to address the unemployment rate, MNP/SANParks indicated that their biggest potential contribution would be in the form of temporary job creation, mainly via the EPWP/BSP programmes. In 2015-2016, three EPWP/BSPs were in operation at Mokala (Spies 2015). Since then, this number has increased to nine - which shows that there is still potential for growth. Findings derived from the semi-structured interviews in this study confirmed that members of the Ritchie community did indeed benefit from the EPWP/BSP initiative and that over 100 local community members are currently benefitting from these programmes initiated by MNP, but the findings also revealed that several challenges are being experienced in as far as job allocation and the timely settlement of payments are concerned. From the park's perspective, Spies (2015) found the initiatives to be fairly successful, despite some challenges. According to SANPark's 2015-2016 annual report, EPWP/BSP programmes are on offer in all 19 South African national parks, and 23 298 local community members are being employed on a semi-permanent basis (given that projects typically span 2 to 3 years and are often renewed). These projects simultaneously also address the community need for skills development and training, as all temporary employees are being trained in a whole array of skills ranging from first aid to construction, some of which might increase their future employability and/or their ability to support local economic or infrastructure development in their own communities by, for example, making use of the skills they have acquired in the construction industry to erect structures in their own communities. The creation of permanent jobs, though, seems to be a totally different matter that depends on the size of a particular park, its potential for expansion and the turnover of existing staff members. However, given that SANParks employs only around 4000 people countrywide (SANParks 2016) and that funds allocated to national parks are limited (SANParks 2016), the number of people that can be employed by the organisation on a permanent basis is clearly limited. Two potential avenues for job creation that have probably hitherto been underutilised are to make private concessions available to private investors and to create more opportunities for self-employment. In case of the former, it is likely that private investors will have the capital to grow SANParks' facilities such as restaurants and accommodation and, in the process, to create more job opportunities. Given that MNP and other parks are already engaging in the practice of sourcing supplies locally, another feasible strategy that could be investigated would be to establish and develop vetted local supply chains with communities adjoining national parks. Given that they are mostly rural (i.e. agricultural), residents could be afforded the opportunity to provide parks with an array of fresh vegetables, fruit and meat or an assortment of arts and crafts. Such a practice is also likely to make a meaningful contribution to local economic development. The capacity to address the need for local conservation initiatives was ranked second highest. Given that environmental conservation is one of its core mandates, national parks can definitely play a significant role in this regard. Not only would such initiatives fall within SANParks' expertise, but the organisation also has the capacity to address these needs via its People and Conservation division (a programme by SANParks that is used to drive the dual agenda of conservation and development) and the various extension programmes it has on offer. Furthermore, SANParks can also play a role in the development of new conservation areas in traditional and cultural land via collaborative engagement with local communities. A very pertinent need that was identified in the communities was for recreational facilities and activities. Whilst participants felt that direct involvement in the establishment of recreational facilities generally falls outside the scope of SANParks' mandate, the results of this study do suggest a couple of strategies that could be assessed for feasibility. These include sponsoring recreational facilities (e.g. participants in both communities expressed the need for a skateboard park), sponsoring local residents' participation in the annual park mountain bike race or promoting the park itself as recreational facility, perhaps via sponsoring occasional transport and entry into the park as is currently the case with the free-entrance week that usually occurs in September of each year. The latter strategy would represent a synergistic approach as it combines the park's core asset with a community need, which, as repeatedly revealed in the qualitative interviews, is likely to make a significant positive difference in the lives of residents of impoverished communities. The findings suggest that MNP and other parks can play a significant role in agricultural support and training. In this regard, parks can partner with external service providers and provide wildlife to emerging farmers. Agricultural support and development is an international priority (linked to sustainable development goals) simply because it has a bearing on food security (FAO 2018). It also forms an integral part of South Africa's national development plan, given that it is part of government's efforts to stimulate integrated and inclusive rural economies in South Africa (The Conversation 2017). A shared need that was identified by the communities and MNP was for improved waste management. Whilst direct involvement in refuse removal falls outside the auspices of SANParks' community development mandate and CBC initiatives, in this case, it could potentially play a role in terms of promoting environmental awareness and education. This would also be in the interest of national parks, given that refuse and pollution generated by local communities adjacent to national parks have the potential to impact the park and visitors' perceptions and experiences of the park adversely. In partnership with local authorities, the barriers that prevent people from keeping their communities clean can be identified and addressed. For example, MacAllister (2015) found that there were instances where managing farm waste as a health problem served as a means to help address this issue in communities and to prevent concomitant health issues. Although MNP indicated that it cannot directly contribute to infrastructure development in local communities (e.g. roads, buildings, sanitation, etc.), it can play a role through its socio-economic development initiatives by supporting local supply-chain development and providing skills (such as construction skills) and opportunities to local community members. The beneficiaries of these initiatives can then, in turn, use the skills they have acquired to benefit their communities. A huge need that was identified by the communities was to improve education. Whilst the findings clearly reveal that SANParks can only play a limited role in the context of formal education and cannot do much to increase the quantity and quality of schools in the region, it can nevertheless play a meaningful educational role by providing new learning opportunities and contexts for children. A number of parks already have some very good educational programmes and projects in place. Included among these are the heritage project Imbewu (developed to promote the transference of traditional cultural knowledge from older to younger people), the junior rangers programme (aimed at promoting civil service and volunteerism in parks), the Kids in Parks programme (aimed at exposing youngsters to parks and pristine natural environments) and the Koedoe Green Schools Programme (an EE programme focusing on, among others, climate change) (SANParks 2017). The potential value of projects such as these were underscored in the present study, where several participants reported that their children showed a marked change in their attitudes and enthusiasm towards the natural environment after a visit to MNP. Findings from the interviews revealed that whilst children would often kill animals such as snakes on sight, those who experienced a guided visit to MNP not only ceased this practice but actively encouraged others in the community to refrain from doing so. Nevertheless, whilst valuable in itself, exposure to parks and EE will likely not promote the educational agenda necessary for people to matriculate with flying colours or to find gainful employment. This notion is supported by Van der Berg et al. (2011), who found that the level of education in rural communities bordering national parks is typically insufficient for learners to further their tertiary education at a university or college. Limited access to tertiary educational institutions (which was also found in the survey to be a significant community concern and need) and lack of funding, as well as lack of awareness of funding opportunities, conspire to exacerbate this problem. Even though both government and universities are currently doing a lot to assist communities in this regard (DHET 2017), national parks could also potentially play a significant role by, for example, offering bursaries to communities for those who wish to study science or conservation. In the long run, this will enhance the probability that residents originating from these communities may well end up finding permanent employment within a park structure. Finally, the results indicate that there is very little that MNP and SANParks can feasibly do to directly address needs related to healthcare services (even though they share the need), community safety and security, community policing, social services (e.g. social workers), local leadership and the establishment and erection of more schools, as these needs generally fall outside the auspices and capacity of national parks in South Africa. Elsewhere, Naughton-Treves, Buck Holland and Brando (2005) came to the same conclusion, whilst Andam et al. (2010) also questioned the actual impact national parks could have on poverty. In light of the above, it seems necessary to rethink and possibly reconceptualise the developmental agenda that national parks are expected to drive so that these aims are more in line with (1) what parks can reasonably achieve based on resources, capacity and expertise and (2) what communities surrounding national parks need according to their own articulation. Failure to do so could invite the risk of creating unrealistic expectations among communities, resulting in an increased likelihood of general resentment and negative attitudes towards conservation among communities when such expectations are not fulfilled (Anthony 2007). Furthermore, though well-intentioned, community development initiatives that are not aligned with community needs or the capacity, resources and expertise of national parks are likely to either result in costly failures or might fail to truly have a meaningful impact on communities. It is hoped that the findings of this study will be of use in informing SANParks' community development initiatives and ensuring that those initiatives are optimally aligned with actual community needs. Conclusion Using a sequential mixed-methods design, this study set out to investigate the feasibility of national parks in South Africa endorsing a community development agenda based on an exploration of community needs using MNP and two neighbouring rural communities as a case study. Based on the results, the feasibility of national parks substantively addressing all community needs is questioned as many of these needs fall outside the scope, capacity, skills and resource capability of the organisation. Nevertheless, as was revealed in this study, national parks have the ability to directly or indirectly support several pressing community needs by creating jobs (especially by means of temporary projects and, to a far lesser extent, by means of direct employment) and by enabling those who partake in such employment opportunities to be trained and to develop specific skills. Furthermore, initiatives aimed at promoting awareness and education around waste management and local environmental conservation, supporting local economic development, sponsoring recreational facilities and/or access to parks as well as offering agricultural support and training have been identified as means whereby Mokala can respond to the needs experienced by its surrounding communities. Such initiatives would not only articulate with genuine community needs but could be feasibly pursued based on SANParks' expertise, resources and core mandate and thus hold the promise of truly achieving a positive impact on community development. Acknowledgements Competing interests The authors declare that they have no financial or personal relationship that may have inappropriately influenced them in writing this article. Authors' contributions Both authors contributed equally to conceptualising the study as well as towards collecting and analysing the data and writing the manuscript. Funding information This study was funded through a strategic research grant of the Unit of Environmental Sciences and Management, Faculty of Natural and Agricultural Sciences, North-West University. References Andam, K.S., Ferraro, P.J., Sims, K.R.E., Healy, A. & Holland, M.B., 2010, 'Protected areas reduced poverty in Costa Rica and Thailand', Proceedings of the National Academy of Sciences 107(22), 9996-10001. https://doi.org/10.1073/pnas.0914177107 [ Links ] Anthony, B., 2007, 'The dual nature of parks: Attitudes of neighbouring communities towards Kruger National Park, South Africa', Environmental Conservation 34(3), 236-245. https://doi.org/10.1017/S0376892907004018 [ Links ] Barrow, G.C., 2015, 'The socio-economic benefits of new national parks designations in Scotland', Association for the Protection of Rural Scotland 1, 2-13. [ Links ] Bennet, N.J., 2014, 'Why local people do not support conservation: Community perceptions of marine protected area livelihood impacts, governance and management in Thailand', Marine Policy 44, 107-116. https://doi.org/10.1016/j.marpol.2013.08.017 [ Links ] Berkes, F., 2004, 'Rethinking community-based conservation', Conservation Biology 18(3), 621-630. https://doi.org/10.1111/j.1523-1739.2004.00077.x [ Links ] Berkes, F., 2007, 'Community-based conservation in a globalized world', PNAS 104(39), viewed 10 January 2017, from http://www.pnas.org/content/104/39/15188.full.pdf [ Links ] Biggs, D., Swemmer, L., Phillips, G., Stevens, J., Freitag, S. & Grant, R., 2014, 'The development of a tourism research framework by South African National Parks to inform management', Koedoe 56(2), Art. #1164, 9 pages. [ Links ] Botha, J., Witkofski, E.T.F. & Cock, J., 2007, 'Is "something better than nothing"? The impacts of ten outreach nurseries on South African community stakeholders', Forests, Trees and Livelihoods 17, 199-221. https://doi.org/10.1080/14728028.2007.9752597 [ Links ] Cock, J. & Fig, D., 2000, 'From colonial to community based conservation: Environmental justice and the national parks of South Africa. Society in Transition 31(1), 22-35. https://doi.org/10.1080/21528586.2000.10419008 [ Links ] Conley, A. & Moote, M.A., 2003, 'Evaluating collaborative natural resource management', Society & Natural Resources 16(5), 371-386. https://doi.org/10.1080/08941920309181 [ Links ] Cox, M., Arnold, G. & Villamayor-Tomas, S., 2010, 'A review of design principles for community-based natural resource management', Ecology and Society 15(4), 38. https://doi.org/10.5751/ES-03704-150438 [ Links ] Creswell, J.W., 2003, Research design: Qualitative, quantitative, and mixed methods approaches, Sage, Thousand Oaks, CA. [ Links ] Creswell, J.W., 2013, Qualitative inquiry and research design choosing among five approaches, Sage, Thousand Oaks, CA. [ Links ] Creswell, J.W. & Plano Clark, V.L., 2007, Designing and conducting mixed methods research, Sage, Thousand Oaks, CA. [ Links ] Department of Higher Education and Training, 2017, Official website, viewed 10 January 2017, from http://www.dhet.gov.za/ [ Links ] Emerton, L., 2001, 'The nature of benefits and the benefits of nature: Why wildlife conservation has not economically benefited communities in Africa', in D. Hulme & M. Murphree (eds.), African wildlife and livelihoods: The promise and performance of Community Conservation, pp. 208-226, David Philip Publ, Cape Town, South Africa. [ Links ] Faasen, H., 2006, 'Synergies between biodiversity conservation and sustainable rural development of adjacent communities: A case study of the Tsitsikamma National Park', PhD thesis, University of Stellenbosch, Faculty of Agriculture and Forestry Sciences. [ Links ] Field, A., 2005, Discovering statistics using SPSS, Sage, London. [ Links ] Flora, C.B., Flora, J.L. & Gasteyer, S.P., 2015, Rural communities: Legacy and changes, Westview Press, Boulder, CO. [ Links ] Food and Agriculture Organization of the United Nations, 2018, viewed 10 August 2018, from http://www.fao.org/sustainable-development-goals/en/ [ Links ] IUCN, 2010, Policy matters 17, viewed 10 January 2017, from https://www.iucn.org/downloads/policy_matters_17___pg_173_204.pdf [ Links ] Johnson, R.B., Onwuegbuze, A.J. & Turner, L.A., 2007, 'Toward a definition of mixed methods research', Journal of Mixed Methods Research 1(2), 112-133. https://doi.org/10.1177/1558689806298224 [ Links ] Kusters, K., Achdiawan, R., Belcher, B. & Perez, M., 2006, 'Balancing development and conservation? An assessment of livelihood and environmental outcomes of nontimber forest product trade in Asia, Africa, and Latin America', Ecology and Society 11(2), 20. https://doi.org/10.5751/ES-01796-110220 [ Links ] Lundmark, J.L., Fredman, P. & Sandell, K., 2010, 'National parks and protected areas and the role for employment in tourism and forest sectors: A Swedish case', Ecology and Society 15(1), 19. https://doi.org/10.5751/ES-03175-150119 [ Links ] MacAllister, J., 2015, Factors influencing solid-waste management in the developing World, All Graduate Plan B and other reports. Paper 528, Utah State University, DigitalCommons@USU, Utah. [ Links ] Machlis, G.E. & Field, D.R., 2000, National parks and rural development: Practice and policy in the United States, Island Press, Washington, DC. [ Links ] Mansuri, G. & Rao, V., 2004, 'Community-based and -driven development: A critical review', World Bank Research Observer 19(1), 1-39. https://doi.org/10.1093/wbro/lkh012 [ Links ] Mohan, G., 2009, 'The significance of rural areas in South Africa for tourism development through community participation with special reference to Umgababa, a rural area located in the province of KwaZulu-Natal', University of South Africa, Pretoria, viewed 16 January 2017, from http://hdl.handle.net/10500/2159 [ Links ] Murphee, M.W. & Hulme, D., 2001, African wildlife and livelihoods: The promise and performance of community conservation, James Currey Ltd, Oxford. [ Links ] Naughton-Treves, L., Holland, M. & Brando, K., 2005, 'The role of protected areas in conserving biodiversity and sustaining local livelihoods', Annual Review of Environment and Resources 30, 219-252. https://doi.org/10.1146/annurev.energy.30.050504.164507 [ Links ] Nelson, J.G. & Serafin, R., 2013, National parks and protected areas: Keystones to conservation and sustainable development, NATO ASI book series 40, Springer-Verlag, Berlin Heidelberg. [ Links ] Newmark, W.D. & Hough, J.L., 2000, 'Conserving wildlife in Africa: Integrated conservation and development projects and beyond', BioScience 50(7), 585-592. https://doi.org/10.1641/0006-3568(2000)050[0585:CWIAIC]2.0.CO;2 [ Links ] Pelser, A., Redelinghuis, N. & Velelo, N., 2013, Protected areas as vehicles in population development: Lessons from rural South Africa, viewed 10 January 2017, from http://conferences.ufs.ac.za/dl/Userfiles/Documents/00001/654_eng.pdf [ Links ] Petursson, J.G. & Vedeld, P., 2017, 'Rhetoric and reality in protected area governance: Institutional change under different conservation discourses in Mount Elgon National Park, Uganda', Ecological Economics 131, 166-177. https://doi.org/10.1016/j.ecolecon.2016.08.028 [ Links ] Pullin, A.S, 2014, Assessing the effects of terrestrial protected areas on human well-being: ASTAP Advisory Document, Global Environmental Facility, Washington, DC. [ Links ] Rights and Resource Initiative, 2015, Protected areas and the land rights of indigenous peoples and local communities: Current issues and future agenda, viewed 10 January 2017, from file:///C:/Users/12894451/Desktop/RRIReport_ProtectedAreas-and-LandRights_web.pdf [ Links ] SANParks, 2012, SANParks Annual Performance Plan, viewed 10 January 2017, from https://www.sanparks.org/assets/docs/about/annual_performance_plan_2012013.pdf [ Links ] SANParks, 2016, SANParks Annual Report 2015/16, viewed 10 January 2017, from https://www.sanparks.org/assets/docs/general/annual-report-2016.pdf [ Links ] SANParks, 2017, Official website of South African National Parks, viewed 10 January 2017, from https://www.sanparks.org/about/connecting_to_society/ [ Links ] Sirgy, M.J., Widgery, R.N., Lee, D. & Yu, G.B., 2009, 'Developing a measure of community well-being based on perceptions of impact in various life domains', Social Indicators Research 96, 295-311. https://doi.org/10.1007/s11205-009-9479-9 [ Links ] Spies, M.O., 2015, 'An exploration of whether the People and Parks Programme contributes to capacity building and awareness in the Ritchie community near Mokala National Park', Unpublished honours dissertation, North-West University, Potchefstroom Campus. [ Links ] Stats-SA, 2011, Official website of Statistics South Africa, viewed 10 January 2017, from http://www.statssa.gov.za/?page_id=3839 [ Links ] Stevens, S., 2014, Indigenous peoples, national parks, and protected areas: A new paradigm linking conservation, culture, and rights, University of Arizona Press, Tucson, AZ. [ Links ] Stolton, S. & Dunley, N., 2015, Values and benefits of protected areas, ANU Press, Canberra, Australia. [ Links ] Swemmer, L.K. & Taljaard, S., 2011, 'SANParks, people and adaptive management: Understanding a diverse field of practice during changing times', Koedoe 53(2), 1-7. https://doi.org/10.4102/koedoe.v53i2.1017 [ Links ] Tashakkori, A. & Teddlie, C., 2003, Handbook of mixed methods in social and behavioral research, Sage, Thousand Oaks, CA. [ Links ] Tepela, B.N. & Omara-Ojungu, P.H., 2012, 'Towards bridging the gap between wildlife conservation and rural development in post-apartheid South Africa: The case of the Makuleke community and the Kruger National Park', South African Geography Journal 81(3), 1999. [ Links ] The Conversation, 2017, How land reform and rural development can help reduce poverty in South Africa, viewed 10 August 2018, from http://theconversation.com/how-landreform-and-rural-development-can-help-reduce-poverty-in-south-africa84146 [ Links ] Tisdell, C., 1999, Biodiversity, conservation and sustainable development: Principles and practices with Asian examples, Cheltenham, Edward Elgar. [ Links ] Tracy, S.J., 2013, Qualitative research methods: Reflecting evidence, crafting analysis, communicating impact, Wiley-Blackwell, London. [ Links ] Van der Berg, S., Taylor, S., Gustafsson, M., Spaull, N. & Armstrong, P., 2011, Improving education quality in South Africa, Report for the National Planning Commission, Department of Economics, University of Stellenbosch. [ Links ] Vira, B. & Kontoleon, A., 2010, 'Dependence of the poor on biodiversity: Which poor, what biodiversity?', CPRC International Conference 2010, Manchester, September 8-10, 2010. [ Links ] Wells, M.P. & McShane, T.O., 2004, 'Integrating protected area management with local needs and aspirations', Ambio 33, 513-519. https://doi.org/10.1579/0044-7447-33.8.513 [ Links ] Western, D., Wright, R.M. & Strum, S.C., 2013, Perspectives in community based conservation, Island Press, Washington, DC. [ Links ] Received: 04 Apr. 2017 1 . A 'trade-off park' is where one park (normally an existing park) is de-proclaimed so that it can be used for reasons other than conservation (normally development), and in its place another park is proclaimed.
IIPlant Conservation Unit, University of Cape Town, Cape Town, South Africa
IIISouth African National Parks, Kimberley, South Africa
IVApplied Behavioural Ecology and Ecosystem Research Unit, University of South Africa, Florida, South Africa
VCentre for Wildlife Management, University of Pretoria, Pretoria, South Africa
VIDepartment of Plant and Soil Science, University of Pretoria, Pretoria, South Africa
CONSERVATION IMPLICATIONS: This study was conducted in a large conservation area, that is, a natural ecosystem excluding most of the anthropogenic threats that are present outside of the park. The study illustrated that in the duneveld the population studied was self-sustaining, with recruitment occurring and large individuals presumably dying of old age. Although fire caused a few individuals to coppice, no fire-related deaths were reported. In the Nossob riverbed, surveys started in a stand of predominantly young trees and the size class distribution at that stage already showed a lack of recruitment. This stand is ageing and will likely disappear at this site; however, new young stands are appearing at other sites in the Nossob riverbed. Under the current conditions with negligible anthropogenic influences, it therefore appears that some V. erioloba populations in the park are increasing in size while others are decreasing, but that overall the species will persist. The impact of global climate change on this species is, however, unknown.
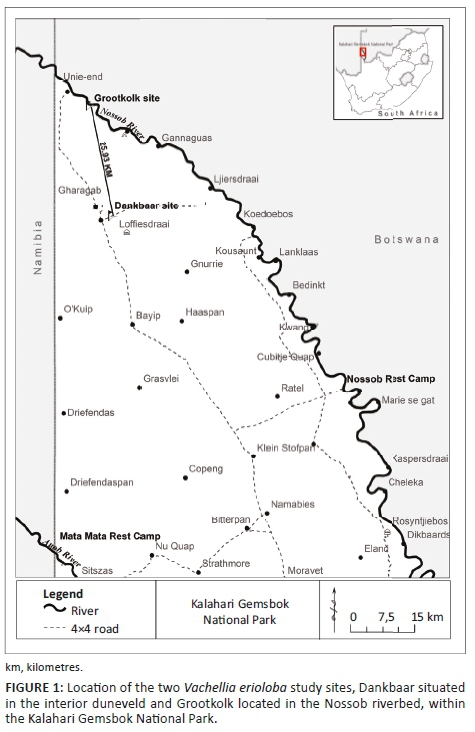
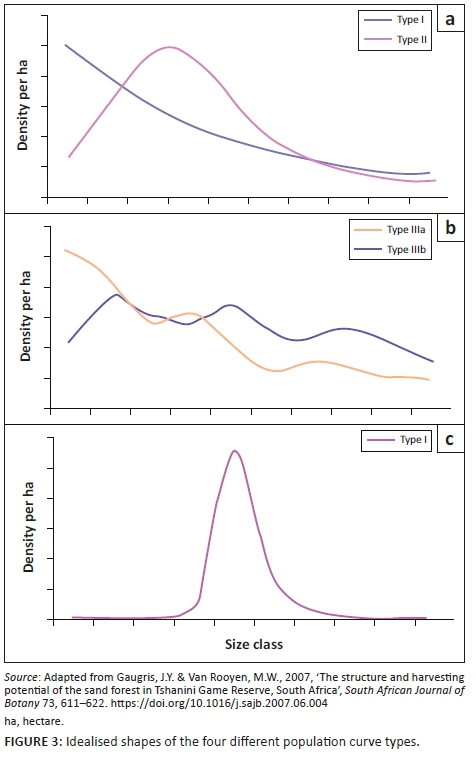
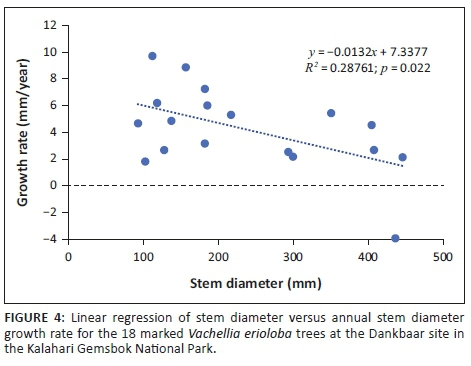
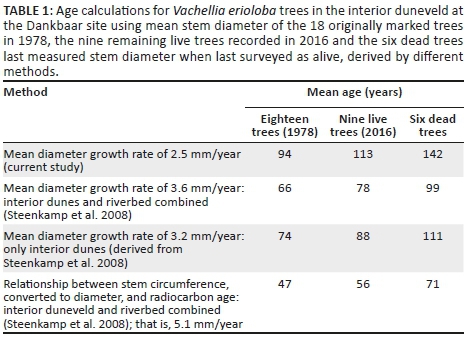
 Correspondence:
Helga van der Merwe
helga@saeon.ac.za
Accepted: 21 Nov. 2018
Published: 29 Apr. 2019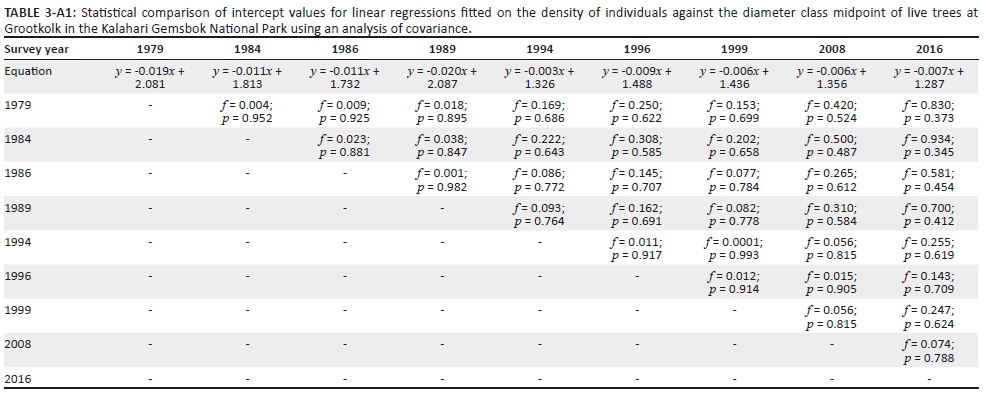
Table 3 -A1 - Click to enlarge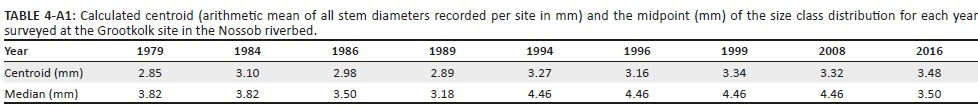
Table 4 -A1 - Click to enlarge 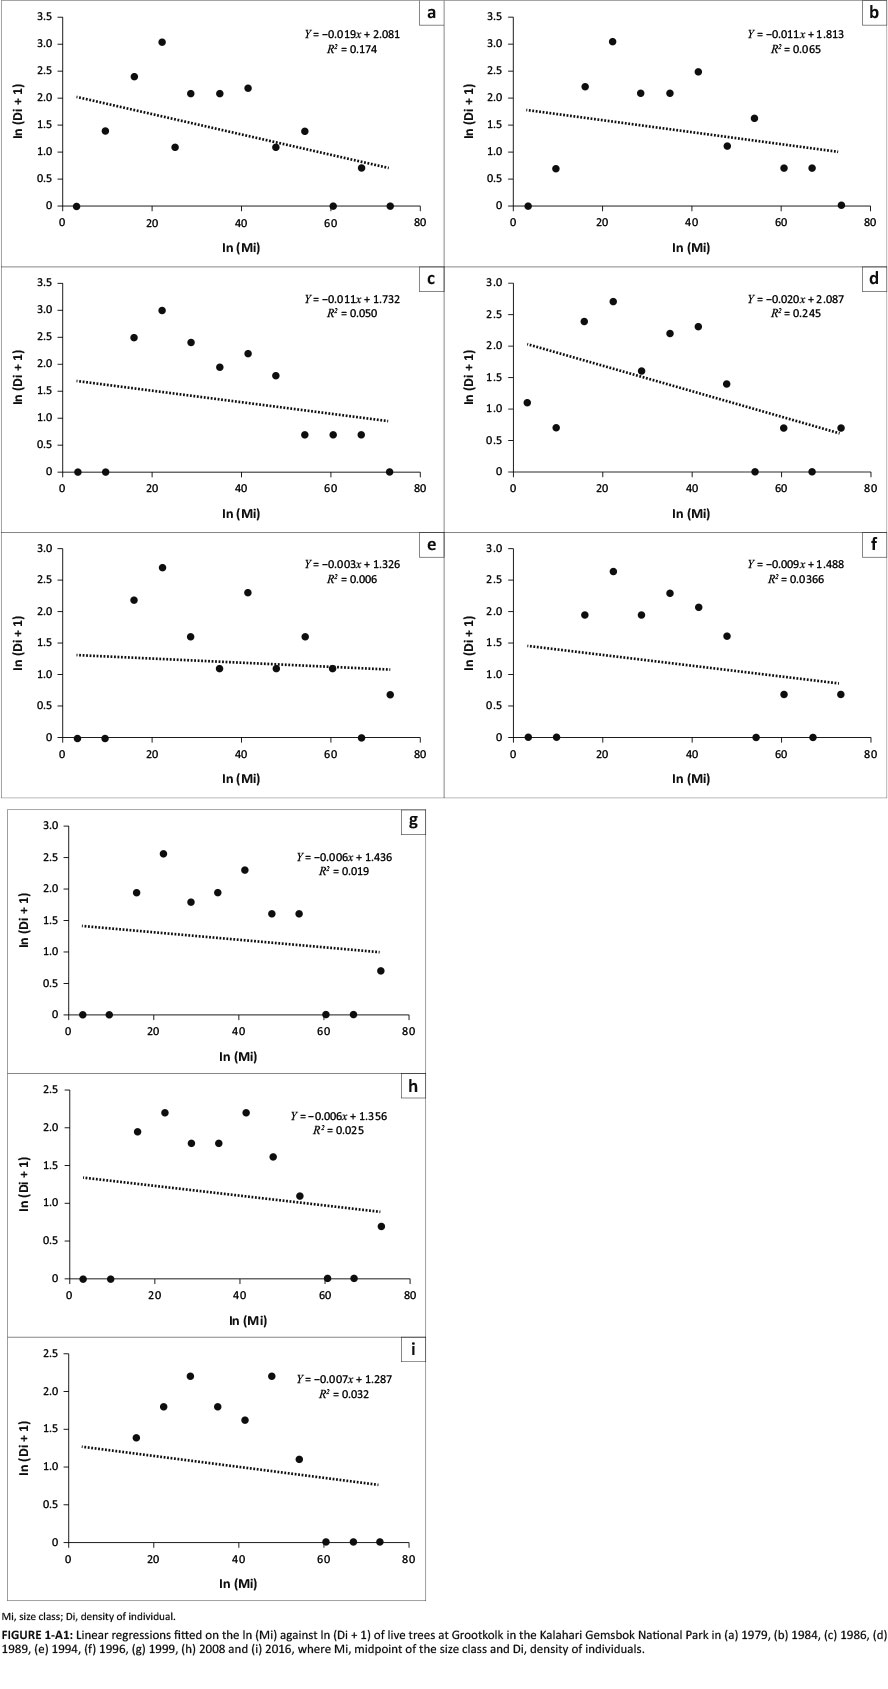
Figure 1 A1 - Click to enlarge
IIOrganisation for Tropical Studies, Skukuza, South Africa
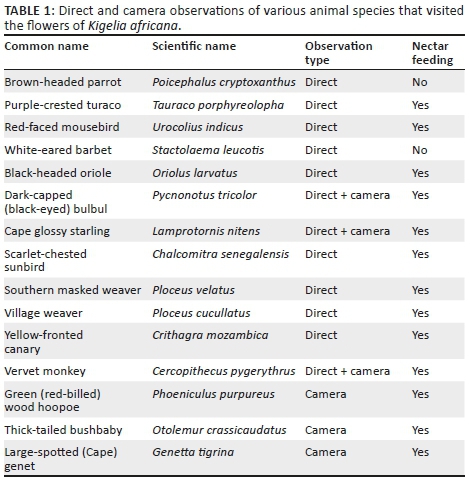 Correspondence:
Jeremy Midgley
jeremy.midgley@uct.ac.za
Accepted: 12 Nov. 2018
Published: 29 Apr. 2019
IICentre for Invasion Biology, Stellenbosch University, Stellenbosch, South Africa
IIIConservation Services, South African National Parks, Skukuza, South Africa
CONSERVATION IMPLICATIONS: The articles included in this essay produced important information that informed and guided later research. Introducing these contributions to a fresh audience we hope will also tempt readers to consult other back issues of this journal, which will benefit conservation by providing an understanding of the long-term transformations in the field.
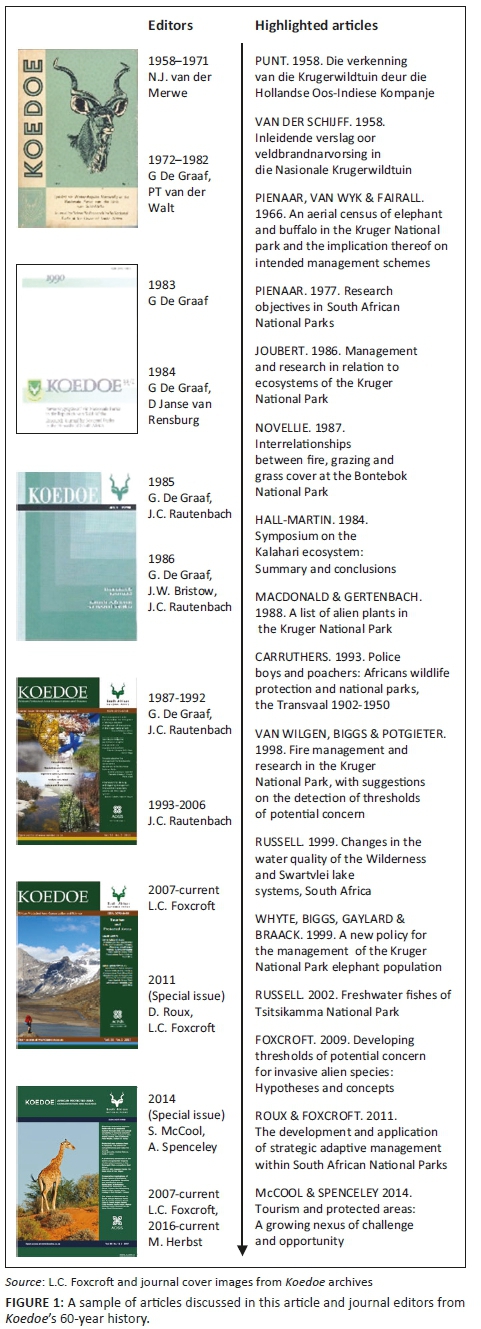
Correspondence:
Llewellyn Foxcroft
llewellyn.foxcroft@sanparks.org
Accepted: 19 Nov. 2018
Published: 08 Apr. 2019
IIDepartment of Global Ecology, Carnegie Institution for Science, California, United States
CONSERVATION IMPLICATIONS: In savannas, termites play crucial roles in nutrient cycling, water redistribution and plant dynamics. Systematically cataloguing termite diversity and assemblage composition in the park provides an essential baseline for scientific research, aids biodiversity conservation efforts and encourages scientists and managers to consider termites in ecosystem functioning and management. Having more detailed descriptions of genera, species and feeding groups allows for more tangible, ecologically relevant attributions of termite influence, facilitates enhanced inquiry and allows for more realistic quantification of termite roles in key ecosystem processes.
 Correspondence:
Brianna M. Lind
brianna.m.lind@gmail.com
Accepted: 12 Nov. 2018
Published: 09 Apr. 2019
IISouth African Environmental Observation Network (SAEON), Phalaborwa, South Africa
CONSERVATION IMPLICATIONS: South Africa has initiated a Strategy on Buffer Zones which seeks to buffer threats to national parks. Evaluating how well buffer reserves function in this capacity is crucial for understanding management effectiveness and resource allocation. Utilising a combination of MTRAs and geospatial tools can assist managers in understanding threats and their mitigation across PAs.
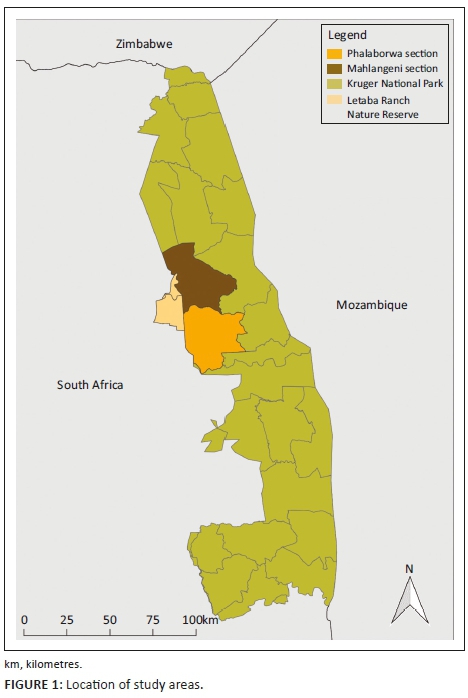


Correspondence:
Luna Milatović
luna.milatovic@gmail.com
Accepted: 14 Feb. 2019
Published: 19 June 2019
IIDepartment of Animal, Plant and Environmental Sciences, University of the Witwatersrand, Johannesburg, South Africa
CONSERVATION IMPLICATIONS: Savanna landscapes that are degraded, but not transformed, support fewer bird species, fewer open habitat specialists and smaller birds because of vegetation homogenisation.
Correspondence:
Mathew Harris
mathew.harris@fabi.up.ac.za
Accepted: 14 Feb. 2019
Published: 17 July 2019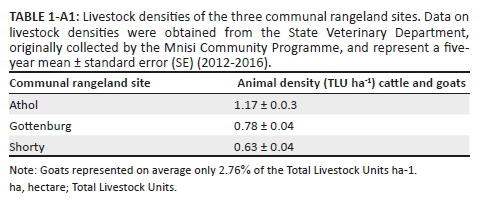
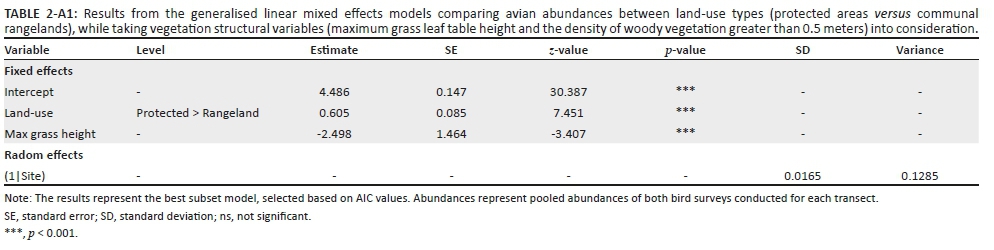
Table 2- A1 - Click to enlarge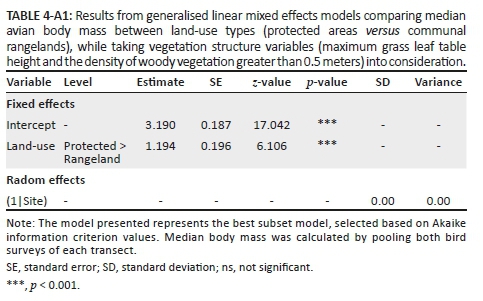

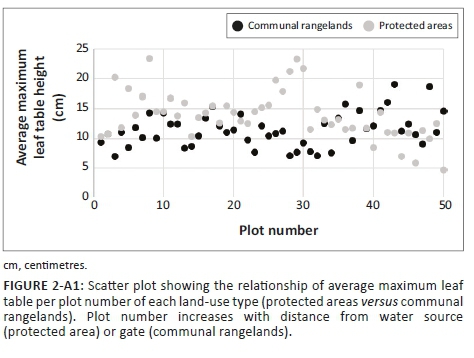
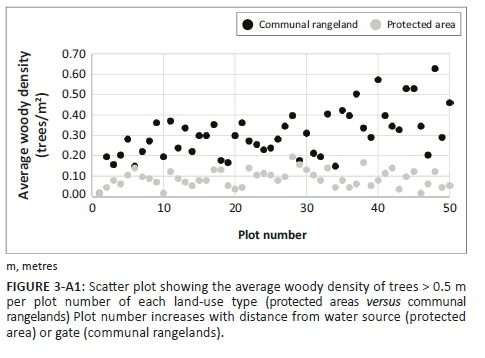
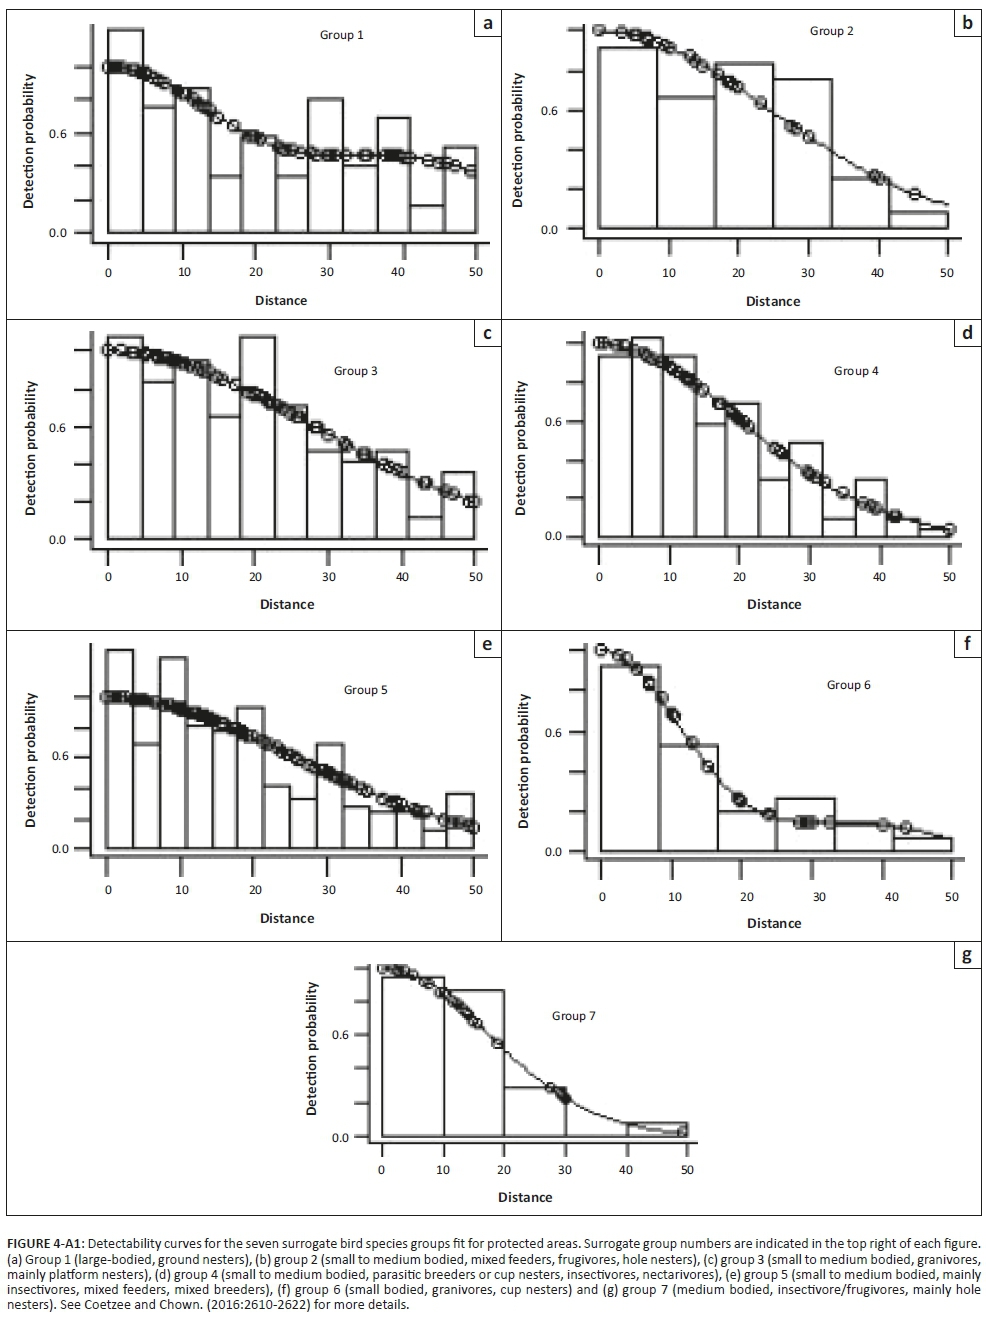
Figure 4- A1 - Click to enlarge
Figure 5- A1 - Click to enlarge 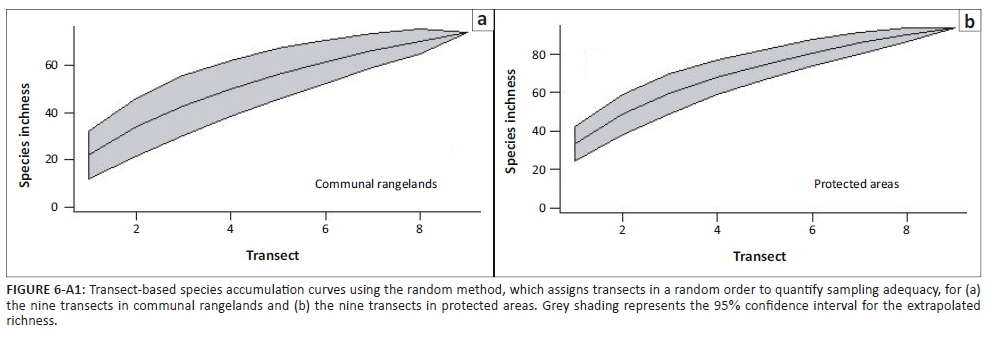
Figure 6 - A1 - Click to enlarge 
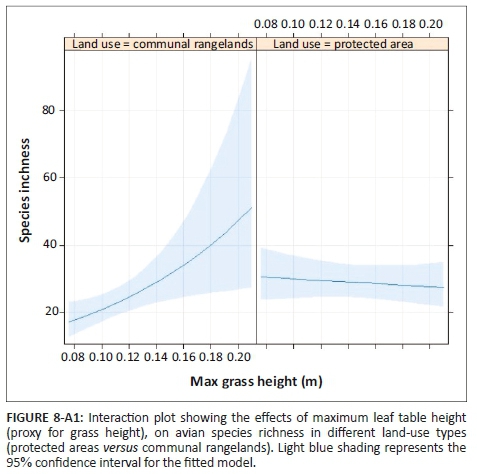
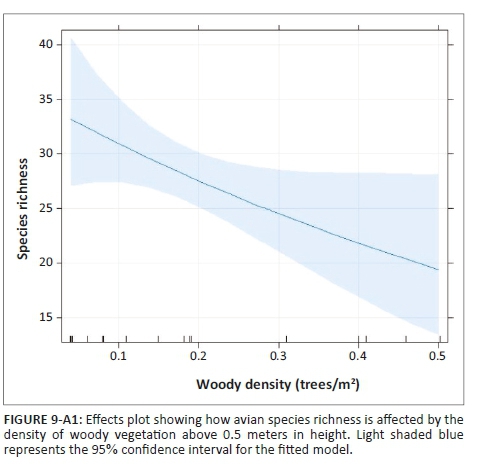
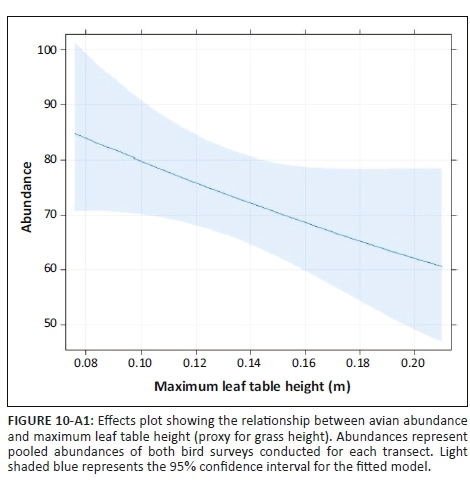
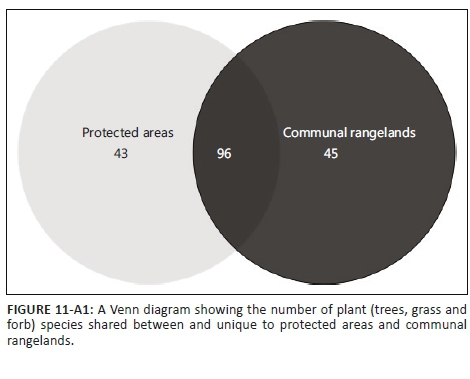
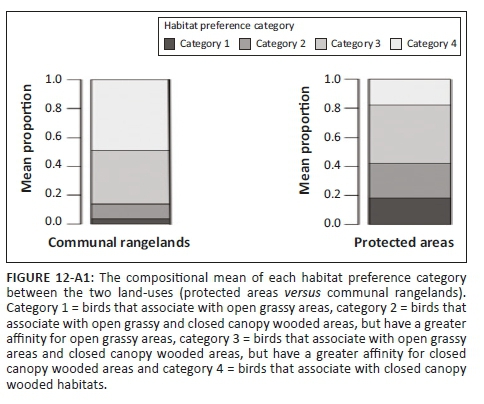
IILaboratory of Electron Microscopy, Chemical Resource Beneficiation, North-West University, Potchefstroom, South Africa
CONSERVATION IMPLICATIONS: Translocations are fast becoming an attractive alternative for developers. This study cautions that the presence of pollinators and successful reproduction in translocated populations are only effective if the populations were translocated to an ideal habitat.


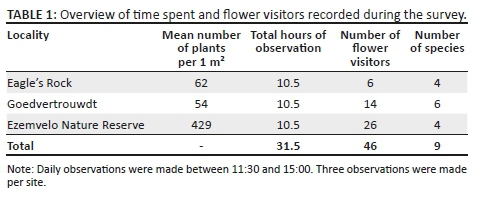
 Correspondence:
Stefan Siebert
stefan.siebert@nwu.ac.za
Accepted: 02 Apr. 2019
Published: 14 Aug. 2019
IIElephants Alive, Hoedspruit, South Africa
CONSERVATION IMPLICATIONS: A variety of options exist to manage the effects that elephants have on large trees. These options range from large-scale landscape manipulation solutions to small-scale individual tree protection methods. Interactions between elephants and large trees are complex, however, and conservation managers need to consider the advantages and disadvantages of each mitigation strategy to protect large trees.
Correspondence:
Michelle Henley
michelephant@savetheelephants.org
Accepted: 16 May 2019
Published: 15 Aug. 2019 Correspondence:
Anneli Douglas
anneli.douglas@up.ac.za
Accepted: 12 June 2019
Published: 17 Sept. 2019
IIDepartment of Biology, Faculty of Science and Technology, National University of Lesotho, Roma, Lesotho
CONSERVATION IMPLICATIONS: The study can be invaluable to wetland scientists, managers, biodiversity conservationists, water resource managers and planners and vegetation ecologists in Southern Africa. About 70% of Lesotho falls in the Maloti-Drakensberg, accounting for about 60% of the region, and this makes the study important in biodiversity conservation planning, particularly in the Highlands. The wetlands in Lesotho face severe anthropogenic pressures that include overgrazing and economic development. Given that the Lesotho Highlands as a water catchment is not only important for Lesotho, but also for South Africa and Namibia, the conservation of the associated wetlands and this critical water resource is indispensable
 Correspondence:
Peter Chatanga
chatangapn@yahoo.co.uk
Accepted: 30 Aug. 2019
Published: 31 Oct. 2019
IIDepartment of Animal, Wildlife and Grassland Sciences, University of the Free State, Bloemfontein, South Africa Correspondence:
Paul Grobler
groblerjp@ufs.ac.za
Accepted: 05 June 2019
Published: 16 Sept. 2019
https://doi.org/10.4102/koedoe.v61i1.1470
IIOptentia Research Programme, North-West University, South Africa
CONSERVATION IMPLICATIONS: The findings could be of practical use to SANParks to steer its community development initiatives towards attaining a more optimal balance between actual community needs and what the organisation can realistically offer, thus rendering SANParks' efforts more efficient and effective in supporting the establishment of equitable and sustainable rural communities
Correspondence:
Hendri Coetzee
hendri.coetzee@nwu.ac.za
Accepted: 19 Sept. 2018
Published: 28 Feb. 2019
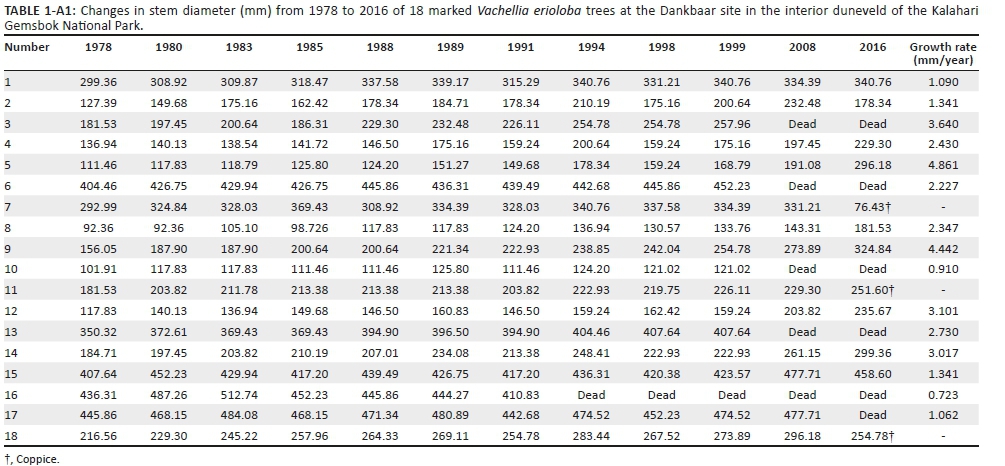
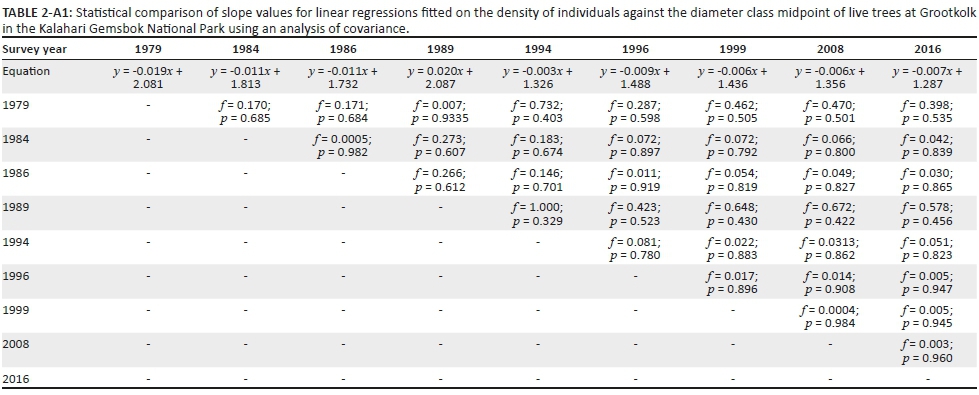
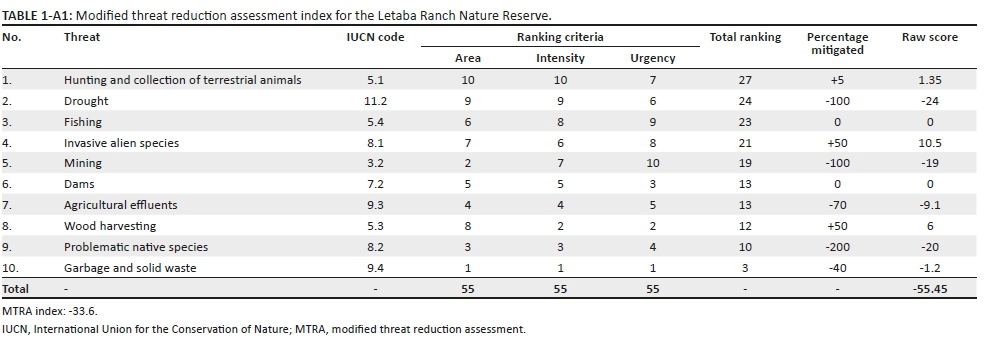


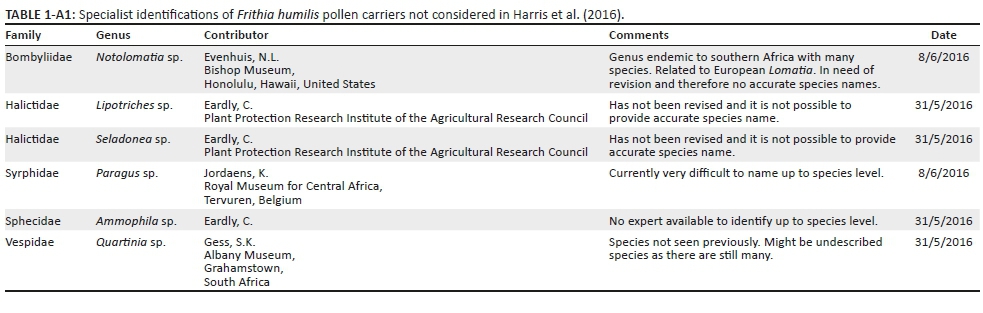


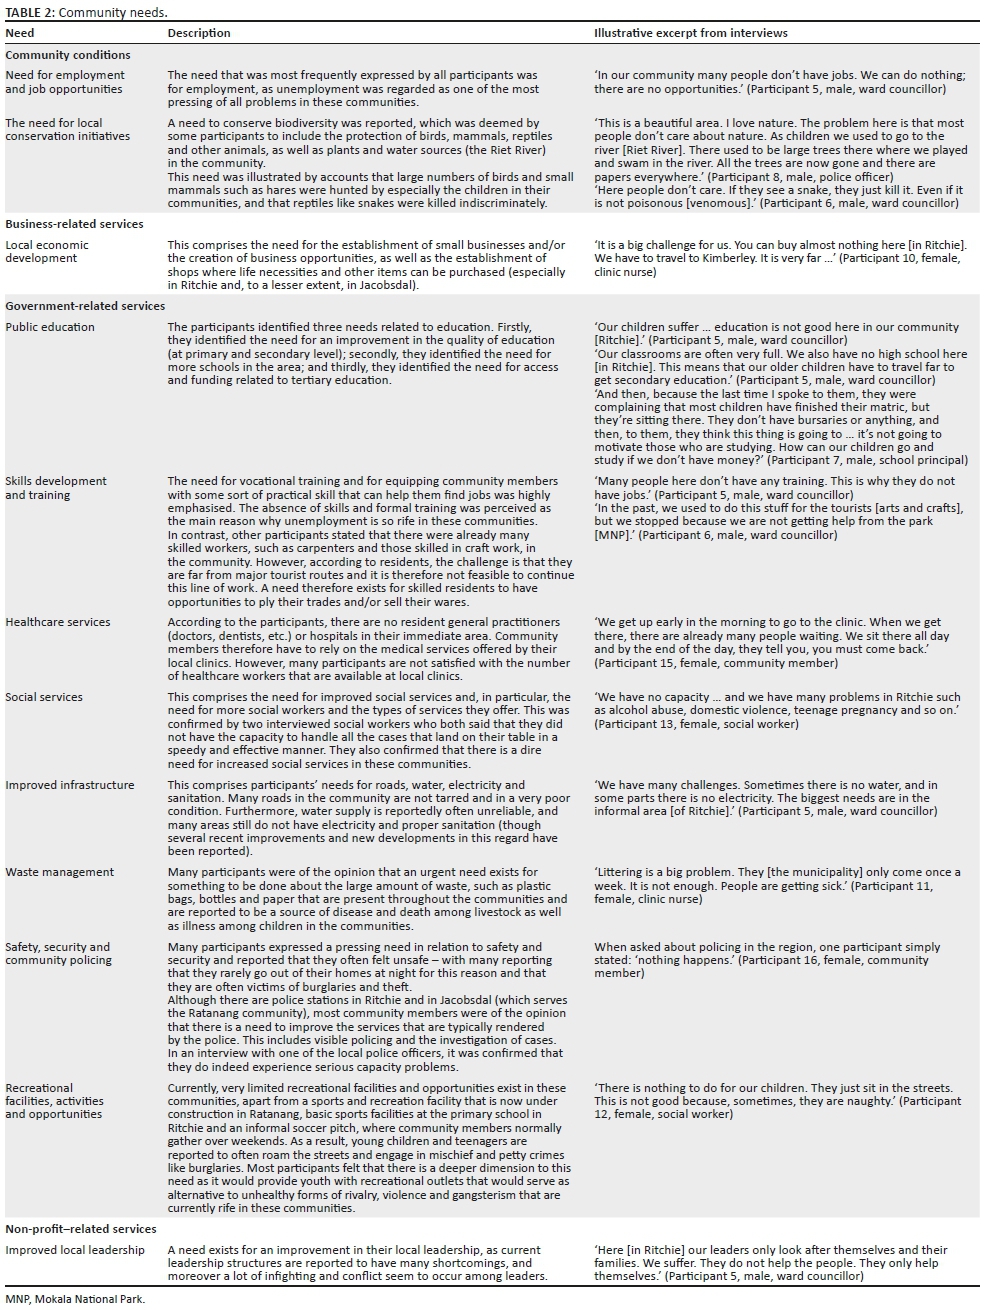
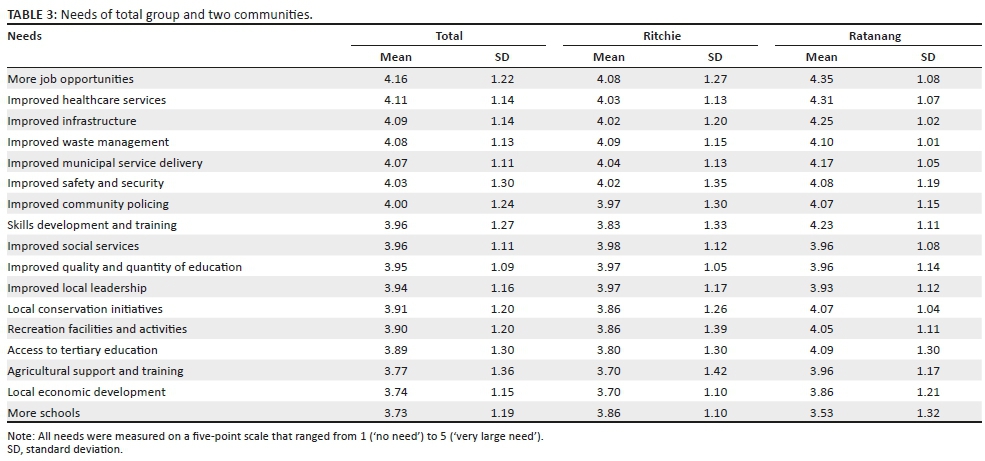
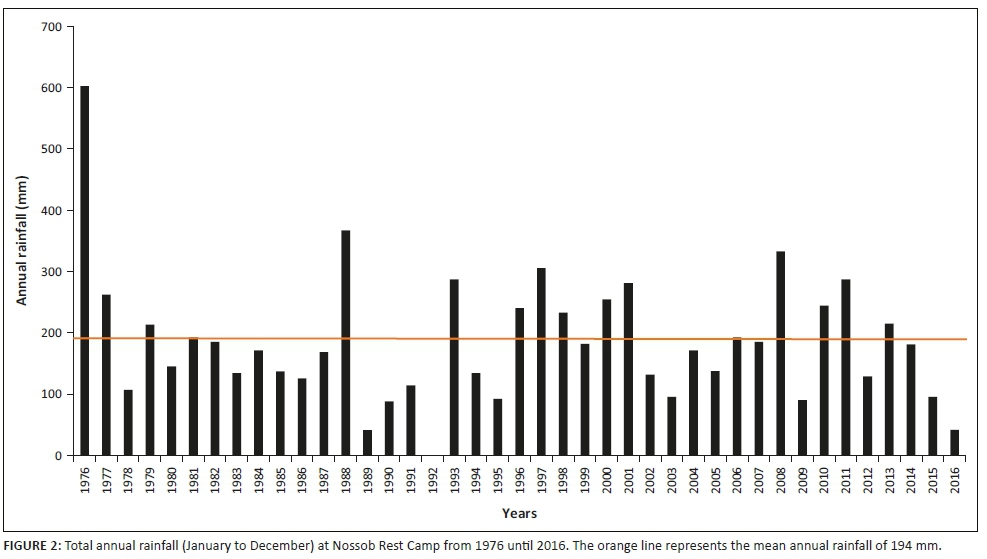
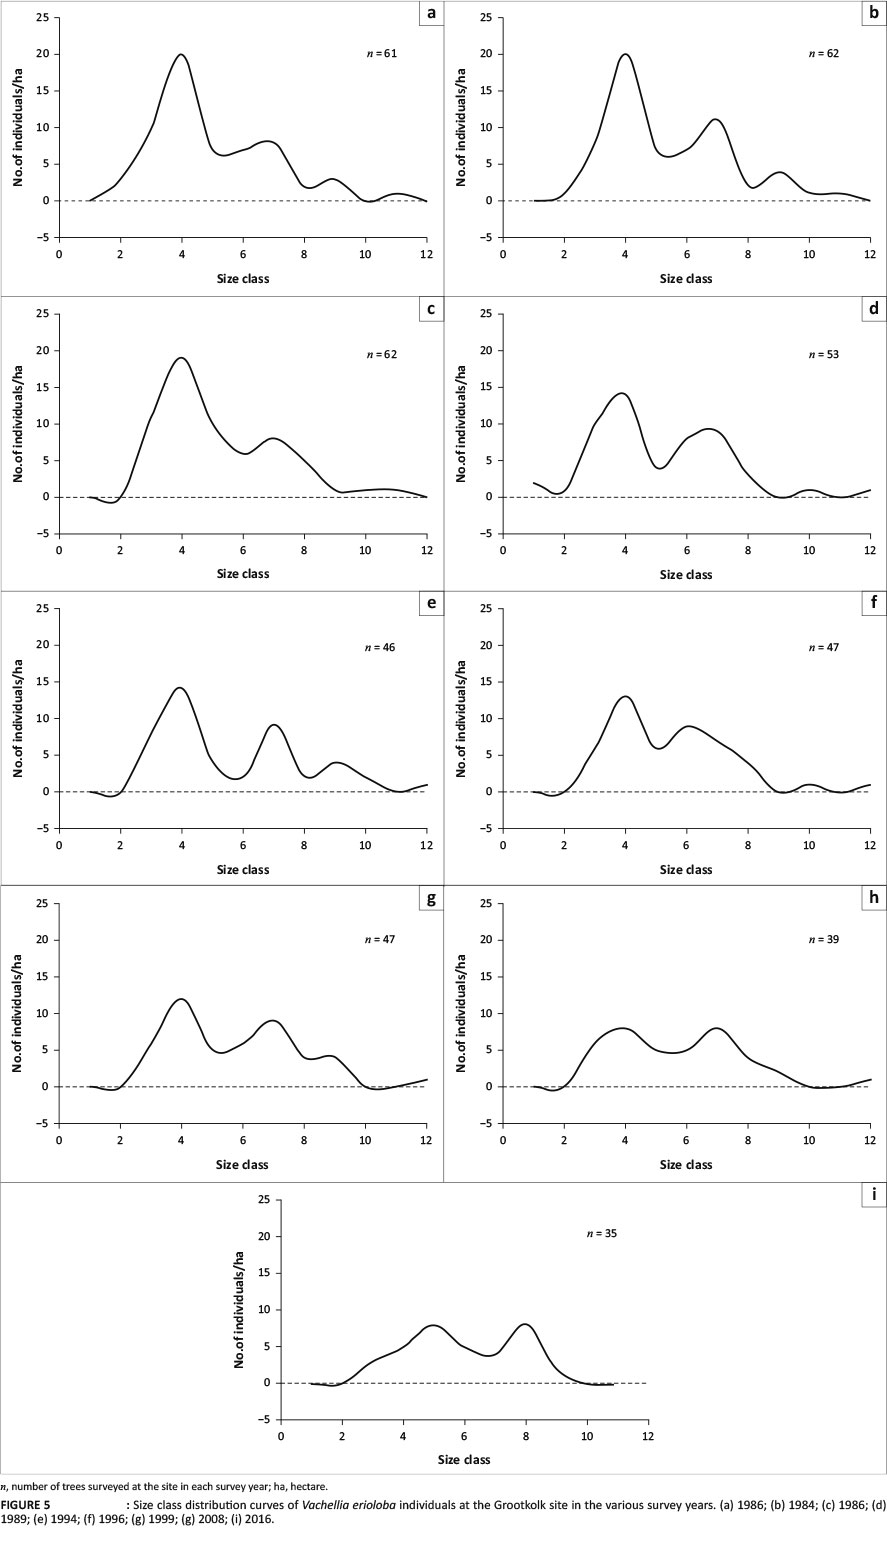
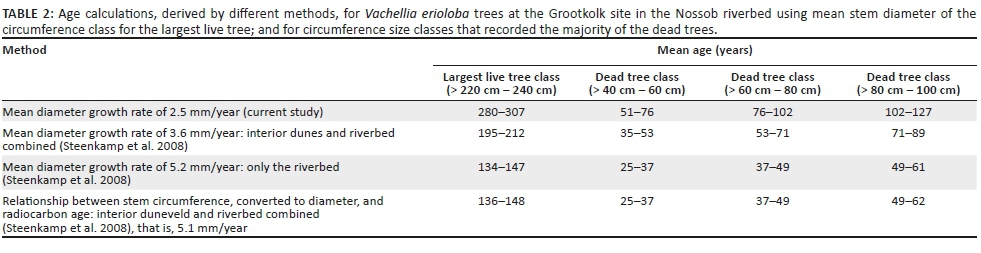
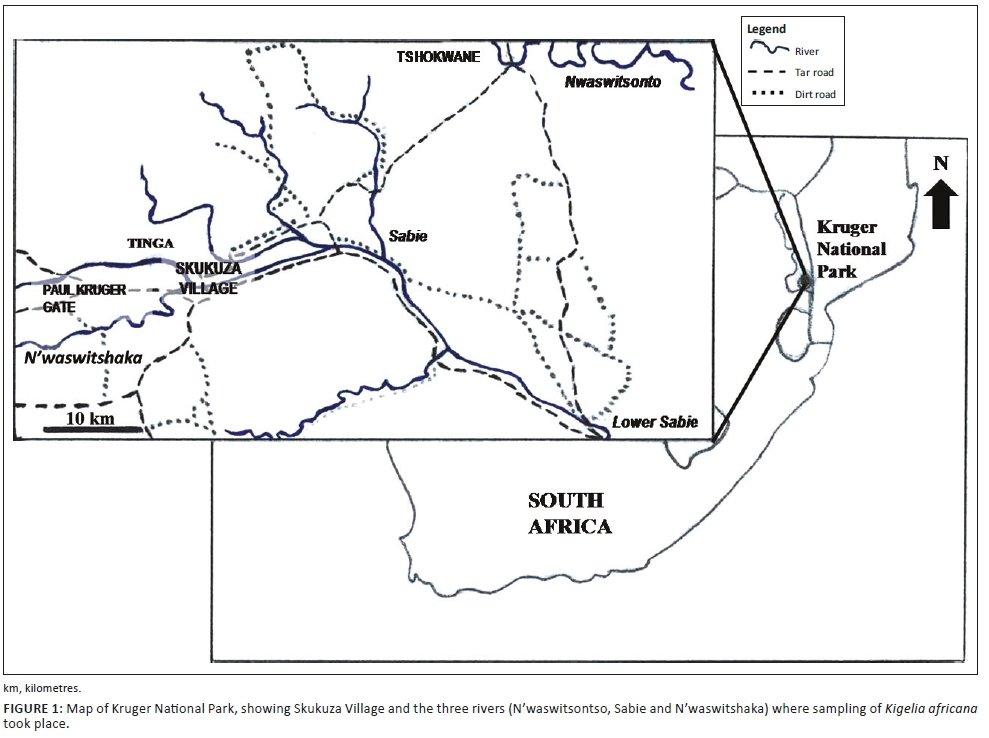
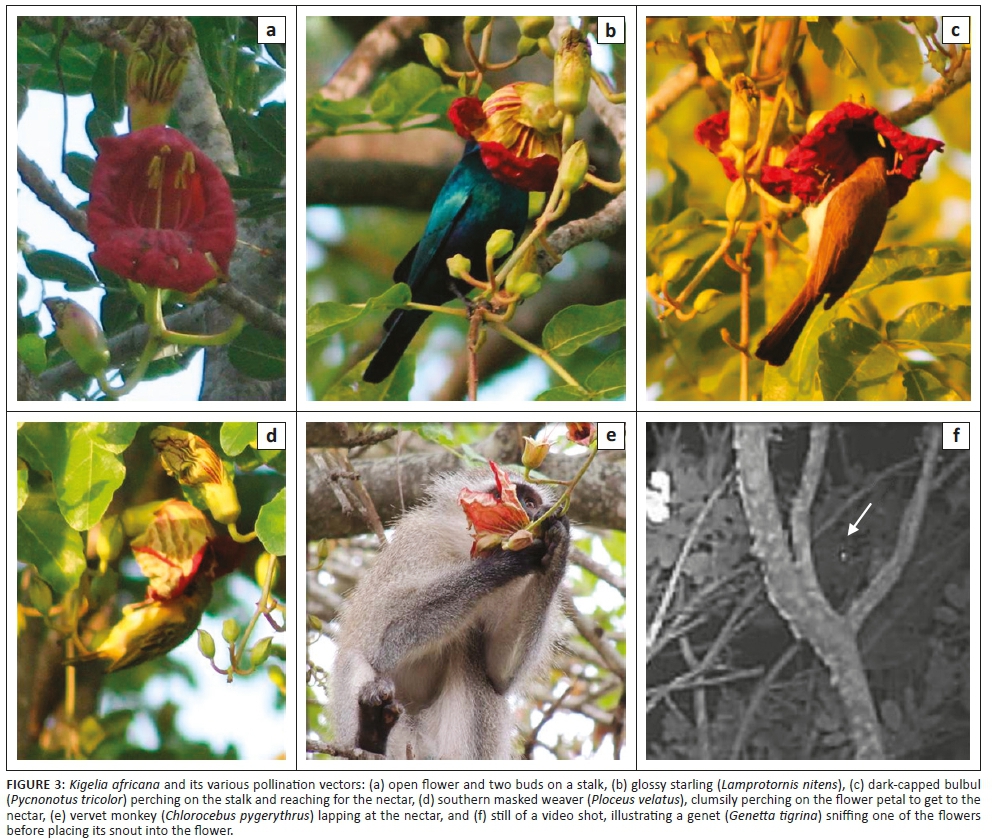
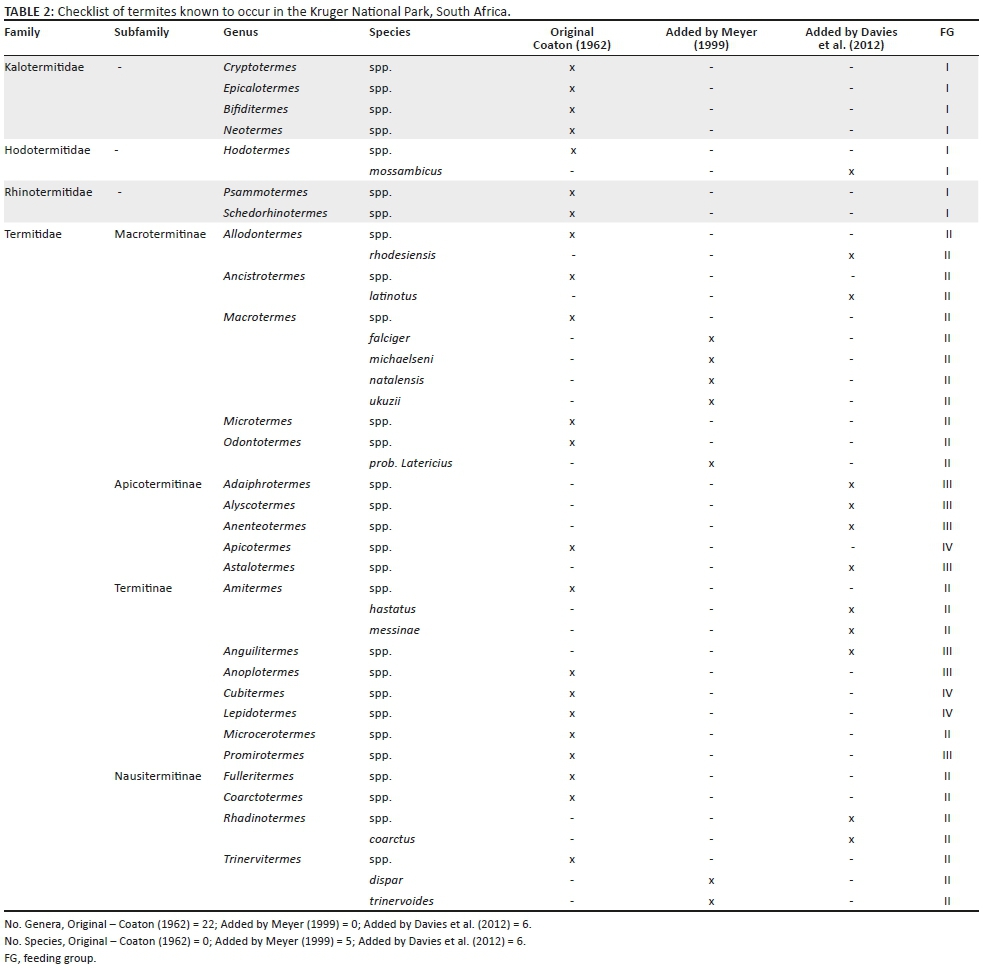
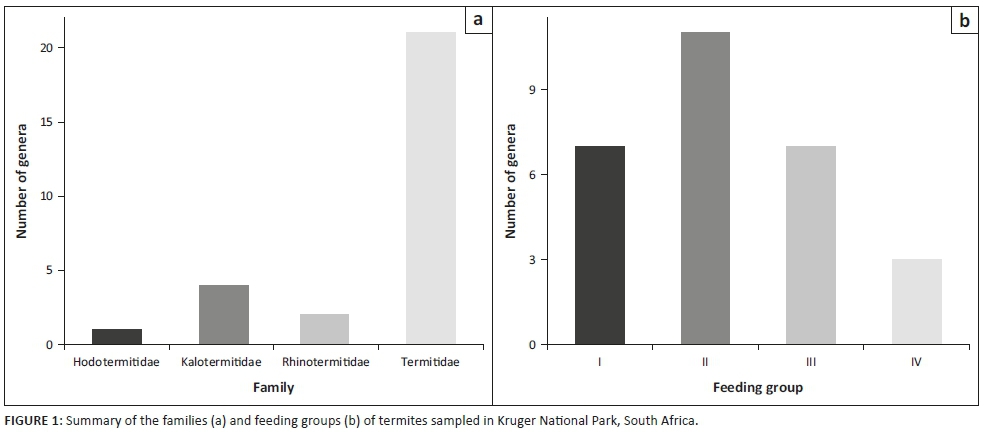
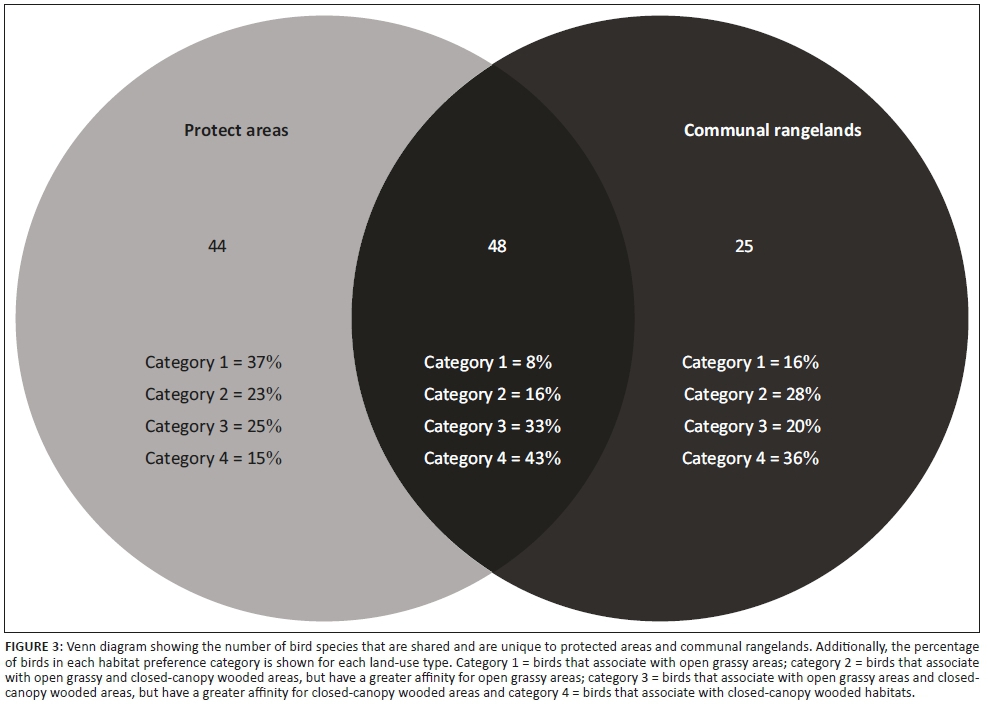
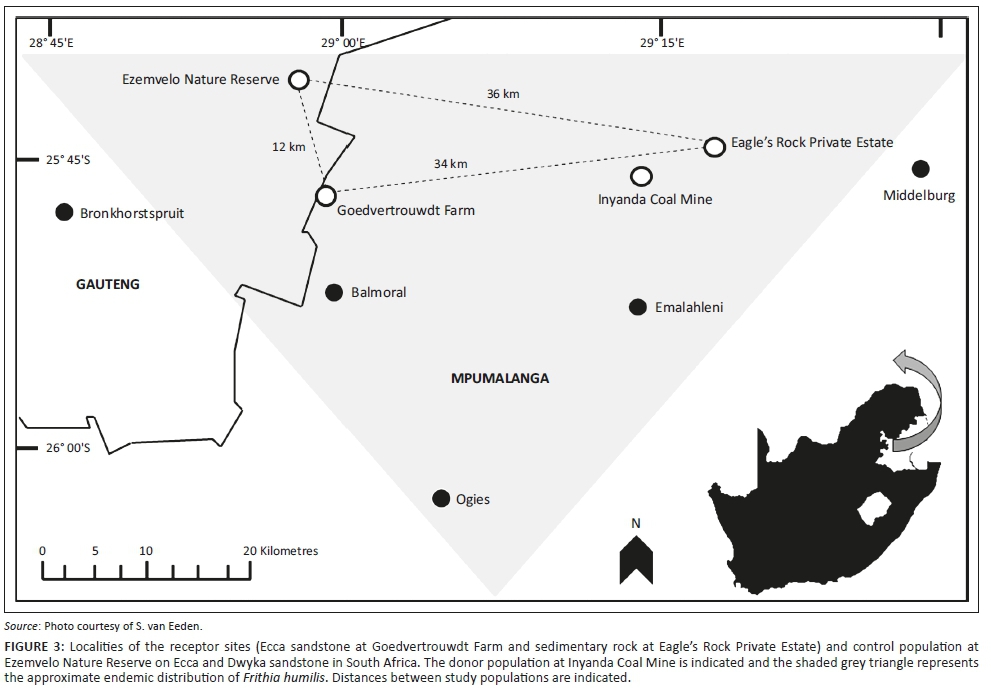
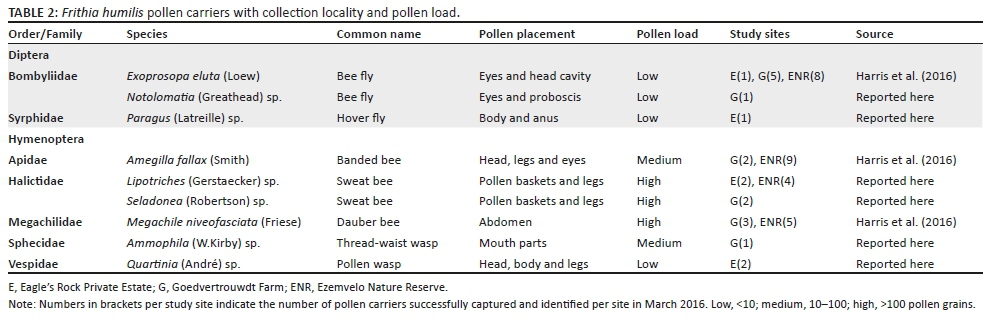
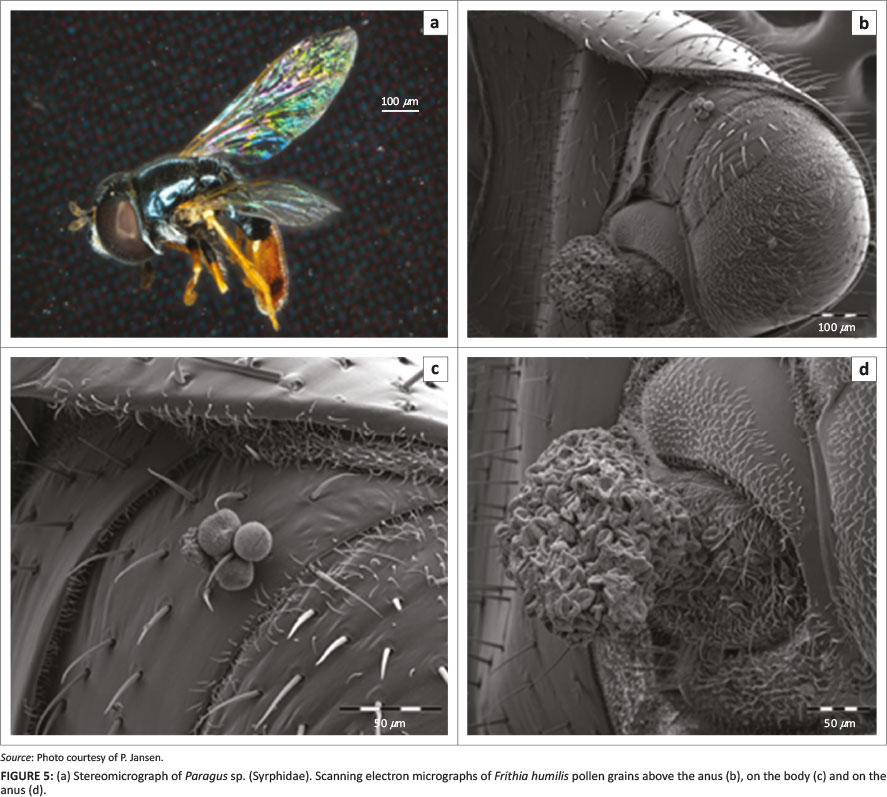
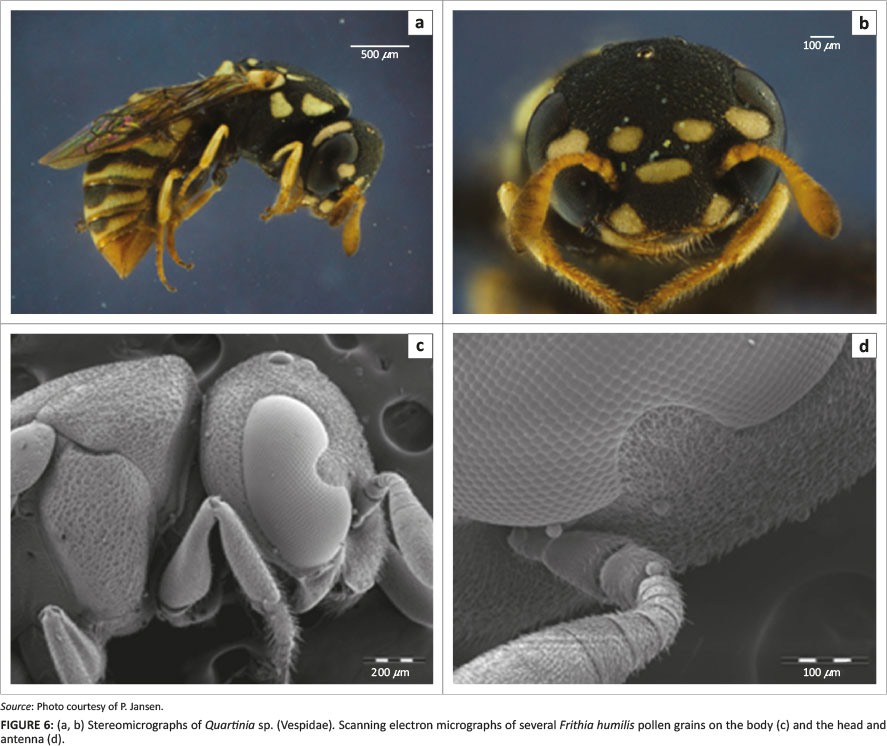
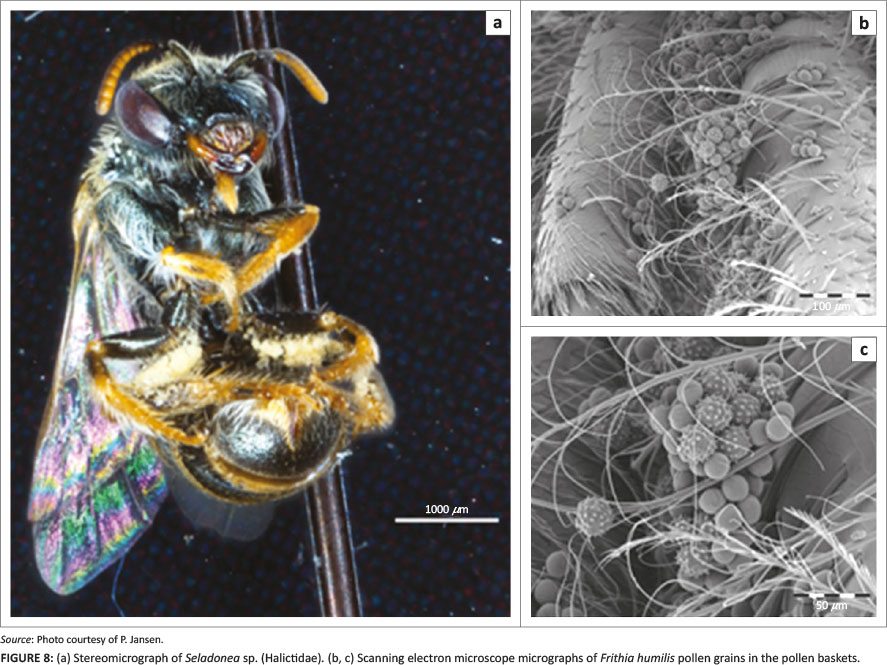
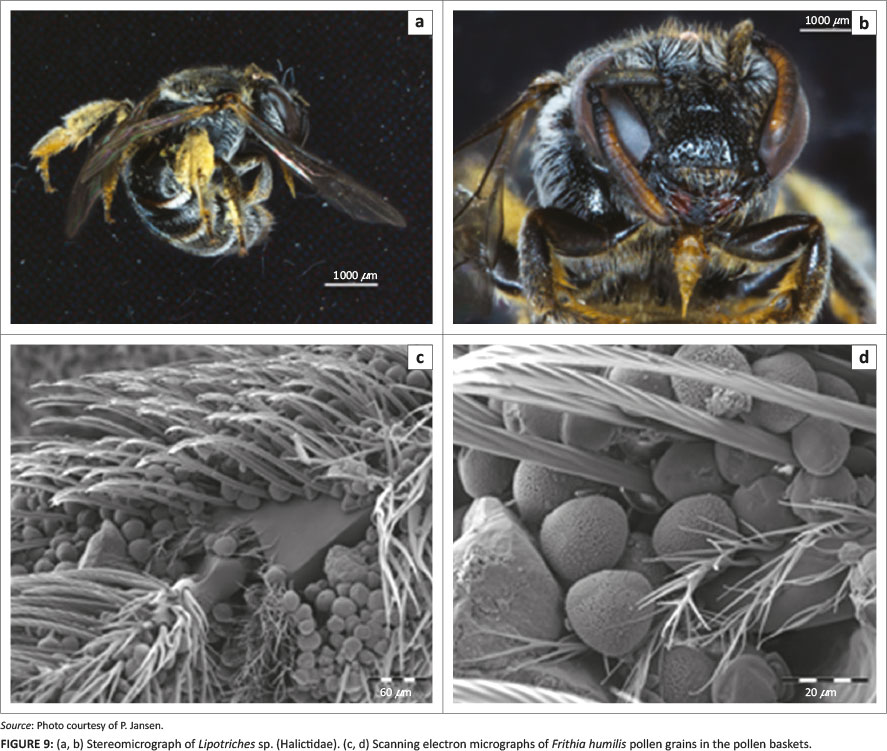
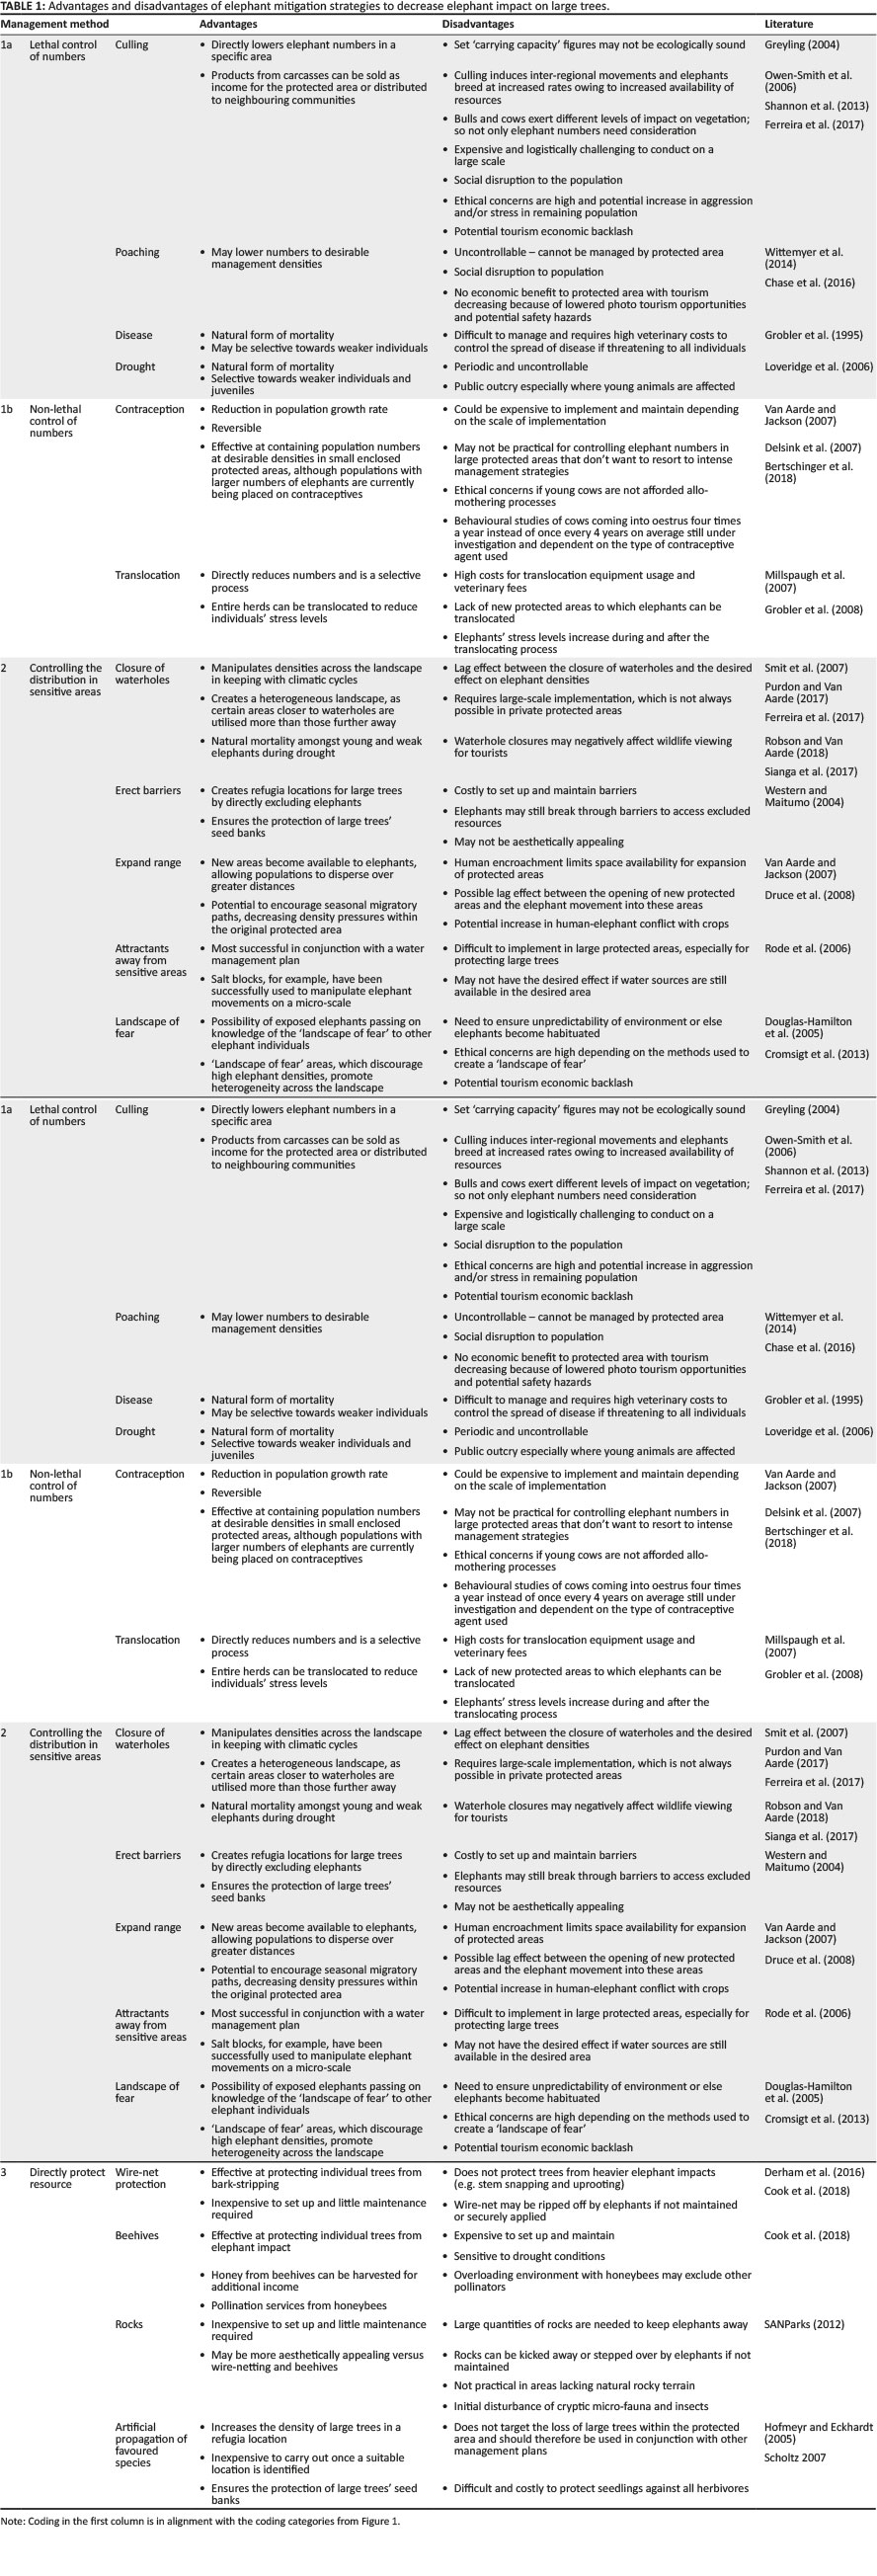
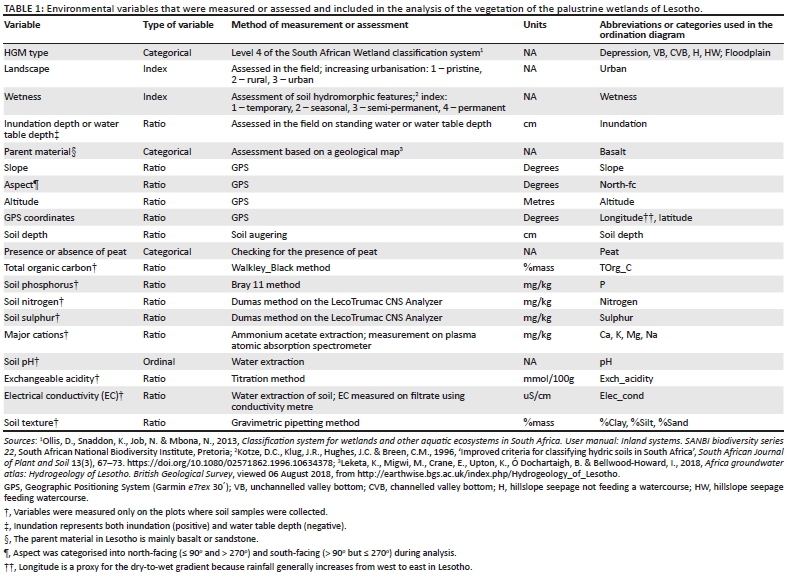
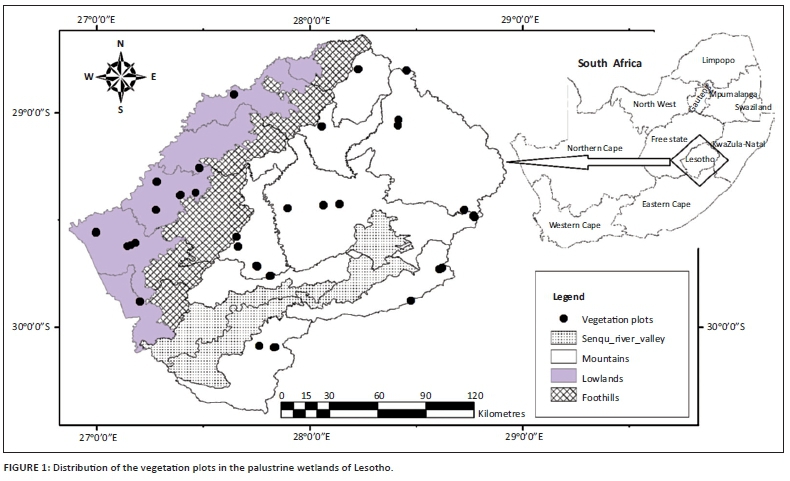