


Services on Demand
Article
 English (pdf)
 Article in xml format
 Article references
Indicators

Related links
-
 Cited by Google
 -
 Similars in Google
Share

 Permalink
Koedoe
On-line version ISSN 2071-0771
Print version ISSN 0075-6458
Koedoe vol.60 n.1 Pretoria 2018
http://dx.doi.org/10.4102/koedoe.v60i1.1473
ORIGINAL RESEARCH
Long-term variability in vegetation productivity in relation to rainfall, herbivory and fire in Tswalu Kalahari Reserve
Wataru TokuraI, II; Sam L. JackII; Tania AndersonIII; Michael T. HoffmanII
IPercy FitzPatrick Institute of African Ornithology, University of Cape Town, South Africa
IIDepartment of Biological Sciences, University of Cape Town, South Africa
IIIPrivate, Johannesburg, South Africa
ABSTRACT
Exploring the long-term influence of climate and land use on vegetation change allows for a more robust understanding of how vegetation is likely to respond in the future. To inform management, this study investigated the relationship between vegetation productivity trends and potential drivers of change in the 110 000 ha of the Tswalu Kalahari Reserve between 2000 and 2015, using the Moderate Resolution Imaging Spectroradiometer Enhanced Vegetation Index (EVI, MOD13Q1). Spatio-temporal variability of the EVI was mapped and then related to the historical records of precipitation, animal numbers and fire occurrences. Long-term trends in productivity were analysed by residual trend analysis (RESTREND). Significantly different EVI profiles were found between vegetation types, and this was related to the structure and function of the vegetation, as well as the effects of soil reflectance. The EVI time-series signalled spatial and temporal heterogeneity in plant productivity, which was strongly correlated with rainfall, although fire and especially herbivory had noteworthy localised effects on productivity. The RESTREND identified a significant positive trend in plant productivity in shrub-dominated vegetation types, providing evidence for the ongoing thickening of woody species. Significant negative trends in productivity were associated with artificial water points and more heavily stocked areas, leading to degradation.
CONSERVATION IMPLICATIONS: The southern Kalahari has a highly variable rainfall regime, which is tied to a dynamic vegetation response. This variability should be taken into account when making management decisions. Field-based monitoring together with adaptive management approaches are needed in the face of an uncertain future in which significant warming is expected.
Introduction
Vegetation dynamics in arid environments are controlled to a large degree by abiotic factors such as temperature and moisture availability (Reynolds et al. 2004; Weltzin et al. 2003). Changes in moisture supply to vegetation, either directly via rainfall or indirectly in terms of the effects of rising temperatures on evaporation and transpiration rates, are therefore likely to have a significant effect on arid-adapted vegetation (Collins et al. 2014; Weltzin et al. 2003). Consequently, there is an expectation that anthropogenic climate change will have a disproportionate impact on arid systems. Indeed, recent declines in the equator-ward populations of certain arid region species, and a poleward shift in species' ranges as a result of physiological stress and/or changing inter-specific interactions between species, have already been documented (Cahill et al. 2012; Chen et al. 2011; Hickling et al. 2006).
Because of slow vegetation growth rates and episodic recruitment in arid environments, long-term monitoring studies have been crucial in revealing directional changes in these systems (Guo 2004; Lindenmayer et al. 2012; Rahlao et al. 2008). Although it can be difficult to discern the relative influence of different drivers on vegetation dynamics (Weltzin et al. 2003), drawing on long-term and large-scale ecological data sets can provide a more accurate representation and robust understanding of complex systems and enable more evidence-based conservation management (Lindenmayer et al. 2012). Earth Observation Data (EOD) derived from satellites have been used in a number of studies to monitor environmental change (Nagendra et al. 2013). With its broad spatial coverage, growing historical archive, temporal consistency and cost efficiency, EOD can circumvent the logistical challenges of field-based monitoring techniques (Mishra et al. 2015b; Nagendra et al. 2013). However, in the sparsely vegetated drylands context, the application of EOD for vegetation studies has certain challenges, such as considerable background noise in the Normalised Difference Vegetation Index (NDVI) values (Huete et al. 2002; Kong et al. 2015; Palmer & Van Rooyen 1998; Van Rooyen 2000), as well as in accounting for the overriding influence of rainfall over other factors (Wessels et al. 2007). Nevertheless, recent vegetation monitoring studies in the semi-arid Kalahari in southern Africa have successfully employed time-series NDVI or improved vegetation indices such as the Enhanced Vegetation Index (EVI), with careful interpretation aided by an understanding of the ecology and vegetation dynamics of the region (e.g. Colditz et al. 2007; Mishra et al. 2015a). Several techniques, such as rain use efficiency and residual trend analysis (RESTREND) (Wessels et al. 2007, 2012), have also been developed to isolate the effects of rainfall in order to discern the influence of other factors on dry land vegetation.
In relation to other drylands of the world, the southern Kalahari, located in the central-western region of southern Africa, has experienced some of the strongest warming in the historical record (Kruger & Sekele 2013). Moreover, modelled projections are for particularly severe climate change in this region in the 21st century, with reductions in moisture availability and higher evaporative loss as a result of marked temperature increases (Dai 2013; Engelbrecht et al. 2015; Shongwe et al. 2009). Several studies have reported on how historical warming may already be contributing to the reduced fitness of certain bird species (e.g. Cunningham et al. 2013; Du Plessis et al. 2012). However, the impact of historical and projected climate change on vegetation change in the southern Kalahari has received less attention, probably because of the difficulty of separating the influence of multiple interacting drivers of change that operate at different temporal and spatial scales.
Changes in the climate are happening against the backdrop of a shift in land use from extensive livestock production to private game reserves for tourism and hunting, as the latter becomes increasingly profitable (Cloete et al. 2007; Thomas & Paul 1991). However, little is known about the long-term consequences of such a shift on vegetation. For example, changes in vegetation composition, structure and productivity on livestock farms in the southern Kalahari have traditionally been ascribed to overstocking (Rutherford & Powrie 2010; Skarpe 1990) and the presence of boreholes (Palmer & Van Rooyen 1998; Van Rooyen & Van Rooyen 1998). The impact on the environment of free-roaming wild game, often kept at high densities and in the absence of predator species, has not been adequately assessed.
Both livestock production and game farming are heavily reliant on rainfall to ensure good forage. Therefore, an increase in aridity is likely to affect the stocking rates of both industries and erode the profitability of these enterprises. This is a cause of concern because rangelands in the Kalahari are known to be sensitive to overgrazing, with irreversible shifts from palatable perennial grasses to unpalatable woody shrubs, or to grasslands with a dominance of annual species (Rutherford & Powrie 2010; Skarpe 1990; Van Rooyen 2000). Additionally, an increase in atmospheric CO2 concentration is also likely to facilitate the thickening of woody plants, which might lead to a shift in the suitability of vegetation for grazers to a suitability for browsers, as has been observed elsewhere in southern Africa (Bond & Midgley 2012; O'Connor, Puttick & Hoffman 2014).
Given the sensitivity of the southern Kalahari to projected climate change and the complex ramifications of a shift in vegetation composition and structure on the natural environment and tourism industry, a robust understanding of the strengths of the relationships between arid-adapted vegetation and likely drivers of change, as well as rates of change, should be a priority. This study investigated the relationship between vegetation productivity trends and drivers of change over a 15-year period (2000-2015) in a 110 000 ha mega-reserve in the southern Kalahari. This study was conducted in order to determine the dominant drivers of vegetation productivity, and thereby better understand vegetation responses to current and future climate change. Earth Observation Data were used to (1) map plant communities; (2) analyse patterns of plant productivity in space and time; (3) relate changes to historical records for precipitation, animal numbers and fire; and (4) assess where unidirectional changes in productivity might represent the thickening of woody species or degradation. Finally, we reflect on the implications of the findings of this study for natural resource management in similarly arid, summer rainfall environments.
Research methods and design
Study site
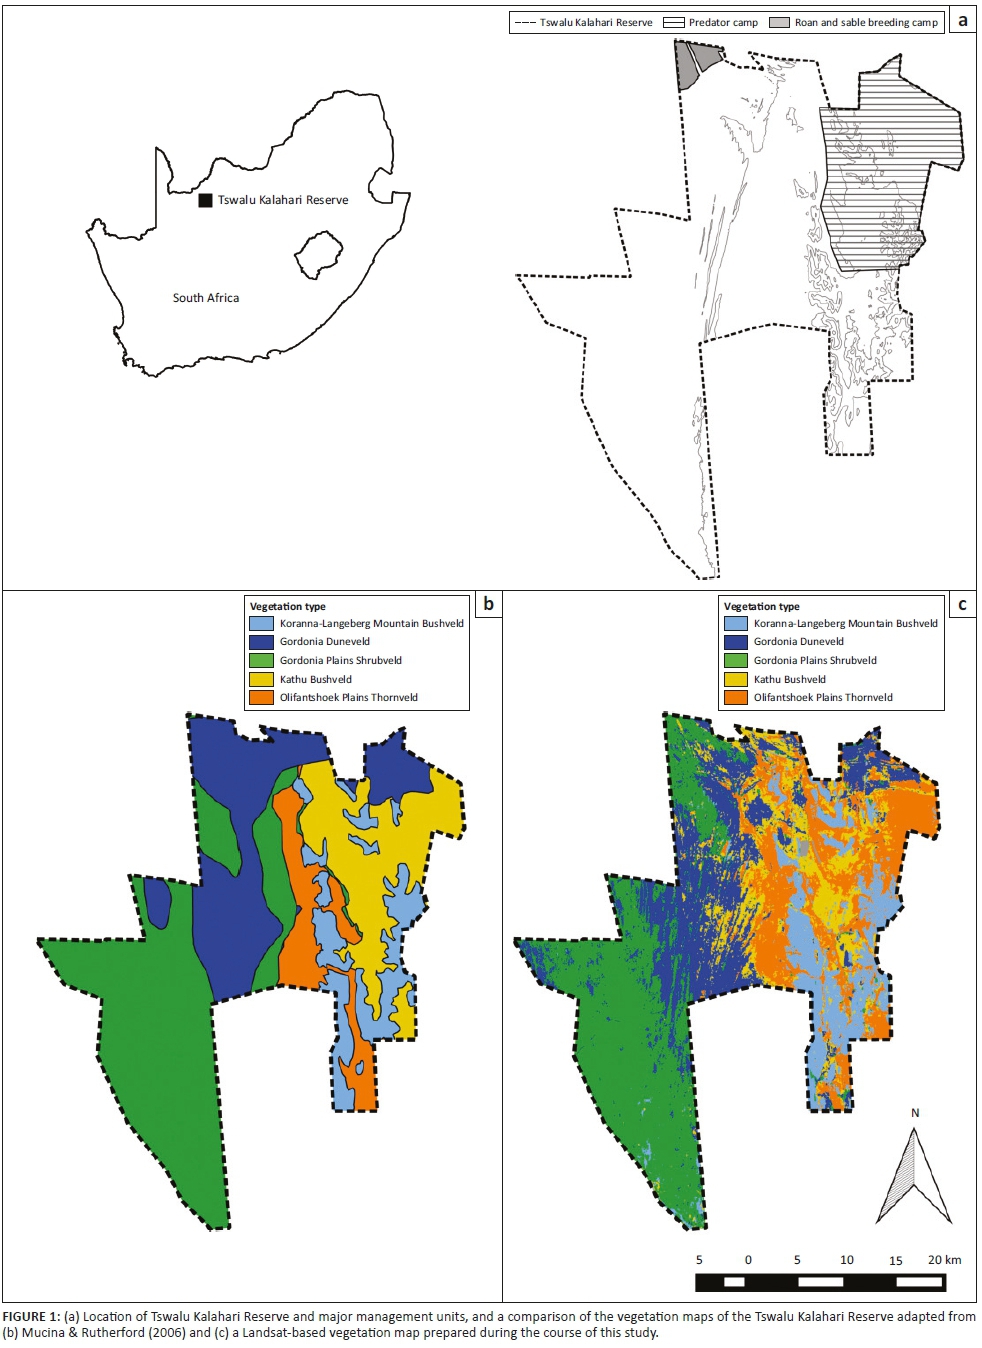
Tswalu Kalahari Reserve (TKR, 27.2031 S 22.4673 E, 1020 km2) is situated in the Northern Cape province of South Africa (Figure 1). The climate is typically hot and arid with highly variable rainfall occurring mainly during summer (December-March). The mean annual rainfall and standard deviation for the past 25 years is 361.4 mm ± 169.2 mm (South African Weather Service 2015). The landscape is characterised by sandy plains and parallel sand dunes, while the quartzitic Korannaberg Mountains extend from north to south through the eastern half of the reserve (Davis et al. 2010). Five different vegetation units are mapped by Mucina and Rutherford (2006) for the TKR, including Koranna-Langeberg Mountain Bushveld, Gordonia Duneveld, Gordonia Plains Shrubveld, Olifantshoek Plains Thornveld and Kathu Bushveld.
Prior to 1995 the TKR was divided into more than 40 livestock farms, but was converted into a nature reserve by removing farm infrastructure (e.g. fences and livestock handling pens), closing several artificial water points and restocking with wildlife species (Davis et al. 2010). The TKR has undergone continual expansion in the last 20 years and the current size of the reserve exceeds 110 000 ha. Currently, 75 mammal species are present, most of which are grazing herbivores (e.g. gemsbok [Oryx gazelle], springbok [Antidorcas marsupialis] and blue wildebeest [Connochaetes taurinus]), with a lower number of browser species (e.g. greater kudu [Tragelaphus strepsiceros], giraffe [Giraffa camelopardalis] and black rhinoceros [Diceros bicornis]), omnivores and predators. The reserve is divided into three fenced areas, each with its own management plan (Figure 1). These are (1) the 'predator camp' in the north-east where lions [Panthera leo] are present, (2) the roan [Hippotragus equinus] and sable [Hippotragus niger] breeding camp in the north-west corner of the reserve, fenced off into ten sections and (3) the remainder of the reserve which supports the majority of the herbivores.
Data preprocessing
Vegetation types
To derive a vegetation map of the TKR, the cloud-free, geometrically corrected, multispectral Landsat 8 Operational Land Imager (OLI) data (captured on 02 April 2014, scene ID LC81740792014092LGN00), Band B2-B7 (blue, green, red, near infrared, SWIR1 and SWIR2) were used to perform supervised classification. The bands of images covered the entire reserve and were taken near the peak of the growth season in an above-average rainfall year. The obtained image was converted from a digital number to a top of atmosphere radiance and then corrected for the sun's angle during preprocessing before the analysis, using Geosud Toa Reflectance plugin (ver 1.0) in QGIS (ver 2.10 pisa, QGIS Development Team).
Preprocessed Landsat OLI data were used for the supervised classification with a random forest algorithm. A comprehensive set of photographs taken in May 2015 of the main vegetation units in the TKR was used to produce a training data set. This was augmented by high-resolution satellite images from Google Earth (ver 7.1.5.1557, Google Inc.) in combination with vegetation classes of the national vegetation map produced by Mucina and Rutherford (2006). Based on this approach, a total of 53 sampling areas were generated and 200 pixels were randomly selected per vegetation class. The 200 pixels were then split into 100 training pixels and 100 validation pixels. Subsequently, a supervised classification was performed using the random forest algorithm package 'rasclass' (ver 0.2.2) in R (ver 3.1.0, R Core Team 2013). The routines of post-processing were performed using QGIS (ver 2.10) and included filtering isolated pixels or noise. Accuracy was assessed by comparing the validation pixels against those in the produced map. The final product comprising a Landsat-based vegetation map was amalgamated into a single image and used in further analyses.
Vegetation productivity
Satellite images, which encompassed the reserve for the period February 2000 to November 2015, were obtained. The EVI product at 250 m resolution derived from the Moderate Resolution Imaging Spectroradiometer (MODIS, MOD13Q1 ver 005) was used as a proxy for plant productivity. This approach has been used previously for the monitoring of plant productivity in the Kalahari (Colditz et al. 2007; Hüttich et al. 2009). The MODIS EVI product has several advantages such as a reduction in atmospheric noise and a reduction in the variation in canopy background signals (Huete et al. 2002), as well as a decoupling of the influence of the variation in soil brightness (Solano et al. 2010).
The seasonality parameters of the EVI were extracted from time-series data using the software package TIMESAT (Jönsson & Eklundh 2004). This package can quantify noise-corrupted remote sensing time-series data by filtering each pixel for noise and identifying (1) phenological measurements such as the beginning and end of the plant growth season and (2) plant productivity, represented by the Small Integrated Value of EVI (SIV of EVI) (Jönsson & Eklundh 2004; Wessels et al. 2011). The adaptive Savitzky-Golay filter, with a window width of four data points, was applied to smooth the data. The season per year was set at one because vegetation in the Kalahari has one growth season per year. The start and end of the growth seasons were defined as a 20% increase in the seasonal amplitude, measured from the left and right minimum levels to the maximum of the seasonal curve. These values were determined not only by visually inspecting the fitted curve on the TIMESAT graphical user interface but also by referring to an earlier study from the region (Wessels et al. 2011). To illustrate spatio-temporal patterns of vegetation productivity, the SIV of EVI, quantified by TIMESAT, was mapped onto each growth season. The SIV of EVI provides a good estimate of the production of the seasonally dominant vegetation type (Fensholt et al. 2013; Jönsson & Eklundh 2004) for each pixel. Additionally, smoothed time-series data of EVI were extracted to understand the temporal variation in plant productivity.
Rainfall
Daily rainfall data collected from 30 rain gauges located within the TKR for the period 2001-2014 were used in the analysis. In addition, monthly rainfall records from five neighbouring rainfall stations (Van Zylsrus, Kathu, Severn, Wildebeesduin and Upington) were obtained from the South African Weather Service (2015).
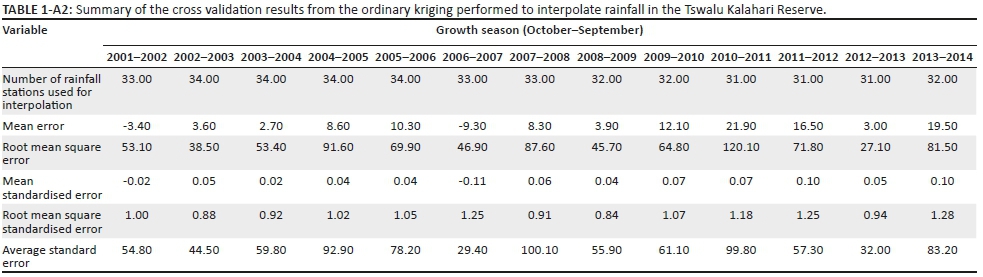
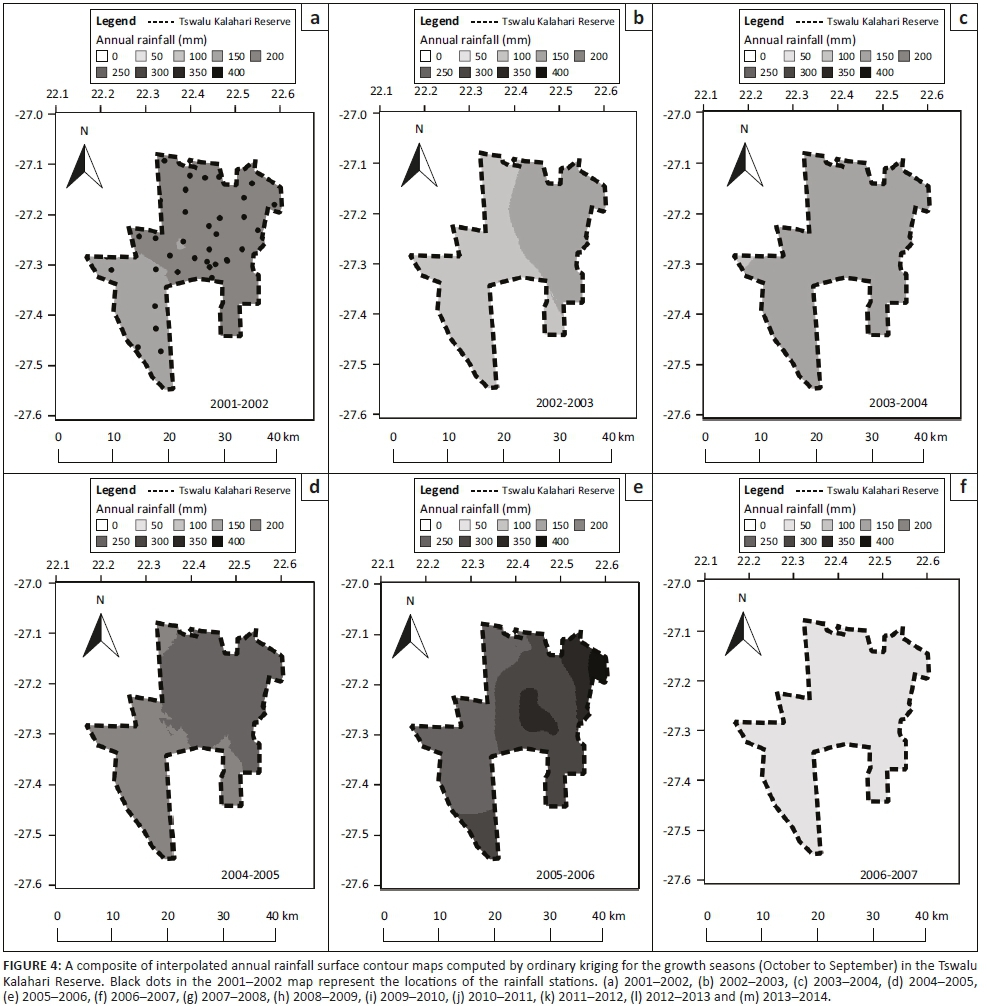
A spatially continuous rainfall surface was generated by interpolating the rainfall records from the 35 stations distributed throughout and around the TKR. Firstly, the original data from rain gauges and weather stations were formatted by removing incomplete and suspect records. Next, total rainfall for the growth season, which starts at the beginning of October and ends at the end of September in the Savanna Biome of South Africa (Wessels et al. 2011), was calculated as the annual rainfall for each rainfall station.
To produce annual rainfall surfaces, ordinary kriging was performed because it is commonly used and appears to be preferable (Goovaerts 2000; Ly, Charles & Degré 2013). A spherical model was selected to fit a semi-variogram, while other parameters were set at default values. The annual rainfall surfaces were produced using the Geostatistical Analyst tool in ArcMap (ver 10.0, ESRI) for the 2001-2002 to 2013-2014 growth seasons at 250 m spatial resolution, which matched precisely to the MODIS raster image.
Herbivores
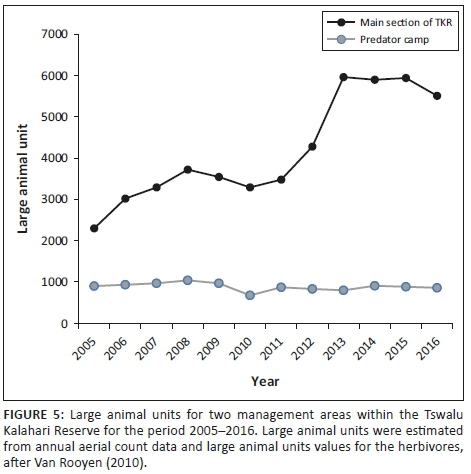
Changes in herbivore pressure were estimated using large animal units (LAUs), which is a standard metric for calculating commercial stocking densities (Van Rooyen 2010). The LAUs were determined from annual aerial count data provided by the TKR for the period 2005-2016 for the predator camp and the remainder of the TKR (excluding the roan and sable breeding camp).
Fire
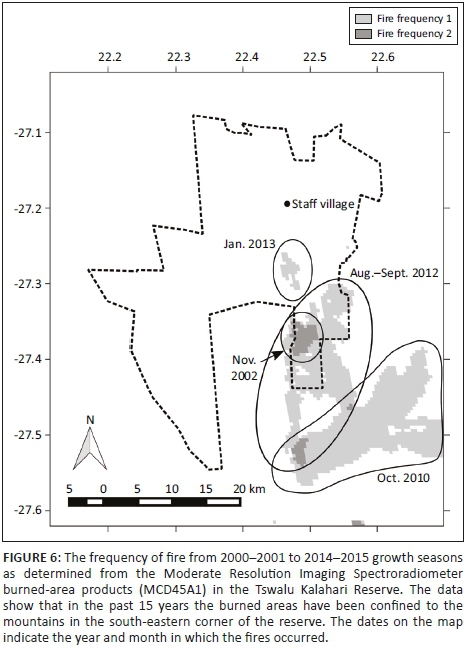
The MODIS burned-area product (MCD45A1), which denotes monthly fire occurrence at 500 m resolution, was used to examine the effect of fire on plant productivity in the TKR. These data, from the beginning of the 2000-2001 growth season to the end of the 2014-2015 growth season, were downloaded. All the satellite data were obtained for the TKR from the National Aeronautics and Space Administration's Earth Observing System clearing house, Reverb (http://reverb.echo.nasa.gov/reverb/).
Data analysis
Relationship between vegetation productivity and potential drivers
The influence of the potential drivers (rainfall and herbivores) on vegetation productivity in the different vegetation types was analysed as a response variable in a linear mixed-effects model using the SIV of EVI as the explanatory variable. The interpolated annual rainfall surface and LAUs were used for this analysis to represent the effects of rainfall and herbivores. Vegetation types were assigned by upscaling the 30 m resolution Landsat-based vegetation map to a 250 m grid, which matched precisely to the MODIS data. Fire was not included in this model because of a limited number of fire occurrences and its contrasting effect on the SIV of EVI. As a result of the data availability, only the data between 2005-2006 and 2013-2014 in the predator camp and the remainder of the TKR (excluding the roan and sable breeding camp) were pooled into one data set. However, to avoid potential disproportional bias, the data from the 2006-2007 growth season were excluded as the TKR experienced a severe drought with little rainfall over this period. The growth season and id of pixels were added as random terms to account for pseudoreplication. Statistical analyses were done using the lmer function in 'lme4' and 'lmeTest' package in R (ver 3.1.0, R Core Team 2013). The effect of fire was visually assessed by comparing maps of the SIV of EVI and fire occurrence.
Degradation trend analysis (residual trend analysis)
Residual trend (RESTREND) was used to analyse each growth season using each growth season (October-September) as a time step for the duration of 13 growth seasons (2001-2002 to 2014-2015). RESTREND removes the effect of rainfall from the long-term trend in productivity, and in so doing is able to highlight areas where land degradation has occurred (Wessels et al. 2007). This analysis followed the method proposed by Wessels et al. (2007), except that rainfall was not log transformed because plant productivity was unlikely to level off in the water-limited environment of the Kalahari. Firstly, the regression analysis of the SIV of EVI (response variable) and annual rainfall (explanatory variable) was performed for each pixel; then the coefficient of determination (R2) and p-values were mapped. Following this, trends in the residuals, expressed as the difference between observed EVI and predicted EVI by rainfall, were regressed through the growth seasons (Wessels et al. 2007, 2012). The long-term trend represented by the slope of the linear regression of the trends in the residuals was mapped to determine the distribution pattern of degraded areas, defined as areas experiencing the degeneration of structure or function. Both regression analyses were performed per pixel, using a linear model function 'lm' in R (ver 3.1.0, R Core Team 2013). Data from the 2006-2007 growth season (October-September), when the TKR experienced a severe drought, were excluded from this analysis to avoid a potential disproportional bias affecting the underlying regression model.
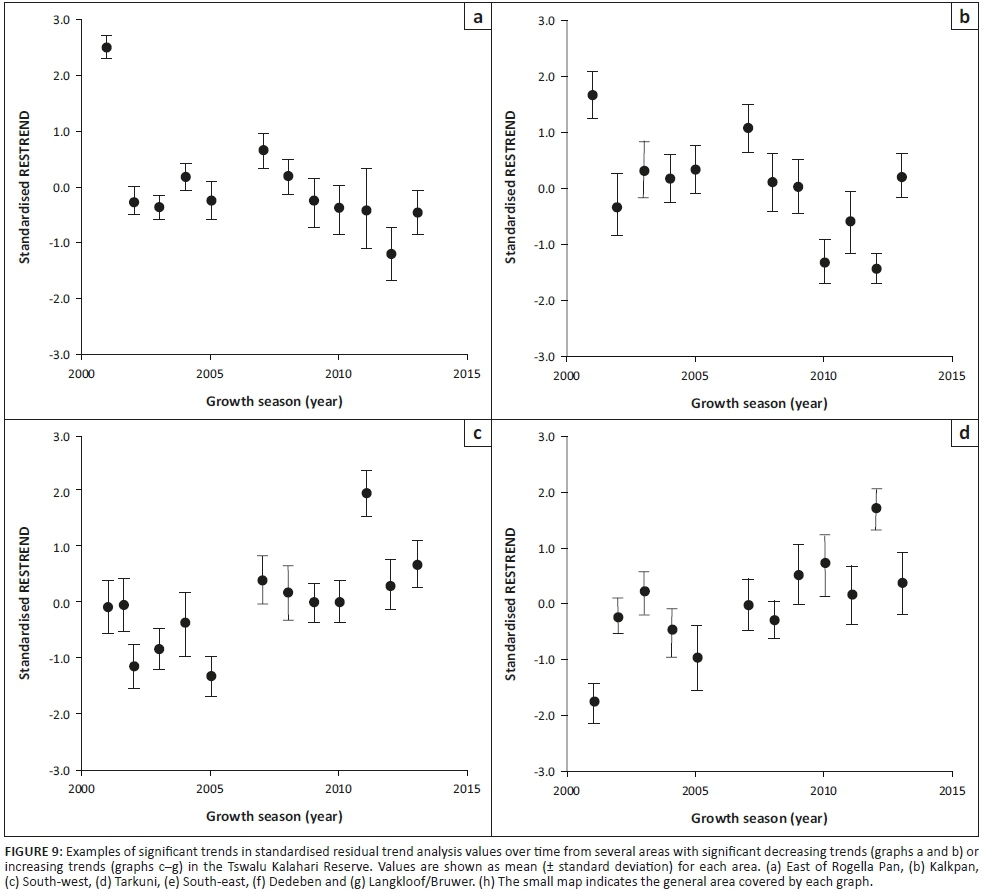
To further assess the progress of degradation, standardised RESTREND values were computed over time in several areas in the TKR where significant decreasing or increasing trends were detected.
Results
Vegetation types
Five vegetation types were classified for the TKR, with the Landsat-based map producing greater spatial detail than that achieved by Mucina and Rutherford (2006) (Figure 1). Field observations found a general correspondence between topography, plant community structure and the Landsat-based vegetation types. For example, vegetation classified as Koranna-Langeberg Mountain Bushveld vegetation was composed predominantly of a mixture of trees and shrubs, Gordonia Duneveld was dominated by grasses, Gordonia Plains Shrubveld by dwarf shrubs and Olifantshoek Plains Thornveld by short (i.e. < 3 m high) woody shrubs such as Senegalia mellifera. In the Landsat-based vegetation map, there were a few exceptions such as around old artificial water points, which were often misclassified as Gordonia Plains Shrubland. Certain parts in the west of the TKR were also incorrectly designated as being part of the Koranna-Langeberg Mountain Bushveld. Boundaries of the Landsat-based vegetation types were also sometimes misclassified as a result of a similarity in vegetation structure and a mixture of species at the margins. This was particularly evident for Gordonia Duneveld and Gordonia Plains Shrubveld, and Kathu Bushveld and Olifantshoek Plains Thornveld, respectively. Notwithstanding the above discrepancies, overall classification accuracy was 86.2%, while the Kappa statistic was 0.83 (see Appendix 1).
Spatio-temporal patterns and variability of vegetation productivity
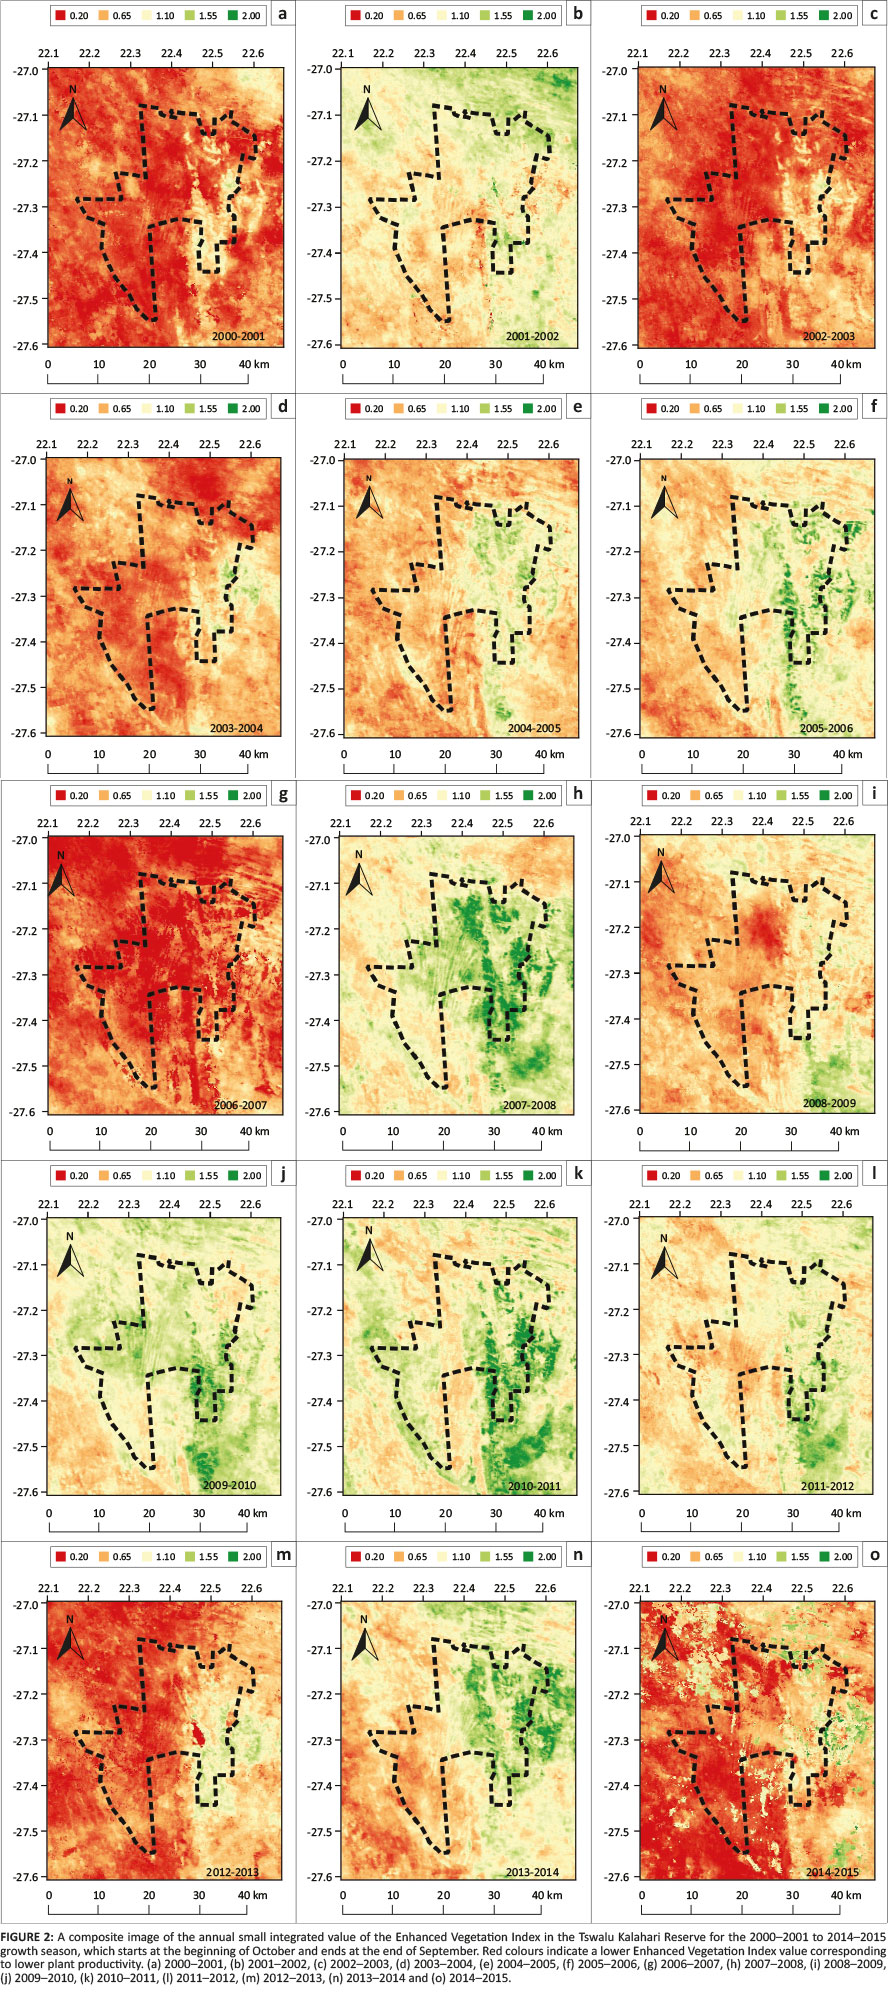
The overall geographical trend of the mean of the SIV of EVI was lower in the west and higher in the east, often delineated by the north-south axis of the Korannaberg Mountains (Figure 2). Differences in the spatial patterning of EVI values were assumed to relate to differences in physical vegetation attributes such as dominant growth forms, species composition and soil types. Extremely low EVI values corresponded to bare dune crests in the west and provincial roads in the east of the TKR, whereas abrupt changes in the SIV of EVI were observed at vegetation type boundaries (Figure 2).
The time-series analysis of EVI values demonstrated a seasonal cycle in plant productivity, with higher values in the summer and lower values in the winter. On average, the beginning of the growth season started in the period from December to January and ended in August to September (Figure 3). The time-series of EVI for the past 16 years for the TKR illustrated high inter-annual variability in plant productivity (Figures 2 and 3). Low EVI values were evident especially towards the east of the TKR, during the 2002-2003, 2003-2004, 2006-2007 and 2012-2013 growth seasons, which corresponded to periods of low annual rainfall (Figure 4). In the 2006-2007 growth season, when the annual rainfall was lowest for the study period, TIMESAT failed to quantify the productivity metrics for some pixels because of a low and indistinct peak in EVI values.

Relationship between vegetation productivity and potential drivers
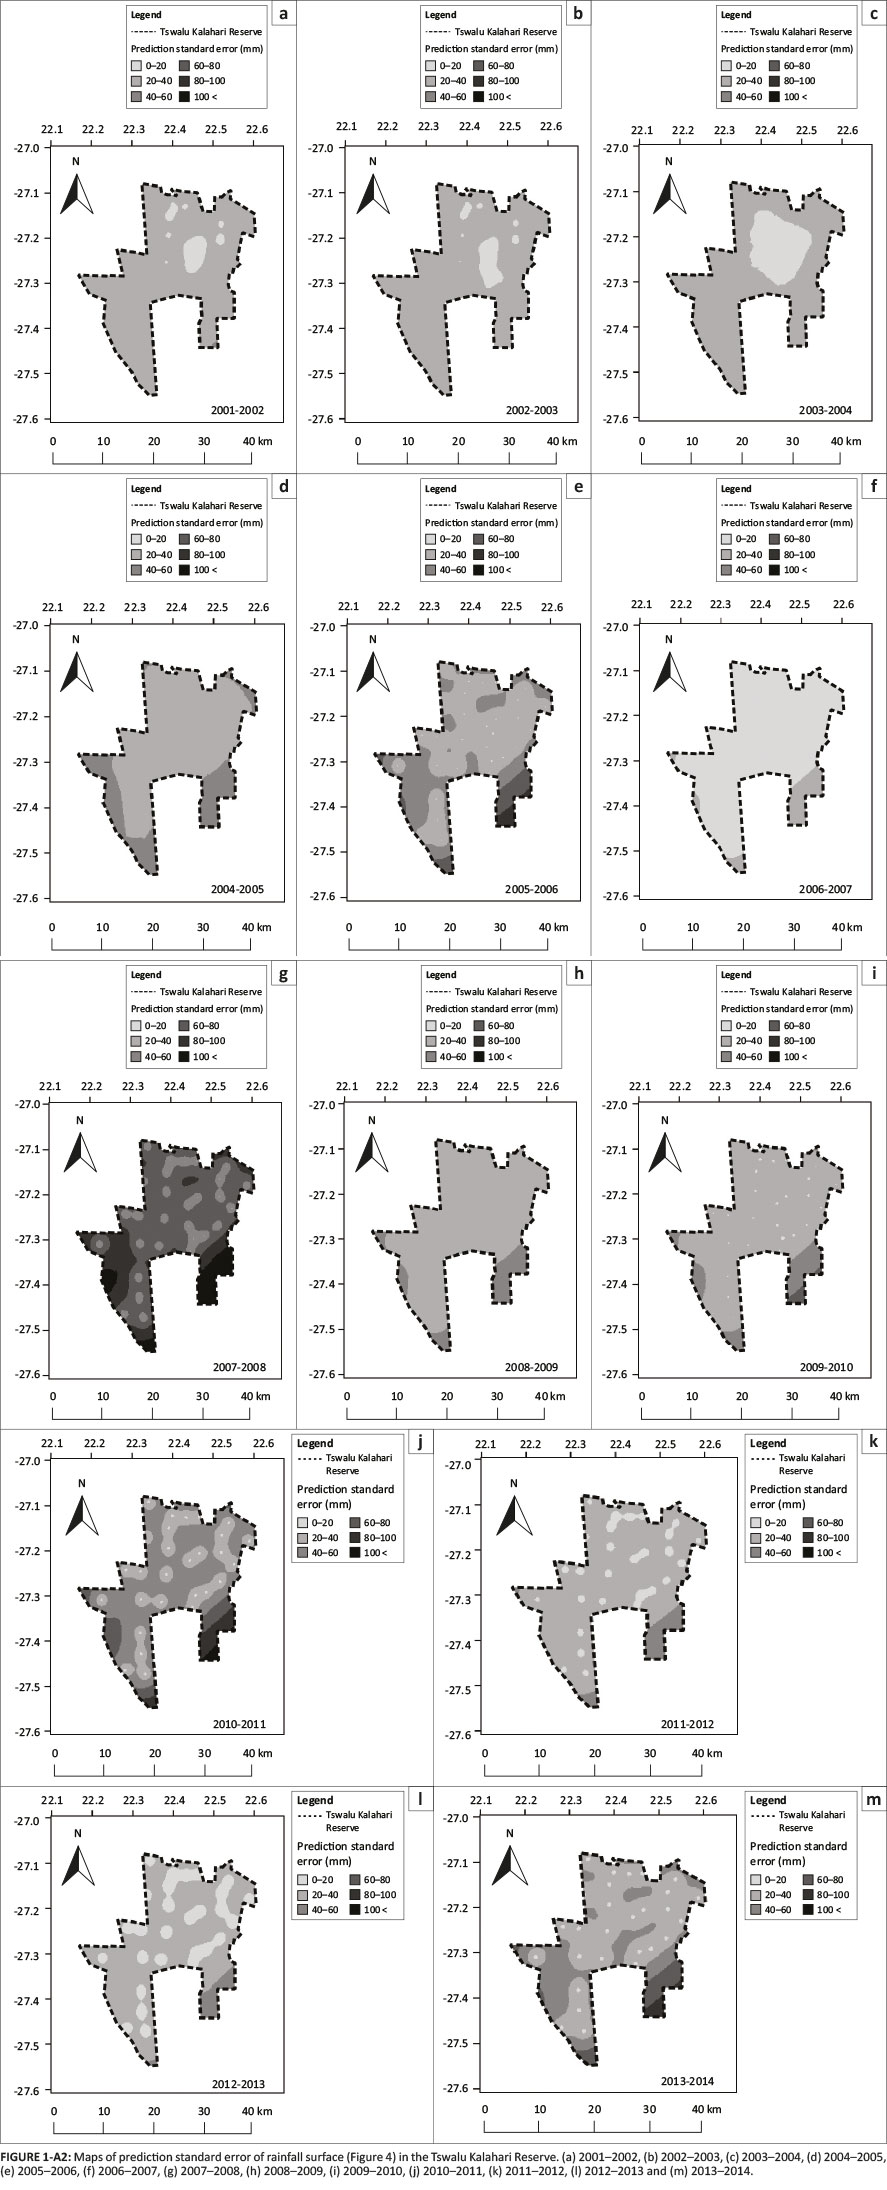
Rainfall has been highly variable over time and space in the TKR over the past 15 years. However, a general spatial gradient was observed, with mean annual rainfall being higher in the east and lower in the west (Figure 4). As a result of the orographic effects of altitude, the Korannaberg Mountains probably receive higher rainfall than other areas in the TKR, although we could not confirm this because of a lack of rain gauges on the slopes and peaks of these mountains. Standard error of the rainfall surface within most of the areas in the TKR was less than 60 mm. The values varied depending on the growth season and location, and higher standard errors were estimated in the south-eastern corner of the reserve where the rainfall stations were relatively scarce (see Appendix 2).
In general, the number of herbivores within the main section of the TKR increased between 2005 and 2013 and thereafter remained relatively stable, although there was a slight decline in 2016 (Figure 5). The recorded decline between 2008 and 2010 was because of the capture and removal of extra-limital species by management and an unexplained decline in springbok numbers over this period. Herbivore numbers within the predator camp have remained stable throughout the recorded period.
Three fire events affecting the reserve were evident from the MODIS burned-area product data. However, these fires were restricted to the Korannaberg Mountains in the south-eastern corner of the reserve, and most of the reserve had not burned during the study period (Figure 6). The impact of these fires on plant productivity was captured by the SIV of EVI, although the response was case specific. For example, the area south of the staff village, which was exposed to fire in January 2013, had a very low SIV of EVI value in 2012-2013, while the area that was burned in August to September 2012 had an even more muted response (Figure 2). Conversely, the area that burned outside the TKR in 2010 showed an increase in the SIV of EVI in the same season.
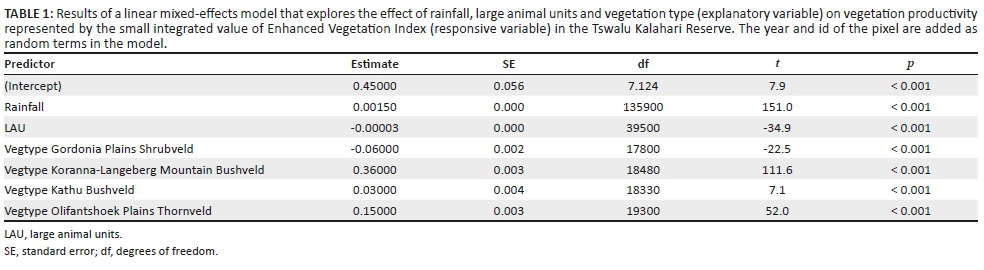
Results of the analysis using a linear mixed-effects model indicated that there is a significant positive effect of rainfall on the SIV of EVI (p < 0.001) (Table 1). The model also suggested different levels of effects from vegetation types (p < 0.001) and a relatively minor but significantly negative influence of LAUs (p < 0.001).
Degradation trend analysis (residual trend analysis)
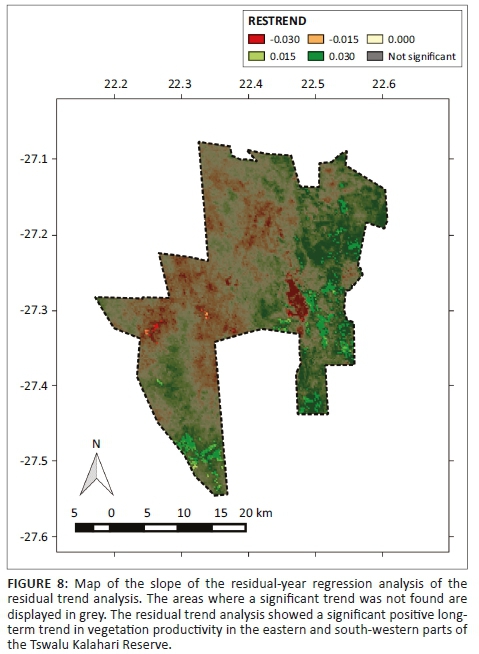
Regression analysis between the SIV of EVI and annual rainfall indicated a significant positive correlation for most of the TKR (p < 0.05), except in the roan and sable breeding camp, as well as for parts of the Kathu Bushveld and Olifantshoek Plains Thornveld vegetation types (Figure 7). The trend in plant productivity computed by the RESTREND detected a significant positive trend in plant productivity in the east and south-west of the TKR, while a negative trend was detected in some locations in the centre and west of the reserve (Figure 8). The standardised RESTREND values from these areas demonstrated a relatively consistent and directional change over time (Figure 9). This suggested that the observed change was initiated before the 2000-2001 growth season and that the driver of change has remained the same. Most of the area that showed an increasing trend overlapped with shrub-dominated vegetation, especially the Olifantshoek Plains Thornveld in the east and Gordonia Plains Shrubveld in the south-west. Conversely, declines in productivity were observed for small areas of Gordonia Plains Shrubveld in the central and western area.

Discussion
Spatio-temporal patterns and variability of vegetation productivity
Variations in EVI values illustrated the spatio-temporal patterns of vegetation productivity through variable changes in vegetation cover. These included significant increases in annual grass cover in the wet season or conversely, dieback in the dry season (Van Rooyen et al. 1984). The EVI values typically increased with plant greening in late spring and summer, decreased in the late autumn and then remained low during the dry winter months. This cycle matched the findings of previous remote sensing studies in the Kalahari (Hüttich et al. 2009; Jolly & Running 2004; Mishra et al. 2015a; Wessels et al. 2011), as well as field observations (Sekhwela & Yates 2007), and confirmed the utility of EVI as a proxy for seasonal vegetation productivity cycles in this semi-arid region. It also highlighted the potential utility of this approach to aid wide-scale and real-time decision-making in terms of, for example, the determination of optimal stocking rates at a specific time, given the spatial assessment of rainfall in the preceding season.
Relationship between vegetation productivity and potential drivers
Not surprisingly, rainfall was found to be the most important factor in determining the spatial success or failure of inter- and intra-seasonal, as well as inter-annual, productivity (Masunga, Moe & Pelekekae 2013; Van Rooyen et al. 1990; Van Rooyen & Van Rooyen 1998). The effect of other factors such as herbivory was secondary to the influence of rainfall.
Different vegetation types had significantly different EVI phenological profiles, which suggests that plant structural and functional traits have an important influence on plant productivity. For example, woody plants, which increase in abundance from west to east in the TKR, generally demonstrated higher and more persistent greenness (Mishra et al. 2015a, 2015b) compared to the grass and low shrub-dominated vegetation of Gordonia Duneveld and Gordonia Plains Shrubveld. This increased productivity is mediated to a large degree by increasing rainfall and deeper rooting depths typically found in vegetation associated with Koranna-Langeberg Mountain Bushveld, Olifantshoek Plains Thornveld and Kathu Bushveld. The ubiquity of thorny species and the density of the vegetation also contributed to a reduction in browser pressure and therefore the persistence of greenness recorded in these vegetation types.
Notwithstanding the overwhelming influence of rainfall, the results suggested that herbivores negatively influence vegetation productivity. A decoupling between growth season rainfall and plant productivity was apparent, especially within the ten roan and sable breeding camps, which cover an area of 1250 ha in the north-western corner of the TKR. This area has a different management strategy to the rest of the reserve. It is characterised by high densities of economically valuable grazing herbivores and the provision of supplemental feed and water. The patterns observed within these camps point to a possible threshold stocking rate beyond which herbivory and associated impacts such as trampling and very low vegetation cover in general (which were clearly observable in the field) weakened the correlation between rainfall and EVI, and resulted in herbivore-driven degradation.
Fire has only occurred in limited areas and times in the TKR, and its effect on vegetation productivity has been localised. The observed response of fire in EVI was case specific. The SIV of EVI has decreased nearly to zero after the fire in the TKR in the 2012-2013 growth season, while the increase in the SIV of EVI, as seen in the area burned outside the TKR in 2010, may have been caused by the post-fire recovery processes. From these observations, it is assumed that the intensity and date of the fire influence several key characteristics of plant productivity in the growth season immediately after the fire.
Degradation and management implications
Residual trends provided a useful analytical approach in the southern Kalahari where the strong influence of erratic rainfall on annual productivity tends to overwhelm the contribution of other factors. Results of the RESTREND analysis suggested that the thickening of woody species has occurred in the eastern and south-western parts of the TKR. Although the process of the thickening of woody species has not been monitored, the direction and slope of trends implies that this process has progressed constantly over the course of the study period. Interestingly, certain lowland areas located within the predator camp in the eastern part of the TKR showed a poor correlation between rainfall and EVI and might also have experienced a thickening of woody plants, as the poor correlation indicates potential effects on vegetation productivity from factors other than rainfall. We speculate that a combination of lower herbivore stocking rates in the predator camp as a result of the presence of lions allows other factors such as low fire frequency, the densification of thorny vegetation and possibly the effects of high atmospheric CO2 concentrations (which favour woody species) to promote more rapid woody thickening in these areas (O'Connor et al. 2014). These factors act together to establish a positive feedback loop, which promotes further densification of woody species with a concomitant decrease in more flammable grass cover and the eventual 'switching off' of fire as a means of 'resetting' the system.
Earlier studies have noted that the thickening of woody species can have multiple possible drivers (see O'Connor et al. [2014] for an overview). Establishing the relative contribution of each of the potential drivers is often difficult because they interact and vary in space and time. However, irrespective of the cause for the shift from grass- to shrub-dominated vegetation, this change has important implications for several aspects of reserve management, including the ratio of grazers to browsers and associated stocking rates and the frequency of controlled burns. It is therefore likely that a more active management regime will be required in order to maintain the degree of openness in encroached landscapes and the associated ecology in terms of, for example, grazer-browser ratios, as well as the game-viewing experience available to visitors to the reserve.
In the drier west of the TKR, RESTREND identified a significant decreasing trend in vegetation productivity in some areas of Gordonia Plains Shrubveld and on dune slopes in Gordonia Duneveld. Standardised RESTREND values exhibited a continuously declining trend, which suggested that a persistent driver might be influencing this pattern. Because these areas have not been burned since 2000 and RESTREND analysis is able to exclude the effect of rainfall on vegetation productivity, the decline in productivity has likely been caused by the impact of herbivores. From our field observations, localised heavy grazing appears to have reduced vegetation cover in these areas, especially at sites close to artificial water points. Another possibility is that the difference in underlying soil types might influence the palatability and thus the grazing pressure from herbivores. However, validation or simulation of the data to test its robustness is recommended because RESTREND is statistically underpowered when shorter periods of time are analysed (e.g. less than 16 growth seasons) and is strongly influenced by the timing of degradation (Wessels et al. 2012). Nevertheless, it would be prudent for management to adopt a more conservative herbivore stocking rate or allow predator control of herbivore numbers in affected areas. This suggestion is underscored by unfavourable climate projections (Dai 2013; Engelbrecht et al. 2015; Shongwe et al. 2009), which are likely to negatively impact vegetation, and the known sensitivity of Kalahari rangelands to overgrazing (Jeltsch et al. 1997; Rutherford & Powrie 2010; Skarpe 1990; Van Rooyen 2000). These threats combine to pose a growing risk to natural resource managers in the southern Kalahari.
Given the current uncertainty in especially rainfall projections and inherent fine-scale spatial heterogeneity in vegetation, long-term field-based monitoring is also recommended in order to establish a more detailed understanding of the rate and magnitude of change within different vegetation types and across the rainfall gradient.
Conclusion
Variability in the spatial and temporal patterns of vegetation productivity, as well as long-term changes in this measure, were outlined for a large reserve in the southern Kalahari using MODIS EVI. The findings of this study confirmed known vegetation dynamics in the region, such as high spatial heterogeneity, seasonal change and extreme inter-annual variability of plant productivity shaped largely by erratic rainfall. Through RESTREND it was possible to isolate the effects of rainfall and provide evidence of potential overgrazing and the thickening of woody species in certain areas of the TKR. The thickening of woody species is likely to intensify and spread in future because of the effects of CO2 fertilisation, access by trees and shrubs to deeper and more consistent water supplies under more arid conditions and the establishment of feedback loops which could switch off grass-mediated fires. Additionally, degradation trends in the west hint at possibly high and unsustainable stocking rates, which, if left unchecked, may erode the carrying capacity in this area of the TKR and take many years to recover. These findings emphasise the need for a proactive and anticipatory management style, informed by an extensive climate, vegetation and animal monitoring programme. This combination is necessary in order to respond timeously and effectively to both current and future risks facing the southern Kalahari environment.
Acknowledgements
We thank Julian Smit, Christiaan J. Harmse, Claire Davis and Feroza Morris for their valuable technical advice and Bonginkosi Prince Ngomane, Armin du Plessis and Kelsey Green for fieldwork assistance. Konrad Wessels and Anthony R. Palmer provided comments to improve the manuscript. Parts of the rainfall record used in the analysis were provided by the South African Weather Service. We would also like to thank Dylan Smith and the Tswalu Kalahari Reserve for providing data, and Duncan MacFadyen and E Oppenheimer & Son for enabling this research.
Competing interests
The authors declare that they have no financial or personal relationships that may have inappropriately influenced them in writing this article.
Authors' contributions
W.T. and S.L.J. conducted the fieldwork. T.A. and M.T.H. conceptualised and designed the overall research. W.T. performed the data analysis and led the writing. All authors participated in the planning of the research, the interpretation of the findings and the critical revision of the manuscript.
References
Bond, W.J. & Midgley, G.F., 2012, 'Carbon dioxide and the uneasy interactions of trees and savannah grasses', Philosophical Transactions of the Royal Society B, 367(1588), 601-612. https://doi.org/10.1098/rstb.2011.0182 [ Links ]
Cahill, A.E., Aiello-Lammens, M.E., Fisher-Reid, M.C., Hua, X., Karanewsky, C.J., Ryu, H.Y. et al., 2012, 'How does climate change cause extinction?', Proceedings of the Royal Society B, 280(1750), 20121890. https://doi.org/10.1098/rspb.2012.1890 [ Links ]
Chen, I., Hill, J.K., Ohlemüller, R., Roy, D.B. & Thomas, C.D., 2011, 'Rapid range shifts of species associated with high levels of climate warming', Science 333(6045), 1024-1026. https://doi.org/10.1126/science.1206432 [ Links ]
Cloete, P.C., Taljaard, P.R. & Grové, B., 2007, 'A comparative economic case study of switching from cattle farming to game ranching in the Northern Cape province', South African Journal of Wildlife Research 37(1), 71-78. https://doi.org/10.3957/0379-4369-37.1.71 [ Links ]
Colditz, R.R., Gessner, U., Conrad, C., Van Zyl, D., Malherbe, J., Newby, T. et al., 2007, 'Dynamics of MODIS time series for ecological applications in southern Africa', Proceedings of the 2007 International Workshop on the Analysis of Multi-Temporal Remote Sensing Images, pp. 1-6, Leuven, Belgium, 18-20th July. https://doi.org/10.1109/MULTITEMP.2007.4293069 [ Links ]
Collins, S.L., Belnap, J., Grimm, N.B., Rudgers, J.A., Dahm, C.N., D'Odorico, P. et al., 2014, 'A multiscale, hierarchical model of pulse dynamics in arid-land ecosystems', Annual Review of Ecology, Evolution, and Systematics 45, 397-419. https://doi.org/10.1146/annurev-ecolsys-120213-091650 [ Links ]
Cunningham, S.J., Martin, R.O., Hojem, C.L. & Hockey, P.A.R., 2013, 'Temperatures in excess of critical thresholds threaten nestling growth and survival in a rapidly-warming arid savanna: A study of common fiscals', PLoS ONE 8(9), e74613. https://doi.org/10.1371/journal.pone.0074613 [ Links ]
Dai, A.G., 2013, 'Increasing drought under global warming in observations and models', Nature Climate Change 3, 52-58. https://doi.org/10.1038/nclimate1633 [ Links ]
Davis, A.L.V., Scholtz, C.H., Kryger, U., Deschodt, C.M. & Strümpher, W.P., 2010, 'Dung beetle assemblage structure in Tswalu Kalahari Reserve: Responses to a mosaic of landscape types, vegetation communities, and dung types', Environmental Entomology39(3), 811-820. https://doi.org/10.1603/EN09256 [ Links ]
Du Plessis, K.L., Martin, R.O., Hockey, P.A.R., Cunningham, S.J. & Ridley, A.R., 2012, 'The costs of keeping cool in a warming world: Implications of high temperatures for foraging, thermoregulation and body condition of an arid-zone bird', Global Change Biology 18, 3063-3070. https://doi.org/10.1111/j.1365-2486.2012.02778.x [ Links ]
Engelbrecht, F., Adegoke, J., Boape, M., Naidoo, M., Garland, R., Thatcher, M. et al., 2015, 'Projections of rapidly rising surface temperatures over Africa under low mitigation', Environmental Research Letters 10, 085004. https://doi.org/10.1088/1748-9326/10/8/085004 [ Links ]
Fensholt, R., Rasmussen, K., Kaspersen, P., Huber, S., Horion, S. & Swinnen, E., 2013, 'Assessing land degradation/recovery in the African Sahel from long-term Earth Observation based primary productivity and precipitation relationships', Remote Sensing5(2), 664-686. https://doi.org/10.3390/rs5020664 [ Links ]
Goovaerts, P., 2000, 'Geostatistical approaches for incorporating elevation into the spatial interpolation of rainfall', Journal of Hydrology 228(1-2), 113-129. https://doi.org/10.1016/S0022-1694(00)00144-X [ Links ]
Guo, Q., 2004, 'Slow recovery in desert perennial vegetation following prolonged human disturbance', Journal of Vegetation Science 15(6), 757-762. https://doi.org/10.1658/1100-9233(2004)015[0757:SRIDPV]2.0.CO;2 [ Links ]
Hickling, R., Roy, D.B., Hill, J.K., Fox, R. & Thomas, C.D., 2006, 'The distributions of a wide range of taxonomic groups are expanding polewards', Global Change Biology 12, 450-455. https://doi.org/10.1111/j.1365-2486.2006.01116.x [ Links ]
Huete, A.R., Didan, K., Miura, T., Rodriguez, E.P., Gao, X. & Ferreira, L.G., 2002, 'Overview of the radiometric and biophysical performance of the MODIS vegetation indices', Remote Sensing of Environment 83, 195-213. https://doi.org/10.1016/S0034-4257(02)00096-2 [ Links ]
Hüttich, C., Gessner, U., Herold, M., Strohbach, B.J., Schmidt, M., Keil, M. et al., 2009, 'On the suitability of MODIS time series metrics to map vegetation types in dry savanna ecosystems: A case study in the Kalahari of NE Namibia', Remote Sensing 1(4), 620-643. https://doi.org/10.3390/rs1040620 [ Links ]
Jeltsch, F., Milton, S.J., Dean, W.R.J. & Van Rooyen, N., 1997, 'Simulated pattern formation around artificial waterholes in the semi-arid Kalahari', Journal of Vegetation Science 8, 177-188. https://doi.org/188.10.2307/3237346 [ Links ]
Jolly, W.M. & Running, S.W., 2004, 'Effects of precipitation and soil water potential on drought deciduous phenology in the Kalahari', Global Change Biology 10, 303-308. https://doi.org/10.1046/j.1365-2486.2003.00701.x [ Links ]
Jönsson, P. & Eklundh, L., 2004, 'TIMESAT - A program for analyzing time-series of satellite sensor data', Computers and Geosciences 30(8), 833-845. https://doi.org/10.1016/j.cageo.2004.05.006 [ Links ]
Kong, T.M., Marsh, S.E., Van Rooyen, A.F., Kellner, K. & Orr, B.J., 2015, 'Assessing rangeland condition in the Kalahari Duneveld through local ecological knowledge of livestock farmers and remotely sensed data', Journal of Arid Environments, 113, 77-86. https://doi.org/10.1016/j.jaridenv.2014.10.003 [ Links ]
Kruger, A.C. & Sekele, S.S., 2013, 'Trends in extreme temperature indices in South Africa: 1962-2009', International Journal of Climatology 33(3), 661-676. https://doi.org/10.1002/joc.3455 [ Links ]
Lindenmayer, D.B., Likens, G.E., Andersen, A., Bowman, D., Bull, C.M., Burns, E. et al., 2012, 'Value of long-term ecological studies', Austral Ecology 37(7), 745-757. https://doi.org/10.1111/j.1442-9993.2011.02351.x [ Links ]
Ly, S., Charles, C. & Degré, A., 2013, 'Different methods for spatial interpolation of rainfall data for operational hydrology and hydrological modeling at watershed scale: A review', Biotechnology, Agronomy, Society and Environment 17(2), 392-406, viewed 21 December 2015, from http://hdl.handle.net/2268/136084 [ Links ]
Masunga, G.S., Moe, S.R. & Pelekekae, B., 2013, 'Fire and grazing change herbaceous species composition and reduce beta diversity in the Kalahari sand system', Ecosystems16(2), 252-268. https://doi.org/10.1007/s10021-012-9611-6 [ Links ]
Mishra, N.B., Crews, K.A., Miller, J.A. & Meyer, T., 2015a, 'Mapping vegetation morphology types in southern Africa savanna using MODIS time-series metrics: A case study of central Kalahari, Botswana', Land 4(1), 197-215. https://doi.org/10.3390/land4010197 [ Links ]
Mishra, N.B., Crews, K.A., Neeti, N., Meyer, T. & Young, K.R., 2015b, 'MODIS derived vegetation greenness trends in African savanna: Deconstructing and localizing the role of changing moisture availability, fire regime and anthropogenic impact', Remote Sensing of Environment 169, 192-204. https://doi.org/10.1016/j.rse.2015.08.008 [ Links ]
Mucina, L. & Rutherford, M.C., 2006, The vegetation of South Africa, Lesotho and Swaziland, South African National Biodiversity Institute, Pretoria. [ Links ]
Nagendra, H., Lucas, R., Honrado, J.P., Jongman, R.H.G., Tarantino, C., Adamo, M. et al., 2013, 'Remote sensing for conservation monitoring: Assessing protected areas, habitat extent, habitat condition, species diversity, and threats', Ecological Indicators33, 45-59. https://doi.org/10.1016/j.ecolind.2012.09.014 [ Links ]
O'Connor, T.G., Puttick, J.R. & Hoffman, M.T., 2014, 'Bush encroachment in southern Africa: Changes and causes', African Journal of Range and Forage Science 31(2), 67-88. https://doi.org/10.2989/10220119.2014.939996 [ Links ]
Palmer, A.R. & Van Rooyen, A.F., 1998, 'Detecting vegetation change in the southern Kalahari using Landsat TM data', Journal of Arid Environments 39(2), 143-153. https://doi.org/10.1006/jare.1998.0399 [ Links ]
Rahlao, S.J., Hoffman, M.T., Todd, S.W. & McGrath, K., 2008, 'Long-term vegetation change in the Succulent Karoo, South Africa following 67 years of rest from grazing', Journal of Arid Environments 72(5), 808-819. https://doi.org/10.1016/j.jaridenv.2007.08.003 [ Links ]
R Core Team, 2013, R: A language and environment for statistical computing, R Foundation for Statistical Computing, Vienna. [ Links ]
Reynolds, J.F., Kemp, P.K., Ogle, K. & Fernández, R.J., 2004, 'Modifying the "pulse-reserve" paradigm for deserts of North America: Precipitation pulses, soil water, and plant responses', Oecologia 141(2), 194-210. https://doi.org/10.1007/S00442-004-1524-4 [ Links ]
Rutherford, M.C. & Powrie, L.W., 2010, 'Severely degraded dunes of the southern Kalahari: Local extinction, persistence and natural re-establishment of plants', African Journal of Ecology 48(4), 930-938. https://doi.org/10.1111/j.1365-2028.2009.01194.x [ Links ]
Sekhwela, M.B.M. & Yates, D.J., 2007, 'A phenological study of dominant acacia tree species in areas with different rainfall regimes in the Kalahari of Botswana', Journal of Arid Environments 70(1), 1-17. https://doi.org/10.1016/j.jaridenv.2006.12.006 [ Links ]
Shongwe, M.E., Van Oldenborgh, G.J., Van den Hurk, B.J.J.M., De Boer, B., Coelho, C.A.S. & Van Aalst, M.K., 2009, 'Projected changes in mean and extreme precipitation in Africa under global warming. Part I: Southern Africa', Journal of Climate 22(13), 3819-3837. https://doi.org/10.1175/2009JCLI2317.1 [ Links ]
Skarpe, C., 1990, 'Shrub layer dynamics under different herbivore densities in an arid savanna, Botswana', Journal of Applied Ecology 27(3), 873-885. https://doi.org/10.2307/2404383 [ Links ]
Solano, R., Didan, K., Jacobson, A. & Huete, A., 2010, MODIS Vegetation Index user's guide (MOD13 Series), viewed 09 November 2015, from http://vip.arizona.edu/documents/MODIS/MODIS_VI_UsersGuide_01_2012 [ Links ]
South African Weather Service, 2015, Monthly rainfall data (1990-2015), Pretoria. [ Links ]
Thomas, D.S.G. & Paul, A.S., 1991, The Kalahari environment, Cambridge University Press, Cambridge. [ Links ]
Van Rooyen, A.F., 2000, 'Rangeland degradation in the southern Kalahari', PhD thesis, Department of Range and Forage Science, University of Natal, Pietersmaritzburg. [ Links ]
Van Rooyen, N., 2010, 'Veld management in the African savannas under current climatic conditions: Ecological and economic wildlife stocking rates', in J. du P. Bothma & J.G. du Toit (eds.), Game ranch management, 5th edn., pp. 801-815, Van Schaik Publishers, Pretoria. [ Links ]
Van Rooyen, N., Bezuidenhout, D., Theron, G.K. & Bothma, J.d.P., 1990, 'Monitoring of the vegetation around artificial watering points (windmills) in the Kalahari Gemsbok National Park', Koedoe 33(1), 63-88. https://doi.org/10.1006/jare.1994.1037 [ Links ]
Van Rooyen, N., Van Rensburg, D.J., Theron, G.K. & Bothma, J.d.P., 1984, 'A preliminary report on the dynamics of the vegetation of the Kalahari Gemsbok National Park', Koedoe (Supplement), 83-102. https://doi.org/10.4102/koedoe.v27i2.570 [ Links ]
Van Rooyen, N. & Van Rooyen, M.W., 1998, 'Vegetation of the south-western arid Kalahari: An overview', Transactions of the Royal Society of South Africa 53(2), 113-140. https://doi.org/10.1080/00359199809520381 [ Links ]
Weltzin, J.F., Loik, M.E., Schwinning, S., Williams, D.G., Fay, P.A., Haddad, B.M. et al., 2003, 'Assessing the response of terrestrial ecosystems to potential changes in precipitation', BioScience 53(10), 941-952. https://doi.org/10.1641/0006-3568(2003)053[0941:ATROTE]2.0.CO;2 [ Links ]
Wessels, K.J., Prince, S.D., Malherbe, J., Small, J., Frost, P.E. & Van Zyl, D., 2007, 'Can human-induced land degradation be distinguished from the effects of rainfall variability? A case study in South Africa', Journal of Arid Environments 68(2), 271-297. https://doi.org/10.1016/j.jaridenv.2006.05.015 [ Links ]
Wessels, K.J., Steenkamp, K., Von Maltitz, G. & Archibald, S., 2011, 'Remotely sensed vegetation phenology for describing and predicting the biomes of South Africa', Applied Vegetation Science 14(1), 49-66. https://doi.org/10.1111/j.1654-109X.2010.01100.x [ Links ]
Wessels, K.J., Van den Bergh, F. & Scholes, R.J., 2012, 'Limits to detectability of land degradation by trend analysis of vegetation index data', Remote Sensing of Environment125, 10-22. https://doi.org/10.1016/j.rse.2012.06.022 [ Links ]
 Correspondence:
Wataru Tokura
turaturawako@hotmail.co.jp
Received: 03 May 2017
Accepted: 20 May 2018
Published: 31 July 2018
Note: This article is partly based on the thesis by Wataru Tokura, 'Understanding changes in plant productivity using EVI satellite data in Tswalu Kalahari Reserve', available at https://open.uct.ac.za/handle/11427/20933


