


Serviços Personalizados
Artigo
 Inglês (pdf)
 Artigo em XML
 Referências do artigo
Indicadores

Links relacionados
-
 Citado por Google
 -
 Similares em Google
Compartilhar

 Permalink
Koedoe
versão On-line ISSN 2071-0771
versão impressa ISSN 0075-6458
Koedoe vol.60 no.1 Pretoria 2018
http://dx.doi.org/10.4102/koedoe.v60i1.1449
The authors declare that they have no financial or personal relationships that may have inappropriately influenced them in writing this article.
Authors' contributions
N.S.Z. was the main data collector as part of an MSc research project. He contributed to data analysis, interpretations and preparation of the original manuscript. T.H.C.M. was the co-worker and supervisor and contributed to data collection, analysis, interpretations and preparation of the original manuscript and its revision. R.E.M. contributed to literature reviews and comparisons, data analysis, and the editing and preparation of the extensively revised manuscript.
References
Begg, G. & Carser, A., 1988, The wetlands of Natal (part 2). The distribution, extent and status of wetlands in the Mfolozi catchment, Natal Town and Regional Planning Commission, Pietermaritzburg. [ Links ]
Berlilner, D., 2005, Systematic conservation planning for the forest biome of South Africa, Water and Forestry Support Programme and the Department of Water Affairs and Forestry, Pretoria. [ Links ]
Bromberg-Gedan, K., Silliman, B.R. & Bertness, M.D., 2009, 'Centuries of human-driven change in salt marsh ecosystems', Annual Review of Marine Science 1, 117-141. https://doi.org/10.1146/annurev.marine.010908.163930 [ Links ]
Brown, L.R., Du Preez, P.J., Bezuidenhout, H., Bredenkamp, G.J., Mostert, T.H.C. & Collins, N.B., 2013, 'Guidelines for phytosociological classifications and descriptions of vegetation in southern Africa', Koedoe 55(1), Art. #1103, 1-10. https://doi.org/10.4102/koedoe.v55i1.1103 [ Links ]
Chytrý, M., Tichý, L., Holt, J. & Botta-Dukát, Z., 2002, 'Determination of diagnostic species with statistical fidelity measures', Journal of Vegetation Science 13, 79-90. https://doi.org/10.1111/j.1654-1103.2002.tb02025.x [ Links ]
Colloty, B.M., Adams, J.B. & Bate, G.C., 2002, 'Classification of estuaries in the Ciskei and Transkei regions based on physical and botanical characteristics', South African Journal of Botany 68, 312-321. https://doi.org/10.1016/S0254-6299(15)30392-6 [ Links ]
Donnelly, F.A. & Pammenter, N.W., 1983, 'Vegetation zonation on a Natal coastal sand-dune system in relation to salt spray and soil salinity', South African Journal of Botany2, 46-51. https://doi.org/10.1016/S0022-4618(16)30144-9 [ Links ]
Edwards, D., 1983, 'A broad-scale structural classification of vegetation for practical purposes', Bothalia 14, 705-712. https://doi.org/10.4102/abc.v14i3/4.1231 [ Links ]
EKZNW, 2009, Amatikulu Nature Reserve: Integrated Management Plan: 2009-2013, Version 1.0, Ezemvelo KZN Wildlife, Pietermaritzburg, p. 82, and 7 maps. [ Links ]
Fey, M.V., 2010, 'A short guide to the soils of South Africa, their distribution and correlation with World Reference Base soil groups', in 19th World Congress of Soil Science, Soil Solutions for a Changing World, Brisbane, 1st-6th August, pp. 32-35. [ Links ]
Gaugris, J.Y., Matthews, W.S., Van Rooyen, M.W. & Bothma, J.D.P., 2004, 'The vegetation of Tshanini Game Reserve and a comparison with equivalent units in the Tembe Elephant Park in Maputaland, South Africa', Koedoe 47(1), 9-29. https://doi.org/10.4102/koedoe.v47i1.67 [ Links ]
Google Earth 7.1.2.2041, 2016, uMlalazi Nature Reserve. 28°57′ 29.53″ S,31°46′ 09.75″ E, elevation 55 m, viewed 22 March 2016, from http://www.google.com/earth/index.html [ Links ]
Grainger, M.J., Van Aarde, R.J. & Wassenaar, T.D., 2011, 'Landscape composition influences the restoration of subtropical coastal dune forest', Restoration Ecology 19, 111-120. https://doi.org/10.1111/j.1526-100X.2009.00630.x [ Links ]
Hennekens, S.M. & Schaminée, J.H.J., 2001, 'TURBOVEG, a comprehensive data base management system for vegetation data', Journal of Vegetation Science 12, 589-591. https://doi.org/10.2307/3237010 [ Links ]
Lubke, R.A., 1997, 'Vegetation and flora of the Kosi Bay Coastal Forest Reserve in Maputaland, northern KwaZulu-Natal, South Africa', MSc thesis, University of Pretoria. [ Links ]
Lubke, R.A., Avis, A.M., Steinke, T.D. & Boucher, C., 1997, 'Coastal vegetation', in R.M. Cowling & S.M. Pierce (eds.), Vegetation of Southern Africa, pp. 300-321, Cambridge University Press, Cambridge. [ Links ]
MacDevette, D.R., MacDevette, D.K., Gordon, I.G. & Bartholomew, R.L.C., 1989, 'The floristics of the Natal indigenous forests', in I.G. Gordon (ed.), Natal indigenous forests. A preliminary collection of reports on indigenous forest in Natal, pp. 1-20, Natal Parks Board, Pietermaritzburg. [ Links ]
Matthews, W.S., Van Wyk, A.E. & Van Rooyen, N., 1999, 'Vegetation of the Sileza Nature Reserve and neighbouring areas, South Africa, and its importance in conserving the woody grasslands of the Maputaland Centre of Endemism', Bothalia 29(1), 151-167. https://doi.org/10.4102/abc.v29i1.586 [ Links ]
Matthews, W.S., Van Wyk, A.E., Van Rooyen, N. & Botha, G.A., 2001, 'Vegetation of the Tembe Elephant Park, Maputaland, South Africa', South African Journal of Botany 67, 573-594. [ Links ]
McCune, B. & Mefford, M.J., 1999, PC-ORD for Windows. Multivariate analysis of ecological data, version 4.10, MjM Software, Gleneden Beach, OR. [ Links ]
Moll, E.J., 1972, 'A preliminary account of the dune communities at Pennington Park, Mtunzini, Natal', Bothalia 10(4), 615-626. https://doi.org/10.4102/abc.v10i4.1571 [ Links ]
Moll, E.J. & Werger, M.J.A., 1978, 'Mangrove communities', in M.J.A. Werger & A.C. Van Bruggen (eds.), Biogeography and ecology of southern Africa, pp. 1231-1238, Dr W. Junk, The Hague. [ Links ]
Mucina, L. & Rutherford, M.C., 2006, The vegetation of South Africa, Lesotho and Swaziland, Strelitzia 19, South African Biodiversity Institute, Pretoria. [ Links ]
Neumann, F.H., Scott, L., Bousman C.B. & Van As, L., 2010, 'A Holocene sequence of vegetation change at Lake Eteza, coastal KwaZulu-Natal, South Africa', Review of Palaeobotany and Palynology 162, 39-53. https://doi.org/10.1016/j.revpalbo.2010.05.001 [ Links ]
Nevill, H. & Nevill, E.M., 1995, 'A survey of the Culicoides (Diptera: Ceratopogonidae) of the Umlalazi Nature Reserve in Zululand, South Africa, with notes on two species biting man', Onderstepoort Journal of Veterinary Research 62, 51-58. [ Links ]
South African Weather Service, 2017, viewed n.d., from http://www.weathersa.co.za/compliments-complaints/climate-data-requests [ Links ]
Steinke, T.D., 1995, 'A general review of the mangroves of South Africa', in G.I. Cowan (ed.), Wetlands of South Africa, pp. 53-74, Department of Environmental Affairs and Tourism, Pretoria. [ Links ]
Taylor, R.H., Adams, J.B. & Haldorsen, S., 2006, 'Primary habitats in St Lucia Estuarine System, South Africa, and their response to mouth management', African Journal of Aquatic Science 31, 31-41. https://doi.org/10.2989/16085910609503869 [ Links ]
Tichy, L., 2002, 'JUICE, software for vegetation classification', Journal of Vegetation Science 13, 451-453. https://doi.org/10.1658/1100-9233(2002)013 [ Links ]
Todd, C.B., 1994, 'A comparison of the reproductive strategies of key species of a prograding dune system in the Mlalazi Nature Reserve, Natal', MSc thesis, Rhodes University. [ Links ]
Tyson, P.D. & Preston-Whyte, R.A., 2000, The weather and climate of southern Africa, 2nd edn., Oxford University Press, Cape Town. [ Links ]
Van Wyk, A.E. & Smith, G.F., 2001, Regions of floristic endemism in Southern Africa, Umdaus Press, Pretoria. [ Links ]
Venter, H.J.T., 1972, 'Die plantekologie van Richardsbaai, Natal', DSc thesis, University of Pretoria. [ Links ]
Von Maltitz, G.P., Van Wyk, G.F. & Everard, D.A., 1996, 'Successional pathways in disturbed coastal dune forest on the coastal dunes in north-east KwaZulu-Natal, South Africa', South African Journal of Botany 62(4), 188-195. https://doi.org/10.1016/S0254-6299(15)30633-5 [ Links ]
Weisser, P.J., 1978a, 'Changes in area of grasslands on the dunes between Richards Bay and the Mfolozi River, 1937 to 1974', Proceedings of the Annual Congresses of the Grassland Society of Southern Africa 13(1), 95-97. https://doi.org/10.1080/00725560.1978.9648841 [ Links ]
Weisser, P.J., 1978b, 'Conservation priorities in the dune area between Richards Bay and Mfolozi mouth based on a vegetation survey', Natal Town and Regional Planning Report 38, 1-64. [ Links ]
Weisser, P.J., Garland, I.F. & Drews, B.K., 1982, 'Dune advancement 1937-1977 at the Mlalazi Nature Reserve, Mtunzini, Natal, South Africa, and a preliminary vegetation-succession chronology', Bothalia 14(1), 127-130. https://doi.org/10.4102/abc.v14i1.1152 [ Links ]
Weisser, P.J. & Muller, R., 1983, 'Dune vegetation dynamics from 1937 to 1976 in the Mlalazi-Richards Bay area of Natal, South Africa', Bothalia 14(3), 661-667. https://doi.org/10.4102/abc.v14i3/4.1225 [ Links ]
Werger, M.J.A. & Coetzee, B.J., 1978, 'The Sudano-Zambesian Region', in M.J.A. Werger (ed.), Biogeography and ecology in southern Africa, pp. 231-299, Junk, The Hague. [ Links ]
 Correspondence:
Theo Mostert
mostertt@unizulu.ac.za
Received: 18 Nov. 2017
Accepted: 06 Feb. 2018
Published: 28 May 2018
Note: Additional supporting information may be found in the online version of this article as Online Appendix 1: https://doi.org/10.4102/koedoe.v60i1.1449-1 and Online Appendix 2: https://doi.org/10.4102/koedoe.v60i1.1449-2
^rND^sBromberg-Gedan^nK.^rND^sSilliman^nB.R.^rND^sBertness^nM.D.^rND^sBrown^nL.R.^rND^sDu Preez^nP.J.^rND^sBezuidenhout^nH.^rND^sBredenkamp^nG.J.^rND^sMostert^nT.H.C.^rND^sCollins^nN.B.^rND^sChytrý^nM.^rND^sTichý^nL.^rND^sHolt^nJ.^rND^sBotta-Dukát^nZ.^rND^sColloty^nB.M.^rND^sAdams^nJ.B.^rND^sBate^nG.C.^rND^sDonnelly^nF.A.^rND^sPammenter^nN.W.^rND^sEdwards^nD.^rND^sFey^nM.V.^rND^sGaugris^nJ.Y.^rND^sMatthews^nW.S.^rND^sVan Rooyen^nM.W.^rND^sBothma^nJ.D.P.^rND^sGrainger^nM.J.^rND^sVan Aarde^nR.J.^rND^sWassenaar^nT.D.^rND^sHennekens^nS.M.^rND^sSchaminée^nJ.H.J.^rND^sLubke^nR.A.^rND^sAvis^nA.M.^rND^sSteinke^nT.D.^rND^sBoucher^nC.^rND^sMacDevette^nD.R.^rND^sMacDevette^nD.K.^rND^sGordon^nI.G.^rND^sBartholomew^nR.L.C.^rND^sMatthews^nW.S.^rND^sVan Wyk^nA.E.^rND^sVan Rooyen^nN.^rND^sMatthews^nW.S.^rND^sVan Wyk^nA.E.^rND^sVan Rooyen^nN.^rND^sBotha^nG.A.^rND^sMoll^nE.J.^rND^sMoll^nE.J.^rND^sWerger^nM.J.A.^rND^sNeumann^nF.H.^rND^sScott^nL.^rND^sBousman^nC.B.^rND^sVan As^nL.^rND^sNevill^nH.^rND^sNevill^nE.M.^rND^sSteinke^nT.D.^rND^sTaylor^nR.H.^rND^sAdams^nJ.B.^rND^sHaldorsen^nS.^rND^sTichy^nL.^rND^sVon Maltitz^nG.P.^rND^sVan Wyk^nG.F.^rND^sEverard^nD.A.^rND^sWeisser^nP.J.^rND^sWeisser^nP.J.^rND^sWeisser^nP.J.^rND^sGarland^nI.F.^rND^sDrews^nB.K.^rND^sWeisser^nP.J.^rND^sMuller^nR.^rND^sWerger^nM.J.A.^rND^sCoetzee^nB.J.^rND^1A01^nCharles R.^sHaddad^rND^1A02^nVivian P.^sButler^rND^1A01^nCharles R.^sHaddad^rND^1A02^nVivian P.^sButler^rND^1A01^nCharles R^sHaddad^rND^1A02^nVivian P^sButlerORIGINAL RESEARCH
Ground-dwelling spider assemblages in contrasting habitats in the central South African Grassland Biome
Charles R. HaddadI; Vivian P. ButlerII
IDepartment of Zoology & Entomology, University of the Free State, South Africa
IIDepartment of Animal, Wildlife and Grassland Sciences, University of the Free State, South Africa
ABSTRACT
BACKGROUND: Ground-dwelling spider assemblages in shrublands and cultivated pastures in the South African Grassland Biome have never been comprehensively studied.
OBJECTIVES: Epigeic spiders were collected in eight different habitats in the Amanzi Private Game Reserve in the Free State to determine assemblages of different vegetation types.
METHODS: Three of the sampled habitats were contrasting low-lying shrublands; three were contrasting hill aspects (northern slope, southern slope and plateau) in the Buddleja saligna-Searsia burchellii-Olea europaea africana subcommunity; one habitat was cultivated Digitaria eriantha pastures, and the last habitat was an area in and around a freshwater dam. Spiders were sampled by pitfall trapping in early spring (Sept. 2012), mid-summer (Jan. 2013), mid-autumn (Apr. 2013) and mid-winter (July 2013).
RESULTS: A total of 2982 adult spiders were collected, representing 129 species and 33 families. Ammoxenidae was the most abundant family (40.85%), followed by Gnaphosidae (21.26%), Zodariidae (10.80%) and Salticidae (10.26%). Gnaphosidae was the most species-rich family (24.81%), followed by Salticidae (13.18%), Lycosidae (11.63%) and Zodariidae (6.20%). Spider activity densities and species richness did not differ significantly between habitats, although significant seasonal fluctuations were detected. The three hill aspects and cultivated D. eriantha pastures had the most distinct assemblages, while those of the three low-lying shrublands and freshwater dam showed considerable overlap
CONCLUSIONS: Our results indicate that the aspect of hills has a significant effect in shaping spider assemblages, while the vegetation composition of shrublands is not strongly influential. The unique spider assemblages of cultivated D. eriantha pastures can be attributed to the absence of woody plants.
CONSERVATION IMPLICATIONS: This was the first study to investigate ground-dwelling spider assemblages in shrublands and cultivated pastures in the South African Grassland Biome. Our study confirms that hill aspects, shrublands and pastures harbour very different spider faunas. When identifying land for potential expansion or establishment of protected areas, conservation planners should ensure that the greatest diversity of vegetation units are included to optimise the conservation of biodiversity.
Introduction
In Africa, the Grassland Biome is largely limited to the central plateau of South Africa, Lesotho and parts of Swaziland (Mucina & Rutherford 2006). It is characterised by extremely high plant biodiversity, second only to that of the Fynbos Biome (Low & Rebelo 1996). Grasslands can be defined as a single-layered herbaceous plant community, with a few woody plants, which are usually restricted to specific habitats, including drainage lines and rocky hilltops (Carbutt et al. 2011). The Grassland Biome is one of the most transformed biomes in South Africa and is under continuous threat from cultivation, overgrazing and urban expansion (Bredenkamp & Van Rooyen 1996). Only an estimated 2.04% to 2.80% of this biome is formally conserved (Carbutt et al. 2011; O'Connor & Kuyler 2005), and therefore, effective management and conservation of private land is critical to protect its highly endemic fauna and flora (Wessels et al. 2003).
Although nearly 910 point localities have been sampled for spiders in South African grasslands, only 27 of these have more than 100 specimen records (Foord, Dippenaar-Schoeman & Haddad 2011). Only as recently as three decades ago were the first ecological studies on spiders undertaken in the biome, focusing on the biodiversity of ground-dwelling (Haddad et al. 2015; Jansen et al. 2013; Lotz, Seaman & Kok 1991; Van den Berg & Dippenaar-Schoeman 1991), plant-dwelling (Dippenaar-Schoeman, Hamer & Haddad 2011; Fourie et al. 2013; Haddad 2005; Neethling & Haddad 2013), litter-dwelling (Butler & Haddad 2011) and termitophilous assemblages (Haddad & Dippenaar-Schoeman 2002, 2006). Different species are adapted to particular microhabitats within grasslands, either living on the ground, on grasses or on foliage of woody plants, with few species abundant in multiple strata (Haddad et al. 2013). Consequently, there is considerable scope for research on spider biodiversity, ecology and biology in this unique biome.
Only three of the aforementioned studies have investigated finer scale differences in spider assemblages associated with different plant species, notably litter-dwellers (Butler & Haddad 2011) and foliage-dwellers (Fourie et al. 2013; Neethling & Haddad 2013). However, assemblage structure in contrasting vegetation communities has so far only been investigated for grass-dwellers in structurally variable grasslands (Fourie et al. 2013).
All the pitfall trapping surveys listed above were conducted in open grasslands with sparse or absent woody vegetation, and spider assemblages in shrublands and woodlands remain largely unknown in this biome (Butler & Haddad 2011). The aims of this study were (1) to sample ground-dwelling spider assemblages in different plant communities (predominantly shrublands) to determine possible habitat associations of spider species; (2) assess how habitats affected the activity density and species richness of spiders; (3) determine seasonality of ground-dwelling spider assemblages, and (4) determine whether indicator species could be identified for any of the sampled habitats. Further, this study aims to add to the current knowledge base of ground-dwelling spider biodiversity in South Africa, for which relatively little information is currently available (Dippenaar-Schoeman et al. 2015; Janion-Scheepers et al. 2016).
Research method and design
Study area
Amanzi Private Game Reserve (APGR) is located about 80 km north-east of Bloemfontein in the central Free State (Figure 1a) and falls within the summer rainfall region of central South Africa, with an average of approximately 475 mm of rainfall received annually (Butler 2017). The area experiences hot summers, with day temperatures sometimes between 35 °C and 40 °C (averaging above 30 °C), and cold winters, with night temperatures frequently below freezing and day temperatures usually ranging between 15 °C and 20 °C (Butler 2017).
The study area is located in the Grassland Biome (Rutherford & Westfall 1994), with the vegetation of the surrounding area being described as Dry Sandy Highveld Grassland (Bredenkamp & Van Rooyen 1996) or Vaal-Vet Sandy Grassland (Mucina & Rutherford 2006). The vegetation in APGR is, however, more representative of Winburg Grassy Shrubland, which occurs in a series of larger patches from Trompsburg through Bloemfontein and Winburg to Ventersburg (Mucina & Rutherford 2006).
The landscape of this vegetation type consists of isolated hills, slopes and escarpments, creating habitats ranging from open grassland to shrubland (Mucina & Rutherford 2006). A comprehensive vegetation survey was conducted in the western section of APGR, and details of the community composition in this part of the reserve are provided in Butler (2017).
Based on the results of the vegetation survey, spiders were collected in eight different habitats representing four plant communities (Table 1; Figure 1b). In the Buddelja saligna-Searsia burchelliicommunity, two different subcommunities were sampled, one of which included three habitats associated with the northern and southern slopes and plateau of a hill (Buddleja saligna-Searsia burchellii-Olea europaea africana subcommunity), and the second including two habitats, one dominated by Searsia burchellii and the other by Tarchonanthus camphoratus (Buddleja saligna-Searsia burchellii-Vachellia karroo subcommunity). The remaining three habitats sampled were the Themeda triandra-Digitaria eriantha community, which was dominated in the woody layer by Vachellia karroo; cultivated D. eriantha pastures (Digitaria eriantha-Cynodon dactylon community); and an area in and around a freshwater dam (Persicaria lapathifolia-Panicum coloratum community). The latter two communities had little or no plants contributing to the woody layer (Table 1).
Spider sampling
Two sites were sampled in each habitat, with at least 100 m separating them to avoid pseudoreplication. Five pitfall traps were placed 5 m apart in a straight line at each site. A soil auger was used for drilling holes, and plastic buckets 10 cm in diameter were used as pitfall traps. Ethylene glycol (100 mL) was added to each pitfall trap to preserve terrestrial arthropods for later identification. Collected material was removed and the pitfall traps refilled at the end of each month, from the start of September 2012 (early spring) to the end of August 2013 (end of winter). The sampled material was sorted in the laboratory and all arachnids were extracted from the samples and preserved in 70% ethanol. Following identification and tallying of adult spiders, material was deposited in the National Collection of Arachnida at the ARC-Plant Protection Research in Pretoria, South Africa.
Although spiders were sampled for a full year, several sampling months represented incomplete sampling efforts as a result of flooding of the pitfall traps at some sites following heavy rains, or damage caused to pitfall traps by large herbivorous mammals or vervet monkeys. To ensure that sampling effort was equal between habitats, we opted to provide data for 1 month in each season for which all sites had a complete sampling effort: early spring (September 2012), mid-summer (January 2013), mid-autumn (April 2013) and mid-winter (July 2013). Only adult spiders were included in the analysis.
Statistical analysis
We calculated the estimated species richness for each habitat using the equation:

where the number of species represented by a single individual (i.e. singletons) and two individuals only (i.e. doubletons) are represented by F1 and F2, respectively (Chao 1984). Chao1 is an estimator calculated using the available abundance data and is a function of the ratio between the singletons and doubletons in the data. With an increase in the number of samples, an accumulation curve reaches an asymptote when all species in the community are represented by at least two individuals.
We calculated sampling completeness as the ratio of the observed species richness (Sobs) and the Chao1-estimated species richness (SChao1) (e.g. Cardoso et al. 2008; Scharff et al. 2003; Sørensen, Coddington & Scharff 2002). Chao and Jost (2012) proposed the use of coverage-based rarefaction and extrapolation to assess community richness and sampling effort. They defined sample coverage as the proportion of the total number of individuals in a community that belong to the species represented in the sample. Subtracting the sample coverage from unity gives the proportion of the community belonging to as yet unsampled species, which they referred to as the 'coverage deficit'. This can be inferred as the likelihood that a new, previously unsampled species will be found if the sample was increased by one individual (Chao & Jost 2012). Coverage for each habitat and for the total spider assemblage was calculated using the following equation:

where n represents the number of individuals in the sample and f1 and f2 represent the number of singleton and doubleton species, respectively. Chao and Lee (1992) proposed that an estimated coverage value should be at least 50%, that is, 0.5.
Inventory completeness was analysed in Paleontological Statistics (PAST) version 2.07 using the sample rarefaction function, which implements the 'Mao tau' analytical procedure, with standard errors indicated as 95% confidence intervals on the resulting graphs. We produced curves for each of the habitats, as well as the for the whole spider assemblage.
Using PAST versions 2.07 and 3.06 (Hammer, Harper & Ryan 2001), we calculated whether the abundance and species richness of spiders differed between the eight habitats and also whether these parameters varied seasonally, using linear multivariate regression. In each analysis, habitats and samples were used as independent variables. Because count data follows a Poisson distribution, values were log-transformed prior to analysis to approach a normal distribution.
We then determined whether the two sites from each habitat sampled similar spider assemblages by performing a two-dimensional non-metric multidimensional scaling (NMDS), based on a Bray-Curtis similarity matrix. Ideally, the stress value of an NMDS should be lower than 0.2; otherwise, the resulting diagram needs to be interpreted with caution (Clarke 1993). Further, we performed a cluster analysis using the cluster function and unweighted pair-group average algorithm (Clarke & Warwick 2001). In both analyses, the pooled data from each of the 16 sampling sites were used. Further, a permutational multivariate analysis of variance (PERMANOVA) was performed to test for differences in assemblages between the eight habitats, using the Bray-Curtis distance measure and 10 000 permutations. These analyses were carried out in PAST version 2.07.
Lastly, we attempted to identify indicator spider species, which are considered to be characteristic of a particular habitat. Indicator values were obtained by multiplying a species' relative abundance in a particular habitat, expressed as a percentage of its total abundance, with its relative frequency of occurrence in that particular habitat, that is, proportion of samples in which a species was collected (Dufrene & Legendre 1997). Thus, a species' specificity (narrow association with a particular habitat) and fidelity (frequency of occurrence in that habitat) is expressed as a percentage that can be compared with other species in the sampled habitats (Dufrene & Legendre 1997). A high indicator value illustrates a high affiliation of a species to a particular habitat, with a suitable benchmark of 70% being suggested (e.g. Haddad et al. 2010; McGeoch, Van Rensburg & Botes 2002; Van Rensburg et al. 1999).
Ethical consideration
Permission to collect arachnids in the Free State province was obtained from the Free State Department of Economic Development, Tourism and Environmental Affairs.
Results
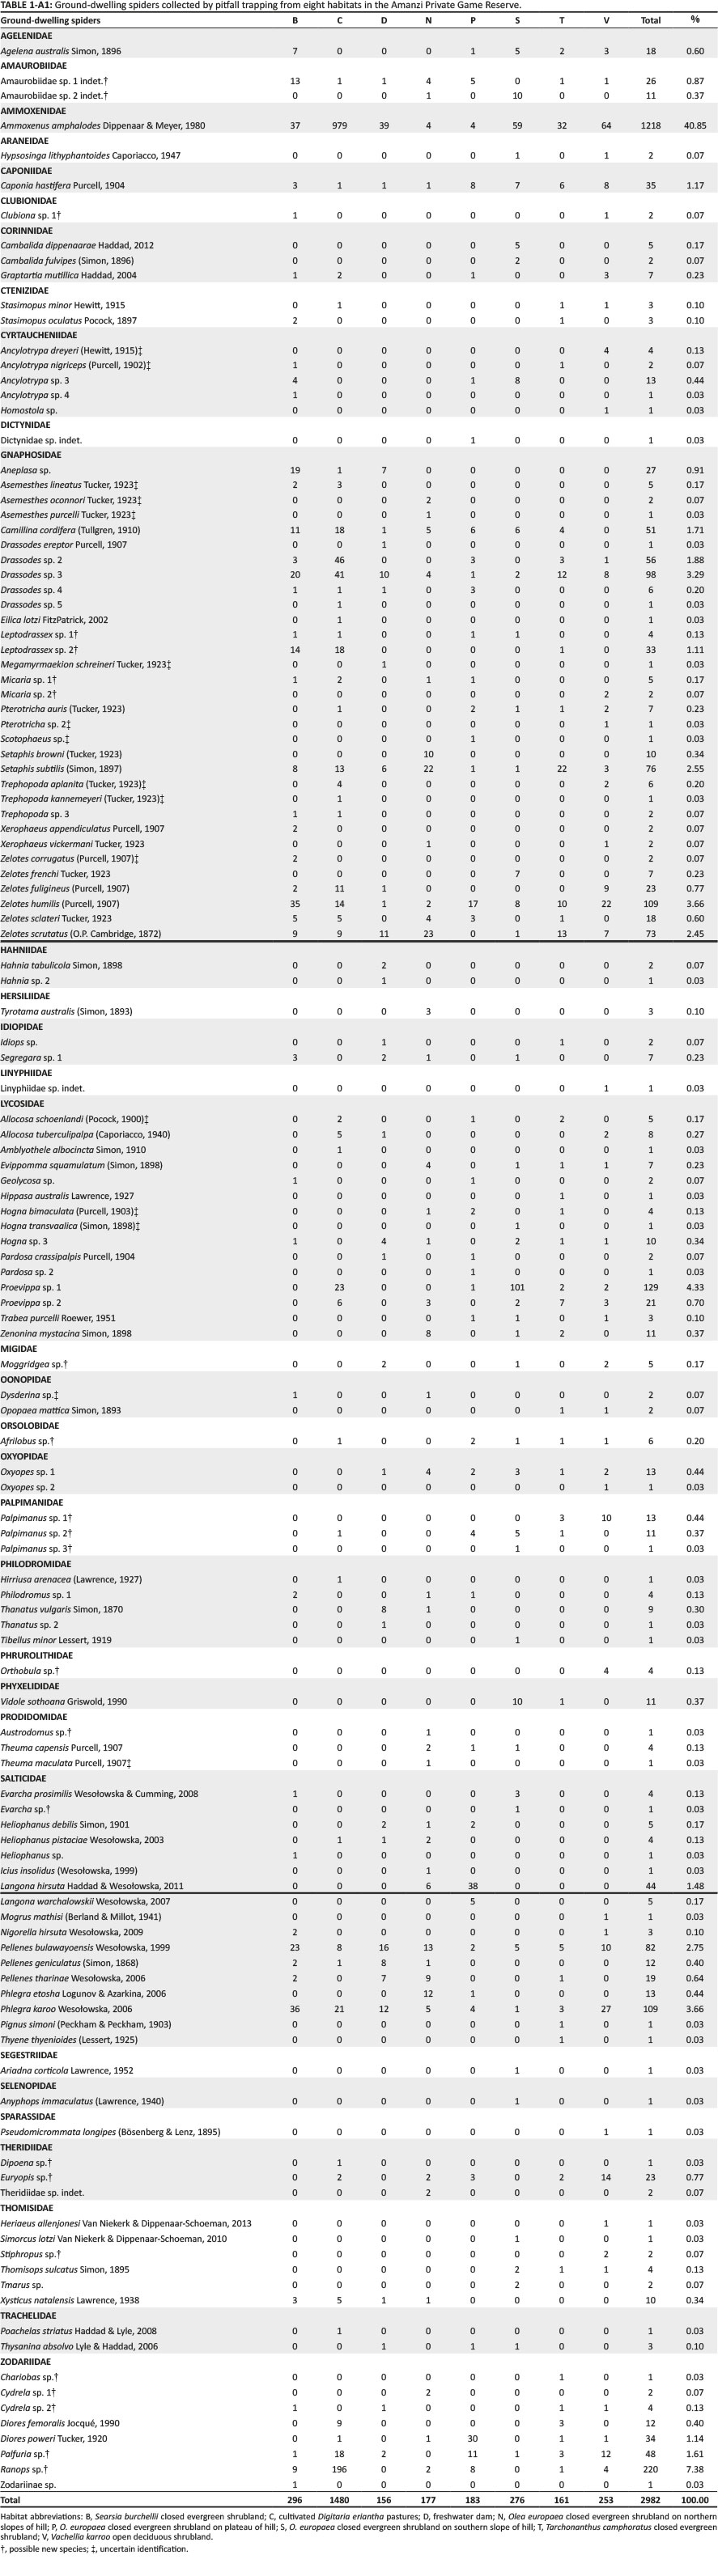
A total of 2982 adult spiders were collected, representing 129 species and 33 families (Table 2; Appendix 1). Ammoxenidae was the dominant family (n = 1218, 40.85%), followed by Gnaphosidae (n = 634, 21.26%), Zodariidae (n = 322, 10.80%) and Salticidae (n = 306, 10.26%). Ammoxenus amphalodes Dippenaar & Meyer, 1980 strongly dominated the fauna overall (n = 1218, 40.85%), largely because of its extremely high activity densities in the cultivated D. eriantha pastures, where it represented 66.15% of the fauna. Ranops sp. (7.38%) was the second most abundant species. Other common species include Proevippa sp. 1 (4.33%), Phlegra karoo Wesołowska, 2006 (3.66%), Zelotes sclateri Tucker, 1923 (3.66%) and Drassodes sp. 2 (3.29%).
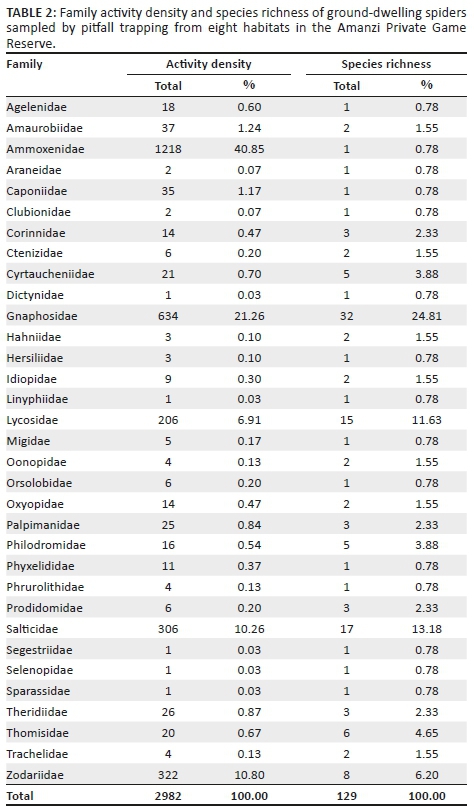
Gnaphosidae was the most species-rich family (32 spp., 24.81%), followed by Salticidae (17 spp., 13.18%), Lycosidae (15 spp., 11.63%) and Zodariidae (8 spp., 6.20%). Total species richness was quite similar between habitats, ranging between 34 and 48 species. However, Chao1-estimated species richness varied considerably, between 58 and 106 species per habitat, with the total ground-dwelling assemblage in the sampled habitats estimated at 167 species (Table 3). Although coverage values were above 0.85 for all the habitats, sample completion was much more variable (0.41-0.76), with 0.77 for the total assemblage (Table 3). This pattern was confirmed by the sample rarefaction curve for the whole spider assemblage (Figure 2a), which approached an asymptote but did not level out, indicating that the majority of the ground-dwelling species in the sampled habitats had been collected. However, none of the habitats' rarefaction curves approached an asymptote (Figures 2b-i), indicating that a considerable portion of the fauna of each was still unsampled. Because open grasslands were not sampled in this study, it could be expected that the total species richness at APGR may further exceed this projected value of 167 species.
Nearly half of all the spiders (n = 1480, 49.63%) were collected from the two cultivated D. erianthapasture sites; indeed, spider numbers in this habitat were exactly five times higher than the habitat with the second highest activity densities, Searsia burchellii closed evergreen shrubland (n = 296). However, linear multivariate regression showed no significant differences between habitats in log-transformed spider activity densities (F2,61 = 1.125, p = 0.3313) or species richness (F2,61 = 0.3105, p= 0.7343).
Linear multivariate regression showed that there was significant seasonality across all sites in log-transformed spider activity densities (F2,61 = 8.388, p = 0.0006), with summer and spring activity densities clearly much higher than those of the colder seasons (Figure 3a). Species richness showed a similar pattern (F2,61 = 13.72, p < 0.0001), although spring and summer species richness was very similar (Figure 3b), although markedly higher than autumn and winter species richness.
Spider assemblages showed some interesting patterns. Not surprisingly, the assemblages of the cultivated D. eriantha pasture sites were the most distinct and showed the greatest similarity to one another compared to all the other habitat site-pairs. Among the remaining seven habitats, only the three habitats associated with the hill had their paired sites grouping together (Figures 4a, b). There was considerable overlap in the assemblages of the lower lying shrubland types and the dam, with most site-pairs not grouping close together (Figure 4b). These results were supported by the PERMANOVA analysis, which showed highly significant differences between the spider assemblages in the sampled habitats (pseudo-F = 2.614, p < 0.0001). Particularly, the pair-wise post hoc comparisons showed significant differences in assemblages between the cultivated pastures (p < 0.0007), plateau (p < 0.0128) and southern slope (p < 0.0105) and all the other habitats (Table 4). For the other habitats, several other paired habitats were also significantly different from each other, although the assemblages of the freshwater dam and Searsia burchellii closed evergreen shrubland had the fewest significant paired values, confirming their assemblage overlap with other habitats (Table 4).
Of the eight habitats sampled, indicator species with a percentage value > 70% were only found in one of the habitats, with A. amphalodes (80.38%) and Ranops sp. (77.95%) both being indicator species for the cultivated D. eriantha pastures. Of the remaining species, only three had indicator values > 50.00%: Setaphis browni (Tucker, 1923) (62.50%) in the northern slope sites, Diores poweri Tucker, 1920 (66.18%) in the plateau sites and Proevippa sp. 1 (58.72%) for the southern slopes.
Discussion
Previous studies on ground-dwelling spiders in the Grassland Biome have focused on open grasslands, while the shrubland faunas have received little attention (Butler & Haddad 2011). In this study, the first focused on shrubland habitats and cultivated pastures in the grasslands of central South Africa, the hill-associated habitats and cultivated D. eriantha pastures had the most distinct assemblages, while those of the lower lying shrublands and freshwater dam showed considerable overlap and often lacked clear distinction. The sample completion values varied between 0.41 and 0.76 for each habitat, which suggests that further sampling is necessary for a better representation of the species richness of those habitats with sample completion < 0.5. However, had the data from the other months sampled, but not included in this analysis, been incorporated into this study, then it is quite likely that this threshold value would have been exceeded in all the habitats.
Our results indicate that the aspect of hillside habitats has a strong influence in shaping assemblages. This could be because of the northern slopes getting more exposure to direct sunlight compared to the southern slopes. Southern slopes have denser vegetation cover in the woody layer, with especially Olea europaea africana providing a lot more shade. Assemblages of the plateau are also very unique, which can possibly be attributed to the differences in the herbaceous layer and slope of the habitat. We would propose conducting a large-scale survey of various hills in central South Africa to determine whether each aspect of these hills (including east and west that were not sampled here) contains a distinct assemblage and whether this pattern varies geographically.
The assemblages of cultivated D. eriantha pastures were very unique, largely because of the absence of woody plants. Although studies in open grasslands in South Africa have shown very contrasting patterns of family dominance (Haddad et al. 2015; Jansen et al. 2013; Lotz et al. 1991; Van den Berg & Dippenaar-Schoeman 1991), the dominance of Ammoxenidae in the cultivated D. eriantha pastures studied here is quite extreme (66.15%). This could be attributed to the high abundance of Hodotermes mossambicus (Hagen, 1853) termites in the pastures, which are the sole prey of A. amphalodes(Petráková et al. 2015). Similarly, the high activity of Ranops sp. in this habitat (13.24%) can be attributed to high activity densities of their mimetic model and possible prey ant, Anoplolepis custodiens(F. Smith, 1858) (Haddad 2012). Interestingly, these were the only two spider species with indicator values above 70.0%, suggesting that the other species sampled had more general habitat preferences, were more strongly seasonal in occurrence or were too scarce to serve as meaningful indicators of particular habitats.
The ten species of mygalomorph trapdoor spiders collected in four months' sampling (~9600 pitfall trap-days) is quite remarkable. This is higher than the eight species collected during nearly 22 000 pitfall trap-days' sampling in open grasslands in the Erfenis Dam Nature Reserve (Haddad et al. 2015) and the five species collected in open grassland during 36 500 trap-days' sampling in the Free State National Botanical Gardens (J.A. Neethling & C.R. Haddad [University of the Free State] unpubl., August 2010 to May 2011), both within a radius of 70 km from Amanzi. This is probably because of the more structurally and topographically variable habitats sampled in the current study compared to open grasslands sampled in the latter two studies. The inclusion of open grassland habitats in the current study would likely have increased the trapdoor spider diversity at this site. For example, Calommata meridionalis Fourie, Haddad and Jocqué, 2011 (Atypidae) was not collected in this study but has been recorded from the other two sites (Fourie et al. 2011; Haddad et al. 2015). In addition, an unidentified Harpactira sp. (Theraphosidae) has also been collected from burrows and/or at night at all three localities, but has yet to be sampled using pitfall trapping.
Two faunistic records are of particular interest: the tree-trapdoor genus Moggridgea (Migidae) is recorded from the Free State province for the first time (Dippenaar-Schoeman 2002; Dippenaar-Schoeman et al. 2010; Griswold 1987), with five male spiders sampled in very contrasting habitats (Appendix 1). This suggests that this species may occur in shrublands throughout central South Africa. This study also yielded the first records of Opiliones from the central Free State (Assamiidae: Polycoryphus asper Loman, 1902); all previous records of harvestmen in the province are from the eastern or southern fringes (Lotz 2002). Previously, this species was only known from the Kogelbeen caves in Northern Cape, Port Elizabeth in the Eastern Cape and on the Namibia-Angola border, and is thus widespread although scarce (Lotz 2009). Although only two specimens were collected in pitfall traps from the southern slope sites in this study, more than 20 additional specimens were collected from beneath large rocks on various hills at Amanzi, all on the southern slopes. Further studies are needed elsewhere in central South Africa to clarify the distribution and microhabitat preferences of these two arachnids.
Conclusion
This is the first study to investigate spider assemblages in shrubland, hill and pasture habitats in the Grassland Biome of the Free State, South Africa. Our results indicate that activity densities of spiders are lower in shrubland habitats than cultivated pastures and open grasslands previously sampled in central South Africa. Shrublands accommodate very different assemblages to pastures and grasslands, and therefore, conservation efforts for arachnids will benefit considerably from sampling a broader habitat diversity to identify potential indicator species and species of potential conservation importance.
Acknowledgements
Kobie Fourie is thanked for permission to conduct this study at Amanzi Private Game Reserve and for providing accommodation during the field work to the second author. Ansie Dippenaar-Schoeman (ARC - Plant Protection Research Institute, Pretoria) and Leon Lotz (National Museum, Bloemfontein) are thanked for identifications of some of the species. The Free State Department of Economic Development, Tourism and Environmental Affairs is thanked for collecting permits that made the study possible.
Competing interests
The authors declare that they have no financial or personal relationships that may have inappropriately influenced them in writing this article.
Authors' contributions
C.R.H. performed initial sorting of arthropod material, identified the arachnid material, performed the statistical analysis and wrote part of the manuscript. V.P.B. performed the vegetation analysis, conducted the field work, assisted with initial sorting of arthropod material and wrote part of the manuscript.
Funding information
This study was funded through a grant to the senior author from the National Research Foundation of South Africa in the Thuthuka programme (#69017).
References
Bredenkamp, G.J. & Van Rooyen, N., 1996, 'Dry Sandy Highveld Grassland', in A.B. Low & A.G. Rebelo (eds.), Vegetation of South Africa, Lesotho and Swaziland, p. 41, Department of Environmental Affairs and Tourism, Pretoria. [ Links ]
Butler, V.P., 2017, 'Feeding ecology of the greater kudu (Tragelaphus strepsiceros) in the central Free State', Unpublished M.Sc dissertation, University of the Free State, Bloemfontein. [ Links ]
Butler, V.P. & Haddad, C.R., 2011, 'Spider assemblages associated with leaf litter of three tree species in central South Africa (Arachnida: Araneae)', African Journal of Ecology 49, 301-310. https://doi.org/10.1111/j.1365-2028.2011.01265.x [ Links ]
Carbutt, C., Tau, M., Stephens, A. & Escott, B., 2011, 'The conservation status of temperate grasslands in southern Africa', Grassroots 11, 17-23. [ Links ]
Cardoso, P., Scharff, N., Gaspar, C.S., Henriques, S.S., Carvalho, R., Castro, P.H. et al., 2008, 'Rapid biodiversity assessment of spiders (Araneae) using semi-quantitative sampling: A case study in a Mediterranean forest', Insect Conservation and Diversity 1, 71-84. https://doi.org/10.1111/j.1752-4598.2007.00008.x [ Links ]
Chao, A., 1984, 'Nonparametric estimation of the number of classes in a population', Scandinavian Journal of Statistics 11, 265-270. [ Links ]
Chao, A. & Jost, L., 2012, 'Coverage-based rarefaction and extrapolation: Standardizing samples by completeness rather than size', Ecology 93, 2533-2547. https://doi.org/10.1890/11-1952.1 [ Links ]
Chao, A. & Lee, S.M., 1992, 'Estimating the number of classes via sample coverage', Journal of the American Statistical Association 87, 210-217. https://doi.org/10.1080/01621459.1992.10475194 [ Links ]
Clarke, K.R., 1993, 'Non-parametric multivariate analyses of changes in community structure', Australian Journal of Ecology 18, 117-143. https://doi.org/10.1111/j.1442-9993.1993.tb00438.x [ Links ]
Clarke, K.R. & Warwick, R.M., 2001, Change in marine communities: An approach to statistical analysis and interpretation, 2nd edn., PRIMER-E, Plymouth. [ Links ]
Dippenaar-Schoeman, A.S., 2002, Baboon and trapdoor spiders of Southern Africa: An identification manual, Agricultural Research Council, Pretoria. [ Links ]
Dippenaar-Schoeman, A.S., Haddad, C.R., Foord, S.H., Lyle, R., Helberg, L., Mathebula, S. et al., 2010, First Atlas of the Spiders of South Africa (Arachnida: Araneae), ARC - Plant Protection Research Institute, Pretoria, pp. 1158. [ Links ]
Dippenaar-Schoeman, A.S., Haddad, C.R., Foord, S.H., Lyle, R., Lotz, L.N. & Marais, P., 2015, 'South African National Survey of Arachnida (SANSA): Review of current knowledge, constraints and future needs for documenting spider diversity (Arachnida: Araneae)', Transactions of the Royal Society of South Africa 70, 245-275. https://doi.org/10.1080/0035919X.2015.1088486 [ Links ]
Dippenaar-Schoeman, A.S., Hamer, M. & Haddad, C.R., 2011, 'Spiders (Arachnida: Araneae) of the vegetation layer of the Mkambati Nature Reserve, Eastern Cape, South Africa', Koedoe 53(1), 1058. https://doi.org/10.4102/koedoe.v53i1.1058 [ Links ]
Dufrene, M. & Legendre, P., 1997, 'Species assemblages and indicator species: The need for a flexible asymmetrical approach', Ecological Monographs 67, 345-366. https://doi.org/10.2307/2963459 [ Links ]
Foord, S.H., Dippenaar-Schoeman, A.S. & Haddad, C.R., 2011, 'South African spider diversity: African perspectives on the conservation of a mega-diverse group', in O. Grillo & G. Venora (eds.), Changing diversity in changing environment, pp. 163-182, InTech Publishing, Rijeka. [ Links ]
Fourie, R., Haddad, C.R., Dippenaar-Schoeman, A.S. & Grobler, A., 2013, 'Ecology of the plant-dwelling spiders (Arachnida: Araneae) of the Erfenis Dam Nature Reserve, South Africa', Koedoe 55(1), 1113. https://doi.org/10.4102/koedoe.v55i1.1113 [ Links ]
Fourie, R., Haddad, C.R. & Jocqué, R., 2011, 'A revision of the purse-web spider genus CalommataLucas, 1837 (Araneae: Atypidae) in the Afrotropical Region', ZooKeys 95, 1-28. https://doi.org/10.3897/zookeys.95.745 [ Links ]
Griswold, C.E., 1987, 'The African members of the trap-door spider family Migidae (Araneae: Mygalomorphae) 1: The genus Moggridgea O. P.-Cambridge, 1875', Annals of the Natal Museum 28, 1-118. [ Links ]
Haddad, C.R., 2005, 'Ecology of spiders (Arachnida: Araneae) inhabiting Themeda triandra Forskål grassland in semi-arid South Africa', Navorsinge van die Nasionale Museum, Bloemfontein 21, 25-36. [ Links ]
Haddad, C.R., 2012, 'Advances in the systematics and ecology of African Corinnidae spiders (Arachnida: Araneae), with emphasis on the Castianeirinae', Unpublished PhD thesis, University of the Free State, Bloemfontein. [ Links ]
Haddad, C.R. & Dippenaar-Schoeman, A.S., 2002, 'The influence of mound structure on the diversity of spiders (Araneae) inhabiting the abandoned mounds of the snouted harvester termite Trinervitermes trinervoides (Sjöstedt)', Journal of Arachnology 30, 403-408. https://doi.org/10.1636/0161-8202(2002)030[0403:TIOMSO]2.0.CO;2 [ Links ]
Haddad, C.R. & Dippenaar-Schoeman, A.S., 2006, 'Spiders (Arachnida: Araneae) inhabiting abandoned mounds of the snouted harvester termite Trinervitermes trinervoides (Sjöstedt) (Isoptera: Termitidae: Nasutitermitinae) in the Free State, with notes on their biology', Navorsinge van die Nasionale Museum, Bloemfontein 22, 1-15. [ Links ]
Haddad, C.R., Dippenaar-Schoeman, A.S., Foord, S.H., Lotz, L.N. & Lyle, R., 2013, 'The faunistic diversity of spiders (Arachnida: Araneae) of the Grassland Biome in South Africa', Transactions of the Royal Society of South Africa 68, 97-122. https://doi.-org/10.1080/0035919X.2013.773267 [ Links ]
Haddad, C.R., Foord, S.H., Fourie, R. & Dippenaar-Schoeman, A.S., 2015, 'Effects of a fast-burning spring fire on the ground-dwelling spider assemblages (Arachnida: Araneae) in a central South African grassland habitat', African Zoology 50, 281-292. https://doi.org/10.1080/15627020.2015.1088400 [ Links ]
Haddad, C.R., Honiball, A.S., Dippenaar-Schoeman, A.S., Slotow, R. & Van Rensburg, B.J., 2010, 'Spiders (Arachnida: Araneae) as indicators of elephant-induced habitat changes in the Maputaland Centre of Endemism, South Africa', African Journal of Ecology 48, 446-460. https://doi.org/10.1111/j.1365-2028.2009.01133.x [ Links ]
Hammer, Ø., Harper, D.A.T. & Ryan, P.D., 2001, 'PAST - PAlaeontological STatistics', Palaeontologia Electronica 4, 1-33. [ Links ]
Janion-Scheepers, C., Measey, J., Braschler, B., Chown, S.L., Coetzee, L., Colville, J. et al., 2016, 'Soil biota in a megadiverse country: Current knowledge and future research directions in South Africa', Pedobiologia 59, 129-174. https://doi.org/10.1016/j.pedobi.2016.03.004 [ Links ]
Jansen, R., Makaka, L., Little, I.T. & Dippenaar-Schoeman, A.S., 2013, 'Response of ground-dwelling spider assemblages (Arachnida, Araneae) to montane grassland management practices in South Africa', Insect Conservation and Diversity 6, 572-589. https://doi.org/10.1111/icad.12013 [ Links ]
Lotz, L.N., 2002, 'The Opiliones (Arachnida) of the Free State Province, South Africa', Navorsinge van die Nasionale Museum, Bloemfontein 18, 161-188. [ Links ]
Lotz, L.N., 2009, 'Harvestmen (Arachnida: Opiliones) in southern Africa - An annotated catalogue with notes on distribution', Navorsinge van die Nasionale Museum, Bloemfontein 25, 1-46. [ Links ]
Lotz, L.N., Seaman, M.T. & Kok, D.J., 1991, 'Surface-active spiders (Araneae) of a site in semi-arid central South Africa', Navorsinge van die Nasionale Museum, Bloemfontein 7, 530-540. [ Links ]
Low, A.B. & Rebelo, A.G., 1996, Vegetation of South Africa, Lesotho and Swaziland, Department of Environmental Affairs and Tourism, Pretoria. [ Links ]
McGeoch, M.A., Van Rensburg, B.J. & Botes, A., 2002, 'The verification and application of bioindicators: A case study of dung beetles in a savanna ecosystem', Journal of Applied Ecology 39, 661-672. https://doi.org/10.1046/j.1365-2664.2002.00743.x [ Links ]
Mucina, L. & Rutherford, M.C., 2006, The vegetation of South Africa, Lesotho and Swaziland, Strelitzia 19, South African National Biodiversity Institute, Pretoria. [ Links ]
Neethling, J.A. & Haddad, C.R., 2013, 'Arboreal spider assemblages associated with four tree species in the Grassland Biome of central South Africa (Arachnida: Araneae)', Transactions of the Royal Society of South Africa 68, 123-131. https://doi.org/10.1080/0035919X.2013.806374 [ Links ]
O'Connor, T.G. & Kuyler, P., 2005, National Grasslands Initiative: Identification of compatible land uses for maintaining compatible biodiversity integrity, Unpublished report, South African National Biodiversity Institute, Pretoria. [ Links ]
Petráková, L., Líznarová, E., Pekár, S., Haddad, C.R., Sentenská, L. & Symondson, W.O.C., 2015, 'Discovery of a monophagous true predator, a specialist termite-eating spider (Araneae: Ammoxenidae)', Scientific Reports 5, 14013. https://doi.org/10.1038/srep14013 [ Links ]
Rutherford, M.C. & Westfall, R.H., 1994, 'Biomes of southern Africa: an objective characterization', Memoirs of the Botanical Survey of South Africa 6, 1-94. [ Links ]
Scharff, N., Coddington, J.A., Griswold, C.E., Hormiga, G. & Bjorn, P., 2003, 'When to quit? Estimating spider species richness in a northern European deciduous forest', Journal of Arachnology 31, 246-273. https://doi.org/10.1636/0161-8202(2003)031[0246:WTQESS]2.0.CO;2 [ Links ]
Sørensen, L.I., Coddington, J.A. & Scharff, N.J., 2002, 'Inventorying and estimating subcanopy spider diversity using semiquantitative sampling methods in an Afromontane forest', Environmental Entomology 31, 319-330. https://doi.org/10.1603/0046-225X-31.2.319 [ Links ]
Van den Berg, A. & Dippenaar-Schoeman, A.S., 1991, 'Ground-living spiders from an area where the harvester termite Hodotermes mossambicus occurs in South Africa', Phytophylactica 23, 247-253. [ Links ]
Van Rensburg, B.J., McGeoch, M.A., Chown, S.L. & Van Jaarsveld, A.S., 1999, 'Conservation of heterogeneity among dung beetles in the Maputaland Centre of Endemism, South Africa', Biological Conservation 88, 145-153. https://doi.org/10.1016/S0006-3207(98)00109-8 [ Links ]
Wessels, K.J., Reyers, B., Van Jaarsveld, A.S. & Rutherford, M.C., 2003, 'Identification of potential conflict areas between land transformation and biodiversity conservation in north-eastern South Africa', Agriculture, Ecosystems and Environment 95, 157-178. https://doi.org/10.1016/S0167-8809(02)00102-0 [ Links ]
Correspondence:
Charles Haddad
haddadcr@ufs.ac.za
Received: 28 July 2017
Accepted: 09 Apr. 2018
Published: 31 May 2018
^rND^sBredenkamp^nG.J.^rND^sVan Rooyen^nN.^rND^sButler^nV.P.^rND^sHaddad^nC.R.^rND^sCarbutt^nC.^rND^sTau^nM.^rND^sStephens^nA.^rND^sEscott^nB.^rND^sCardoso^nP.^rND^sScharff^nN.^rND^sGaspar^nC.S.^rND^sHenriques^nS.S.^rND^sCarvalho^nR.^rND^sCastro^nP.H.^rND^sChao^nA.^rND^sChao^nA.^rND^sJost^nL.^rND^sChao^nA.^rND^sLee^nS.M.^rND^sClarke^nK.R.^rND^sDippenaar-Schoeman^nA.S.^rND^sHaddad^nC.R.^rND^sFoord^nS.H.^rND^sLyle^nR.^rND^sLotz^nL.N.^rND^sMarais^nP.^rND^sDippenaar-Schoeman^nA.S.^rND^sHamer^nM.^rND^sHaddad^nC.R.^rND^sDufrene^nM.^rND^sLegendre^nP.^rND^sFoord^nS.H.^rND^sDippenaar-Schoeman^nA.S.^rND^sHaddad^nC.R.^rND^sFourie^nR.^rND^sHaddad^nC.R.^rND^sDippenaar-Schoeman^nA.S.^rND^sGrobler^nA.^rND^sFourie^nR.^rND^sHaddad^nC.R.^rND^sJocqué^nR.^rND^sGriswold^nC.E.^rND^sHaddad^nC.R.^rND^sHaddad^nC.R.^rND^sDippenaar-Schoeman^nA.S.^rND^sHaddad^nC.R.^rND^sDippenaar-Schoeman^nA.S.^rND^sHaddad^nC.R.^rND^sDippenaar-Schoeman^nA.S.^rND^sFoord^nS.H.^rND^sLotz^nL.N.^rND^sLyle^nR.^rND^sHaddad^nC.R.^rND^sFoord^nS.H.^rND^sFourie^nR.^rND^sDippenaar-Schoeman^nA.S.^rND^sHaddad^nC.R.^rND^sHoniball^nA.S.^rND^sDippenaar-Schoeman^nA.S.^rND^sSlotow^nR.^rND^sVan Rensburg^nB.J.^rND^sHammer^nØ.^rND^sHarper^nD.A.T.^rND^sRyan^nP.D.^rND^sJanion-Scheepers^nC.^rND^sMeasey^nJ.^rND^sBraschler^nB.^rND^sChown^nS.L.^rND^sCoetzee^nL.^rND^sColville^nJ.^rND^sJansen^nR.^rND^sMakaka^nL.^rND^sLittle^nI.T.^rND^sDippenaar-Schoeman^nA.S.^rND^sLotz^nL.N.^rND^sLotz^nL.N.^rND^sLotz^nL.N.^rND^sSeaman^nM.T.^rND^sKok^nD.J.^rND^sMcGeoch^nM.A.^rND^sVan Rensburg^nB.J.^rND^sBotes^nA.^rND^sNeethling^nJ.A.^rND^sHaddad^nC.R.^rND^sPetráková^nL.^rND^sLíznarová^nE.^rND^sPekár^nS.^rND^sHaddad^nC.R.^rND^sSentenská^nL.^rND^sSymondson^nW.O.C.^rND^sRutherford^nM.C.^rND^sWestfall^nR.H.^rND^sScharff^nN.^rND^sCoddington^nJ.A.^rND^sGriswold^nC.E.^rND^sHormiga^nG.^rND^sBjorn^nP.^rND^sSørensen^nL.I.^rND^sCoddington^nJ.A.^rND^sScharff^nN.J.^rND^sVan den Berg^nA.^rND^sDippenaar-Schoeman^nA.S.^rND^sVan Rensburg^nB.J.^rND^sMcGeoch^nM.A.^rND^sChown^nS.L.^rND^sVan Jaarsveld^nA.S.^rND^sWessels^nK.J.^rND^sReyers^nB.^rND^sVan Jaarsveld^nA.S.^rND^sRutherford^nM.C.^rND^1A01 A02^nFrancois^sRoux^rND^1A01^nGert^sSteyn^rND^1A03^nClinton^sHay^rND^1A01^nIna^sWagenaar^rND^1A01 A02^nFrancois^sRoux^rND^1A01^nGert^sSteyn^rND^1A03^nClinton^sHay^rND^1A01^nIna^sWagenaar^rND^1A01 A02^nFrancois^sRoux^rND^1A01^nGert^sSteyn^rND^1A03^nClinton^sHay^rND^1A01^nIna^sWagenaar
ORIGINAL RESEARCH
Movement patterns and home range size of tigerfish (Hydrocynus vittatus) in the Incomati River system, South Africa
Francois RouxI, II; Gert SteynI; Clinton HayIII; Ina WagenaarI
IDepartment of Zoology, University of Johannesburg, South Africa
IIScientific Services, Mpumalanga Tourism and Parks Agency, South Africa
IIIDepartment of Biological Sciences, University of Namibia, Namibia
ABSTRACT
Historical data suggested that the tigerfish (Hydrocynus vittatus) of the Incomati River migrates upstream and downstream as part of their life history. It has been suggested that this movement was a prerequisite for successful spawning in inundated floodplains in Mozambique. Recent advances in aquatic radio telemetry provided a reliable mechanism to monitor fish movement and increase knowledge of the ecology of tigerfish. From 04 January 2003 to 22 December 2003, 41 tigerfish in the Incomati River system were fitted with radio transmitters to record movement patterns and estimate home range size. On average, each fish was tracked 72 times, and the total number of fixes was 2971 over the study period, including 1322 summer fixes and 1649 winter fixes. The mean longest distance travelled by tigerfish was 730 m (range = 75 m to 3200 m). The home range size varied between individual fish, but on average fish stayed within a defined home range of 48 846 m2. Tigerfish showed high site fidelity to specific habitats within specific activity zones and movement occurred primarily within these defined zones. Differences in movement pattern, longest distance travelled and home range size could not be attributed to the sex or size of the fish. No large-scale movement patterns associated with specific life history activity were observed; thus, previous reports of large-scale downstream migrations and spawning migrations appear to be invalid. The presence of weirs in the study area impedes free fish movement as these weirs create migration obstructions.
CONSERVATION IMPLICATIONS: River regulation such as damming, water abstraction, obstructive barriers and channel modification may have a detrimental impact on the survival strategy of this species. Implementation of these results in a management policy will provide a reliable basis for species specific requirements such as upstream reservoir release management; minimum flow volumes required for downstream ecosystem maintenance and management and planning of structures obstructing natural flow.
Introduction
The freshwater fish genus Hydrocynus is represented by six species, all endemic to Africa. They are pikelike predators, commonly termed 'tigerfishes' for their prominent dentition and dark lateral stripes (Gery 1977). In southern Africa, one of these species, Hydrocynus vittatus (commonly known as tigerfish), occurs in the Zambezi and Okavango Rivers and in the lowveld reaches of coastal systems (Skelton 2001). The southern African tigerfish (H. vittatus) has a limited distribution in South Africa, where it is restricted to the lowveld reaches of the Limpopo River system, mainly within the Kruger National Park (KNP), and further south in the lower reaches of the Usutho and Phongolo Rivers (Gaigher 1967).
The Incomati River system (South Africa) is a marginal area in the distribution range of tigerfish where they occur in relatively low abundance. Being essentially a lowveld species in South Africa, it is intolerant to cold water and migrates downstream to lower lying reaches of these rivers during winter where water temperatures are higher and more stable (Pienaar 1978; Steyn et al. 1996; Van Loggerenberg 1983; Skelton 2001). Mortalities caused by a sudden drop in temperature (< 16.0 °C) related to cold water in the Incomati River were reported on several occasions (Deacon 1991; Gagiano 1997; personal observation by authors; Van Loggerenberg 1983). Gagiano (1997) reported mortalities in the Piet Grobler Dam in the KNP at a temperature of 14.5 °C during the winter period.
The habitat and environmental conditions in the Incomati River system differ considerably from the favourable conditions present in the larger northern tropical river systems such as the Zambezi River. Tigerfish are inhabitants of open, well-oxygenated waters such as found in the larger rivers and lakes (Pienaar 1978). In contrast to the larger rivers and lakes in the north of South Africa, the rivers of the KNP are relatively small, highly regulated because of anthropogenic impacts and subject to extreme seasonal variations (Du Preez & Steyn 1992; Gertenbach 1991). Variation and flow volumes, especially in the presence of instream damming structures such as weirs, can severely impact the ability of fish species to migrate in accordance with their life history requirement (Baras & Lucas 2002). Furthermore, all the major rivers of the KNP are subjected to high silt loads which can severely reduce dissolved oxygen concentrations of the water and may be lethal to fish (Buermann et al. 1995). There has been a long history of fish mortalities in the KNP caused by large amounts of suspended particles present in the water (KNP annual reports 1946-1992). The negative impact of increased silt loads on the aquatic macro-invertebrate diversity in the major rivers of the KNP was reported by Moore and Chutter (1988). Sub-lethal effects of suspended solids on fish are varied and include negative impacts on reproduction, egg survival, growth, oxygen consumption, haematology, feeding and social behaviour (Crouse, Callahan & Malaug 1981; Wilber 1983). Indirect effects include reduced food availability, clogging of gillrakes and filaments, reduced growth rate, reduced resistance to disease and disturbances of natural movements and migrations of fish (Albaster & Lloyd 1980; Bruton 1985).
Tigerfish has a prominent ecological status as top predator, sharing the same trophic level as crocodiles in the KNP riverine ecosystems. Their limited presence in the KNP and their vulnerability to impacts described above served as motivation for several studies since the work of Gaigher (1967).
In South Africa, research on tigerfish concentrated on ecological aspects (Gaigher 1970, 1973; 1975; Gagiano 1997; Van Loggerenberg 1983), reproduction (Steyn 1993; Steyn & Van Vuren, 1992; Steyn et al. 1996), tooth replacement (Gagiano, Steyn & Du Preez 1996), age estimation and maturity (Gerber et al. 2009) and genetics (Kotze et al. 1998). Recent advances in aquatic radio telemetry provided a reliable means to acquire further information on the behaviour ecology of fish species and to improve our knowledge on tigerfish.
Despite several comprehensive studies as mentioned above, conservationists and river managers were still left with key questions on the (1) migrational requirements, (2) movement patterns and (3) ability to overcome obstructions in order to maintain functionality of a viable tigerfish population in the Incomati River system. The objective of this study was to use biotelemetry to answer these key questions.
Material and methods
Description of the study area
The Incomati River drains parts of Mpumalanga, Swaziland and Mozambique between the Limpopo River system in the north and the Phongolo River system in the south. It is economically one of the most important river basins in South Africa, and it consists of three adjacent sub-basins: the Komati, Crocodile and Sabie (Darwall et al. 2009). The main river descends from the highland plateau in Mpumalanga and Swaziland and flows through the coastal plains of Mozambique to the Indian Ocean just north of Maputo at Villa Laisa. The total basin area is about 46 800 km2 of which 63% is in South Africa, 5% in Swaziland and 32% in Mozambique. The average discharge of the Incomati River basin at the estuary is about 100 m3/s to 200 m3/s, corresponding to about 3600 million m3 per year, to which South Africa contributes 82%, Swaziland about 13% and Mozambique about 4% (Darwall et al. 2009).
The study area includes two rivers, namely the Crocodile River and the Komati River, which join to form the Incomati River below the border town of Komatipoort. The Crocodile River flows along the boundary of the KNP, and at the confluence, the border extends across the river to also include the lower reach of the Komati River (Figures 1 and 2). Below the confluence, the Incomati River can be described as a meandering river, incised into a wide sandy river bed, and in some sections, it flows through multiple bedrock channels. The river varies between 40 m and 50 m wide, with mostly large sandy pools and occasional rapids and a few riffles (Roux et al. 1990). Collection and tagging were done upstream and downstream of the confluence between KNP and Tenbosch weirs and the low-water bridge in the Komati River. The choice of the collection and tagging area was motivated by the relative abundance of tigerfish in this river reach. The ability of tigerfish to overcome obstructions and their various home ranges later defined the extent of the study area. Historically, tigerfish distribution data would indicate that tigerfish occur up to an altitude of 300 m in the Incomati River system. Gaigher (1967) previously collected tigerfish in the Crocodile River gauge close to the town of Nelspruit and in the Komati River close to the town of Tonga on the border between South Africa and Swaziland. Consequently, the experimental design made provision for long-distance tracking in relation to historical distribution in the Incomati River system.
Collection and handling of the species
Collection and handling of fish were performed in such a manner as to minimise physical and physiological stress to the specimens (Spedicato, Lembo & Marmulla 2005). Tigerfish were caught using two techniques: rod and reel with artificial lures and fly-fishing, both using barbless hooks to reduce injury to fish and to facilitate quick release, thereby reducing lactic acid stress and ensuring survival after handling and release (Gerber et al. 2017).
Tagging of fish
In total, 41 sexually mature tigerfish were tagged with radio transmitters (Advanced Telemetric Systems Inc. ATS, USA, 142 MHz-144 MHz) in 2003. As the sexing of H. vittatus is relatively difficult based on external characteristics, males were only positively identified if they were ripe and running and producing semen. Large females in or close to the spawning season were easily sexed as they displayed characteristic body size, form and weight (Gaigher 1967; Gagiano 1997; G.J. Steyn pers. comm., 2003). The standard length (SL) was measured (mm), and mass (g) of each specimen collected was determined using a measuring tape and a BogaGrip (scale).
Following capture, fish were anaesthetised with 2-phenoxyethanol (0.3 mL/L), minimising hyperactivity and stress. The radio transmitters were selected from ATS models F2040, F2130 and F2010 with trailing whip antennae and were externally attached to fish with two strands of orthopaedic wire (0.65 mm diameter) below the dorsal fin following Thorstad, Økland and Heggeberget (2001). To facilitate rapid healing of the needle wounds, the tagged fish were placed in a terramycin bath (25 mg/L water) for 10 min prior to release. The deployment of the small F2040 transmitters made it possible to tag smaller fish because of the relatively low weight of the transmitter, but remaining within the 2% rule (Brown et al. 1999; Peake & McKinley 1997).
All radio-tagged fish were released at their respective sampling points, and staggered deployment over several months allowed for continuous data retrieval over a full year period, consequently covering all seasons (Table 1; Figure 2). Staggered deployment was necessary because of the limited lifespan of the transmitters.
Fish tracking procedures
Fish were tracked using a Challenger R2100 receiver and a four-element Yagi antenna (ATS Inc.) over a 12-month period (04 January to 22 December 2003) on average every second day, covering both summer and winter periods. Care was taken to minimise behavioural side-effects by keeping a reasonable distance from tagged fish (Hocutt, Seibold & Jesien 1994). Tracking was done on foot from the banks of the river by using the homing-in technique (Jick 1979). If there was any uncertainty regarding the position of the fish, the triangulation method was then applied (Jick 1979). In instances where fish were lost, aerial surveys were conducted using a micro-light aircraft to relocate a specific fish. For all tracking surveys, location was determined using a handheld Global Positioning System Receiver (Garmin Etrax). Upon detection, the Global Position System (GPS) coordinates of the fish's location were noted (accuracy ± 5 m).
Hydrology, water quality and meteorological data
Flow levels in the Incomati River system were determined from daily readings at the KNP gauging weir in the Incomati River. Water temperature, pH and conductivity were recorded daily in the Crocodile River, Komati River and below the confluence of the two rivers (in the Incomati River) using Eutech portable microprocessor-based water quality instruments. Meteorological data were gathered from a nearby weather station (Transvaal Sugar Board, Komatipoort), including rainfall, minimum and maximum air temperatures.
Data analysis
Two fish that moved out of the study area into Mozambique shortly after tagging were excluded from the analysis. In addition, a third fish showed no movement for an extended period after tagging and was presumed dead and excluded from the analysis. Descriptive statistics for the entire study period (summer and winter) were based on more than 10 fixes per fish for 38 fish. GPS coordinates of the radio-tracked tigerfish were used to calculate longest distances travelled and to determine home range sizes.
Bi-variate Gaussian or normal distribution kernel methods (Seaman & Powell 1996; Silwerman 1986; Worton 1989) were used to plot home ranges. This group of methods is part of a more general group of parametric kernel methods that employ distributions other than the normal distributions as the kernel elements which are associated with each point in the set of location data. Because of the meandering nature and relatively small width and limited available habitat within the Incomati River system during low flow periods at specific sites, an adaptation of the simplified minimum convex polygon (MCP) (Baker 2002; Creel & Creel 2002; Meulman & Klomp 1999) was used. Boundaries of home ranges were drawn using different sets of location data (Planet GIS). This method of using the shoreline as a boundary of the home range is a widely accepted and commonly used method in fish telemetry experiments (Hocutt et al. 1994).
For ease of statistical analysis, a binning algorithm was implemented in which the longest distance travelled, home range size and the radio-tagged fish were grouped in classes according to their magnitude. For longest distance travelled (Økland et al. 2005), fish were organised in classes ranging from 100 m to 500 m, 501 m to 1000 m, 1001 m to 1500 m, 1501 m to 2000 m and > 2000 m travelled. The home range size were classed in groups ranging from 0 m2 to 10 000 m2, 10 001 m2 to 20 000 m2, 20 001 m2 to 50 000 m2, 50 001 m2 to 100 000 m2 and > 100 000 m2.
The IBM SPSS Statistics 18 program was used for basic and inferential statistics which include frequencies, normality, correlations and comparisons (SPSS 2009).
Ethical consideration
The project proposal was approved with Ethical Clearance by the Faculty of Science, University of Johannesburg and Mpumalanga Parks and Tourism (Permit number MPB 8553.).
Results
Water quality, hydrology and meteorological data
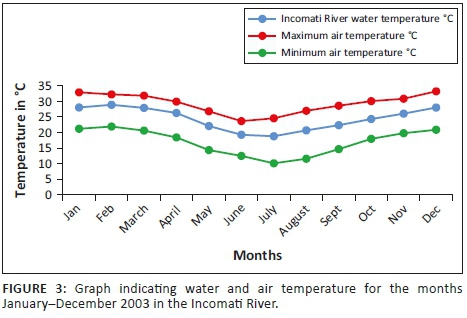
Mean water temperature results in the Incomati River system indicate that the minimum is reached in July (18.02 °C) after which temperatures gradually increase to a mean temperature of 24 °C during October. The highest mean monthly river water temperature during this study (30.61 °C) was recorded in the Crocodile River during January (Figure 3). The highest mean monthly river water temperature in the Komati River (30.17 °C) was recorded during February. Temperatures in the Incomati River, below the confluence, were influenced by both tributaries, and consequently, the highest mean monthly temperature for the Incomati River (28.88 °C) was recorded during February.
For the tigerfish active summer period, November to April, the mean monthly pH values varied between 8.1 and 8.5, whereas the conductivity fluctuated between 274 µS/cm and 622 µS/cm in the Incomati River. Summer conductivity values were lower than winter values, but summer pH values were higher. During summer, the turbidity levels increased as a result of the higher summer flows. Although not measured, turbidity was observed to be closely associated with rainfall events in the catchment during the summer period. The highest rainfall recorded was during the months of November (115.4 mm) and February (191.7 mm).
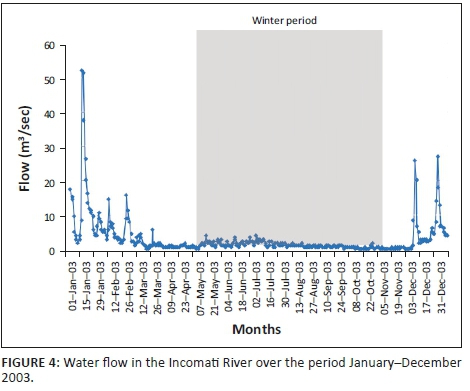
The mean monthly flow (Figure 4) for the winter period (May-October) in the Incomati River, when tigerfish are less active, varied between 0.44 m3/s and 1.89 m3/s compared to 0.82 m3/s and 13.12 m3/s for the summer period (November-April), when tigerfish are active. The highest flow spikes were recorded during the spawning season (October-February) in the summer period (Steyn 1993; Steyn & Van Vuren 1991; Steyn et al. 1996). On three occasions, flow spikes in excess of 25.00 m3/s, with the largest of 51.76 m3/s, occurred in January (Figure 4).
Radio-tagged fish
In total, 41 fish were radio-tagged with a mean length (SL) of 62.7 cm (range 47 cm - 76 cm) and a mean weight of 2418 g (range 910 g - 4990 g) (Table 1; Figure 2). Of the 41 radio-tagged fish, 11 (26.8%) were males and 30 (73.2%) were females in a 1:3 sex ratio. For the radio-tagged males, the length (SL) varied between 47 cm and 60 cm (mean = 55.4 cm) and the weight varied between 910 g and 2040 g (mean = 1605.5 g). For the radio-tagged females, the length (SL) ranged from 57 cm to 76 cm (mean = 65.4 cm) and the weight ranged from 1810 g to 4990 g (mean = 2717 g) (Table 2).
Movement
The total distance of the river where adult fish were captured and equipped with radio tags measured 5.2 km. After capture, tagging and the associated disturbance to a fish when released, the fish normally moved upstream or downstream and normally only returned 2 to 5 days later to the original tagging site, thereby suggesting site fidelity. The distance moved directly after tagging varied over the 2- to 5-day period from 48 m to 1038 m. In total, 35 (85.4%) of the fish tagged returned to the original tagging site within the mentioned period, but 6 (14.6%) never returned, 3 of which moved downstream into Mozambique and were not recorded again. This showed angling in the form of catch and release may be a major disturbance, but this also confirmed site fidelity of tigerfish to a specific home range. The GPS coordinates of each sample or release site, tag number, type of tag and size, weight and sex of each fish are presented in Table 1. Over time, a movement pattern emerged for each of the 41 radio-tagged fish, and the longest distances travelled and home ranges could be determined (Table 1).
On average, fish were tracked 72.5 times (Table 2) and the total number of fixes was 2971 for the period 04 January 2003 to 22 December 2003. Some individuals were tracked up to 161 times. The maximum total of fixes (n = 161) per individual was associated with a tag life of 10 months. For the summer period (January-April, November and December 2003), there were 1322 fixes, and for the winter period (May-October 2003), there were 1649 fixes. For the summer period (or part thereof), there were 40 active radio-tagged fish, but only 32 active radio-tagged fish for the winter period (or part thereof). The mean number of fixes for females was 78.4 (n = 30) per fish with a range of 6-161. The mean number of fixes for males was 56.2 (n = 11) per fish with a range of 7-110. The reason for the lower amount of fixes for males (56.2 fixes) in comparison with females (78.4 fixes) can be ascribed to the differences in radio tag types used. As males are generally smaller than females, smaller F2040 radio tags, with a much shorter lifespan (94 days), were used to stay within the 2% rule.
Longest distance travelled
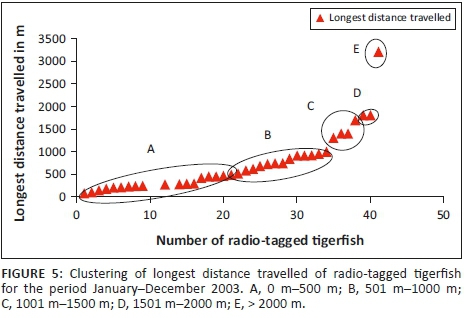
For the statistical analysis, data were obtained from 38 radio-tagged tigerfish with more than 10 fixes. The mean longest distance travelled (n = 38) was 729.66 m (Table 2) with a range from 74.5 m to 3200 m. When analysing the longest distance travelled by the different radio-tagged fish, 47.4% (18 out of the 38 fish) travelled between 100 m and 500 m, 34.2% (13 fish) between 501 m and 1000 m, 10.5% (4 fish) between 1001 m and 1500 m, 5.3% (2 fish) between 1501 m and 2000 m and 2.6% (1 fish) travelled more than 2000 m (Table 2; Figure 5).
When distinguishing between the different sexes and longest distance travelled, 46.4% of females (13 out of 28 fish) travelled between 100 m and 500 m, 39.3% (11 fish) between 501 m and 1000 m, 7.1% (2 fish) between 1001 m and 1500 m, 3.6% (1 fish) between 1501 m and 2000 m and 3.6% (1 fish) travelled more than 2000 m. For the males, 50% (5 out of 10 fish) travelled between 100 m and 500 m, 20% (2 fish) between 501 m and 1000 m, 20% (2 fish) between 1001 m and 1500 m and 10% (1 fish) between 1501 m and 2000 m (Table 2). The furthest movement recorded was 3200 m over a 3-day period. This female moved out of its known home range (18 fixes) and established a new home range approximately 3018 m upstream (Table 2).
For females, the mean longest distance travelled was 734.4 m (n = 28) with a range of 74.5 m to 3200 m, and for males, the mean longest distance travelled was 716.3 m (n = 10) with a range of 148.9 m to 1800 m. No significant differences were found between males and females for longest distances travelled (Mann-Whitney U test, mean ranking males 19.8 and females 18.6, p = 0.753).
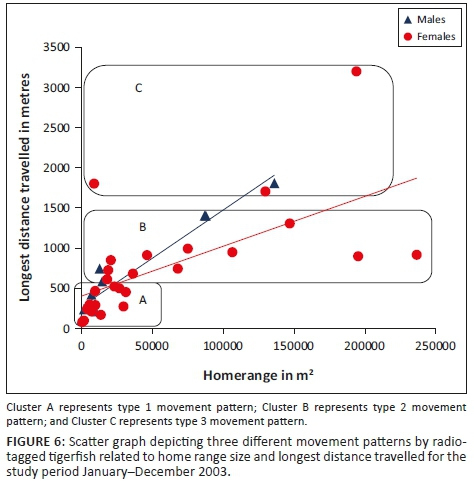
Three different tigerfish movement patterns were recorded (Figure 6). Movement patterns were obtained from a combined effect of distance travelled and home range sizes (Figure 7). Although all the fish displayed some degree of site fidelity within a specific activity zone, movement pattern 1 represents fish that moved 100 m to 500 m within a well-defined home range, and movement occurred only within this specific home range. Movements of fish number 8 serves as example for this type of movement pattern (Figure 8). The majority (47.37%) of the radio-tagged fish displayed characteristics of movement pattern 1 (Figure 6, Cluster A). Movement pattern 2 represents fish that displayed site fidelity for two or more areas within a larger well-defined home range, spanning a distance of 501 m to 1500 m. Movements of fish number 15 serve as example for this type of movement pattern (Figure 9). This group was represented by 44.7% of radio-tagged fish (Figure 6, Cluster B). Movement pattern 3 represents fish that showed little site fidelity and would temporarily occupy small areas within a large undefined home range that spans more than 1500 m. Movements of fish number 23 serve as example for this type of movement (Figure 10). Fish within the latter group can be seen as vagrants without established home ranges for a specific period. Most of these fish were also later lost as they moved out of the study area and could not be relocated. Fish in this group were large females of weight ranging between 2720 g and 3580 g and represented 7.89% of the radio-tagged fish (Figure 6, Cluster C).
For a detailed account of the movement patterns and demarcation of the home ranges of each of the 41 radio-tagged fish, see Roux (2013). The dots indicate individual fixes during tracking and the contours around the fixes indicate the defined home range.
Home range sizes
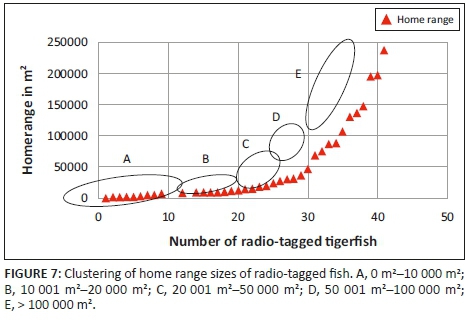
The home range size varied between individual fish with 38.2% (13 fish) localising within an area between 0 m2 and 10 000 m2 (mean = 5567.95 m2) and 18.42% (7 fish) localising within an area between 10 001 m2 and 20 000 m2 (mean = 14 435.53 m2). Furthermore, 18.42% (7 fish) occupied a home range area between 20 001 m2 and 50 000 m2 (mean = 31 092.2 m2), whereas 10.5% (4 fish) occupied an area between 50 001 m2 and 100 000 m2 (mean = 79 809.55 m2) and 18.42% (7 fish) utilised an area > 100 000 m2 (mean = 163 692.90 m2) (Table 2; Figure 7).
On average, the fish (n = 38) stayed within a defined home range of 48 846.36 m2. The home range size for males and females compared favourably with a mean of 53 296.52 m2 (n = 28) and a range from 331.6 m2 to 236 496 m2 for females and a mean of 36 385.9 m2 (n = 10) and a range from 1338.8 m2 to 135 982.6 m2 for males. No statistically significant differences were found between the sexes for their home range size (Mann-Whitney U test, mean ranking females = 20.71 and males = 16.10, p = 0.260).
Migration obstructions
None of the 41 tagged fish crossed the Tenbosch weir. Three individuals, namely numbers 7, 12 and 18, moved upstream in the Crocodile River to be briefly recorded in the vicinity of this weir. The Tenbosch weir has a crest height of 2 m and a fish ladder constructed at the side of the weir. This ladder is of the vertical slot type and appears to be non-functional to fish migration in general.
Only two radio-tagged fish (fish numbers 15 and 39) ventured into the lower Komati River, close to the confluence with the Crocodile River, where they were confined in a pool below the low-water bridge for a few days. They were not able to overcome this obstacle. This low-water bridge at Komatipoort was constructed on a natural dolerite intrusion that stretches across the river.
Contrary to the above, a total number of 16 crossings, both upstream and downstream, were recorded at the KNP weir. This gauging weir has a crest height of approximately 1.2 m with a well-designed fish way to facilitate fish movement at medium to high flow conditions. Tagged fish with allocated numbers 1, 4, 6, 20, 27 and 37 crossed the KNP weir downstream and upstream over the period January to March, whereas fish 19 crossed the KNP weir downstream during July and returned upstream three days later. Fish numbers 1 and 27 each crossed on three occasions, whereas fish number 20 crossed the KNP weir on four occasions with only a few day intervals between upstream and downstream crossings. Numerous visual observations were made of untagged tigerfish jumping over this weir over the duration of this study. Successful crossing at the KNP weir occurred at flow velocities between 1.78 m3/s and 16.2 m3/s (Table 3).
Discussion
This study confirmed that external tagging attachment protocol (Thorstad et al. 2001) was suitable for the study of tigerfish behavioural ecology through biotelemetry in that only a single mortality was recorded from the 41 radio-tagged fish. Furthermore, visual observations of radio-tagged fish swimming just below the surface were made on numerous occasions and fouling of radio tags appeared to be minimal, thus having no significant effect on the swimming capabilities or movement patterns of tagged fish.
After capture, tagging and the associated disturbance to a fish, it normally moved either upstream or downstream and returned 2-5 days later to the original tagging site, thereby confirming site fidelity. The distance moved directly after tagging varied over the 2- to 5-day period from 48 m to 1038 m. In total, 35 of the tagged fish returned to the original tagging site within the mentioned time frame. Six fish never returned; three of these moved downstream into Mozambique and were lost.
In general, tigerfish displayed high site fidelity to specific habitats within specific activity zones, and movement occurred primarily within these defined home ranges. The longest distance travelled by fish was during summer and early winter, when water temperatures exceeded 24 °C. These periods coincided with high water levels in the study area, which probably facilitated movement between different habitats. Some degree of site fidelity of H. vittatus was also reported by Økland et al. (2005) for the Upper Zambezi, whereas consistent fidelity to an activity core was reported by Baras et al. (2002) for Hydrocynus brevis in the Niger River, Mali.
During our study, little to no movement was recorded in the winter months when water temperatures were below 24 °C. The mean lowest temperature recorded in the Incomati River system of 18 °C is close to the minimum temperature range for the survival of tigerfish. During a tigerfish translocation exercise when laboratory-induced breeding was attempted, prior to successful breeding at Skukuza (Steyn et al. 1996), a temperature drop from 27 °C to 18 °C during a 4-hour transport period killed almost all of the fish.
The mean longest distance travelled during this investigation was relatively short (729.66 m). In the Zambezi, two movement patterns were distinguished where approximately 50% of the fish moved < 1000 m among tracking surveys. The remaining fish showed consistent site fidelity for periods with long-distance movements (> 1000 m) to new areas among residency periods. In the Incomati River system, only 18% of the fish displayed long-distance movement > 1000 m and the longest distance was 3200 m. The longest distance travelled in the Incomati River system was relatively short in comparison with the longest distance of 18.8 km travelled in the Zambezi River (Økland et al. 2005). Irrespective of the shorter distances travelled in the Incomati River system, the total unobstructed river upstream to Tenbosch was not utilised by all tagged individuals and the option to migrate downstream was available but not utilised. Nevertheless, three movement patterns demonstrated by Incomati River system tigerfish do not describe the dependency on upstream or downstream migration behaviour expected for this species in the study area.
Implicit of the relative short distances travelled, they are crucial for the survival of H. vittatus in the lower Incomati River system. Site fidelity and restricted mean home range (48 846 m2) in comparison with the much larger home range of Zambezi tigerfish (276 978 m2), supported by various historical observations of their vulnerability to environmental stressors such as low temperature, low flow and high silt loads, are indicative of a population that does not function optimally on the edge of its distribution, in accordance with the law of tolerance (Odum 1971). Sub-optimal functionality of another tigerfish population in the KNP is also reflected in the results of Gagiano (1997), during an ecological investigation on tigerfish in the Olifants and Letaba Rivers. Tigerfish of all sizes in these rivers were found to feed almost exclusively on invertebrates. This finding is in contrast with the tigerfish from other systems, where fish play a major role in their diet (Jackson 1961).
Differences in movement patterns, longest distance travelled and home range size could not be explained by sex or the size of the fish. Tigerfish show opportunistic movement patterns, and home ranges can change in size and location as a result of seasonal shifts, prey availability, habitat availability and cover as well as life history requirements.
No large-scale movement pattern or specific activity-related migrations were observed. Thus, reports of large-scale migrations of tigerfish downstream into Mozambique during winter in the Incomati River (Van Loggerenberg 1982) seem to be no longer relevant, probably because of their limited numbers and because of suitable habitat created by the damming of the KNP weir and subsequent deeper water bodies where the temperature is more stable to find refuge during winter. There was no evidence of upstream congregation of tigerfish at the Tenbosch weir or large-scale downstream crossings at the KNP weir.
From the pattern of crossings at the KNP weir, it is inferred that some of the marked fish that successfully crossed this weir responded to the stress associated with the tagging procedure and returned later to demonstrate site fidelity. These fish were tagged either just downstream or upstream of the KNP weir, followed by a fleeing response over the weir (fish numbers 1, 6, 19 and 20). Some of the crossings could be associated with higher flow conditions (fish numbers 4 and 37), whereas fish number 27 probably displayed natural behaviour as the crossing occurred more than a month after tagging. Irrespective of the motivation for crossing the weir, in context with the life span of the tags for above fish, these events were limited to only a few occasions during a period of several months, which again displayed site fidelity. Flow volumes that varied between 1.94 m3/s and 16.22 m3/s during successful crossings suggest that the KNP weir is not a restrictive barrier to tigerfish and the population is open to gene flow from Mozambique. Contrary to this, our results suggest that tigerfish in the Crocodile River, upstream from the Tenbosch weir, is isolated; consequently, the upstream population cannot be replenished after mortalities because of extreme environmental conditions such as influx of cold water, low flow and high silt loads and will most probably disappear in this part of its historical distribution range.
In the Komati River, upstream movement is restricted close to the confluence at the low-water bridge, consequently isolating the upstream population in the Komati River which currently is heavily subjected to water abstraction and agricultural activities. The isolation of upstream tigerfish populations in the Incomati River system and their vulnerability to environmental impacts emphasise the ecological significance and inclusion of this river reach into the borders of the KNP as well as the functionality and importance of the KNP weir.
Based on the knowledge gained during this study on the behaviour of tigerfish, recommendations on the instream flow requirements (IFRs) of this species need to be adopted into the ecological flow requirements for the Incomati River system and setting of the Ecological Reserve to ensure the ecological maintenance and functioning of the instream habitats utilised by tigerfish (Kleynhans & Engelbrecht 2000). Environmental flow allocations and maintenance of ecological requirements of aquatic ecosystems are entrenched in the National Water Act (No 36 of 1989) and specified as components of the ecological reserve. Within the framework of Resource Directed Measures for Protection of Water Resources, established by the Department Water Affairs and Sanitation (DWA), the implemented ecological reserve needs to be monitored and can be adjusted to meet the targets and resource quality objectives (King, Tharme & De Villiers 2000).
Acknowledgements
The authors acknowledge De Beers, Venetia Mines and Barloworld for funding this project. They thank the Incomati Tigerfish Action Group (iTag), Domien and Bart van Buynder for their logistical support and for their enthusiasm for the tigerfish species and its conservation. They also thank Peter Kimberg and Michael Mashaba for their assistance with fieldwork and data collection.
Competing interests
The authors declare that they have no financial or personal relationships that may have inappropriately influenced them in writing this article.
Authors' contributions
F.R. was the researcher who performed most of the sampling and data analysis. G.S. was the researcher who was responsible for the experimental design. C.H. was the co-worker who is a fish expert with experience in biotelemetry. I.W. was the promoter of the PhD study, made conceptual contributions and proofread the manuscript. F.R. and G.S. wrote the manuscript.
References
Albaster, J.S. & Lloyd, R., 1980, Water quality criteria for freshwater fish, FAO, United Nations, London. [ Links ]
Baker, J., 2002, 'Population density and home range estimates for the eastern bristlebird at Jervis Bay, south-eastern Australia', Corella 25, 62-67. [ Links ]
Baras, E., Togola, B., Sicard, B. & Benech, V., 2002, 'Behaviour of tigerfish Hydrocynus brevis in the River Niger, Mali, as revealed by simultaneous telemetry of activity and swimming depth', Hydrobiologia483, 103-110. https://doi.org/10.1023/A:1021359008246 [ Links ]
Baras, E. & Lucas, M.C., 2002, 'Impacts of man's modification of river hydrology on the migration of freshwater fishes: A mechanistic perspective', Ecohydrology and Hydrobiology 146, 431-448. [ Links ]
Buermann, Y., Du Preez, H.H., Steyn, G.J., Harmse, J.T. & Deacon, A., 1995, 'Suspended silt concentrations in the lower Olifants River (Mpumalanga) and the impact of silt releases from the Phalaborwa Barrage on water quality and fish survival', Koedoe 38(2), 11-33. https://doi.org/10.4102/koedoe.v38i2.312 [ Links ]
Brown, R.S., Cooke, S.J., Anderson, W.G. & McKinley, R.S., 1999, 'Evidence to challenge the "2% Rule" for biotelemetry', North American Journal of Fisheries Management 19, 867-871. https://doi.org/10.1577/1548-8675(1999)019<0867:ETCTRF>2.0.CO;2 [ Links ]
Bruton, M.N., 1985, 'The effects on suspensoids on fish', Hydrobiologia 125, 221-241. https://doi.org/10.1007/BF00045937 [ Links ]
Creel, S. & Creel, N.M., 2002, The African wild dog: Behaviour, ecology and conservation, Princeton University Press, New Jersey. [ Links ]
Crouse, M.R., Callahan, H.F. & Malaug, K.W., 1981, 'Effects of fine sediments on growth of juvenile Coho salmon in laboratory streams', Transactions American Fisheries Society 110, 281-286. https://doi.org/10.1577/1548-8659(1981)110<281:EOFSOG>2.0.CO;2 [ Links ]
Darwall, W.R.T., Smith, K.G., Tweddle, D. & Skelton, P.H., 2009, The status and distribution of freshwater biodiversity in southern Africa, IUCN and Grahams town, South Africa: SAIAB, Gland, Switzerland, p. 120. [ Links ]
Deacon, A., 1991, '"Visvrektes in Olifantsrivier" (Fish mortality in Olifants River)', Custos 18, 31. [ Links ]
Du Preez, H.H. & Steyn, G.J., 1992, 'A preliminary investigation of the concentration of selected metals in the tissues and organs of tigerfish (Hydrocynus vittatus) from the Olifants River, Kruger National Park, South Africa', Water SA 18(2), 131-136. [ Links ]
Gagiano, C.L., 1997, 'An ecological study on the tigerfish Hydrocynus vittatus in the Olifants and Letaba rivers with special reference to artificial reproduction', Unpublished master's dissertation, Rand Afrikaans University, Johannesburg, viewed 05 September 2014 from http://hdl.handle.net/10210/7031 [ Links ]
Gagiano, C.L., Steyn, G.J. & Du Preez, H.H., 1996, 'Tooth replacement of tigerfish Hydrocynus vittatusfrom the Kruger National Park', Koedoe 38(1), 1-6. [ Links ]
Gaigher, I.G., 1967, 'Aspects of the ecology of the tigerfish, Hydrocynus vittatus Castlenau in the Incomati River system', Unpublished master's dissertation, University of Pretoria, Pretoria. [ Links ]
Gaigher, I.G., 1970, 'Ecology of the tigerfish (Hydrocynus vittatus) in the Incomati River system, South Africa', Zoologica Africana 5(2), 211-227. https://doi.org/10.1080/00445096.1970.11447393 [ Links ]
Gaigher, I.G., 1973, 'The habitat preferences of fishes from the Limpopo River system, Transvaal and Mozambique', Koedoe 16, 103-116. https://doi.org/10.4102/koedoe.v16i1.888 [ Links ]
Gaigher I.G., 1975, 'Evidence for tooth replacement in the tigerfish Hydrocynus vittatus', Arnoldia Rhodesia 7(1), 1-4. [ Links ]
Gery, J., 1977, Characoids of the world, T.F.H. Publications, New York, p. 672. [ Links ]
Gerber, R., Howatson, G., Greenfield, R., Wagenaar, I. & Smit, N., 2017, 'Physiological response to angling of Africa's premier angling species, the tigerfish Hydrocynus vittatus', Journal of African Zoology52(2), 91-98. https://doi.org/10.1080/15627020.2017.1300069 [ Links ]
Gerber, R., Smit, N.J., Pieterse, G.M. & Durholtz, D., 2009, 'Age estimation, growth and size at sexual maturity of tigerfish Hydrocynus vittatus from the Okavango Delta, Botswana', African Journal of Aquatic Science 34(3), 239-247. [ Links ]
Gertenbach, W.P.D., 1991, Problems facing Kruger National Park: First annual research meeting, 19-20 March 1991, Programme Report 2, 1-4, Kruger National Park, Skukuza. [ Links ]
Hocutt, C.H., Seibold, S.E. & Jesien, R.V., 1994, 'Potential use of biotelemetry in tropical continental waters', Revue d'hydrobiologie Tropicale, Paris 27, 77-95. [ Links ]
Jackson, P.B.N., 1961, 'The impact of predation, especially by Tigerfish, Hydrocynus vittatus, on African freshwater fishes', Proceedings of the Zoological Society London 136(4), 603-622. https://doi.org/10.1111/j.1469-7998.1961.tb05895.x [ Links ]
Jick, T.D., 1979, 'Mixing qualitative and quantitative methods: Triangulation in action', Administrative Science Quarterly 24, 602-611. https://doi.org/10.2307/2392366 [ Links ]
King, J.M., Tharme, R.E. & De Villiers, M.S., 2000, Environmental flow assessments for rivers: Manual for the building block methodology, WRC Report No: TT 131/60, Water Research Commission, Pretoria, p. 340. [ Links ]
Kruger National Park, Annual Reports, 1946-1992, Unpublished Report, National Parks Board. [ Links ]
Meulman, E.P. & Klomp, N.I., 1999, 'Is the home range of the heath mouse Pseudomys shortridgei an anomaly in the Pseudomys genus?', Victorian Naturalist 116, 196-201. [ Links ]
Moore, C.A. & Chutter, E.M., 1988, A survey of the conservation status and benthic biota of the major rivers of the Kruger National Park, Contract Report National Institute of Water Research, CSIR. [ Links ]
Odum, E.P., 1971, 'Fundamentals of ecology', Saunders, London. [ Links ]
Økland, F., Thorstad, E.B., Hay, C.J., Naesje, T.F. & Chanda, B., 2005, 'Patterns of movement and habitat use by tigerfish (Hydrocynus vittatus) in the Upper Zambezi River, Namibia', Ecology of Freshwater Fish 14, 79-86. https://doi.org/10.1111/j.1600-0633.2004.00080.x [ Links ]
Peake, S. & McKinley, R.S., 1997, 'Influence of transmitter attachment procedures on swimming performance of wild and hatchery-reared Atlantic salmon smolt', Transactions of the American Fisheries Society 126, 707-714. https://doi.org/10.1577/1548-8659(1997)126<0707:IOTAPO>2.3.CO;2 [ Links ]
Pienaar, U.V., 1978, The freshwater fishes of the Kruger National Park, National Parks Board of Trustees, Pretoria. [ Links ]
Roux, F., 2013, 'A study on the behaviour of tigerfish (Hydrocynus vitattus) using biotelemetry, to determine habitat utilisation and survival strategies in the lower Incomati River system', PhD dissertation, University of Johannesburg, Johannesburg, South Africa, viewed 29 January 2018 from http://hdl.handle.net/10210/12356 [ Links ]
Roux, F., Kleynhans, C.J., Thirion, C., Hill, L., Engelbrecht, J.S., Deacon, A.R. et al., 1990, 'Adaptive assessment and management of riverine ecosystems; The Crocodile/Elands River case study', Water SA25(4), 501-507. [ Links ]
Seaman, D.E. & Powell, R.A., 1996, 'An evaluation of the accuracy of kernel density estimators for home range analysis', Ecology 77, 2075-2085. https://doi.org/10.2307/2265701 [ Links ]
Silwerman, B.W., 1986, Density estimation for statistics and data analysis, Chapman and Hall, London, UK. [ Links ]
Skelton, P.H., 2001, A complete guide to the freshwater fishes of Southern Africa, Struik Publishers, South Africa. [ Links ]
Spedicato, M.S., Lembo, G. & Marmulla, G. (eds), 2005, Aquatic telemetry: Advances and applications, Food and Agricultural Organisation of the United Nations (FAO), Rome. [ Links ]
SPSS Inc., 2009, PASW Statistics for Windows, version 18.0, SPSS Inc., Chicago, IL. [ Links ]
Steyn, G.J., 1993, 'Physico-chemical characteristics of tigerfish semen', Southern African Journal of Wildlife Research 23, 44-47. [ Links ]
Steyn, G.J., Gagiano, C.L., Deacon, A.R. & Du Preez, H.H., 1996, 'Notes on the induced reproduction and development of tigerfish, Hydrocynus vittatus (Characidae), embryos and larvae', Environmental Biology of Fishes 47, 387-398. https://doi.org/10.1007/BF00005052 [ Links ]
Steyn, G.J. & Van Vuren, J.H.J., 1991, 'Cryopreservation of the spermatozoa of two African fishes (Characidae)', Southern African Journal of Wildlife Research 21, 76-81. [ Links ]
Thorstad, E.B., Økland, F. & Heggeberget, T.G., 2001, 'Are long term negative effects from external tags underestimated. Fouling of an externally attached telemetry transmitter', Journal of Fish Biology 59, 1092-1094. https://doi.org/10.1111/j.1095-8649.2001.tb00174.x [ Links ]
Van Loggerenberg, N.P., 1980, Kunsmatige teelt van die tiervis Hydrocynus vittatus Castelnau, en die biologiese aspekte wat daarmee verband hou, Projek TN 6/4/2/2/1/18, Transvaal Provinsiale Vissery Instituut, Lydenburg. [ Links ]
Van Loggerenberg, N.P., 1982, Kunsmatige teelt van die tiervis Hydrocynus vittatus Castelnau, in Transvaal, Vierde projekverslag, Projek TN 6/4/2/2/1/18, Transvaal Provinsiale Vissery Instituut, Lydenburg. [ Links ]
Van Loggerenberg, N.P., 1983, 'Conservation of tigerfish and fish farming techniques', Fauna and Flora40, 30-31. [ Links ]
Wilber, C.G., 1983, Turbidity in the aquatic environment. An environmental factor in fresh and oceanic waters, CC Thomas, Springfield, Illinois, USA. [ Links ]
Worton, B.J., 1989, 'Kernel methods for estimating the utilisation distribution in home range studies', Ecology 70, 164-168. https://doi.org/10.2307/1938423 [ Links ]
Correspondence:
Ina Wagenaar
inaw@uj.ac.za
Received: 21 Apr. 2016
Accepted: 05 Apr. 2018
Published: 27 June 2018
ORIGINAL RESEARCH
A survey of the ichthyofauna in the Noetsie Estuary, Western Cape Province, South Africa
Martin K.S. SmithI; Demi RodriguesII; Bianca CurrieIII
IRondevlei Scientific Services, South African National Parks, South Africa
IISchool of Natural Resource Management, Nelson Mandela University, South Africa
IIISustainability Research Unit, Nelson Mandela University, South Africa
ABSTRACT
The fish assemblage in the Noetsie Estuary, a temporarily open and closed estuary on the southern coast of South Africa, was sampled using multiple gears. A total of 12 species from 8 families were recorded. Collectively, estuarine-dependent marine species dominated seine net catches numerically and in terms of biomass for both sampling seasons. Estuarine round herring (Gilchristella aestuaria) was numerically the dominant species in late summer, while juvenile Mugilidae dominated catches in winter. Size class distributions of various fish species indicate that the estuary both serves a nursery function for important euryhaline marine species and supports estuarine resident taxa. Application of the Estuarine Fish Community Index indicates the ecological condition of the estuary to be 'good'. This study contributes to the species list for the estuary while also reporting the presence of an alien invasive freshwater species, Gambusia affinis. Recommendations include the development of a management plan and the formalisation of an estuarine management committee.
CONSERVATION IMPLICATIONS: The Noetsie Estuary serves a nursery function for important euryhaline marine species, while supporting healthy populations of estuarine resident taxa. The presence of one alien invasive fish species is documented with potential implications for the conservation of biodiversity in the estuary.
Introduction
South Africa has approximately 300 estuaries along its coastline (Whitfield 2000). Collectively, they play an important role in promoting fish species richness in South Africa (Harrison 2003) and are important nursery areas for several species of marine fishes, many of which are exploited (James & Harrison 2008). The ichthyofauna in estuaries along the southern coast of South Africa is fairly well known (Hall, Whitfield & Allanson 1987; James & Harrison 2008; Kok & Whitfield 1986; Olds et al. 2011; Russell 1996; Whitfield & Kok 1992). In a review, James et al. (2007) showed that the fish fauna in southern coast estuaries are dominated by juvenile estuary-dependent marine species, with strong contributions by Mugilidae and Sparidae. Native estuarine resident species are also abundant in most estuaries in this region (James & Harrison 2008), but a number of smaller estuaries, including the Noetsie, are data deficient (Whitfield 2000).
Anthropogenic influences on estuarine environments can impact food resources, distribution, breeding, growth and survival of fish assemblages (Whitfield & Elliott 2002). Despite the dynamic nature of fish assemblages within estuaries, fish communities have been used as indicators of estuary health (Harrison & Whitfield 2004) and can illustrate changes in the condition of estuarine environments (Whitfield 1997). The Estuarine Fish Community Index (EFCI) is a multi-metric fish index that integrates structural and functional attributes of estuarine fish communities to provide a robust method for assessing the ecological condition of estuarine systems (Harrison & Whitfield 2004). Understanding and being aware of changes in relative abundance and species composition is important for guiding and evaluating management actions (Olds et al. 2016) as they can reflect the state of the estuary and impact of management interventions.
Here we assess the diversity, abundance and size structure of the fish community within the Noetsie Estuary and compare the current EFCI scores with a previous assessment (Harrison & Whitfield 2006b).
Materials and methods
Study site
The Noetsie Estuary, situated just east of Knysna, borders the Garden Route National Park (Figure 1) and falls within the warm-temperate bioregion (Harrison 2003). Classified as a temporarily open and closed system, the overall condition is considered excellent (Whitfield 2000) and the ecological state is defined as largely natural with few modifications (DWAF 2008). However, based on the fish community, Harrison and Whitfield (2006b) rated the system as 'poor'. The Noetsie River has a total catchment of 38.8 km2 (NRIO 1987) and is one of the few estuaries that receives most of its natural mean annual run-off (Bornman & Adams 2005).
Physico-chemical properties
During each survey, selected physico-chemical parameters including water temperature (°C), pH, salinity (‰) and dissolved oxygen (mg L−1) were measured at six sites situated up the estuary (Figure 1). All readings were taken at the surface using a multi-parameter water analyser (YSI 550A Dissolved Oxygen; YSI Model 60 Handheld pH and Temperature; YSI Model 30 Handheld Salinity, Conductivity and Temperature instrument).
Ichthyofauna
Sampling was conducted in late summer (March) and winter (July) of 2015. Fish were sampled in the main channel of the estuary using a 30 m beach seine net (30 m × 2 m × 15 mm multifilament bar mesh in the wings and 5 mm bar mesh in the purse) at five sites spaced longitudinally up the estuary (Figure 1). Dense stands of common reeds (Phragmites australis) in the lower and middle reaches as well as steep sides and dense bush in the upper reaches limited beach seine net sites. One seine net pull was executed at each site on each sampling excursion. At each site, a scoop net (54 cm diameter hoop and 2 mm bar mesh) was also used to sample the shallows along roughly 15 m of shoreline (three samples each of 5 m).
A multi-mesh multifilament gillnet (stretched mesh sizes: 35 mm, 45 mm, 57 mm, 73 mm, 93 mm, 118 mm and 150 mm) with each panel being 5 m long was deployed for 2 hours at two sites, one middle and one lower (Figure 1).
Three double-ended fyke nets (10 mm stretched mesh, 5 m leader and 60 cm first hoop diameter) were set within the lower reaches of the estuary (Figure 1) parallel to the shoreline. Fyke nets were set at sunset in water approximately 1 m deep and retrieved the following day at sunrise.
All fish caught were identified to the lowest possible taxonomic level and measured to the nearest millimetre fork length (FL) before being released. Mullet (Mugilidae) caught below 80 mm were only recorded at family level.
Data analysis
Diversity was calculated as the total number of species and the number of species sampled per sampling trip. Total species composition, by number and mass, was calculated for each sampling period with the relative biomass contribution of each species calculated using masses derived from length-mass relationships presented in Harrison (2001). Where appropriate, species length-frequency histograms (20 mm size classes for Lichia amia and 10 mm size classes for all other species) were generated for each sampling trip. Species recorded were divided into the estuarine association categories described by Whitfield (1994): freshwater species, estuarine resident species, estuarine-dependent marine species and marine species. The per cent contribution made by each category to the total ichthyofaunal assemblage of each sampling trip was calculated in terms of number of species, relative abundance and relative mass.
Estuarine Fish Community Index
The EFCI developed by Harrison and Whitfield (2004) comprises 14 metrics that represent four broad fish community attributes: species diversity and composition, species abundance, nursery function and trophic integrity (Table 1). Metric reference conditions applicable to the Noetsie Estuary were developed from Table 5 presented in Harrison and Whitfield (2006a) and followed procedures set out in Harrison and Whitfield (2006b). Each metric was assessed according to the extent of its deviation from the reference condition with thresholds and scores being based on Harrison and Whitfield (2006b) (Table 1). The species assemblage was compared to the reference assemblage using the Bray-Curtis similarity measure based on presence or absence. Relative (%) contribution of each species for each sampling period and reference assemblage was 4th root transformed prior to running the Bray-Curtis similarity measure. For both these analyses, Mugilidae were included as a 'species' because of the large proportion of juvenile mullet that were not identified down to species level. The final EFCI score was calculated by summing the various scores. The biological condition of the estuary was designated a qualitative rating (very poor to very good) based on ranges described in Harrison and Whitfield (2006b). The EFCI was applied to the late summer and winter data sets, and final scores were compared to an assessment by Harrison and Whitfield (2006b). Bray-Curtis similarity analyses were performed using the Plymouth Routines in Multivariate Ecological Research package (PRIMER) (Clarke & Warwick 1994).

Results
Physico-chemical
Surface water temperature ranged between 18.9 °C and 22.6 °C during late summer and 11.3 °C and 13.2 °C in winter with only a slight drop in temperature occurring in the upper reaches for both sampling periods. Salinity was low throughout the estuary during late summer decreasing from 1.7‰ near the mouth to 0.2‰ at sites five and six. The estuary mouth was open during the winter sampling period, and a salinity gradient was present with the highest salinity (17.2‰) occurring near the mouth and the lowest (0.4‰) recorded at transect six. Surface water pH was relatively constant throughout the estuary during late summer ranging between 7.59 near the mouth and 7.02 at site six. During winter, the pH was generally lower and ranged from 5.95 near the mouth up to 6.59 at transect five. Oxygen levels in late summer showed a slight increase from transect one (4.65 mg L−1) to transect five (6.60 mg L−1) but varied between transects in winter with the lowest level (4.66 mg L−1) recorded at transect five and the highest (8.88 mg L−1) recorded in the lower reaches.
Ichthyofauna
A total of 731 fish representing 12 species and 9 families were sampled. Of these, one was catadromous (category V), two were estuarine residents (category I), eight were marine migrants (category II) and one was a freshwater species (category IV) (Table 2).
Seine net catches were dominated numerically by Gilchristella aestuaria and Mugilidae (unidentified mullet species) comprising 37.8% and 30.8% of total catch in late summer respectively. However, Mugilidae dominated catches (31.6%) during winter followed by G. aestuaria (25.8%). Euryhaline marine species (categories IIa, IIb and IIc) contributed 54.3% and 56.1% of total numbers of fish caught during the late summer and winter sampling trips, respectively, and dominated catches in terms of biomass comprising 85.5% and 60.7% of the entire sampled biomass, respectively (Table 2). Although estuarine resident species (Ib) were prominent in terms of numbers together comprising 43.3% and 28.4% of the total number of fish caught during late summer and winter, respectively, they only contributed 14.5% and 3.9% of the total biomass harvested. Fyke net catches in late summer were dominated by Rhabdosargus holubi (78.2%) both numerically and in terms of biomass (65.4%), while winter catches were dominated by Monodactylus falciformis (Table 2). One species, Anguilla mossambica, sampled in late summer, was not caught in any other gear type. Lichia amia was the only species caught within the gill nets (Table 2) during late summer, while M. falciformis (69.6%) dominated gill net catches numerically during winter followed by Liza richardsonii (17.4%). Scoop netting only resulted in one species, Gambusia affinis, being caught during both sampling periods with fewer and smaller individuals being caught in winter (Table 2).
Length-frequency distributions
The length-frequency distribution for G. aestuaria showed a high proportion of adult fish in the 50 mm - 70 mm (FL) size range during both late summer and winter with very few larger individuals or juveniles present during the late summer period (Figure 2). Lichia amia were only sampled during late summer with fish ranging in size from 440 mm FL to 515 mm FL. Most Mugilidae sampled during the two surveys were juveniles ranging in size from 11 mm to 71 mm FL (Figure 2). A greater distribution in size frequency for Mugillids was noted during late summer. Lithognathus lithognathus showed a shift in size class distribution between late summer and winter with larger individuals being sampled in winter (Figure 2). Both R. holubi and M. falciformis showed a wider size frequency distribution in late summer compared to winter with the larger size classes absent during the second sampling period (Figure 2).
Estuarine Fish Community Index
The total EFCI score for the late summer sampling period was 49, while the winter sampling scored 46. The final index scores of both correspond to a qualitative rating of good (scores fall between 46 and 62) (Harrison & Whitfield 2006b).
Discussion
Although temperature gradients along the length of small temporarily open and closed estuaries do not generally occur during their closed phase (Perissinotto et al. 2004), a difference of 3.4 °C was recorded during the late summer survey. Rainfall experienced just prior and during the sampling period lead to increased river inflow which is likely to have influenced both water temperatures in the upper sections and the lower salinity levels recorded throughout the estuary during late summer. Bornman and Adams (2005) indicate that limnetic conditions (0.1 ppt - 0.5 ppt) may prevail in the Noetzie Estuary through most of a closed phase. Although the lowest pH was recorded at transect five, near one of the main tributaries, pH was generally higher during the late summer survey. This is unusual as freshwater, because of the humic acid leached from catchment vegetation (DWAF 1995), is generally more acidic than sea water. Dissolved oxygen levels were generally lower than those reported by James and Harrison (2008) (6.2 mg L−1 - 6.6 mg L−1).
This survey recorded 12 species from 8 families, which is a substantial increase from the previous work by James and Harrison (2008) during which 7 species from 4 families were recorded. Additional species include L. amia, M. falciformis, A. mossambica and L. macrolepis, which are all species known to occur within southern Cape estuarine systems (James & Harrison 2008; Olds et al. 2011; Whitfield 1998). However, two species, Mugil cephalus and Myxus capensis, sampled by James and Harrison (2008) were not sampled during this survey. In addition, one alien invasive species, Gambusia affinis, was recorded for the first time within the system.
The numerical dominance of an estuarine resident species, in this case G. aestuaria, is not surprising as this group generally comprise over 50% of catches (numbers) in warm-temperate temporarily open and closed estuaries (James et al. 2007). Gilchristella aestuaria breed throughout the year completing their entire life cycle within the estuary (Whitfield 1998), and although the majority of G. aestuaria sampled were mature individuals; a wide range of size classes were sampled indicating that breeding was occurring within the estuary during the closed phase. Somewhat surprisingly, no Atherina brevicepswere sampled during this or previous surveys (James & Harrison 2008). Although there is an overlap in diet between the two species (Whitfield 1998), G. aesturia has been shown to switch diets and feeding strategies dependent on water clarity and food resources (Blaber, Cyrus & Whitfield 1981) which may provide a competitive edge in certain circumstances. Atherina breviceps was among the most abundant species captured in adjacent estuaries both to the west (James & Harrison 2008) and to the east of the Noetsie (James & Harrison 2010); however, although the frequency of occurrence within small closed estuaries in the warm-temperate region is quite high at 60%, the relative abundance is usually low at 4.98% (Harrison & Whitfield 2006a). Determining the reasons for their omission from Noetsie Estuary requires further work but is probably because of environmental preferences rather than competition.
Estuarine fish communities, in particular the estuary associated marine component, depend heavily on mouth state, and for temporarily open and closed estuaries, the frequency, duration and timing of opening events are important (James et al. 2007; Kok & Whitfield 1986). The near-natural mean annual run-off (Bornman & Adams 2005) controls the mouth dynamics of the system, which allows the migration of fish into and out of the system. The size class frequency distribution of R. holubi, L. lithognathus, L. amia, M. falciformis and Mugilidae within the Noetsie Estuary indicates that the estuary serves as both a viable nursery and a feeding area for juveniles. The absence of Myxus capensis and Mugil cephalus from the catches was unusual as these two species comprised 51.9% and 41.6% of the catch or 9.7% and 41.4% of the biomass, respectively, in a previous study (James & Harrison 2008). Identifying Muligids to species level would have provided a better understanding of recruitment and usage of the Noetsie Estuary by this family while providing a more robust data set for the EFCI calculations.
The improvement in the EFCI scores from 32 (Harrison & Whitfield 2006b) to 49 and 46 for the late summer and winter surveys, respectively, pushes the ecological condition category up from 'poor' to 'good'. A significant correlation between EFCI scores and mean EFCI values for systems sampled multiple times suggests that the EFCI is reproducible (Harrison & Whitfield 2006b) despite variability in fish communities. However, the improvement in score for the Noetsie is more than likely as a result of a more intensive sampling regime and the use of multiple gear types than an actual directional change in ecological condition. However, when utilising the EFCI on a single system over time, it would be beneficial to standardise sampling effort, sampling seasons and gear types to minimise potential biases.
The introduction of alien species is seen as one of the leading causes of biodiversity loss in aquatic ecosystems (Mack et al. 2000). Occurring naturally within south-eastern North America (Pyke 2008), G. affinis has been successfully introduced to most parts of the world (Lloyd 1986). Preferring sheltered, shallow and well-vegetated freshwater habitats (Arthington & Lloyd 1989), G. affinis are highly tolerant to a wide range of physico-chemical conditions (Pyke 2008) and can occur in waters with temperatures ranging from 0 °C to 45 °C (Cherry et al. 1976), salinities from 0 ‰ to 41 ‰ (Hubbs 2000) and dissolved oxygen from 1 mg L−1 to 11 mg L−1 (Odum & Caldwell 1955). The physico-chemical parameters measured during this and previous surveys of the Noetsie Estuary (Bornman & Adams 2005; James & Harrison 2008) were all within the G. affinis tolerance range.
In freshwater environments, G. affinis has been shown to impact ecosystems through both predation on and competition with native biota (Pyke 2008), but little is known about the impacts of G. affinis within estuarine environments. Potential impacts could include predation on juvenile fish and, in particular, the eggs of estuarine resident taxa. Work by Sloterdijk et al. (2015) indicates that in southern Cape estuaries, G. affinis populations seem to undergo a boom and bust scenario, with a rapid increase in abundance over spring and summer and a collapse during winter. Our results suggest G. affinis are limited in distribution to littoral waters and occur in low numbers in the Noetsie Estuary. However, a more detailed study with more sample sites over a longer period would be needed to accurately describe the population characteristics of this invasive species.
Conclusion
The Noetsie Estuary is important for estuarine resident species while serving as a viable nursery area for estuarine-associated marine species. The species list of fishes utilising the estuary has increased with an additional five indigenous species and one alien invasive freshwater species.
The state of the estuary mouth is the single most important factor driving the ecology in the Noetsie Estuary (Bornman & Adams 2005), and in turn, mouth dynamics are largely determined by river inflow. Changes in river flow will influence the relationship between open, semi-closed and closed mouth conditions. A decrease in the open and semi-closed phases would limit larval fish recruitment and adult movement out of the estuary, potentially having a negative influence on the associated fish community which should be avoided.
The ecological condition of the Noetsie Estuary is rated as 'good' showing an improvement from a previous assessment of 'poor'. To maintain the condition (or improve it), we recommend that an estuarine management plan be drafted which includes the monitoring and management of river inflows and the potential control or eradication measures needed for the recorded alien species. The plan should also include a sustainable participatory process for stakeholder involvement. We suggest that an estuarine management forum be established, which includes stakeholders influencing or are influenced by river inflows.
Future research should include assessing the change in physico-chemical characteristics and estuarine fish community between stable closed and open phases, as well as directed research assessing the distribution, abundance and ecological impacts of G. affinis throughout the catchment of the Noetsie Estuary.
Acknowledgements
Bheki Maphanga, Pierre Mouskie, Brian du Preez and Alison Macallister are thanked for assisting with data collection. Wendy Dewberry assisted with logistics, provided background information on Noetsie and helped catalyse this research. Aubrey Wynne-Jones is thanked for covering running costs and providing accommodation. SANParks provided all sampling equipment, and part of the running costs was covered by the Rondevlei Marine Protected Area budget. The two anonymous reviewers are thanked for their positive and helpful comments to improve the manuscript.
Competing interests
The authors declare that they have no financial or personal relationships which may have inappropriately influenced them in writing this article.
Authors' contributions
M.K.S.S. was responsible for the study conceptualisation, data collection, analyses, manuscript writing and editing. D.R. contributed to the study design, data collection, analyses and manuscript editing; and B.C. contributed to the study design and manuscript editing.
References
Arthington, A.H. & Lloyd, L.N., 1989, 'Introduced Poeciliidae in Australia and New Zealand', in G.K. Meffe & F.F. Snelson (eds.), Evolution and ecology of livebearing fishes (Poeciliidae), pp. 33-50, Prentice Hall, New York. [ Links ]
Blaber, S.J.M., Cyrus, D.P. & Whitfield, A.K., 1981, 'The influence of zooplankton food resources on the morphology of the estuarine clupeid Gilchristella aestuaria (Gilchrist, 1914)', Environmental Biology of Fishes 6, 351-355. https://doi.org/10.1007/BF00005764 [ Links ]
Bornman, T.G. & Adams, J.B., 2005, Present state of the Noetsie Estuary, IECM Research Report No. 45, Institute for Environmental and Coastal Management, Nelson Mandela Metropolitan University, Nelson Mandela Bay, 43p. [ Links ]
Cherry, D.S., Guthrie, R.K., Rodgers, J.H., Cairns, J. & Dickson, K.L., 1976, 'Response of mosquito fish (G. affinis) to ash affluent and thermal stress', Transaction of the American Fisheries Society 105, 686-694. https://doi.org/10.1577/1548-8659(1976)105%3C686:ROMGAT%3E2.0.CO;2 [ Links ]
Clarke, K.R. & Warwick, R.M., 1994, Change in marine communities: An approach to statistical analysis and interpretation, 1st edn., Plymouth Marine Laboratory, Plymouth, UK, 144p. [ Links ]
Department of Water Affairs and Forestry (DWAF), 1995, South African water quality guidelines for coastal marine waters. Volume 1: Natural environment, The Government Printer, Pretoria. [ Links ]
Department of Water Affairs and Forestry (DWAF), 2008, Reserve determination studies for selected surface water, groundwater, estuaries and wetlands in the Outeniqua (Groot Brak and other water resources, excluding wetlands) catchment: Ecological Water Requirement Study - estuarine RDM Report, volume 1.3: Assessment Report RDM/K40 - K50/00/CON/0307, vol. 1, Department of Water Affairs and Forestry, Pretoria. [ Links ]
Hall, C.M., Whitfield, A.K. & Allanson, B.R., 1987, 'Recruitment, diversity and the influences of constrictions on the distribution of fishes in the Wilderness lakes system, South Africa', South African Journal of Zoology 22, 163-168. https://doi.org/10.1080/02541858.1987.11448038 [ Links ]
Harrison, T.D., 2001, 'Length-weight relationships of fishes from South African estuaries', Journal of Applied Ichthyology 17, 46-48. https://doi.org/10.1046/j.1439-0426.2001.00277.x [ Links ]
Harrison, T.D., 2003, 'Biogeography and community structure of fishes in the Southern African Estuaries', PhD thesis, Rhodes University. [ Links ]
Harrison, T.D. & Whitfield, A.K., 2004, 'A multi-metric fish index to assess the environmental condition of estuaries', Journal of Fish Biology 65, 683-710. https://doi.org/10.1111/j.0022-1112.2004.00477.x [ Links ]
Harrison, T.D. & Whitfield, A.K., 2006a, 'Estuarine typology and the structuring of fish communities in South Africa', Environmental Biology of Fishes 75, 269-293. https://doi.org/10.1007/s10641-006-0028-y [ Links ]
Harrison, T.D. & Whitfield, A.K., 2006b, 'Application of a multimetric fish index to assess the environmental condition of South African estuaries', Estuaries and Coasts 29, 1108-1120. https://doi.org/10.1007/BF02781813 [ Links ]
Hubbs, C., 2000, 'Survival of Gambusia affinis in a hostile environment', Southwestern Naturalist 45, 521-522. https://doi.org/10.2307/3672601 [ Links ]
James, N.C., Cowley, P.D., Whitfield, A.K. & Lamberth, S.J., 2007, 'Fish communities in temporarily open/closed estuaries from the warm- and cool-temperate regions of South Africa: A review', Reviews in Fish Biology and Fisheries 17, 565-580. https://doi.org/10.1080/00359190809519216 [ Links ]
James, N.C. & Harrison, T.D., 2008, 'A preliminary survey of the estuaries on the south coast of South Africa, Cape St Blaize, Mossel Bay Robberg Peninsula, Plettenberg Bay, with particular reference to the fish fauna', Transactions of the Royal Society of South Africa 63, 111-127. https://doi.org/10.1080/00359190809519216 [ Links ]
James, N.C. & Harrison, T.D., 2010, 'A preliminary survey of the estuaries on the southeast coast of South Africa, Cape St Francis - Cape Padrone, with particular reference to the fish fauna', Transactions of the Royal Society of South Africa 65, 69-84. https://doi.org/10.1080/00359191003652116 [ Links ]
Kok, H.M. & Whitfield, A.K., 1986, 'The influence of open and closed mouth phases on the marine fish fauna of the Swartvlei estuary', South African Journal of Zoology 21, 309-315. https://doi.org/10.1080/02541858.1986.11448004 [ Links ]
Lloyd, L., 1986, 'An alternative to insect control by "mosquito fish", Gambusia affinis', Arbovirus Research in Australia 1986, 156-163. [ Links ]
Mack, R.N., Simberloff, D., Lonsdale, W.M., Evans, H., Clout, M. & Bazzaz, F.A., 2000, 'Biotic invasions: Causes, epidemiology, global consequences, and control', Ecological Applications 10, 689-710. https://doi.org/10.1890/1051-0761(2000)010[0689:BICEGC]2.0.CO;2 [ Links ]
National Research Institute for Oceanology (NRIO), 1987, Basic physical geography/hydro data for 'Estuaries' of the Southern Cape (CMS 0-50), NRIO Data Report D8706, Sediment Dynamics Division, Coastal Engineering and Hydraulics, NRIO, Council for Scientific and Industrial Research, Stellenbosch, 18 p. [ Links ]
Odum, H.T. & Caldwell, D.K., 1955, 'Fish respiration in the natural gradient of an anaerobic spring in Florida', Copeia 1955, 104-106. https://doi.org/10.2307/1439312 [ Links ]
Olds, A.A., James, N.C., Smith, M.K.S. & Weyl, O.L.F., 2016, 'Fish communities of the Wilderness Lakes System in the southern Cape, South Africa', Koedoe 58(1), a1364. https://doi.org/10.4102/koedoe.v58i1.1364 [ Links ]
Olds, A.A., Smith, M.K.S., Weyl, O.L.F. & Russell, I.A., 2011, 'Invasive alien freshwater fishes in the Wilderness Lakes System, a wetland of international importance in the Western Cape Province, South Africa', African Zoology 46, 179-184. https://doi.org/10.1080/15627020.2011.11407491 [ Links ]
Perissinotto, R., Blair, A., Connell, A., Demetriades, N.T., Forbes, A.T., Harrison, T.D. et al., 2004, 'Literature review: Ecology of South African temporarily open/closed estuaries: A review of current knowledge', in J.B. Adams (ed.), Contributions to the information requirements for the implementation of resource directed measures for estuaries. Volume 2. Responses of the biological communities to flow variation and mouth state in two KwaZulu-Natal temporarily open/closed estuaries, Water Research Commission Report No. 1247/2/04, pp. 1-55, Water Research Commission, Pretoria. [ Links ]
Pyke, G., 2008, 'Plague Minnow or Mosquito Fish? A review of the biology and impacts of introduced Gambusia species', Annual Review of Ecology, Evolution, and Systematics 39, 171-191. https://doi.org/10.1146/annurev.ecolsys.39.110707.173451 [ Links ]
Russell, I.A., 1996, 'Fish abundance in the Wilderness and Swartvlei lake systems: Changes relative to environmental factors', South African Journal of Zoology 31, 1-9. https://doi.org/10.1080/02541858.1996.11448389 [ Links ]
Sloterdijk, H., James, N.C., Smith, M.K.S., Ekau, W. & Weyl, O.L.F., 2015, 'Population dynamics and biology of an invasive population of mosquito fish Gambusia affinis in a temperate estuarine lake system', African Zoology 50(1), 31-40. https://doi.org/10.1080/15627020.2015.1021169 [ Links ]
Whitfield, A.K., 1994, 'An estuary-association classification for the fishes of southern Africa', South African Journal of Science 90, 411-417. [ Links ]
Whitfield, A.K., 1997, 'Fish conservation in South African estuaries', Aquatic Conservation: Marine and Freshwater Ecosystems 7, 1-11. https://doi.org/10.1002/(SICI)1099-0755(199703)7:1%3C1::AID-AQC213%3E3.0.CO;2-8 [ Links ]
Whitfield, A.K., 1998, Biology and ecology of fishes in Southern African estuaries, Ichthyological Monographs of the J.L.B. Smith Institute of Ichthyology, No 2, Grahamstown, p. 223. [ Links ]
Whitfield, A.K., 2000, Available scientific information on individual southern African estuarine systems, Water Research Commission Report 577/3/00, Water Research Commission, Pretoria, 217p. [ Links ]
Whitfield, A.K. & Elliott, M., 2002, 'Fishes as indicators of environmental and ecological changes within estuaries: A review of progress and some suggestions for the future', Journal of Fish Biology 61, 229-250. https://doi.org/10.1111/j.1095-8649.2002.tb01773.x [ Links ]
Whitfield, A.K. & Kok, H.M., 1992, 'Recruitment of juvenile marine fishes into permanently open and seasonally open estuarine systems on the southern coast of South Africa', Ichthyological Bulletin 57, 1-15. [ Links ]
Correspondence:
Martin Smith
kyle.smith@sanparks.org
Received: 18 Dec. 2017
Accepted: 11 Apr. 2018
Published: 16 July 2018
ORIGINAL RESEARCH
Long-term variability in vegetation productivity in relation to rainfall, herbivory and fire in Tswalu Kalahari Reserve
Wataru TokuraI, II; Sam L. JackII; Tania AndersonIII; Michael T. HoffmanII
IPercy FitzPatrick Institute of African Ornithology, University of Cape Town, South Africa
IIDepartment of Biological Sciences, University of Cape Town, South Africa
IIIPrivate, Johannesburg, South Africa
ABSTRACT
Exploring the long-term influence of climate and land use on vegetation change allows for a more robust understanding of how vegetation is likely to respond in the future. To inform management, this study investigated the relationship between vegetation productivity trends and potential drivers of change in the 110 000 ha of the Tswalu Kalahari Reserve between 2000 and 2015, using the Moderate Resolution Imaging Spectroradiometer Enhanced Vegetation Index (EVI, MOD13Q1). Spatio-temporal variability of the EVI was mapped and then related to the historical records of precipitation, animal numbers and fire occurrences. Long-term trends in productivity were analysed by residual trend analysis (RESTREND). Significantly different EVI profiles were found between vegetation types, and this was related to the structure and function of the vegetation, as well as the effects of soil reflectance. The EVI time-series signalled spatial and temporal heterogeneity in plant productivity, which was strongly correlated with rainfall, although fire and especially herbivory had noteworthy localised effects on productivity. The RESTREND identified a significant positive trend in plant productivity in shrub-dominated vegetation types, providing evidence for the ongoing thickening of woody species. Significant negative trends in productivity were associated with artificial water points and more heavily stocked areas, leading to degradation.
CONSERVATION IMPLICATIONS: The southern Kalahari has a highly variable rainfall regime, which is tied to a dynamic vegetation response. This variability should be taken into account when making management decisions. Field-based monitoring together with adaptive management approaches are needed in the face of an uncertain future in which significant warming is expected.
Introduction
Vegetation dynamics in arid environments are controlled to a large degree by abiotic factors such as temperature and moisture availability (Reynolds et al. 2004; Weltzin et al. 2003). Changes in moisture supply to vegetation, either directly via rainfall or indirectly in terms of the effects of rising temperatures on evaporation and transpiration rates, are therefore likely to have a significant effect on arid-adapted vegetation (Collins et al. 2014; Weltzin et al. 2003). Consequently, there is an expectation that anthropogenic climate change will have a disproportionate impact on arid systems. Indeed, recent declines in the equator-ward populations of certain arid region species, and a poleward shift in species' ranges as a result of physiological stress and/or changing inter-specific interactions between species, have already been documented (Cahill et al. 2012; Chen et al. 2011; Hickling et al. 2006).
Because of slow vegetation growth rates and episodic recruitment in arid environments, long-term monitoring studies have been crucial in revealing directional changes in these systems (Guo 2004; Lindenmayer et al. 2012; Rahlao et al. 2008). Although it can be difficult to discern the relative influence of different drivers on vegetation dynamics (Weltzin et al. 2003), drawing on long-term and large-scale ecological data sets can provide a more accurate representation and robust understanding of complex systems and enable more evidence-based conservation management (Lindenmayer et al. 2012). Earth Observation Data (EOD) derived from satellites have been used in a number of studies to monitor environmental change (Nagendra et al. 2013). With its broad spatial coverage, growing historical archive, temporal consistency and cost efficiency, EOD can circumvent the logistical challenges of field-based monitoring techniques (Mishra et al. 2015b; Nagendra et al. 2013). However, in the sparsely vegetated drylands context, the application of EOD for vegetation studies has certain challenges, such as considerable background noise in the Normalised Difference Vegetation Index (NDVI) values (Huete et al. 2002; Kong et al. 2015; Palmer & Van Rooyen 1998; Van Rooyen 2000), as well as in accounting for the overriding influence of rainfall over other factors (Wessels et al. 2007). Nevertheless, recent vegetation monitoring studies in the semi-arid Kalahari in southern Africa have successfully employed time-series NDVI or improved vegetation indices such as the Enhanced Vegetation Index (EVI), with careful interpretation aided by an understanding of the ecology and vegetation dynamics of the region (e.g. Colditz et al. 2007; Mishra et al. 2015a). Several techniques, such as rain use efficiency and residual trend analysis (RESTREND) (Wessels et al. 2007, 2012), have also been developed to isolate the effects of rainfall in order to discern the influence of other factors on dry land vegetation.
In relation to other drylands of the world, the southern Kalahari, located in the central-western region of southern Africa, has experienced some of the strongest warming in the historical record (Kruger & Sekele 2013). Moreover, modelled projections are for particularly severe climate change in this region in the 21st century, with reductions in moisture availability and higher evaporative loss as a result of marked temperature increases (Dai 2013; Engelbrecht et al. 2015; Shongwe et al. 2009). Several studies have reported on how historical warming may already be contributing to the reduced fitness of certain bird species (e.g. Cunningham et al. 2013; Du Plessis et al. 2012). However, the impact of historical and projected climate change on vegetation change in the southern Kalahari has received less attention, probably because of the difficulty of separating the influence of multiple interacting drivers of change that operate at different temporal and spatial scales.
Changes in the climate are happening against the backdrop of a shift in land use from extensive livestock production to private game reserves for tourism and hunting, as the latter becomes increasingly profitable (Cloete et al. 2007; Thomas & Paul 1991). However, little is known about the long-term consequences of such a shift on vegetation. For example, changes in vegetation composition, structure and productivity on livestock farms in the southern Kalahari have traditionally been ascribed to overstocking (Rutherford & Powrie 2010; Skarpe 1990) and the presence of boreholes (Palmer & Van Rooyen 1998; Van Rooyen & Van Rooyen 1998). The impact on the environment of free-roaming wild game, often kept at high densities and in the absence of predator species, has not been adequately assessed.
Both livestock production and game farming are heavily reliant on rainfall to ensure good forage. Therefore, an increase in aridity is likely to affect the stocking rates of both industries and erode the profitability of these enterprises. This is a cause of concern because rangelands in the Kalahari are known to be sensitive to overgrazing, with irreversible shifts from palatable perennial grasses to unpalatable woody shrubs, or to grasslands with a dominance of annual species (Rutherford & Powrie 2010; Skarpe 1990; Van Rooyen 2000). Additionally, an increase in atmospheric CO2 concentration is also likely to facilitate the thickening of woody plants, which might lead to a shift in the suitability of vegetation for grazers to a suitability for browsers, as has been observed elsewhere in southern Africa (Bond & Midgley 2012; O'Connor, Puttick & Hoffman 2014).
Given the sensitivity of the southern Kalahari to projected climate change and the complex ramifications of a shift in vegetation composition and structure on the natural environment and tourism industry, a robust understanding of the strengths of the relationships between arid-adapted vegetation and likely drivers of change, as well as rates of change, should be a priority. This study investigated the relationship between vegetation productivity trends and drivers of change over a 15-year period (2000-2015) in a 110 000 ha mega-reserve in the southern Kalahari. This study was conducted in order to determine the dominant drivers of vegetation productivity, and thereby better understand vegetation responses to current and future climate change. Earth Observation Data were used to (1) map plant communities; (2) analyse patterns of plant productivity in space and time; (3) relate changes to historical records for precipitation, animal numbers and fire; and (4) assess where unidirectional changes in productivity might represent the thickening of woody species or degradation. Finally, we reflect on the implications of the findings of this study for natural resource management in similarly arid, summer rainfall environments.
Research methods and design
Study site
Tswalu Kalahari Reserve (TKR, 27.2031 S 22.4673 E, 1020 km2) is situated in the Northern Cape province of South Africa (Figure 1). The climate is typically hot and arid with highly variable rainfall occurring mainly during summer (December-March). The mean annual rainfall and standard deviation for the past 25 years is 361.4 mm ± 169.2 mm (South African Weather Service 2015). The landscape is characterised by sandy plains and parallel sand dunes, while the quartzitic Korannaberg Mountains extend from north to south through the eastern half of the reserve (Davis et al. 2010). Five different vegetation units are mapped by Mucina and Rutherford (2006) for the TKR, including Koranna-Langeberg Mountain Bushveld, Gordonia Duneveld, Gordonia Plains Shrubveld, Olifantshoek Plains Thornveld and Kathu Bushveld.
Prior to 1995 the TKR was divided into more than 40 livestock farms, but was converted into a nature reserve by removing farm infrastructure (e.g. fences and livestock handling pens), closing several artificial water points and restocking with wildlife species (Davis et al. 2010). The TKR has undergone continual expansion in the last 20 years and the current size of the reserve exceeds 110 000 ha. Currently, 75 mammal species are present, most of which are grazing herbivores (e.g. gemsbok [Oryx gazelle], springbok [Antidorcas marsupialis] and blue wildebeest [Connochaetes taurinus]), with a lower number of browser species (e.g. greater kudu [Tragelaphus strepsiceros], giraffe [Giraffa camelopardalis] and black rhinoceros [Diceros bicornis]), omnivores and predators. The reserve is divided into three fenced areas, each with its own management plan (Figure 1). These are (1) the 'predator camp' in the north-east where lions [Panthera leo] are present, (2) the roan [Hippotragus equinus] and sable [Hippotragus niger] breeding camp in the north-west corner of the reserve, fenced off into ten sections and (3) the remainder of the reserve which supports the majority of the herbivores.
Data preprocessing
Vegetation types
To derive a vegetation map of the TKR, the cloud-free, geometrically corrected, multispectral Landsat 8 Operational Land Imager (OLI) data (captured on 02 April 2014, scene ID LC81740792014092LGN00), Band B2-B7 (blue, green, red, near infrared, SWIR1 and SWIR2) were used to perform supervised classification. The bands of images covered the entire reserve and were taken near the peak of the growth season in an above-average rainfall year. The obtained image was converted from a digital number to a top of atmosphere radiance and then corrected for the sun's angle during preprocessing before the analysis, using Geosud Toa Reflectance plugin (ver 1.0) in QGIS (ver 2.10 pisa, QGIS Development Team).
Preprocessed Landsat OLI data were used for the supervised classification with a random forest algorithm. A comprehensive set of photographs taken in May 2015 of the main vegetation units in the TKR was used to produce a training data set. This was augmented by high-resolution satellite images from Google Earth (ver 7.1.5.1557, Google Inc.) in combination with vegetation classes of the national vegetation map produced by Mucina and Rutherford (2006). Based on this approach, a total of 53 sampling areas were generated and 200 pixels were randomly selected per vegetation class. The 200 pixels were then split into 100 training pixels and 100 validation pixels. Subsequently, a supervised classification was performed using the random forest algorithm package 'rasclass' (ver 0.2.2) in R (ver 3.1.0, R Core Team 2013). The routines of post-processing were performed using QGIS (ver 2.10) and included filtering isolated pixels or noise. Accuracy was assessed by comparing the validation pixels against those in the produced map. The final product comprising a Landsat-based vegetation map was amalgamated into a single image and used in further analyses.
Vegetation productivity
Satellite images, which encompassed the reserve for the period February 2000 to November 2015, were obtained. The EVI product at 250 m resolution derived from the Moderate Resolution Imaging Spectroradiometer (MODIS, MOD13Q1 ver 005) was used as a proxy for plant productivity. This approach has been used previously for the monitoring of plant productivity in the Kalahari (Colditz et al. 2007; Hüttich et al. 2009). The MODIS EVI product has several advantages such as a reduction in atmospheric noise and a reduction in the variation in canopy background signals (Huete et al. 2002), as well as a decoupling of the influence of the variation in soil brightness (Solano et al. 2010).
The seasonality parameters of the EVI were extracted from time-series data using the software package TIMESAT (Jönsson & Eklundh 2004). This package can quantify noise-corrupted remote sensing time-series data by filtering each pixel for noise and identifying (1) phenological measurements such as the beginning and end of the plant growth season and (2) plant productivity, represented by the Small Integrated Value of EVI (SIV of EVI) (Jönsson & Eklundh 2004; Wessels et al. 2011). The adaptive Savitzky-Golay filter, with a window width of four data points, was applied to smooth the data. The season per year was set at one because vegetation in the Kalahari has one growth season per year. The start and end of the growth seasons were defined as a 20% increase in the seasonal amplitude, measured from the left and right minimum levels to the maximum of the seasonal curve. These values were determined not only by visually inspecting the fitted curve on the TIMESAT graphical user interface but also by referring to an earlier study from the region (Wessels et al. 2011). To illustrate spatio-temporal patterns of vegetation productivity, the SIV of EVI, quantified by TIMESAT, was mapped onto each growth season. The SIV of EVI provides a good estimate of the production of the seasonally dominant vegetation type (Fensholt et al. 2013; Jönsson & Eklundh 2004) for each pixel. Additionally, smoothed time-series data of EVI were extracted to understand the temporal variation in plant productivity.
Rainfall
Daily rainfall data collected from 30 rain gauges located within the TKR for the period 2001-2014 were used in the analysis. In addition, monthly rainfall records from five neighbouring rainfall stations (Van Zylsrus, Kathu, Severn, Wildebeesduin and Upington) were obtained from the South African Weather Service (2015).
A spatially continuous rainfall surface was generated by interpolating the rainfall records from the 35 stations distributed throughout and around the TKR. Firstly, the original data from rain gauges and weather stations were formatted by removing incomplete and suspect records. Next, total rainfall for the growth season, which starts at the beginning of October and ends at the end of September in the Savanna Biome of South Africa (Wessels et al. 2011), was calculated as the annual rainfall for each rainfall station.
To produce annual rainfall surfaces, ordinary kriging was performed because it is commonly used and appears to be preferable (Goovaerts 2000; Ly, Charles & Degré 2013). A spherical model was selected to fit a semi-variogram, while other parameters were set at default values. The annual rainfall surfaces were produced using the Geostatistical Analyst tool in ArcMap (ver 10.0, ESRI) for the 2001-2002 to 2013-2014 growth seasons at 250 m spatial resolution, which matched precisely to the MODIS raster image.
Herbivores
Changes in herbivore pressure were estimated using large animal units (LAUs), which is a standard metric for calculating commercial stocking densities (Van Rooyen 2010). The LAUs were determined from annual aerial count data provided by the TKR for the period 2005-2016 for the predator camp and the remainder of the TKR (excluding the roan and sable breeding camp).
Fire
The MODIS burned-area product (MCD45A1), which denotes monthly fire occurrence at 500 m resolution, was used to examine the effect of fire on plant productivity in the TKR. These data, from the beginning of the 2000-2001 growth season to the end of the 2014-2015 growth season, were downloaded. All the satellite data were obtained for the TKR from the National Aeronautics and Space Administration's Earth Observing System clearing house, Reverb (http://reverb.echo.nasa.gov/reverb/).
Data analysis
Relationship between vegetation productivity and potential drivers
The influence of the potential drivers (rainfall and herbivores) on vegetation productivity in the different vegetation types was analysed as a response variable in a linear mixed-effects model using the SIV of EVI as the explanatory variable. The interpolated annual rainfall surface and LAUs were used for this analysis to represent the effects of rainfall and herbivores. Vegetation types were assigned by upscaling the 30 m resolution Landsat-based vegetation map to a 250 m grid, which matched precisely to the MODIS data. Fire was not included in this model because of a limited number of fire occurrences and its contrasting effect on the SIV of EVI. As a result of the data availability, only the data between 2005-2006 and 2013-2014 in the predator camp and the remainder of the TKR (excluding the roan and sable breeding camp) were pooled into one data set. However, to avoid potential disproportional bias, the data from the 2006-2007 growth season were excluded as the TKR experienced a severe drought with little rainfall over this period. The growth season and id of pixels were added as random terms to account for pseudoreplication. Statistical analyses were done using the lmer function in 'lme4' and 'lmeTest' package in R (ver 3.1.0, R Core Team 2013). The effect of fire was visually assessed by comparing maps of the SIV of EVI and fire occurrence.
Degradation trend analysis (residual trend analysis)
Residual trend (RESTREND) was used to analyse each growth season using each growth season (October-September) as a time step for the duration of 13 growth seasons (2001-2002 to 2014-2015). RESTREND removes the effect of rainfall from the long-term trend in productivity, and in so doing is able to highlight areas where land degradation has occurred (Wessels et al. 2007). This analysis followed the method proposed by Wessels et al. (2007), except that rainfall was not log transformed because plant productivity was unlikely to level off in the water-limited environment of the Kalahari. Firstly, the regression analysis of the SIV of EVI (response variable) and annual rainfall (explanatory variable) was performed for each pixel; then the coefficient of determination (R2) and p-values were mapped. Following this, trends in the residuals, expressed as the difference between observed EVI and predicted EVI by rainfall, were regressed through the growth seasons (Wessels et al. 2007, 2012). The long-term trend represented by the slope of the linear regression of the trends in the residuals was mapped to determine the distribution pattern of degraded areas, defined as areas experiencing the degeneration of structure or function. Both regression analyses were performed per pixel, using a linear model function 'lm' in R (ver 3.1.0, R Core Team 2013). Data from the 2006-2007 growth season (October-September), when the TKR experienced a severe drought, were excluded from this analysis to avoid a potential disproportional bias affecting the underlying regression model.
To further assess the progress of degradation, standardised RESTREND values were computed over time in several areas in the TKR where significant decreasing or increasing trends were detected.
Results
Vegetation types
Five vegetation types were classified for the TKR, with the Landsat-based map producing greater spatial detail than that achieved by Mucina and Rutherford (2006) (Figure 1). Field observations found a general correspondence between topography, plant community structure and the Landsat-based vegetation types. For example, vegetation classified as Koranna-Langeberg Mountain Bushveld vegetation was composed predominantly of a mixture of trees and shrubs, Gordonia Duneveld was dominated by grasses, Gordonia Plains Shrubveld by dwarf shrubs and Olifantshoek Plains Thornveld by short (i.e. < 3 m high) woody shrubs such as Senegalia mellifera. In the Landsat-based vegetation map, there were a few exceptions such as around old artificial water points, which were often misclassified as Gordonia Plains Shrubland. Certain parts in the west of the TKR were also incorrectly designated as being part of the Koranna-Langeberg Mountain Bushveld. Boundaries of the Landsat-based vegetation types were also sometimes misclassified as a result of a similarity in vegetation structure and a mixture of species at the margins. This was particularly evident for Gordonia Duneveld and Gordonia Plains Shrubveld, and Kathu Bushveld and Olifantshoek Plains Thornveld, respectively. Notwithstanding the above discrepancies, overall classification accuracy was 86.2%, while the Kappa statistic was 0.83 (see Appendix 1).
Spatio-temporal patterns and variability of vegetation productivity
The overall geographical trend of the mean of the SIV of EVI was lower in the west and higher in the east, often delineated by the north-south axis of the Korannaberg Mountains (Figure 2). Differences in the spatial patterning of EVI values were assumed to relate to differences in physical vegetation attributes such as dominant growth forms, species composition and soil types. Extremely low EVI values corresponded to bare dune crests in the west and provincial roads in the east of the TKR, whereas abrupt changes in the SIV of EVI were observed at vegetation type boundaries (Figure 2).
The time-series analysis of EVI values demonstrated a seasonal cycle in plant productivity, with higher values in the summer and lower values in the winter. On average, the beginning of the growth season started in the period from December to January and ended in August to September (Figure 3). The time-series of EVI for the past 16 years for the TKR illustrated high inter-annual variability in plant productivity (Figures 2 and 3). Low EVI values were evident especially towards the east of the TKR, during the 2002-2003, 2003-2004, 2006-2007 and 2012-2013 growth seasons, which corresponded to periods of low annual rainfall (Figure 4). In the 2006-2007 growth season, when the annual rainfall was lowest for the study period, TIMESAT failed to quantify the productivity metrics for some pixels because of a low and indistinct peak in EVI values.

Relationship between vegetation productivity and potential drivers
Rainfall has been highly variable over time and space in the TKR over the past 15 years. However, a general spatial gradient was observed, with mean annual rainfall being higher in the east and lower in the west (Figure 4). As a result of the orographic effects of altitude, the Korannaberg Mountains probably receive higher rainfall than other areas in the TKR, although we could not confirm this because of a lack of rain gauges on the slopes and peaks of these mountains. Standard error of the rainfall surface within most of the areas in the TKR was less than 60 mm. The values varied depending on the growth season and location, and higher standard errors were estimated in the south-eastern corner of the reserve where the rainfall stations were relatively scarce (see Appendix 2).
In general, the number of herbivores within the main section of the TKR increased between 2005 and 2013 and thereafter remained relatively stable, although there was a slight decline in 2016 (Figure 5). The recorded decline between 2008 and 2010 was because of the capture and removal of extra-limital species by management and an unexplained decline in springbok numbers over this period. Herbivore numbers within the predator camp have remained stable throughout the recorded period.
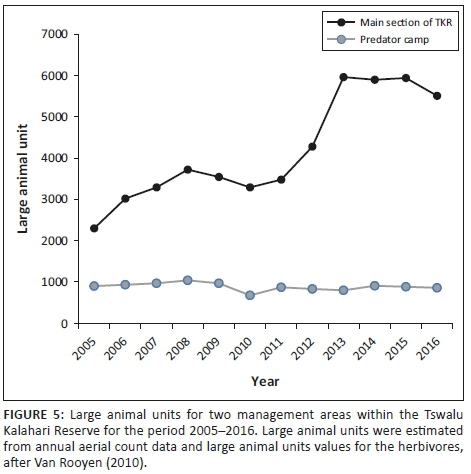
Three fire events affecting the reserve were evident from the MODIS burned-area product data. However, these fires were restricted to the Korannaberg Mountains in the south-eastern corner of the reserve, and most of the reserve had not burned during the study period (Figure 6). The impact of these fires on plant productivity was captured by the SIV of EVI, although the response was case specific. For example, the area south of the staff village, which was exposed to fire in January 2013, had a very low SIV of EVI value in 2012-2013, while the area that was burned in August to September 2012 had an even more muted response (Figure 2). Conversely, the area that burned outside the TKR in 2010 showed an increase in the SIV of EVI in the same season.
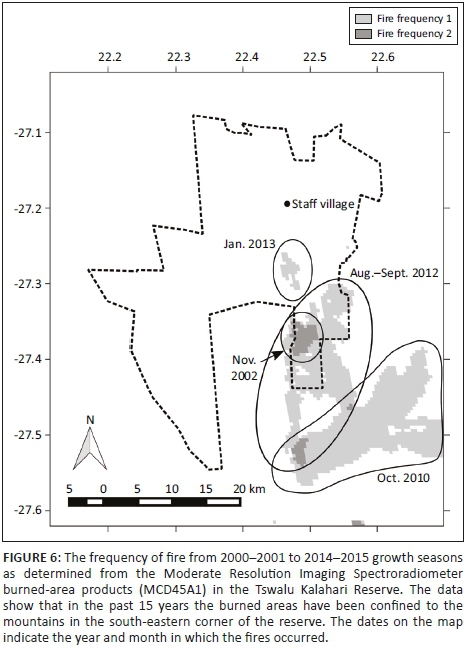
Results of the analysis using a linear mixed-effects model indicated that there is a significant positive effect of rainfall on the SIV of EVI (p < 0.001) (Table 1). The model also suggested different levels of effects from vegetation types (p < 0.001) and a relatively minor but significantly negative influence of LAUs (p < 0.001).
Degradation trend analysis (residual trend analysis)
Regression analysis between the SIV of EVI and annual rainfall indicated a significant positive correlation for most of the TKR (p < 0.05), except in the roan and sable breeding camp, as well as for parts of the Kathu Bushveld and Olifantshoek Plains Thornveld vegetation types (Figure 7). The trend in plant productivity computed by the RESTREND detected a significant positive trend in plant productivity in the east and south-west of the TKR, while a negative trend was detected in some locations in the centre and west of the reserve (Figure 8). The standardised RESTREND values from these areas demonstrated a relatively consistent and directional change over time (Figure 9). This suggested that the observed change was initiated before the 2000-2001 growth season and that the driver of change has remained the same. Most of the area that showed an increasing trend overlapped with shrub-dominated vegetation, especially the Olifantshoek Plains Thornveld in the east and Gordonia Plains Shrubveld in the south-west. Conversely, declines in productivity were observed for small areas of Gordonia Plains Shrubveld in the central and western area.

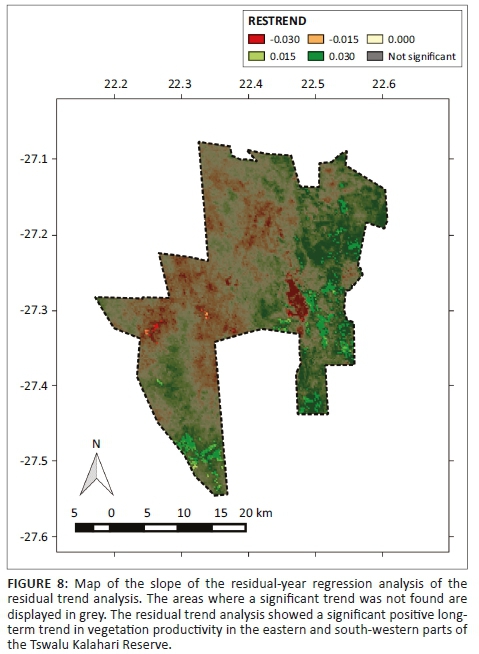
Discussion
Spatio-temporal patterns and variability of vegetation productivity
Variations in EVI values illustrated the spatio-temporal patterns of vegetation productivity through variable changes in vegetation cover. These included significant increases in annual grass cover in the wet season or conversely, dieback in the dry season (Van Rooyen et al. 1984). The EVI values typically increased with plant greening in late spring and summer, decreased in the late autumn and then remained low during the dry winter months. This cycle matched the findings of previous remote sensing studies in the Kalahari (Hüttich et al. 2009; Jolly & Running 2004; Mishra et al. 2015a; Wessels et al. 2011), as well as field observations (Sekhwela & Yates 2007), and confirmed the utility of EVI as a proxy for seasonal vegetation productivity cycles in this semi-arid region. It also highlighted the potential utility of this approach to aid wide-scale and real-time decision-making in terms of, for example, the determination of optimal stocking rates at a specific time, given the spatial assessment of rainfall in the preceding season.
Relationship between vegetation productivity and potential drivers
Not surprisingly, rainfall was found to be the most important factor in determining the spatial success or failure of inter- and intra-seasonal, as well as inter-annual, productivity (Masunga, Moe & Pelekekae 2013; Van Rooyen et al. 1990; Van Rooyen & Van Rooyen 1998). The effect of other factors such as herbivory was secondary to the influence of rainfall.
Different vegetation types had significantly different EVI phenological profiles, which suggests that plant structural and functional traits have an important influence on plant productivity. For example, woody plants, which increase in abundance from west to east in the TKR, generally demonstrated higher and more persistent greenness (Mishra et al. 2015a, 2015b) compared to the grass and low shrub-dominated vegetation of Gordonia Duneveld and Gordonia Plains Shrubveld. This increased productivity is mediated to a large degree by increasing rainfall and deeper rooting depths typically found in vegetation associated with Koranna-Langeberg Mountain Bushveld, Olifantshoek Plains Thornveld and Kathu Bushveld. The ubiquity of thorny species and the density of the vegetation also contributed to a reduction in browser pressure and therefore the persistence of greenness recorded in these vegetation types.
Notwithstanding the overwhelming influence of rainfall, the results suggested that herbivores negatively influence vegetation productivity. A decoupling between growth season rainfall and plant productivity was apparent, especially within the ten roan and sable breeding camps, which cover an area of 1250 ha in the north-western corner of the TKR. This area has a different management strategy to the rest of the reserve. It is characterised by high densities of economically valuable grazing herbivores and the provision of supplemental feed and water. The patterns observed within these camps point to a possible threshold stocking rate beyond which herbivory and associated impacts such as trampling and very low vegetation cover in general (which were clearly observable in the field) weakened the correlation between rainfall and EVI, and resulted in herbivore-driven degradation.
Fire has only occurred in limited areas and times in the TKR, and its effect on vegetation productivity has been localised. The observed response of fire in EVI was case specific. The SIV of EVI has decreased nearly to zero after the fire in the TKR in the 2012-2013 growth season, while the increase in the SIV of EVI, as seen in the area burned outside the TKR in 2010, may have been caused by the post-fire recovery processes. From these observations, it is assumed that the intensity and date of the fire influence several key characteristics of plant productivity in the growth season immediately after the fire.
Degradation and management implications
Residual trends provided a useful analytical approach in the southern Kalahari where the strong influence of erratic rainfall on annual productivity tends to overwhelm the contribution of other factors. Results of the RESTREND analysis suggested that the thickening of woody species has occurred in the eastern and south-western parts of the TKR. Although the process of the thickening of woody species has not been monitored, the direction and slope of trends implies that this process has progressed constantly over the course of the study period. Interestingly, certain lowland areas located within the predator camp in the eastern part of the TKR showed a poor correlation between rainfall and EVI and might also have experienced a thickening of woody plants, as the poor correlation indicates potential effects on vegetation productivity from factors other than rainfall. We speculate that a combination of lower herbivore stocking rates in the predator camp as a result of the presence of lions allows other factors such as low fire frequency, the densification of thorny vegetation and possibly the effects of high atmospheric CO2 concentrations (which favour woody species) to promote more rapid woody thickening in these areas (O'Connor et al. 2014). These factors act together to establish a positive feedback loop, which promotes further densification of woody species with a concomitant decrease in more flammable grass cover and the eventual 'switching off' of fire as a means of 'resetting' the system.
Earlier studies have noted that the thickening of woody species can have multiple possible drivers (see O'Connor et al. [2014] for an overview). Establishing the relative contribution of each of the potential drivers is often difficult because they interact and vary in space and time. However, irrespective of the cause for the shift from grass- to shrub-dominated vegetation, this change has important implications for several aspects of reserve management, including the ratio of grazers to browsers and associated stocking rates and the frequency of controlled burns. It is therefore likely that a more active management regime will be required in order to maintain the degree of openness in encroached landscapes and the associated ecology in terms of, for example, grazer-browser ratios, as well as the game-viewing experience available to visitors to the reserve.
In the drier west of the TKR, RESTREND identified a significant decreasing trend in vegetation productivity in some areas of Gordonia Plains Shrubveld and on dune slopes in Gordonia Duneveld. Standardised RESTREND values exhibited a continuously declining trend, which suggested that a persistent driver might be influencing this pattern. Because these areas have not been burned since 2000 and RESTREND analysis is able to exclude the effect of rainfall on vegetation productivity, the decline in productivity has likely been caused by the impact of herbivores. From our field observations, localised heavy grazing appears to have reduced vegetation cover in these areas, especially at sites close to artificial water points. Another possibility is that the difference in underlying soil types might influence the palatability and thus the grazing pressure from herbivores. However, validation or simulation of the data to test its robustness is recommended because RESTREND is statistically underpowered when shorter periods of time are analysed (e.g. less than 16 growth seasons) and is strongly influenced by the timing of degradation (Wessels et al. 2012). Nevertheless, it would be prudent for management to adopt a more conservative herbivore stocking rate or allow predator control of herbivore numbers in affected areas. This suggestion is underscored by unfavourable climate projections (Dai 2013; Engelbrecht et al. 2015; Shongwe et al. 2009), which are likely to negatively impact vegetation, and the known sensitivity of Kalahari rangelands to overgrazing (Jeltsch et al. 1997; Rutherford & Powrie 2010; Skarpe 1990; Van Rooyen 2000). These threats combine to pose a growing risk to natural resource managers in the southern Kalahari.
Given the current uncertainty in especially rainfall projections and inherent fine-scale spatial heterogeneity in vegetation, long-term field-based monitoring is also recommended in order to establish a more detailed understanding of the rate and magnitude of change within different vegetation types and across the rainfall gradient.
Conclusion
Variability in the spatial and temporal patterns of vegetation productivity, as well as long-term changes in this measure, were outlined for a large reserve in the southern Kalahari using MODIS EVI. The findings of this study confirmed known vegetation dynamics in the region, such as high spatial heterogeneity, seasonal change and extreme inter-annual variability of plant productivity shaped largely by erratic rainfall. Through RESTREND it was possible to isolate the effects of rainfall and provide evidence of potential overgrazing and the thickening of woody species in certain areas of the TKR. The thickening of woody species is likely to intensify and spread in future because of the effects of CO2 fertilisation, access by trees and shrubs to deeper and more consistent water supplies under more arid conditions and the establishment of feedback loops which could switch off grass-mediated fires. Additionally, degradation trends in the west hint at possibly high and unsustainable stocking rates, which, if left unchecked, may erode the carrying capacity in this area of the TKR and take many years to recover. These findings emphasise the need for a proactive and anticipatory management style, informed by an extensive climate, vegetation and animal monitoring programme. This combination is necessary in order to respond timeously and effectively to both current and future risks facing the southern Kalahari environment.
Acknowledgements
We thank Julian Smit, Christiaan J. Harmse, Claire Davis and Feroza Morris for their valuable technical advice and Bonginkosi Prince Ngomane, Armin du Plessis and Kelsey Green for fieldwork assistance. Konrad Wessels and Anthony R. Palmer provided comments to improve the manuscript. Parts of the rainfall record used in the analysis were provided by the South African Weather Service. We would also like to thank Dylan Smith and the Tswalu Kalahari Reserve for providing data, and Duncan MacFadyen and E Oppenheimer & Son for enabling this research.
Competing interests
The authors declare that they have no financial or personal relationships that may have inappropriately influenced them in writing this article.
Authors' contributions
W.T. and S.L.J. conducted the fieldwork. T.A. and M.T.H. conceptualised and designed the overall research. W.T. performed the data analysis and led the writing. All authors participated in the planning of the research, the interpretation of the findings and the critical revision of the manuscript.
References
Bond, W.J. & Midgley, G.F., 2012, 'Carbon dioxide and the uneasy interactions of trees and savannah grasses', Philosophical Transactions of the Royal Society B, 367(1588), 601-612. https://doi.org/10.1098/rstb.2011.0182 [ Links ]
Cahill, A.E., Aiello-Lammens, M.E., Fisher-Reid, M.C., Hua, X., Karanewsky, C.J., Ryu, H.Y. et al., 2012, 'How does climate change cause extinction?', Proceedings of the Royal Society B, 280(1750), 20121890. https://doi.org/10.1098/rspb.2012.1890 [ Links ]
Chen, I., Hill, J.K., Ohlemüller, R., Roy, D.B. & Thomas, C.D., 2011, 'Rapid range shifts of species associated with high levels of climate warming', Science 333(6045), 1024-1026. https://doi.org/10.1126/science.1206432 [ Links ]
Cloete, P.C., Taljaard, P.R. & Grové, B., 2007, 'A comparative economic case study of switching from cattle farming to game ranching in the Northern Cape province', South African Journal of Wildlife Research 37(1), 71-78. https://doi.org/10.3957/0379-4369-37.1.71 [ Links ]
Colditz, R.R., Gessner, U., Conrad, C., Van Zyl, D., Malherbe, J., Newby, T. et al., 2007, 'Dynamics of MODIS time series for ecological applications in southern Africa', Proceedings of the 2007 International Workshop on the Analysis of Multi-Temporal Remote Sensing Images, pp. 1-6, Leuven, Belgium, 18-20th July. https://doi.org/10.1109/MULTITEMP.2007.4293069 [ Links ]
Collins, S.L., Belnap, J., Grimm, N.B., Rudgers, J.A., Dahm, C.N., D'Odorico, P. et al., 2014, 'A multiscale, hierarchical model of pulse dynamics in arid-land ecosystems', Annual Review of Ecology, Evolution, and Systematics 45, 397-419. https://doi.org/10.1146/annurev-ecolsys-120213-091650 [ Links ]
Cunningham, S.J., Martin, R.O., Hojem, C.L. & Hockey, P.A.R., 2013, 'Temperatures in excess of critical thresholds threaten nestling growth and survival in a rapidly-warming arid savanna: A study of common fiscals', PLoS ONE 8(9), e74613. https://doi.org/10.1371/journal.pone.0074613 [ Links ]
Dai, A.G., 2013, 'Increasing drought under global warming in observations and models', Nature Climate Change 3, 52-58. https://doi.org/10.1038/nclimate1633 [ Links ]
Davis, A.L.V., Scholtz, C.H., Kryger, U., Deschodt, C.M. & Strümpher, W.P., 2010, 'Dung beetle assemblage structure in Tswalu Kalahari Reserve: Responses to a mosaic of landscape types, vegetation communities, and dung types', Environmental Entomology39(3), 811-820. https://doi.org/10.1603/EN09256 [ Links ]
Du Plessis, K.L., Martin, R.O., Hockey, P.A.R., Cunningham, S.J. & Ridley, A.R., 2012, 'The costs of keeping cool in a warming world: Implications of high temperatures for foraging, thermoregulation and body condition of an arid-zone bird', Global Change Biology 18, 3063-3070. https://doi.org/10.1111/j.1365-2486.2012.02778.x [ Links ]
Engelbrecht, F., Adegoke, J., Boape, M., Naidoo, M., Garland, R., Thatcher, M. et al., 2015, 'Projections of rapidly rising surface temperatures over Africa under low mitigation', Environmental Research Letters 10, 085004. https://doi.org/10.1088/1748-9326/10/8/085004 [ Links ]
Fensholt, R., Rasmussen, K., Kaspersen, P., Huber, S., Horion, S. & Swinnen, E., 2013, 'Assessing land degradation/recovery in the African Sahel from long-term Earth Observation based primary productivity and precipitation relationships', Remote Sensing5(2), 664-686. https://doi.org/10.3390/rs5020664 [ Links ]
Goovaerts, P., 2000, 'Geostatistical approaches for incorporating elevation into the spatial interpolation of rainfall', Journal of Hydrology 228(1-2), 113-129. https://doi.org/10.1016/S0022-1694(00)00144-X [ Links ]
Guo, Q., 2004, 'Slow recovery in desert perennial vegetation following prolonged human disturbance', Journal of Vegetation Science 15(6), 757-762. https://doi.org/10.1658/1100-9233(2004)015[0757:SRIDPV]2.0.CO;2 [ Links ]
Hickling, R., Roy, D.B., Hill, J.K., Fox, R. & Thomas, C.D., 2006, 'The distributions of a wide range of taxonomic groups are expanding polewards', Global Change Biology 12, 450-455. https://doi.org/10.1111/j.1365-2486.2006.01116.x [ Links ]
Huete, A.R., Didan, K., Miura, T., Rodriguez, E.P., Gao, X. & Ferreira, L.G., 2002, 'Overview of the radiometric and biophysical performance of the MODIS vegetation indices', Remote Sensing of Environment 83, 195-213. https://doi.org/10.1016/S0034-4257(02)00096-2 [ Links ]
Hüttich, C., Gessner, U., Herold, M., Strohbach, B.J., Schmidt, M., Keil, M. et al., 2009, 'On the suitability of MODIS time series metrics to map vegetation types in dry savanna ecosystems: A case study in the Kalahari of NE Namibia', Remote Sensing 1(4), 620-643. https://doi.org/10.3390/rs1040620 [ Links ]
Jeltsch, F., Milton, S.J., Dean, W.R.J. & Van Rooyen, N., 1997, 'Simulated pattern formation around artificial waterholes in the semi-arid Kalahari', Journal of Vegetation Science 8, 177-188. https://doi.org/188.10.2307/3237346 [ Links ]
Jolly, W.M. & Running, S.W., 2004, 'Effects of precipitation and soil water potential on drought deciduous phenology in the Kalahari', Global Change Biology 10, 303-308. https://doi.org/10.1046/j.1365-2486.2003.00701.x [ Links ]
Jönsson, P. & Eklundh, L., 2004, 'TIMESAT - A program for analyzing time-series of satellite sensor data', Computers and Geosciences 30(8), 833-845. https://doi.org/10.1016/j.cageo.2004.05.006 [ Links ]
Kong, T.M., Marsh, S.E., Van Rooyen, A.F., Kellner, K. & Orr, B.J., 2015, 'Assessing rangeland condition in the Kalahari Duneveld through local ecological knowledge of livestock farmers and remotely sensed data', Journal of Arid Environments, 113, 77-86. https://doi.org/10.1016/j.jaridenv.2014.10.003 [ Links ]
Kruger, A.C. & Sekele, S.S., 2013, 'Trends in extreme temperature indices in South Africa: 1962-2009', International Journal of Climatology 33(3), 661-676. https://doi.org/10.1002/joc.3455 [ Links ]
Lindenmayer, D.B., Likens, G.E., Andersen, A., Bowman, D., Bull, C.M., Burns, E. et al., 2012, 'Value of long-term ecological studies', Austral Ecology 37(7), 745-757. https://doi.org/10.1111/j.1442-9993.2011.02351.x [ Links ]
Ly, S., Charles, C. & Degré, A., 2013, 'Different methods for spatial interpolation of rainfall data for operational hydrology and hydrological modeling at watershed scale: A review', Biotechnology, Agronomy, Society and Environment 17(2), 392-406, viewed 21 December 2015, from http://hdl.handle.net/2268/136084 [ Links ]
Masunga, G.S., Moe, S.R. & Pelekekae, B., 2013, 'Fire and grazing change herbaceous species composition and reduce beta diversity in the Kalahari sand system', Ecosystems16(2), 252-268. https://doi.org/10.1007/s10021-012-9611-6 [ Links ]
Mishra, N.B., Crews, K.A., Miller, J.A. & Meyer, T., 2015a, 'Mapping vegetation morphology types in southern Africa savanna using MODIS time-series metrics: A case study of central Kalahari, Botswana', Land 4(1), 197-215. https://doi.org/10.3390/land4010197 [ Links ]
Mishra, N.B., Crews, K.A., Neeti, N., Meyer, T. & Young, K.R., 2015b, 'MODIS derived vegetation greenness trends in African savanna: Deconstructing and localizing the role of changing moisture availability, fire regime and anthropogenic impact', Remote Sensing of Environment 169, 192-204. https://doi.org/10.1016/j.rse.2015.08.008 [ Links ]
Mucina, L. & Rutherford, M.C., 2006, The vegetation of South Africa, Lesotho and Swaziland, South African National Biodiversity Institute, Pretoria. [ Links ]
Nagendra, H., Lucas, R., Honrado, J.P., Jongman, R.H.G., Tarantino, C., Adamo, M. et al., 2013, 'Remote sensing for conservation monitoring: Assessing protected areas, habitat extent, habitat condition, species diversity, and threats', Ecological Indicators33, 45-59. https://doi.org/10.1016/j.ecolind.2012.09.014 [ Links ]
O'Connor, T.G., Puttick, J.R. & Hoffman, M.T., 2014, 'Bush encroachment in southern Africa: Changes and causes', African Journal of Range and Forage Science 31(2), 67-88. https://doi.org/10.2989/10220119.2014.939996 [ Links ]
Palmer, A.R. & Van Rooyen, A.F., 1998, 'Detecting vegetation change in the southern Kalahari using Landsat TM data', Journal of Arid Environments 39(2), 143-153. https://doi.org/10.1006/jare.1998.0399 [ Links ]
Rahlao, S.J., Hoffman, M.T., Todd, S.W. & McGrath, K., 2008, 'Long-term vegetation change in the Succulent Karoo, South Africa following 67 years of rest from grazing', Journal of Arid Environments 72(5), 808-819. https://doi.org/10.1016/j.jaridenv.2007.08.003 [ Links ]
R Core Team, 2013, R: A language and environment for statistical computing, R Foundation for Statistical Computing, Vienna. [ Links ]
Reynolds, J.F., Kemp, P.K., Ogle, K. & Fernández, R.J., 2004, 'Modifying the "pulse-reserve" paradigm for deserts of North America: Precipitation pulses, soil water, and plant responses', Oecologia 141(2), 194-210. https://doi.org/10.1007/S00442-004-1524-4 [ Links ]
Rutherford, M.C. & Powrie, L.W., 2010, 'Severely degraded dunes of the southern Kalahari: Local extinction, persistence and natural re-establishment of plants', African Journal of Ecology 48(4), 930-938. https://doi.org/10.1111/j.1365-2028.2009.01194.x [ Links ]
Sekhwela, M.B.M. & Yates, D.J., 2007, 'A phenological study of dominant acacia tree species in areas with different rainfall regimes in the Kalahari of Botswana', Journal of Arid Environments 70(1), 1-17. https://doi.org/10.1016/j.jaridenv.2006.12.006 [ Links ]
Shongwe, M.E., Van Oldenborgh, G.J., Van den Hurk, B.J.J.M., De Boer, B., Coelho, C.A.S. & Van Aalst, M.K., 2009, 'Projected changes in mean and extreme precipitation in Africa under global warming. Part I: Southern Africa', Journal of Climate 22(13), 3819-3837. https://doi.org/10.1175/2009JCLI2317.1 [ Links ]
Skarpe, C., 1990, 'Shrub layer dynamics under different herbivore densities in an arid savanna, Botswana', Journal of Applied Ecology 27(3), 873-885. https://doi.org/10.2307/2404383 [ Links ]
Solano, R., Didan, K., Jacobson, A. & Huete, A., 2010, MODIS Vegetation Index user's guide (MOD13 Series), viewed 09 November 2015, from http://vip.arizona.edu/documents/MODIS/MODIS_VI_UsersGuide_01_2012 [ Links ]
South African Weather Service, 2015, Monthly rainfall data (1990-2015), Pretoria. [ Links ]
Thomas, D.S.G. & Paul, A.S., 1991, The Kalahari environment, Cambridge University Press, Cambridge. [ Links ]
Van Rooyen, A.F., 2000, 'Rangeland degradation in the southern Kalahari', PhD thesis, Department of Range and Forage Science, University of Natal, Pietersmaritzburg. [ Links ]
Van Rooyen, N., 2010, 'Veld management in the African savannas under current climatic conditions: Ecological and economic wildlife stocking rates', in J. du P. Bothma & J.G. du Toit (eds.), Game ranch management, 5th edn., pp. 801-815, Van Schaik Publishers, Pretoria. [ Links ]
Van Rooyen, N., Bezuidenhout, D., Theron, G.K. & Bothma, J.d.P., 1990, 'Monitoring of the vegetation around artificial watering points (windmills) in the Kalahari Gemsbok National Park', Koedoe 33(1), 63-88. https://doi.org/10.1006/jare.1994.1037 [ Links ]
Van Rooyen, N., Van Rensburg, D.J., Theron, G.K. & Bothma, J.d.P., 1984, 'A preliminary report on the dynamics of the vegetation of the Kalahari Gemsbok National Park', Koedoe (Supplement), 83-102. https://doi.org/10.4102/koedoe.v27i2.570 [ Links ]
Van Rooyen, N. & Van Rooyen, M.W., 1998, 'Vegetation of the south-western arid Kalahari: An overview', Transactions of the Royal Society of South Africa 53(2), 113-140. https://doi.org/10.1080/00359199809520381 [ Links ]
Weltzin, J.F., Loik, M.E., Schwinning, S., Williams, D.G., Fay, P.A., Haddad, B.M. et al., 2003, 'Assessing the response of terrestrial ecosystems to potential changes in precipitation', BioScience 53(10), 941-952. https://doi.org/10.1641/0006-3568(2003)053[0941:ATROTE]2.0.CO;2 [ Links ]
Wessels, K.J., Prince, S.D., Malherbe, J., Small, J., Frost, P.E. & Van Zyl, D., 2007, 'Can human-induced land degradation be distinguished from the effects of rainfall variability? A case study in South Africa', Journal of Arid Environments 68(2), 271-297. https://doi.org/10.1016/j.jaridenv.2006.05.015 [ Links ]
Wessels, K.J., Steenkamp, K., Von Maltitz, G. & Archibald, S., 2011, 'Remotely sensed vegetation phenology for describing and predicting the biomes of South Africa', Applied Vegetation Science 14(1), 49-66. https://doi.org/10.1111/j.1654-109X.2010.01100.x [ Links ]
Wessels, K.J., Van den Bergh, F. & Scholes, R.J., 2012, 'Limits to detectability of land degradation by trend analysis of vegetation index data', Remote Sensing of Environment125, 10-22. https://doi.org/10.1016/j.rse.2012.06.022 [ Links ]
Correspondence:
Wataru Tokura
turaturawako@hotmail.co.jp
Received: 03 May 2017
Accepted: 20 May 2018
Published: 31 July 2018
Note: This article is partly based on the thesis by Wataru Tokura, 'Understanding changes in plant productivity using EVI satellite data in Tswalu Kalahari Reserve', available at https://open.uct.ac.za/handle/11427/20933

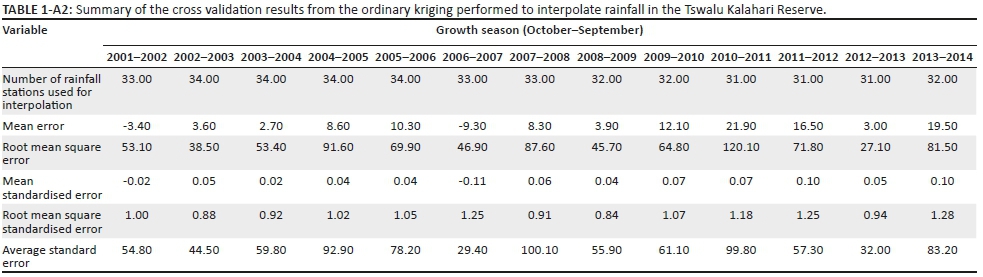
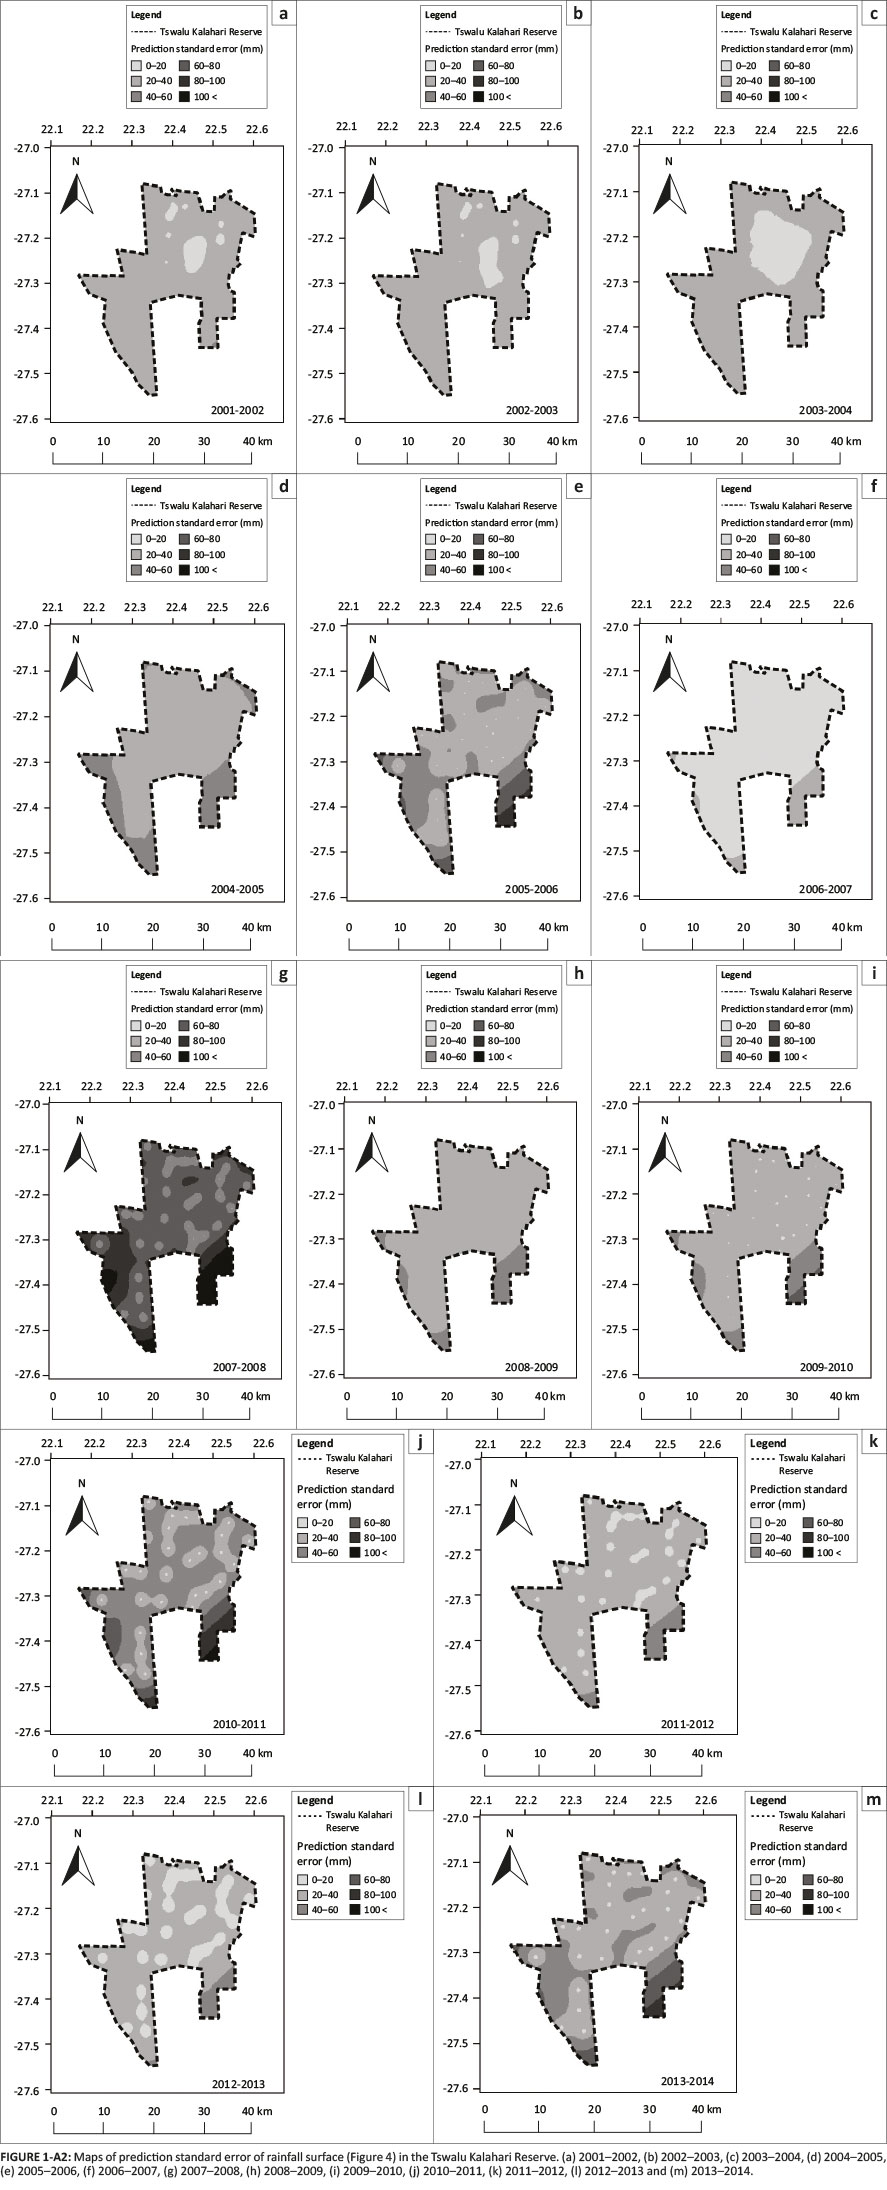
Figure 1-A2 - Click to enlarge
SHORT COMMUNICATION
Blowflies as vectors of Bacillus anthracis in the Kruger National Park
Lizanne BassonI, II; Ayesha HassimI; At DekkerIII; Allison GilbertII, IV; Wolfgang BeyerV; Jennifer RossouwII; Henriette van HeerdenI
IDepartment of Veterinary Tropical Diseases, University of Pretoria, South Africa
IICentre for Emerging, Zoonotic and Parasitic Diseases, National Institute for Communicable Diseases, South Africa
IIIState Veterinarians Office, Kruger National Park, South Africa
IVWits Research Institute for Malaria, University of the Witwatersrand, South Africa
VDepartment of Livestock Infectiology and Environmental Hygiene, University of Hohenheim, Germany
ABSTRACT
Anthrax, caused by Bacillus anthracis, is endemic in the Kruger National Park (KNP). The epidemiology of B. anthracis is dependent on various factors including vectors.
The aims of this study were to examine non-biting blowflies for the presence of B. anthracis externally and internally after feeding on an anthrax-infected carcass and to determine the role of flies in disseminating B. anthracis onto the surrounding vegetation.
During an anthrax outbreak in 2014 in the endemic Pafuri region, blowflies associated with two 2-3-day-old anthrax-positive carcasses (kudu and impala) as well as surrounding vegetation were collected and investigated for the presence of B. anthracis spores.
The non-biting blowflies (n = 57) caught included Chrysomya albiceps, Ch. marginalis and Lucilia spp. Bacillus anthracis spores were isolated from 65.5% and 25.0% of blowflies collected from the kudu and impala carcasses, respectively.
Chrysomya albiceps and Ch. marginalis have the potential to disseminate B. anthracis to vegetation from infected carcasses and may play a role in the epidemiology of anthrax in the KNP. No B. anthracisspores were initially isolated from leaves of the surrounding vegetation using selective media. However, 170 and 500 spores were subsequently isolated from Abutilon angulatum and Acacia sp. leaves, respectively, when using sheep blood agar.
CONSERVATION IMPLICATIONS: The results obtained in this study have no direct conservation implications and only assist in the understanding of the spread of the disease.
Introduction
Anthrax is a serious zoonotic disease affecting mainly herbivores. It is caused by the soil-borne, Gram-positive, spore-forming organism Bacillus anthracis. In unfavourable conditions, B. anthracis forms endospores that can remain dormant in the environment for long periods of time surviving outside the host. The spores are ingested by a susceptible host, where germination and multiplication occur in vivo. The host dies and the carcass is opened by scavengers or human, resulting in the vegetative cells being exposed to oxygen and sporulating; remaining in the soil until another host ingests the spores and the cycle is repeated (Dragon & Rennie 1995). Anthrax occurs endemically in the northern Kruger National Park (KNP) and the Northern Cape Province (Ghaap plateau area) in South Africa (Hugh-Jones & De Vos 2002). The disease cannot spread from one living animal to the next; therefore, the life cycle is dependent on various factors including rainfall, temperature, type of soil, animal densities and the presence of susceptible hosts (Dragon & Rennie 1995).
A number of abiotic and biotic vectors such as insects (biting flies, blowflies, mosquitoes and ticks) (Blackburn et al. 2010; Fasanella et al. 2010; Graham-Smith 1913; Turell & Knudson 1987), scavengers (Pienaar 1961, 1967), soil (Hugh-Jones & Blackburn 2009) and water (Hugh-Jones & De Vos 2002; Pienaar 1961) have also been implicated in the dissemination of anthrax. The main insect vectors implicated with anthrax in the KNP are the blowflies Chrysomya albiceps and Ch. marginalis(Braack 1985) as these species are the first (and most abundant) insects to arrive shortly after death. These two species consume infected bodily fluids and are probably the principal vectors in the dissemination of B. anthracis (Braack 1985; Braack & Retief 1986). Chrysomya albiceps and Ch. marginalis have been hypothesised to spread the bacteria over short distances despite the fact that blowflies have the ability to travel great distances (35 km - 65 km). They normally rest on nearby vegetation when engorged and deposit most of the contaminated defaecation and/or vomit droplets close to the carcass (Braack & De Vos 1990; De Vos 1990) of vegetation (reviewed by De Vos 1994), which pose a risk of infection to susceptible herbivores.
In KNP, outbreaks were usually associated with the driest periods of the year (winter and early spring) or during climatic dry cycles (Pienaar 1967). However, since the 2010 outbreak onwards, outbreaks mainly occurred in wet periods (summer months; E.H. Dekker [Skukuza State Veterinary Office] pers. comm., 2014). This is of importance as insect activity and abundance on a carcass is influenced by climate. In the rainy season, the insect abundance (especially the blowflies) will increase, which was speculated by Braack (1985) to increase B. anthracis dissemination by blowflies to vegetation during an outbreak. Scavengers have also been speculated to disseminate spores at drinking holes after opening and feeding on anthrax-infected carcasses (Pienaar 1961). Research conducted by Turner et al. (2014, 2016) indicated that grazing seems to play a significant role in the dissemination of B. anthracis in Etosha National Park. Similar investigations must be performed in KNP to determine the factors influencing the epidemiology of anthrax as well as the amount of spores found on flies and the bacterial load defaecated or regurgitated by flies on vegetation.
In this study, we investigated the possible role of blowflies in carrying and/or spreading B. anthracisduring an anthrax outbreak in the KNP. This aim was investigated by quantifying the presence of B. anthracis on the exterior and interior of blowflies after feeding on an anthrax-contaminated carcass. Furthermore, the role of blowflies in the dissemination of B. anthracis onto the surrounding vegetation during the anthrax outbreak in the KNP was also investigated.
Materials and methods
Blowfly collection and identification
In March 2014 - April 2014, blowflies were collected from two confirmed anthrax-positive carcasses (a kudu and an impala) during an anthrax outbreak in the endemic Pafuri region of the KNP. The adult male kudu carcass was approximately 2-3 days old, lying in the open with clear indications that scavengers (vultures and/or hyenas) had started to feed on it. The adult male impala carcass infected with anthrax was about three days old, lying under a low thorn tree (Acacia sp.). The carcass was mostly intact, except for a large opening in the abdomen region. A net trap was used to collect the blowflies on the carcass. Trapped flies were collected and placed in liquid nitrogen for 30 seconds and transported at 4 °C to the National Institute for Communicable Diseases (NICD) for further bacteriological analysis. All blowflies were kept, while other flies were discarded. Each blowfly was identified and sexed using the identification method described by Zumpt (1965). Blowflies that were not phenotypically or morphologically distinguishable were identified by sequencing of the ribosomal DNA internally transcribed spacer 2 (ITS 2) region that differentiates Calliphoridae as described by Koekemoer et al. (2002).
Isolation of Bacillus anthracis from blowflies
Each blowfly was tested for the presence of B. anthracis vegetative cells and spores on the interior and exterior surfaces. To detect the presence of B. anthracis on exterior surfaces, each blowfly was washed in 1 mL sterile saline to remove any bacteria. The presence of B. anthracis vegetative cells was determined by plating 10-fold dilutions (100-108) from the external wash onto polymyxin-EDTA-thallium acetate (PET; modified polymyxin-lysozyme-EDTA-thallium acetate [PLET] where lysozyme was omitted) agar plates followed by incubation at 37 °C for 48 hours. The presence of B. anthracis spores was determined by plating 100 µL heat-treated (62.5 °C for 15 min) undiluted external wash on PET agar, followed by incubation at 37 °C for 48 h.
After the exterior wash step, each blowfly was disinfected with 1 mL 0.1% (v/v) peracetic acid for 1 h to inactivate any residual bacteria left over on the exterior of the blowfly after the wash step. The 0.1% peracetic acid (v/v) was neutralised by 1 mL 0.8% sodium bicarbonate - sodium chloride (v/v) solution for 1 h. One-hundred microliters of the neutralised external wash was inoculated onto 5% sheep blood agar (SBA) and incubated at 37 °C for 24 h to ensure that no bacteria were present on exterior surface of the blowflies.
The presence of internal (ingested) B. anthracis was determined by homogenising each blowfly in 1 mL saline. The homogenised blowfly was briefly centrifuged (500×g for 5 s) to separate the blowfly debris from the supernatant. Tenfold serial dilutions (100-108) of the supernatant were prepared and plated on PET agar and incubated at 37 °C for 48 h. The presence of B. anthracis spores was determined by plating 100 µL heat-treated undiluted supernatant onto PET followed by incubation at 37 °C for 48 h.
Isolation of Bacillus anthracis from vegetation
Leaves from shrubs with blowfly defaecation or discard droplets around the infected carcasses were collected and transported at 4 °C to the NICD. Each defaecation or discard droplet was removed from the leaves by using a transport swab pre-wetted with saline, followed by the swabs being rinsed in 1 mL sterile water. Bacillus anthracis was detected by plating 100 µL undiluted wash before and after heat treatment on PET and SBA plates followed by incubation at 37 °C for 48 h. Leaves without any defaecation or discard droplets were sent to Prof. K. Eloff at the University of Pretoria for identification and to determine antibacterial activity. The minimum inhibitory concentration (MIC in mg/mL) of acetone extracts of the plant was tested against five bacterial organisms (Escherichia coli, Enterococcus faecalis, Pseudomonas aeruginosa, Staphylococcus aureus and B. anthracis Sterne) using the protocol as previously described by Eloff (1998).
Confirmation of Bacillus anthracis
Bacillus anthracis isolates were identified based on the characteristic colony morphology (ground glass appearance, fairly flat, more tacky and white or grey-white), no haemolytic activity, penicillin sensitivity and gamma phage sensitivity after 24 h incubation at 37 °C on 5% SBA as described by World Health Organization (2008). Each confirmed B. anthracis colony of vegetative cell and spores was counted and recorded, followed by the calculation of total colony forming units per fly (CFU/fly).
Results
The two carcasses were confirmed to be anthrax-positive through the presence of bacilli and endospores in a Giemsa-stained blood smear as well as through the isolation of B. anthracis through culture. Twenty-nine blowflies were collected from the kudu carcass and 28 blowflies from the impala carcass (Table 1). Chrysomya marginalis, Ch. albiceps and Lucilia spp. females were collected from the kudu carcass (with a female:male ratio of 3:1), whereas only Ch. marginalis males and females were collected from the impala carcass (female:male ratio of 2:5) (Table 1).
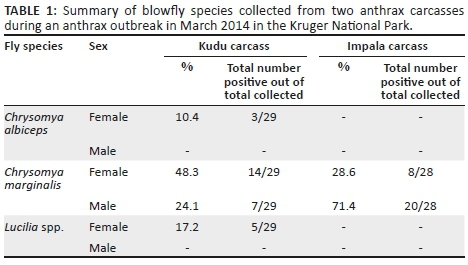
Only B. anthracis spores were isolated from the blowflies. A total of 26 (46%; 26/57) blowflies were positive for the presence of B. anthracis spores, with 66% (19/29) of blowflies collected from the kudu carcass and 25% (7/28) of the blowflies collected from the impala carcass (Table 2). The Ch. marginalis blowflies collected from the kudu carcass had an average internal and external spore count of 128 CFU/fly. The Ch. albiceps blowfly collected from the kudu carcass was only positive on the interior with 20 CFU/fly. A low B. anthracis spore count of 10 CFU/fly was isolated from the exterior of the two Lucilia spp. (Appendix 1). The Ch. marginalis blowflies collected from the male impala carcass had an average internal and external spore count of 26 CFU/fly (Appendix 2).
The shrub where blowflies defaecated or regurgitated after feeding on infected carcasses was identified as Abutilon angulatum approximately 2.5 m from the kudu carcass and leaves were collected with blowfly defaecation or regurgitation spots. An average of ten defaecation or regurgitation spots was found per A. angulatum leaf. No B. anthracis was isolated from the A. angulatum shrub leaves using selective medium combined with or without heat treatment, but 170 spores were isolated from one defaecation or regurgitation spot cultured on 5% SBA with no heat treatment. From a single thorny stem of an Acacia tree, 500 spores per droplet for three out of eight defaecation or regurgitation spots were isolated on 5% SBA without heat treatment. Because of the absence of spores on non-selective medium, the antimicrobial activity of the A. angulatum shrub was tested and the results indicated that the MIC of the A. angulatum acetone extract was most effective against E. coli (0.08 mg/mL) and had a moderate inhibitory effect towards E. faecalis, S. aureus and B. anthracis (Sterne) with 0.31 mg/mL.
Discussion
Chrysomya albiceps, Ch. marginalis and Lucilia spp. were collected from two B. anthracis carcasses and their abundance confirms that these carcasses were 2-3 days old as indicated by the investigation of carcass-attending insect communities in the KNP of Braack (1985). Chrysomya marginalis usually arrives within a couple of minutes to hours after death of animals and stays at a carcass for approximately 4 days, whereas Ch. albiceps arrives a couple of hours after the death and remains at a carcass for about 3 days in the KNP (Braack 1985). Lucilia spp. usually arrives at the same time as Ch. marginalis, but in far less numbers. The major blowfly species collected from anthrax-infected carcasses was Ch. marginalis of which 88% was B. anthracis culture-positive. No viable B. anthracis was isolated from any of the vegetation using selective media and could only be isolated using SBA. Based on the culture results using selective (PET) and enrichment (SBA) media, it seems that the selective medium has an inhibitory effect on B. anthracis spore germination from leaves, which was not the case with germination from the blowflies themselves. Because of initial negative results of the selective media from the A. angulatum leaves, we tested for antibacterial activity and found a moderate inhibitory effect on the non-virulent Sterne strain of B. anthracis by phytocompounds within A. angulatum.
Only spores, and no vegetative organisms, from B. anthracis were isolated from the interior and exterior of blowflies, which could be attributed to various factors that could have killed the more labile vegetative organisms. These factors include the freezing of the flies in liquid nitrogen, collection time and the period between collection and processing of the flies. Graham-Smith (1913) fed Musca domestica and Calliphora erythrocephala on B. anthracis vegetative cells and spores and recovered only B. anthracis spores for up to ten days from fly legs and wings and seven days from both the gut and the crop. Vegetative cells were present on legs and wings for up to 24 h, lending further evidence to our findings. In this study, the collected flies were frozen in liquid nitrogen. Haines (1938) found that 90% B. mesentericus spores were viable after -70 °C freezing with varying loss of viability of the vegetative cells and Young et al. (1968) suggested that vegetative cells of spore-forming bacteria are more susceptible to damage from freeze-thawing than vegetative cells of non-spore-forming bacteria. Therefore, it is presumed that the freezing of the flies in liquid nitrogen did not influence the spore count significantly, as we only found spores. The absence of vegetative cells could be because of the use of liquid nitrogen to kill the blowflies.
Various researchers have determined that flies can potentially transmit B. anthracis to their surroundings and that these flies are carriers of the bacteria for numerous days (Blackburn et al. 2010, 2014; Hugh-Jones & Blackburn 2009; Von Terzi et al. 2014). According to De Vos (1990), explosions of blowfly populations preceded the anthrax outbreaks in the KNP in 1960 and 1970. Blackburn et al. (2010) speculated that blowflies and flesh flies are responsible for the spread of an anthrax outbreak in white-tailed deer in the USA, which was later confirmed by isolating B. anthracis DNA from leaves collected 21 days post-outbreak as well as viable B. anthracis from blowfly larvae and one adult that can potentially infect the surrounding vegetation (Blackburn et al. 2014). This coincides with the findings of this study where B. anthracis could not be isolated from leaves using selective medium. This could explain why only B. anthracis DNA on leaves was detected by Blackburn et al. (2014). The suppressive nature of selective media on B. anthracis from environmental samples needs further investigation.
Two recent studies investigated fly species as potential mechanical or biological vectors of B. anthracis.Fasanella et al. (2010) allowed the common housefly (M. domestica) to feed on B. anthracis-infected rabbit carcasses or B. anthracis-contaminated blood and indicated the presence of B. anthracis spores in defaecation or vomit spots as well as hypothesised that anthrax spores are able to germinate and replicate in the gut content of M. domestica. These authors hypothesise that the housefly has the potential to act as a biological vector for B. anthracis. Von Terzi et al. (2014) demonstrated that B. anthracis vegetative cells are unable to multiply inside the gut of Calliphora vicina and cannot survive for longer than a week. These authors' results show high numbers of viable B. anthracis indicating the role of C. vicina as only mechanical vectors as previously hypothesised (Blackburn et al. 2010; Hugh-Jones & Blackburn 2009; Hugh-Jones & De Vos 2002).
The Ch. albiceps had less spores per fly (20 CFU/fly) compared to Ch. marginalis (128 CFU/fly) collected at the kudu carcass. Only Ch. marginalis was caught at the impala carcass with 25 CFU/fly. The reason for the larger spore count present on flies at the kudu carcass could be attributed to the bacterial load of the host, or more sporulation as the kudu carcass was opened by scavengers compared to the partially opened impala carcass that might have been protected from scavengers by the Acacia shrub. The total CFUs isolated per fly reflect the potential infectious load of a fly with an average of 87 B. anthracis CFU/fly depending on the blowfly species. It is not known how many spores were defaecated onto the surrounding vegetation by flies, but 170 spores were isolated from a defaecated spot on the A. angulatum leave. Our results show that B. anthracis is present in and on blowflies that actively fed on an anthrax carcass and that the faecal or discard droplets left on leaves are infective. This can then lead to the assumption that blowflies can aid in the dissemination of B. anthracis to susceptible host species.
As anthrax carcass sites are the primary sources for future infections (Turner et al. 2014, 2016), it will depend if the spore doses from surrounding infected vegetation are lethal. Considering the 170-500 spores per leaf or twig (that weighed approximately 1 g - 2 g) found in this study, a lethal dose of around 105-107 for gastrointestinal anthrax (Turner et al. 2016) can easily be ingested during anthrax outbreaks as impala ingests 0.9 kg - 1.9 kg per day (Furstenburg 2002) and kudu 3.7 kg - 5.0 kg per day (http://www.wildliferanching.com/content/kudu-tragelaphus-strepsiceros). However, because of the small sample size (host species and blowflies), further research is necessary to investigate the spore load present in the different host species and CFU on and defaecated by the different blowfly species.
Despite the unique findings of this study, specifically in the KNP, it only involved two carcasses of different species with blowflies being collected at one specific time point. To obtain a clearer view of the infectious load of blowflies feeding on a carcass under different climatic conditions, a temporal study over a longer time period should be conducted. Ideally, blowflies should be collected daily from carcasses and the surrounding vegetation until the carcasses are completely decomposed giving insights into the extent of the role that blowflies may play in anthrax transmission. While most studies indicate that blowflies play a role as a vector of B. anthracis, the epidemiological significance of this role is difficult to determine because various factors need to be considered, including the survival of the spores on or in blowflies, the spore load in defaecation or vomit spots of blowflies, and hence, on the vegetation, the latter depending on climatic conditions and antimicrobial activity of the plant(s), and last but not least the effective dose required by susceptible host species.
Conclusion
In conclusion, the results obtained from this study indicate that blowflies feeding on an anthrax-contaminated carcass can contaminate surrounding vegetation and aid in the continuous cycle of B. anthracis. If there are high numbers of blowflies feeding on a carcass, it can lead to high bacillus or spore numbers being deposited on the surrounding vegetation. This can then lead to a new infection of a susceptible host through the ingestion of contaminated vegetation.
Acknowledgements
This research was funded by the National Research Foundation, Deutsche Forschungsgemeinschaft and Agricultural Sector Education and Training Authority (AgriSETA). The authors would like to acknowledge SANParks for approving this research in the Kruger National Park and Skukuza State Veterinary Services, Department of Agriculture, Forestry and Fisheries for support during collection.
Competing interests
The authors declare that they have no financial or personal relationships that may have inappropriately influenced them in writing this article.
Authors' contributions
L.B. did the experiments and wrote the manuscript. Knowledge transfer of techniques to L.B. used in this study was done by A.H., A.D. and A.G. A.H. did most of the vegetation experiments. A.G. was responsible for the polymerase chain reaction (PCR) identification of the blowflies. W.B., J.R. and H.V.H. participated in the design of the study and co-supervised the first author. W.B. has been the principal investigator of the DFG project BE2157/4-1. H.v.H. and W.B. were provided funding through AgriSETA and the Deutsche Forschungsgemeinschaft, respectively. L.B. received a National Research Foundation (NRF) Freestanding Innovation Scholarship. All authors participated in critical revision of the manuscript.
References
Blackburn, J.K., Curtis, A., Hadfield, T.L., O'Shea, B., Mitchell, M.A. & Hugh-Jones, M., 2010, 'Confirmation of Bacillus anthracis from flesh-eating flies collected during a west Texas anthrax season', Journal of Wildlife Diseases 46, 918-922. https://doi.org/10.7589/0090-3558-46.3.918 [ Links ]
Blackburn, J.K., Mullins, J.C., Van Ert, M., Hadfield, T.L., O'Shea, B. & Hugh-Jones, M., 2014, 'The necrophagous fly anthrax transmission pathway: Empirical and genetic evidence from a wildlife epizootic in West Texas 2010', Vector-Borne and Zoonotic Diseases 14, 576-583. https://doi.org/10.1089/vbz.2013.1538 [ Links ]
Braack, L.E.O., 1985, 'An ecological investigation of the insects associated with exposed carcasses in the northern Kruger National Park: A study of populations and communities', PhD thesis, Department of Entomology, University of Natal, South Africa. [ Links ]
Braack, L.E.O. & De Vos, V., 1990, 'Feeding habits and flight range of blow-flies (Chrysomyia spp.) in relation to anthrax transmission in the Kruger National Park, South Africa', The Onderstepoort Journal of Veterinary Research 57, 141-142. [ Links ]
Braack, L.E.O. & Retief, P.F., 1986, 'Dispersal, density and habitat preference of the blow-flies Chrysomya albiceps (Wd.) and Chrysomya marginalis (Wd.) (Diptera: Calliphoridae)', The Onderstepoort Journal of Veterinary Research 53, 13-18. [ Links ]
De Vos, V., 1990, 'The ecology of anthrax in the Kruger National Park, South Africa', Salisbury Medical Bulletin 68S, 19-23. [ Links ]
De Vos, V., 1994, 'Anthrax', in J.A.W. Coetzer, G.R. Thomson & R.C. Tustin (eds.), Infectious diseases of Livestock with special reference to Southern Africa, pp. 1262-1289, Vol. 2, Oxford University Press, Cape Town, South Africa. [ Links ]
Dragon, D.C. & Rennie, R.P. 1995, 'The ecology of anthrax spores: Tough but not invincible', The Canadian Veterinary Journal 36, 295-301. [ Links ]
Eloff, J.N., 1998, 'A sensitive and quick microplate method to determine the minimal inhibitory concentration of plant extracts for bacteria', Planta Medica 64, 711-713. https://doi.org/10.1055/s-2006-957563 [ Links ]
Fasanella, A., Scasciamacchia, S., Garofolo, G., Giangaspero, A., Tarsitano, E. & Adone, R., 2010, 'Evaluation of the house fly Musca domestica as a mechanical vector for an anthrax', PLoS One 5, 1-5. https://doi.org/10.1371/journal.pone.0012219 [ Links ]
Furstenburg, D., 2002, Impala 'Rooibok' Aepyceros melampus, viewed 24 November 2010, from http://gadi.agric.za/articles/Furstenburg_D/impala.php [ Links ]
Graham-Smith, G.S., 1913, Flies and disease: Non-bloodsucking flies, Cambridge University Press, London. [ Links ]
Haines, R.B., 1938, 'The effect of freezing on bacteria', Proceedings of the Royal Society B: Biological Sciences 124, 451-463. https://doi.org/10.1098/rspb.1938.0005 [ Links ]
Hugh-Jones, M.E. & Blackburn, J.K., 2009, 'The ecology of Bacillus anthracis', Molecular Aspects of Medicine 30, 356-367. https://doi.org/10.1016/j.mam.2009.08.003 [ Links ]
Hugh-Jones, M.E. & De Vos, V., 2002, 'Anthrax and wildlife', Revue Scientifique Et Technique (International Office des Epizootics) 21, 359-383. https://doi.org/10.20506/rst.21.2.1336 [ Links ]
Koekemoer, L.L., Kamau, L., Hunt, R.H. & Coetzee, M., 2002, 'A cocktail polymerase chain reaction assay to identify members of the Anopheles funestus (Diptera: Culicidae) group', American Journal of Tropical Medicine and Hygiene 6, 804-811. https://doi.org/10.4269/ajtmh.2002.66.804 [ Links ]
Pienaar, U., de V., 1961, 'A second outbreak of anthrax amongst game animals in the Kruger National Park 5th June to 11th October 1960', Koedoe 4, 4-14. https://doi.org/10.4102/koedoe.v4i1.824 [ Links ]
Pienaar, U., de V., 1967, 'Epidemiology of anthrax in wild animals and the control of anthrax epizootics in the Kruger National Park, South Africa', Federation Proceedings 26, 1496-1502. [ Links ]
Turell, M.J. & Knudson, G.B., 1987, 'Mechanical transmission of Bacillus anthracis by stable flies (Stomoxys calcitrans) and mosquitoes (Aedes aegypti and Aedes taeniorhynchus)', Infection and Immunity 55, 1859-1861. [ Links ]
Turner, W.C., Kausrud, K.L., Beyer, W., Easterday, W.R., Barandongo, Z.R., Blaschke, E. et al., 2016, 'Lethal exposure: An integrated approach to pathogen transmission via environmental reservoirs', Scientific Reports 6, 27311. https://doi.org/10.1038/srep27311 [ Links ]
Turner, W.C., Kausrud, K.L., Krishnappa, Y.S., Cromsigt, J.P.G.M., Ganz, H. H., Mapaure, I. et al., 2014, 'Fatal attraction: Vegetation responses to nutrient inputs attract herbivores to infectious anthrax carcass sites', Proceedings of the Royal Society of London Series B: Biological Sciences 281, 20141785. https://doi.org/10.1098/rspb.2014.1785 [ Links ]
Von Terzi, B., Turnbull, P.C.B., Bellan, S.E. & Beyer, W., 2014, 'Failure of Sterne- and Pasteur-like strains of Bacillus anthracis to replicate and survive in the urban bluebottle blow fly Calliphora vicina under laboratory conditions', PLoS One 9, 1-7. https://doi.org/10.1371/journal.pone.0083860 [ Links ]
World Health Organization, 2008, Anthrax in humans and animals, 4th edn., WHO press, Geneva. [ Links ]
Young, R.S., Deal, P.H. & Whitfield, O., 1968, 'The response of spore-forming vs. nonspore-forming bacteria to diurnal freezing and thawing', Origins of Life and Evolution of Biospheres 1, 113-117. https://doi.org/10.1007/BF00924233 [ Links ]
Zumpt, F., 1965, Myiasis in man and animals in the old world, Butterworths, London. [ Links ]
Correspondence:
Lizanne Basson
lizanne7basson@gmail.com
Received: 29 Mar. 2017
Accepted: 09 Apr. 2018
Published: 26 June 2018
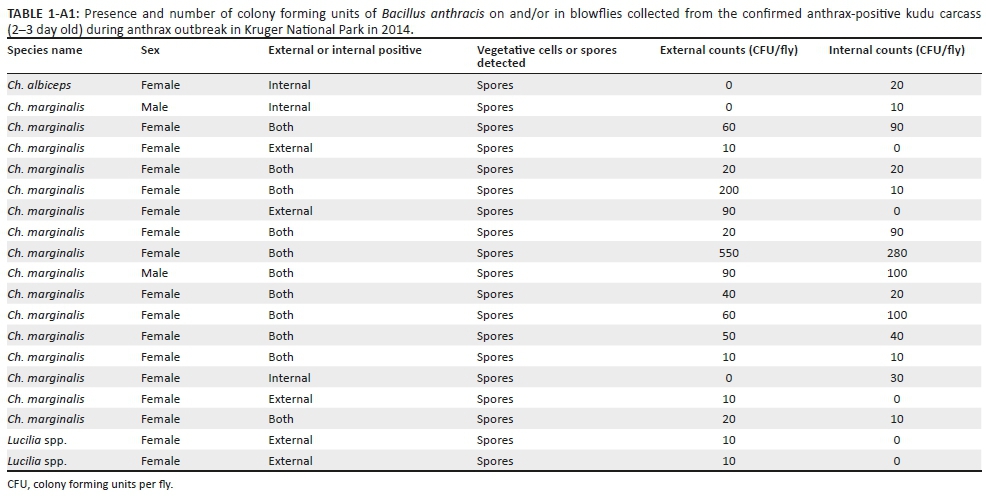
^rND^sBlackburn^nJ.K.^rND^sCurtis^nA.^rND^sHadfield^nT.L.^rND^sO'Shea^nB.^rND^sMitchell^nM.A.^rND^sHugh-Jones^nM.^rND^sBlackburn^nJ.K.^rND^sMullins^nJ.C.^rND^sVan Ert^nM.^rND^sHadfield^nT.L.^rND^sO'Shea^nB.^rND^sHugh-Jones^nM.^rND^sBraack^nL.E.O.^rND^sDe Vos^nV.^rND^sBraack^nL.E.O.^rND^sRetief^nP.F.^rND^sDe Vos^nV.^rND^sDe Vos^nV.^rND^sDragon^nD.C.^rND^sRennie^nR.P.^rND^sEloff^nJ.N.^rND^sFasanella^nA.^rND^sScasciamacchia^nS.^rND^sGarofolo^nG.^rND^sGiangaspero^nA.^rND^sTarsitano^nE.^rND^sAdone^nR.^rND^sHaines^nR.B.^rND^sHugh-Jones^nM.E.^rND^sBlackburn^nJ.K.^rND^sHugh-Jones^nM.E.^rND^sDe Vos^nV.^rND^sKoekemoer^nL.L.^rND^sKamau^nL.^rND^sHunt^nR.H.^rND^sCoetzee^nM.^rND^sPienaar^nU., de V.^rND^sPienaar^nU., de V.^rND^sTurell^nM.J.^rND^sKnudson^nG.B.^rND^sTurner^nW.C.^rND^sKausrud^nK.L.^rND^sBeyer^nW.^rND^sEasterday^nW.R.^rND^sBarandongo^nZ.R.^rND^sBlaschke^nE.^rND^sTurner^nW.C.^rND^sKausrud^nK.L.^rND^sKrishnappa^nY.S.^rND^sCromsigt^nJ.P.G.M.^rND^sGanz^nH. H.^rND^sMapaure^nI.^rND^sVon Terzi^nB.^rND^sTurnbull^nP.C.B.^rND^sBellan^nS.E.^rND^sBeyer^nW.^rND^sYoung^nR.S.^rND^sDeal^nP.H.^rND^sWhitfield^nO.^rND^1A01 A02^nBernard W.T.^sCoetzee^rND^1A03^nSam M.^sFerreira^rND^1A04^nKristine^sMaciejewski^rND^1A01 A02^nBernard W.T.^sCoetzee^rND^1A03^nSam M.^sFerreira^rND^1A04^nKristine^sMaciejewski^rND^1A01 A02^nBernard W. T^sCoetzee^rND^1A03^nSam M^sFerreira^rND^1A04^nKristine^sMaciejewski

SHORT COMMUNICATION
Challenges and opportunities for monitoring wild Nile crocodiles with scute mark-recapture photography
Bernard W.T. CoetzeeI, II; Sam M. FerreiraIII; Kristine MaciejewskiIV
IGlobal Change Institute, University of the Witwatersrand, South Africa
IIScientific Services, Organisation for Tropical Studies, South Africa
IIIScientific Services, SANParks, Skukuza, South Africa
IVCentre for Complex Systems in Transition, Stellenbosch University, South Africa
ABSTRACT
The global conservation status of Nile crocodiles (Crocodylus niloticus) was last assessed in 1996. The species presents particular difficulty in monitoring because it can be cryptic, require expertise to handle, and caudal tail tags and transmitters are often lost. Some studies advocate mark-recapture techniques based on photograph identification of the unique scute markings of crocodile tails as a non-invasive means of monitoring their populations. Researchers developed this method with crocodiles in captivity. In this study, we test the technique under field conditions by monitoring crocodiles from 2015 to 2017 in the Sunset Dam in the Kruger National Park. Using a Cormack-Jolly-Seber open population model, we found that the dam may host 15-30 individuals, but that there is a high turnover of individuals and much uncertainty in model outputs. The dam's population thus has high rates of immigration and emigration. The method proved challenging under field conditions, as there was bias in identifying scute markings consistently. The efficient use of the method requires an exceptional quality of photographic equipment. Animal crypsis, however, remains an issue. In this study, we discuss how to improve the mark-recapture photography methodology, especially to adapt the technique for citizen science initiatives.
CONSERVATION IMPLICATIONS: Using scute mark-recapture photography presents challenges under field conditions. These challenges require innovative, practical and analytical solutions to successfully use the technique before monitoring programmes, aimed at ensuring the persistence of crocodiles in the wild, can be implemented.
Introduction
The Nile crocodile, Crocodylus niloticus, is an apex predator and keystone species across Africa (Ashton 2010). It serves as an indicator species and populations are proxies for aquatic ecosystem health (Ashton 2010). The current global conservation status of the Nile crocodile, as assessed by the International Union for Conservation of Nature (IUCN), is Least Concern, but the species was previously listed as Vulnerable from 1982 to 1990 (IUCN 2017) and is listed as Vulnerable under the South African Red List assessment (Marais 2014). Even so, recent declines in crocodile populations recorded across several rivers and lakes, with particularly marked declines in the Olifants Gorge within the Kruger National Park (Ferreira & Pienaar 2011), raise conservation concerns. Consequently, there is a need to ascertain the conservation status of Nile crocodile populations. This relies on efficient monitoring techniques.
Nile crocodiles present particular challenges for monitoring, especially over large spatial areas. Aerial surveys are useful for counting crocodiles, but consistently yield lower estimates than spotlight surveys at night (Combrink et al. 2011; Ferreira & Pienaar 2011), especially for smaller size classes. Crocodiles can be cryptic, which reduces their detectability (Thomas et al. 2010). Capture mark-recapture studies rely on individually marked crocodiles using scute-removal techniques or the attachment of numbered plastic tags on their tails, or VHF (very high frequency) transmitters (Bourquin 2007; Leslie 1997). The capturing of crocodiles, however, can be challenging, as the signal of VHF transmitters is often difficult to detect owing to thick vegetation; it is also time-consuming, expensive and dependent on individual behaviour that may vary (Bourquin & Leslie 2011). These may also bias the re-catchability of certain sexes, sizes or age classes (Bayliss et al. 1987). This is not only as a result of improper signal detection from VHF transmitters but also because of the plastic caudal tags, often cattle ear tags, which fail when they fall off, reducing the robustness of mark-recapture estimates (Bourquin 2007; Swanepoel 1999).
In addition, methods employed to monitor key species may have negative impacts on the welfare of individuals as well as species persistence. The fitment of devices on birds, for instance, has significant effects on energy expenditure, nesting likelihood (Barron et al. 2010) and population dynamics (Saraux et al. 2011). Ethical considerations should be a key element of biological monitoring designs (Putman 1995), which require the development of less invasive monitoring techniques.
Researchers have advocated a scute identification technique to better monitor crocodile populations (Bouwman & Cronje 2016; Swanepoel 1996). It is less invasive, less time-consuming and potentially more accurate. The scute markings on the tail provide a unique identification for each crocodile, allowing comparisons between individuals in a population. This method does not require the capture of an animal, but observers need to positively identify an individual visually or through the use of photography. Using mark-recapture photography, the method may 'capture' a portion of a population with photographs, and identify and catalogue unique markings. Then the proportion of 'marked' individuals recaptured in subsequent photographic sampling events allows the estimation of population sizes (Bouwman & Cronje 2016). This approach has potential use for population monitoring, research and application for citizen science initiatives aimed at monitoring individuals in the wild (Bouwman & Cronje 2016).
The development of the mark-recapture photography techniques, however, focused on captive crocodiles (Bouwman & Cronje 2016; Swanepoel 1996). Identifying animals in captivity enables researchers to handle specimens, which allows for clearly identified scute markings, removing any issues with regard to individual detectability. Here, we develop and test a monitoring protocol by assessing the suitability of mark-recapture photography for crocodiles under typical field conditions. Our first aim is to use the technique to calculate the population size and monitor crocodiles at a single dam in the Kruger National Park. Our second aim is to report on the challenges and opportunities with this approach. This allows us to better guide the use of such techniques when operationalised under field conditions. To test the potential role of citizen scientists in such initiatives, we conducted our study at a popular tourist site, at a dam frequented by crocodiles. Our study thus also replicated techniques with equipment that we considered tourists might typically employ and in conditions they might face.
Methods
Study site and methods
This study took place over two years at Sunset Dam (25°06.972′ S 031°54.729′ E) near the Lower Sabie rest camp in the Kruger National Park. Sunset Dam is 200 m from the Sabie River. Tourists have regular sightings of crocodiles at this dam.
Our sampling focused on four events of three days each during April 2015, February 2016, September 2016 and February 2017. Sampling at the study site was only conducted when heavy wind, rain or overcast conditions were absent. Each sampling event consisted of counting crocodiles from a game drive vehicle parked at Sunset Dam. Observers counted crocodiles every 30 min, starting at 09:00 and ending at 12:00, noting all visible crocodiles on land and in the water at the time. When visible, observers also photographed the tails of all crocodiles for later individual identification using the scute marking technique (details follow). To emulate the equipment that tourists might use, we used a combination of photography techniques including a DSLR (75-300 mm lens DSLR Canon ELS Rebel T3I camera), a Canon H50 Powershot with 50 × digital zoom and 'digiscoping' by taking photographs through a Nikon ED field spotting-scope, mounted on a tripod inside the vehicle. During the first sampling event (April 2015), observers also measured the distance to all crocodiles, noted from the observation point with a laser range finder (Foresty 550 6 × 21).
The distinct markings on scutes running laterally down the tail allows the individual identification of Nile crocodiles (Bouwman & Cronje 2016; Swanepoel 1996). We applied Swanepoel's (1996) method, although subsequent work suggests an alternative 11-scute system (see Bouwman & Cronje 2016). We, however, generated a unique nine-scute code by recording the markings of the last anterior, unfused scute and the subsequent scutes moving towards the head (Figure 1). The code was generated by recording the number of black marks on each scute and the relative position of the scute on which the mark(s) were located. If there were multiple black marks per tail segment, we repeated the corresponding scute number to the number of those marks. Adding parentheses to numbers represented single marks that occasionally extend across different scutes. Square brackets signified marks that are of a lighter colouration.
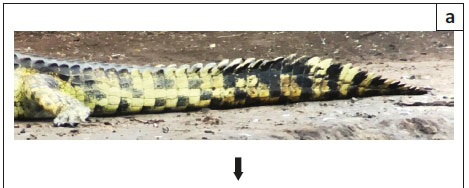
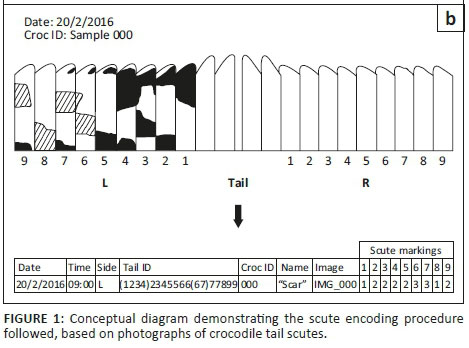
We created a crocodile photographic database containing either the left or the right scute markings identified during the study. Each record contains a unique ID; an exemplar photograph, whether it was the left or right tail observed; and a unique scute marking code, whether it was present or absent during subsequent sampling events. At least four observers captured data from photographs, assigned scute codes by consensus and drew conceptual diagrams of the tails (Figure 1b). Four observers in 2017 set out to test the level of agreement rates between different observers and independently captured data for each newly photographed individual. We considered 'disagreement' between assigned scute codes to be when three or more scute numbers differed from at least two observers among the codes assigned to each crocodile.
Data analysis
Firstly, we provide summary statistics of the overall crocodile photographic database created during the study period. Then, because it was particularly important to survey crocodiles when they were basking out of the water, and available for photographic mark-recapture, we estimated the change in crocodile abundance over time during the half-hourly sampling periods recorded on both land and in the water.
To estimate the population size in order to determine changes at Sunset Dam in our dataset, we applied mark-recapture analysis. For this purpose, we considered individuals with unique left and unique right scute codes as 'marked'. Subsequent photographs and scute codes matched to previously coded individuals were 'recaptured'. We implemented a Cormack-Jolly-Seber (CJS) open population model to calculate the estimated population size (Pledger, Pollock & Norris 2003). Model implementation in 'R'(2017) used the package 'mra' (Amstrup, McDonald & Manly 2005) to calculate a population size estimate and standard error. Since crocodiles have different left- and right-hand scute marks (Bouwman & Cronje 2016; Swanepoel 1996), we ran a 'Left' model (left side of tail photographs only) and a 'Right' model (right side of tail photographs only).
Results
A total of 113 left and right scute markings made up our sample during 2015-2017. After a total of 36 h of observation, only three individuals had both left- and right-hand sides photographed with certainty (based on visually tracking the individual for changing orientation). Our data comprised a total of 56 left tail and 57 right tail scute markings. The number of crocodiles on land decreased during the morning counts (Figure 2; Pearson's R = −0.94; p < 0.01; N = 7), while those counted in water did not (Figure 2; Pearson's R = 0.65; p = 0.117; N = 7). Standard deviation bars, however, overlapped half-hourly, indicating no appreciable peak in numbers of crocodiles basking on land (Figure 2). When comparing individual scute markings, the four observers collecting data during February 2017 disagreed on 8 out of 14 photographs they collected in total, a 57% disagreement rate. Photographed crocodiles were on average more than 120 m away (mean = 124 m; SD = 37.5 m; N = 53).
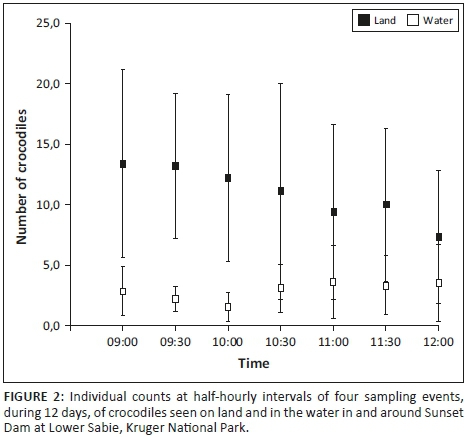
Overall, there was a low recapture rate. We recaptured only 13 scute markings and no unique scute markings were captured in all four sampling events. Despite the ratio of left to right photographed tails being similar (56 left vs. 57 right), the mark-recapture analysis indicated different population size estimates during sampling events, as the analysis is dependent on the accumulating recapture rate. In 2017, which indicates the longest time interval of mark-recapture data, population sizes were 11 (± 5.0 SE) and 18 (± 8.1 SE) for the left and right tails, respectively (Figure 3). These modelled population size estimates overlapped with the data obtained from morning counts (see Figure 2). Model fit can be considered robust (Left model: AIC = 54.17; Log likelihood = −24.08; Deviance = 48.17; N = 4 and Right model: AIC = 41.61; Log likelihood = −16.80; Deviance = 33.61; N = 4).
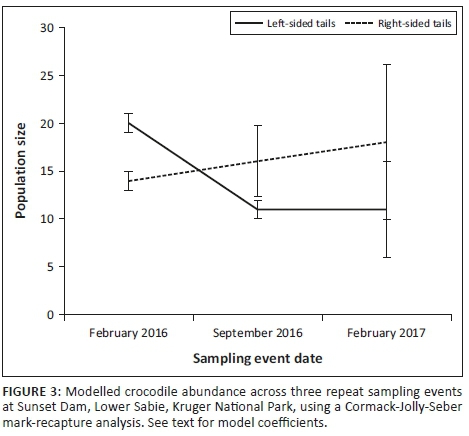
Discussion
The crocodile population at the study site is dynamic. Low rates of individual recaptures suggest high rates of movement of crocodiles to and from Sunset Dam during the study period. Crocodiles most likely move into and from the nearby Sabie River. Despite this finding, the population model demonstrated a relatively consistent number of crocodiles across years. We infer that 15-30 crocodiles regularly use the dam.
The low rate of recaptures emphasise that the use of the dam by crocodiles is in flux. The results suggest high levels of emigration and immigration, consistent with observations that crocodiles can move long distances over land. Nile crocodiles in the Kruger National Park moved up to 36 km along the Olifants River between South Africa and Mozambique (Swanepoel 1999). Fergusson (2010) recorded crocodile movements of up to 90 km. Crocodile movement may be affected by changes in water levels. In the dry season when water levels receded, crocodiles moved from the Ume River towards the Kariba Dam (Games 1990). The same was found in the Amazon Basin with Melanosuchus niger and Caiman crocodylus retreating from the flooded forests in the wet season to the lakes in the dry season (Ron,Vallejo & Asanza 1998).
The error rates in our modelled population estimates are high, as they cannot account for crocodile tails being obscured from view in the water (which may underestimate numbers), and cannot account for double counting either sides of the same individual (which would overestimate numbers). The development of statistical techniques that accommodate single-side marking and detectability biases can improve the use of unique tail markings to estimate Nile crocodile population sizes. The low recapture rate and difficulties with scute identification using the photographic technique will further increase error in the model.
The present study tested and demonstrated the feasibility of a photographic mark-recapture technique for monitoring Nile crocodiles. However, the method proved challenging under field conditions and for citizen science application. The use of this approach requires addressing three major challenges. Firstly, successful identification relied heavily on the quality of the photographs. Only photographs of exceptional quality were suitable. Slight decreases in image resolution or poor lighting rendered photographs unsuitable. In addition, most images taken in the study were at distances greater than 100 m. Our experience suggests that an SLR camera lens of 500 mm or greater could produce consistent and reproducible crocodile images.
Secondly, the identification of scute markings was subjective for most photographs, regardless of their quality. The disagreement rate between observers of more than 50% implies observer difficulty and potentially bias in identifying scute markings from photographs. We attempted to overcome this by determining scute markings by consensus. Although statistical techniques can address observer bias in aerial surveys, for instance (Lubow & Ransom 2016), such bias is problematic to resolve analytically in our case. We propose the use of paper cards (Figure 1b) to help facilitate identification between observers. Multiple observers classify the scutes independently and then reach the final codes by consensus. The approach thus requires training observers for consistency. We acknowledge that the use of automated picture identification software (e.g. Kuhl & Burghardt 2013) and machine learning (e.g. Michalski, Carbonell & Mitchell 2013) could greatly enhance the consistent identification of scute markings.
The third challenge is species crypsis, which alters the detectability of crocodile tails and so reduces the ability to monitor populations effectively (Thomas et al. 2010). Observers can only photograph basking crocodiles. Even if away from the water, debris and mud or the orientation of the individual may obscure tail scutes. Orientation is particularly problematic as scutes differ between the left and right side of the tail, and our results demonstrate that it may alter population estimates. Nile crocodiles may also spend more time out of the water during winter, and therefore sampling may better detect the species during June-July.
While the scute marking method would be appropriate for captured animals, using photography presents challenges under field conditions. These challenges require innovative, practical and analytical solutions to successfully use a photographic mark-recapture method based on scute markings that can inform interventions aimed at ensuring the persistence of crocodiles in the wild.
Acknowledgements
The authors thank the following observers: Tavis Dalton, Sam Kubica, Olivia Vennaro, Claire Weston, Brian Brooks, Lauren Chang, Catherine Craighill, Tatiana Henry, Katie Diggs, Brianna Mathias, Annie Stevens, Jana Woerner, Joey Binder, Max Israelit, Drew Perlmutter and Henry Stevens. Funding was provided by the Organisation for Tropical Studies, South Africa. H. Coetzee kindly redrew Figure 1.
Competing interests
The authors declare that they have no financial or personal relationships that may have inappropriately influenced them in writing this article.
Authors' contributions
K.M. and S.M.F. conceptualised the study. K.M. and B.W.T.C. conducted and coordinated all the fieldwork. B.W.T.C. performed the analysis and wrote the first draft. All the authors contributed to subsequent drafts of this article.
References
Amstrup, S.C., McDonald, T.L. & Manly, B.F.J., 2005, Handbook of capture-recapture analysis, Princeton University Press, Princeton, NJ. [ Links ]
Ashton, P.J., 2010, The demise of the Nile crocodile (Crocodylus niloticus) as a keystone species for aquatic ecosystem conservation in South Africa: The case of the Olifants River, CSIR Report, CSIR, Pretoria. [ Links ]
Barron, D.G., Brawn, J.D. & Weatherhead, P.J., 2010, 'Meta-analysis of transmitter effects on avian behaviour and ecology', Methods in Ecology Evolution 1, 180-187. https://doi.org/10.1111/j.2041-210X.2010.00013.x [ Links ]
Bayliss, P., 1987, 'Survey methods and monitoring within crocodile management programs', in G.J.W. Webb, S.C. Manolis & P.J. Whitehead (eds.), Wildlife management: Crocodiles and alligators, pp. 157-176, Surrey Beatty and Sons, Sydney. [ Links ]
Bourquin, S.L., 2007, 'The population ecology of the Nile crocodile (Crocodylus niloticus) in the panhandle region of the Okavango Delta, Botswana', PhD thesis, Stellenbosch University, Stellenbosch. [ Links ]
Bourquin, S.L. & Leslie, A.J., 2011, 'Estimating demographics of the Nile crocodile (Crocodylus niloticusLaurenti) in the panhandle region of the Okavango Delta, Botswana', African Journal of Ecology 50, 1-8. https://doi.org/10.1111/j.1365-2028.2011.01285.x [ Links ]
Bouwman, H. & Cronje, E., 2016, 'An 11-digit identification system for individual Nile crocodiles using natural markings', Koedoe 58, 1-6. https://doi.org/10.4102/koedoe.v58i1.1351 [ Links ]
Combrink, X., Korrûbel, J.L., Kyle, R., Taylor, R. & Ross, P., 2011, 'Evidence of a declining Nile crocodile (Crocodylus niloticus) population at Lake Sibaya, South Africa', South African Journal of Wildlife Research 41, 145-157. https://doi.org/10.3957/056.041.0201 [ Links ]
Fergusson, R., 2010, Wildlife survey phase 2 and management of human-wildlife conflicts in Mozambique, Survey of Crocodile Populations in Mozambique, Vol. 2 Part 5, AGRECO G.E.I.E., Brussels, Belgium. [ Links ]
Ferreira, S.M. & Pienaar, D., 2011, 'Degradation of the crocodile population in the Olifants River Gorge of Kruger National Park, South Africa', Aquatic Conservation 21, 155-164. https://doi.org/10.1002/aqc.1175 [ Links ]
Games, I., 1990, 'The feeding ecology of two Nile crocodile populations in the Zambezi Valley', PhD thesis, University of Zimbabwe, Harare. [ Links ]
IUCN, 2017, IUCN Red list: Crocodylus niloticus, viewed 23 October 2017, from http://www.iucnredlist.org/details/46590/0 [ Links ]
Kuhl, H.S. & Burghardt, T., 2013, 'Animal biometrics: Quantifying and detecting phenotypic appearance', Trends in Ecology and Evolution 28, 432-441. https://doi.org/10.1016/j.tree.2013.02.013 [ Links ]
Leslie, A.J., 1997, 'The ecology and physiology of the Nile crocodile, Crocodylus niloticus', PhD thesis, Drexel University Philadelphia, PA. [ Links ]
Lubow, B.C. & Ransom, J.I., 2016, 'Practical bias correction in aerial surveys of large mammals: Validation of hybrid double-observer with sightability method against known abundance of feral horse (Equus caballus) populations', PLoS One 11, e0154902. https://doi.org/10.1371/journal.pone.0154902 [ Links ]
Marais, J., 2014, 'Crocodylus niloticus (Laurenti, 1768)', in M.F. Bates, W.R. Branch, A.M. Bauer, M. Burger, J. Marais, G.J. Alexander et al., (eds.), Atlas and red list of the reptiles of South Africa, Lesotho and Swaziland, Suricata 1, South African National Biodiversity Institute, Pretoria. [ Links ]
Michalski, R.S., Carbonell, J.G. & Mitchell, T.M., 2013, Machine learning: An artificial intelligence approach, Springer Science & Business Media, Palo Alto, CA. [ Links ]
Pledger, S., Pollock, K.H. & Norris, J.L., 2003, 'Open capture-recapture models with heterogeneity: I. Cormack-Jolly-Seber Model', Biometrics 59, 786-794. https://doi.org/10.1111/j.0006-341X.2003.00092.x [ Links ]
Putman, R.J., 1995, 'Ethical considerations and animal welfare in ecological field studies', Biodiversity and Conservation 4, 903-915. https://doi.org/10.1007/BF00056197 [ Links ]
Ron, S.R., Vallejo, A. & Asanza, E., 1998, 'Human influence on the wariness of Melanosuchus niger and Caiman crocodilus in Cuyabeno, Ecuador', Journal of Herpetology 32, 320. https://doi.org/10.2307/1565444 [ Links ]
Saraux, C., Le Bohec, C., Durant, J.M., Viblanc, V.A., Gauthier-Clerc, M., Beaune, D. et al., 2011, 'Reliability of flipper-banded penguins as indicators of climate change', Nature 469, 203-206. https://doi.org/10.1038/nature09630 [ Links ]
Swanepoel, D.J.G., 1996, 'Identification of the Nile crocodile Crocodylus niloticus by the use of natural tail marks', Koedoe 39, 113-115. https://doi.org/10.4102/koedoe.v39i1.287 [ Links ]
Swanepoel, D.J.G., 1999, 'Movements, nesting and the effects of pollution on the Nile crocodile Crocodylus niloticus in the Olifants River, Kruger National Park', MSc thesis, University of Natal, Pietermaritzburg. [ Links ]
Thomas, L., Buckland, S.T., Rexstad, E.A., Laake, J.L., Strindberg, S., Hedley, S.L. et al., 2010, 'Distance software: Design and analysis of distance sampling surveys for estimating population size', Journal of Applied Ecology 47, 5-14. https://doi.org/10.1111/j.1365-2664.2009.01737.x [ Links ]
Correspondence:
Bernard Coetzee
bwtcoetzee@gmail.com
Received: 07 Nov. 2017
Accepted: 10 May 2018
Published: 19 July 2018
CHECKLIST
South African National Survey of Arachnida: A checklist of the spiders (Arachnida, Araneae) of the Tswalu Kalahari Reserve in the Northern Cape province, South Africa
Anna S. Dippenaar-SchoemanI, II; Charles R. HaddadIII; Robin LyleI; Leon N. LotzIV; Stefan H. FoordII; Rudy JocqueV; Peter WebbVI
IBiosystematics Arachnology, ARC - Plant Protection Research Institute, South Africa
IIDepartment of Zoology, University of Venda, South Africa
IIIDepartment of Zoology & Entomology, University of the Free State, South Africa
IVDepartment of Arachnology, National Museum Bloemfontein, South Africa
VRoyal Museum for Central Africa, Tervuren, Belgium
VISouth African National Survey of Arachnida, Pretoria, South Africa
ABSTRACT
One of the aims of South African National Survey of Arachnida (SANSA) is to survey protected areas to obtain species-specific information and compile inventories to determine species distribution patterns and evaluate their conservation status for Red Data assessments. The aim of this study, the first in a series of surveys of the Diamond Route Reserves, was to compile the first checklist of the spider species in the Northern Cape at the Tswalu Kalahari Reserve. Spiders were collected during three survey periods (2005−2013) using different collecting methods to sample both the ground and field layers. In total, 32 families represented by 108 genera and 136 species have been collected so far. The most species-rich families are the Salticidae (20 spp.) and Thomisidae (18 spp.), followed by the Gnaphosidae and Araneidae (11 spp. each), while nine families are represented by singletons. The free-living wandering spiders represent 97 spp., while 39 spp. are web-builders. Information on spider guilds, endemicity value and conservation status are provided. The Tswalu Kalahari Reserve protects approximately 6.1% of the total South African spider fauna, while 24.3% of the species found in the reserve are South African endemics, of which 5.9% are Northern Cape endemics. Approximately 6.0% of the species sampled are possibly new to science or represent new records for South Africa.
CONSERVATION IMPLICATIONS: The Tswalu Kalahari Reserve falls within the Savanna Biome in the Northern Cape province. Only one spider species was previously known from the reserve; a further 135 spp. are reported for the first time, with 5.9% of the species being Northern Cape endemics and 24.3% South African endemics. Approximately 6.0% of the species may be new to science or represent new records for South Africa.
Introduction
The South African National Survey of Arachnida (SANSA) was initiated in 1997, with the main aim of making inventories of the arachnid fauna of South Africa (Dippenaar-Schoeman & Haddad 2006; Dippenaar-Schoeman et al. 2015). SANSA has several focus areas, such as arachnid diversity in floral biomes, agroecosystems and protected areas. Species distribution data are an essential information resource needed for the conservation assessments used to compile a Red Data List of the Arachnida of South Africa (Lyle & Dippenaar-Schoeman 2015). Surveys are needed to obtain species-specific information, and yield new, rare and/or endemic species and resources for these existing protected areas. The publication of these species distribution records formed the basis of the first spider atlas and national species list (Dippenaar-Schoeman et al. 2010; Dippenaar-Schoeman 2013).
This study presents the results of SANSA sampling in the Tswalu Kalahari Reserve (TKR), falling within the arid parts of the Savanna Biome (Foord, Dippenaar-Schoeman & Haddad 2011a). The reserve is an E. Oppenheimer & Son property situated in the Northern Cape (Lyle & Dippenaar-Schoeman 2013). This is the first survey of the arachnid fauna of protected areas in the Northern Cape province and the first spider checklist for the TKR. Information on spider guilds, their habitat preference, web types, and endemicity index and conservation status are provided. Checklists for several of the protected areas in South Africa have been published but none for the Northern Cape (McGeoch et al. 2011; Dippenaar-Schoeman et al. 2015).
Research method and design
Study area and period
Tswalu Kalahari Reserve (27°13'30''S, 22°28'40''E; 930 m a.s.l.) is the largest (> 100 000 hectares) privately owned wildlife reserve in South Africa. It lies in the Northern Cape province, at the foot of the Korannaberg Mountains (Figure 1). Kuruman is the closest large town, some 140 km east of Tswalu.
Tswalu Kalahari Reserve includes vegetation described by Low and Rebelo (1998) as shrubby Kalahari dune bushveld, Kalahari plains bushveld and Kalahari mountain bushveld areas of the Savanna Biome (Figure 2a-d). Acocks (1988) described the area as Kalahari Thornveld. The reserve is characterised in certain areas by scattered shrubs and well-developed grass layers, in other areas by a well-developed tree layer and moderately developed grass and shrub layers, and by a poorly developed tree layer and moderately developed grass layers on the mountains and hills (Van Rooyen 1999). Some dominant plant species include the trees Vachellia erioloba, Boscia albitrunca and Terminalia sericea. The four main soil types in the TKR are poorly structured red soils with a high base status; well-drained red, sandy soils with a high base status; red and yellow, well-drained sandy soils with a high base status; and rocky areas with little or no soil (Van Rooyen 1999)
The climate of TKR is highly variable and falls in the summer rainfall area of southern Africa (Low & Rebelo 1998), with a relatively high rainfall occurring from October to April but with a distinct peak in March. The mean annual rainfall is 253.3 mm. The dry season occurs from May to September, with an average of less than 10.0 mm during this period. The peak dry season occurs from June to August, with little or no rainfall.
Sampling methods and identification
Material from three surveys (Table 1) was used to compile the first checklist of the spiders of TKR (Appendix 1). During the first visit to the reserve, spiders were collected ad hoc in all five habitats in the reserve (Figure 1) using a variety of methods, and no set protocol was followed. The second and third surveys were carried out using the standardised protocol devised for SANSA and described in detail by Haddad & Dippenaar-Schoeman (2015). It can be briefly summarised as follows: four representative habitats in a selected degree-square grid were selected by the field work manager, in this case the third author, and sampled by a team of four collectors. During the second and third surveys, sampling was carried out in grass layer around hills forming part of the Korannaberg-Langeberg Mountain Bushveld, Olifantshoek Plains Thornveld, Gordonia Plains Shrubland and Kathu Bushveld (Figure 1).
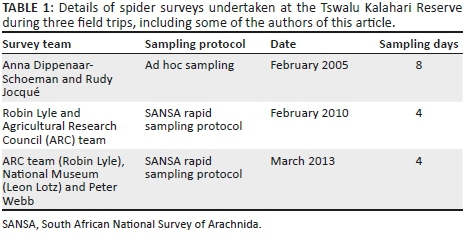
In each of these habitats sampled using the SANSA protocol, 500 beat samples were taken from woody vegetation using a beating sheet and beating stick; 500 sweep samples were taken from grasses and herbaceous vegetation using a sweep net; 50 pitfall traps (buckets with diameter of 135 mm) were set out 2 m apart and kept open for 3-4 days; ten leaf litter samples were taken and sifted over a white sheet using a steel sieve with a mesh spacing of 9 mm. Further, in each habitat, all four team members conducted 2 h of hand collecting during the day from beneath logs, rocks and bark and from vegetation. Night collecting (2 h per person) was done in all four habitats, as opposed to the single habitat required by the SANSA protocol. Winkler traps were used to extract leaf litter samples taken in a single habitat (Olifantshoek Plains Thornveld) during the second survey only; this method yielded poor results and was not used during the third survey.
All of the material sampled for each of the above methods was preserved in 70% ethanol, except for pitfall traps, in which propylene glycol was used as a preservative. Once the pitfalls were removed from the soil, the material was sieved, and the arachnids removed and preserved in 70% ethanol.
Species determinations were performed by several of the authors. Voucher specimens are deposited in the National Collection of Arachnida housed at the ARC-Plant Protection Research, Pretoria (NCA), and at the National Museum in Bloemfontein (NMBA). Only the generic names were included in the checklist when immature specimens were sampled and in those cases where the family lacks taxonomic resources to make species level identifications possible.
Functional groups
Spiders often live in distinct microhabitats with limitations imposed by contrasting biotic and abiotic factors. Species can be categorised into particular functional groups or guilds, based on our knowledge of their habitat and microhabitat preferences, as well as their diets and hunting strategies (Foord et al. 2011a). This provides valuable ecological information that helps in better understanding the utilisation of habitat structures by different taxa. In general, spiders can be divided into species that are largely or entirely reliant on silk to construct webs to capture prey (web-builders, WB) and those that actively search for prey or ambush prey from burrows or on vegetation (wanderers, W). Each of these two major guilds is divided into several subcategories based on the substrates they utilise or the web types that they construct (Table 2).

Endemicity value
The conservation status of species is important, and as part of the First Atlas of South African Spiders (Dippenaar-Schoeman et al. 2010), an endemicity index was provided for each species (Table 3, Appendix 1) based on its current distribution. Seven endemicity categories were considered: 6 = endemic, known only from type locality or one locality only; 5 = known from one province only, wider than type locality; 4 = known from two adjoining provinces only; 3 = South Africa, known from more than two provinces or two provinces not adjoining; 2 = southern Africa (south of Zambezi and Kunene Rivers); 1 = Afrotropical Region; 0 = Africa and wider.
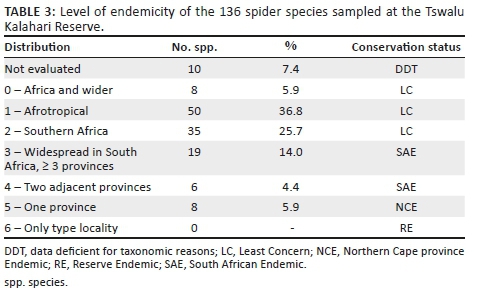
Regarding conservation status, species that were only recorded from immatures or that represent new taxa were not evaluated, and are considered to be data deficient for taxonomic reasons (DDT). Species with a broad distribution (categories 0-2) were considered to be of Least Concern (LC); those of categories 3 and 4 were considered to be South African endemics (SAE); and those of category 5 were considered to be Northern Cape endemics (NCE). No Reserve Endemics (RE, category 6) have been recorded from TKR yet.
Photography
As part of SANSA, a photographic Virtual Museum was developed to access photographs of arachnid species (Dippenaar-Schoeman, Lyle & Van den Berg 2012; Dippenaar-Schoeman et al. 2015). Spiders sampled during the last surveys at TKR were photographed by the last author. A photo gallery of the spiders will be made available on the SANSA website. Images can also be viewed at http://www.arc.agric.za:8080/Default.
Ethical considerations
Permission to collect arachnids in the Northern Cape province was obtained from the Northern Cape Department of Environment and Nature Conservation.
Results and discussion
Spider biodiversity and endemicity
Thirty-two spider families represented by 108 genera and 136 spp. were collected from TKR between 2006 and 2013 over a total of 16 sampling days (Appendix 1, Table 4). Except for one species, Tusitala barbata Peckham & Peckham, 1902 (Salticidae), the rest of the species are reported from the reserve for the first time (Azarkina & Foord 2015). Although the Northern Cape is South Africa's largest province, covering 29.7% of the land area, only 1990 records sampled from 124 sites in the Northern Cape are accessioned in the SANSA database, represented by 490 spp. from 49 families (Dippenaar-Schoeman et al. 2015).
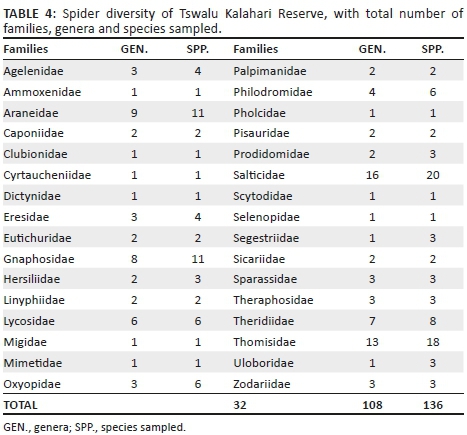
The Northern Cape province has been less intensively sampled than the other provinces. Except for the field guide on the spiders of the Kalahari (Dippenaar-Schoeman & Van den Berg 2010), no surveys from protected areas in the province have been published. Several surveys are underway in reserves (Benfontein, Rooipoort and Oryx Nature Reserves) and in the Augrabies, Richtersveld and Namaqua National Parks (Lyle & Dippenaar-Schoeman 2013; Dippenaar-Schoeman 2014a). The only published results are surveys in pistachio orchards in the arid Nama Karoo near Prieska (Haddad & Dippenaar-Schoeman 2005, 2006; Haddad, Dippenaar-Schoeman & Pekár 2005; Haddad, Louw & Dippenaar-Schoeman 2004; Haddad, Louw & Pekár 2008), where a total of 143 spp. from 31 families were collected (Foord et al. 2011a). In a second study, Lyons (2009) conducted a broad-scale survey of arthropods in restored alluvial diamond mining sites in the Succulent Karoo of the Northern Cape, in which 21 spider families and 51 spp. were sampled.
Based on these results and information from the SANSA database, the number of species sampled in reserves and parks in the Northern Cape is much lower (80-140 spp.) compared to Limpopo reserves, which average 228 spp. per reserve, ranging between 175 and 286 spp. (Foord et al. in prep.).
Of the 136 spp. sampled, ten spp. (7.4%) were DDT and could not be identified to species level, of which four spp. were immature and six spp. are possibly new to science (Appendix 1, Table 3). However, these putative new species are representatives of species-rich families, and only after revisionary studies would it be possible to tell whether they are indeed new to science. No species sampled from TKR thus far can be considered RE. Only the South African endemic species falling into categories 3-6 (33 spp., 24.3%) need to be evaluated using the IUCN criteria. The majority of the species sampled (93 spp.) can be listed as LC, having a distribution throughout southern Africa or wider (Table 3).
Seven Northern Cape endemic species are protected in the TKR: Ancylotrypa pusilla Purcell, 1903 (Cyrtaucheniidae) (Figure 3a); Dresserus laticeps Purcell, 1904 (Eresidae) (Figure 3b); Allocosa aurichelis Roewer, 1959 (Lycosidae) (Figure 3c); Aelurillus cristatopalpus Simon, 1902 (Salticidae); Evarcha brinki Haddad & Wesołowska, 2011 (Salticidae); Ariadna jubata Purcell, 1904 (Segestriidae) (Figure 3d) and Histagonia deserticola Simon, 1895 (Theridiidae).
During this study, Ibala okorosave Fitzpatrick, 2009 (Gnaphosidae) was recorded from South Africa for the first time, and the first adult specimens of the monotypic genus Mallinus Simon, 1893 (Zodariidae) were also sampled. Currently, 2240 spider species are known from South Africa (Dippenaar-Schoeman 2017), and thus, 6.1% of South African species are protected in this reserve.
Family diversity
Results from the Savanna Biome indicate that four spider families consistently dominate assemblages in terms of species richness (Foord, Dippenaar-Schoeman & Haddad 2011b; Dippenaar-Schoeman, Foord & Haddad 2013): Araneidae, Gnaphosidae, Salticidae and Thomisidae. In this study, the Salticidae (20 spp.), Thomisidae (18 spp.), Gnaphosidae (11 spp.) and Araneidae (11 spp.) were the most species-rich families (Table 4), consistent with patterns in the Savanna Biome. Nine families are represented by singletons.
Salticidae: The Salticidae are free-living spiders found on vegetation and the soil surface. They build small silk nests attached to various substrates, in which they moult, oviposit and sometimes mate, or which they occupy during periods of inactivity (Dippenaar-Schoeman & Van den Berg 2010; Dippenaar-Schoeman 2014b). During the last survey of this study, a small round densely woven silk retreat attached to grass (Figure 3e) was sampled in the TKR, housing an immature Thyene imperialis (Rossi 1846). One species has been identified as belonging to a new genus (Galina Azarkina, pers. comm.) and one was immature. The other 17 are new records for the TKR, five spp. are SAE, two spp. are NCE, while 11 spp. are more widely distributed throughout Africa (Appendix 1).
Thomisidae: Crab spiders are free-living spiders commonly found on grass, shrubs, flowers and trees, and only few species were sampled from the soil surface (Dippenaar-Schoeman & Van den Berg 2010; Dippenaar-Schoeman 2014b). Thomisids are easily dispersed by wind and most species have a wide distribution. In the TKR, 13 genera represented by 18 spp. were sampled. Of these, only four spp. are known SAE, while the rest (14 spp.) are widely distributed throughout Africa (Appendix 1).
Gnaphosidae: The gnaphosids are free-living spiders commonly found on the ground and low vegetation (Dippenaar-Schoeman & Van den Berg 2010; Dippenaar-Schoeman 2014b). One species could not be determined, five of the 11 spp. are SAE, and the rest have a wide distribution. One species, Aneplasa nigra Tucker, 1923, has a restricted distribution and is known from the Northern and Western Cape provinces only (Appendix 1).
Araneidae: The Araneidae are web-builders and produce typical orb-webs (OWB) and modified orb-webs (MOWB) (Dippenaar-Schoeman & Van den Berg 2010; Dippenaar-Schoeman 2014b). All the members of the family (11 spp.) recorded here have a wide African distribution.
Functional groups
For this study, two main guilds were recognised, namely wandering spiders (W) (97 spp.) and web-builders (WB) (39 spp.), with further subdivisions based on microhabitat and general behaviour, as observed during surveys (Appendix 1).
Wanderers: A total of 97 spp. (71.3%) are wandering spiders, with some species living on vegetation (39 spp.) and others on the ground surface (55 spp.), with an additional three species occurring regularly in both strata. The majority of ground-dwellers are free-living soil dwellers (58 spp., 42.6%), while six spp. (4.4%) live in burrows. The Salticidae (15 spp.), Gnaphosidae (11 spp.) and Lycosidae (six spp.) are the most species rich families of ground-dwellers (Appendix 1).
Most of the burrow-dwellers belong to the suborder Mygalomorphae and include the trapdoor spider species Ancylotrypa pusilla (Figure 3a), a bag-nest migid, Moggridgea peringueyi Simon, 1903, and three theraphosid baboon spider species (Figure 3f). One species of wolf spider, possibly Hogna transvaalica (Simon, 1898) (Lycosidae) (Figure 3g), also constructs burrows. These spiders use their bright red cheliceral setae to scare off predators (Webb 2013).
A species of the termite-eating spider, Ammoxenus coccineus Simon, 1893 (Ammoxenidae), was sampled from loose sand (Figure 3h). Ammoxenids are specialist termite-feeders (Petráková et al. 2015) and use the strong setae on their chelicerae to dive into the sand (Dippenaar-Schoeman, De Jager & Van den Berg 1996a; Dippenaar-Schoeman, De Jager & Van den Berg 1996b). Two species of medical importance were sampled at TKR, the violin spider Loxosceles simillima Lawrence, 1927 (Sicariidae) (Figure 3i) and the six-eyed sand spider Sicarius testaceus Purcell, 1908 (Sicariidae) (Figure 3j).
The plant wanderers sampled from the grass and tree layer are represented by 42 spp. (30.9%). The Thomisidae (16 spp.), Salticidae (eight spp.) and Oxyopidae (six spp.) were the most diverse plant-dwellers found on grasses, shrubs and trees. Three salticid species occur both on the ground and on vegetation (Appendix 1). Some interesting results have already been published regarding the presence of Peucetia viridis (Blackwall, 1858) (Figure 3k) of the family Oxyopidae, which was sampled from the unpalatable Kalahari sour grass (Bushman's Grass), Schmidtia kalahariensis. This annual grass is only available for a short period after good rains. It has an unpleasant smell and is covered with glands that produce an acidic substance. During the survey in 2008, this was the dominant grass present and it was intensively swept, but only this one species was recorded from the grass (Dippenaar-Schoeman 2005; Vasconcellos-Neto et al. 2007).
Several species were sampled from trees, including the long-spinnered bark spiders, Hersilia sericeaPocock, 1898 (Hersiliidae) (Figure 3l), and the community nest spiders, Stegodyphus dumicola Pocock, 1898 (Eresidae).
Web-dwellers: The web-dwellers are represented by 39 spp. (28.7%), with the largest number making OWB or MOWB (14 spp., 10.3%), followed by gumfoot-webs (eight spp., 5.9%), retreat-webs (eight spp., 5.9%), funnel-webs (five spp., 3.7%), sheet-webs (three spp., 2.2%) and space-webs (one sp., 0.7%).
The physical structure of the habitat plays a role in the composition of the web-dwelling fauna, as it not only provides the necessary support for anchoring webs but also increases the availability of retreat space and modification of the microclimate, which could have an effect on spiders, as well as their prey. Most of the OWB recorded belong to the Araneidae (11 spp.) (Figure 3m and n), which construct large orb-webs between trees and shrubs. Some of these species are diurnal and they are found in their webs during the day. Some orb-web builders are associated with grasslands (Araneus, Larinia, Nemoscolusand Neoscona) and are mostly nocturnal, making their orb-webs at night and resting in retreats, usually constructed in grass inflorescences, during the day. One species is a MOWB, the tropical tent-web spider (Cyrtophora citricola [Forsskål, 1775]). Several gumfoot-web spiders of the Theridiidae (eight spp.) were sampled, including two button spiders that are of medical importance, Latrodectus geometricus C.L. Koch, 1841 (Figure 3o) and L. renivulvatus Dahl, 1902.
Conclusion
As signatories to the Convention on Biodiversity, South Africa has an obligation to develop a strategic plan for the conservation and sustainable utilisation of its fauna and flora. Preliminary investigations into the biodiversity of the South African Arachnida highlighted the obstacles caused by a lack of baseline biodiversity and ecological information for many of the arachnid orders (Dippenaar-Schoeman 2002). With this in mind, each biodiversity survey contributes to improving our knowledge of the geographical distribution and biology of South African spider species. This survey forms part of the SANSA for the Savanna Biome, as well as the Northern Cape province, and as such represents new provincial records for 102 species. Although this article probably represents only a portion of the spider fauna present, we hope that this information will stimulate further interest and research. Established reserves, such as TKR, can make a substantial contribution towards invertebrate conservation. However, the contribution of existing reserves can only be highlighted through studies such as this.
Acknowledgements
The authors would like to thank the Agricultural Research Council (ARC) and the South African National Biodiversity Institute's (SANBI) Threatened Species Programme for funding the South African National Survey of Arachnida (SANSA) phase 2; Duncan MacFadyen of E. Oppenheimer & Son trust for providing permission to sample in Tswalu Kalahari Reserve and the officials of Tswalu for their friendliness and assistance; the staff of the Arachnology section of the Biosystematics Programme, ARC - Plant Protection Research, notably Connie Anderson, Sma Mathebula and Petro Marais, for their assistance with processing the material collected; Elisabeth Tybaert (wife of Rudy Jocqué), Petro Marais and Michael Stiller (ARC) for assisting during the fieldwork; and Galina Azarkina for assistance with the Salticidae identifications.
Competing interests
The authors declare that they have no financial or personal relationships that may have inappropriately influenced them in writing this article.
Authors' contributions
All the authors are team members of SANSA and contributed towards planning this national survey. They participated in field work, identifications of specimens and curation of material. A.S.D-S. and R.L. were involved in surveys, identifications and preparation of the manuscript; C.R.H. assisted with editing the manuscript; L.N.L. and R.J. assisted with field surveys; P.W. participated in field surveys and photographed all the specimens
Funding information
The first, second and fifth authors acknowledge financial support from the National Research Foundation of South Africa.
References
Acocks, J.P.H., 1988, 'Veld types of South Africa', 3rd edn., Memoirs of the Botanical Survey of Southern Africa 57, 1-146. [ Links ]
Azarkina, G.N. & Foord, S.H., 2015, 'A review of three Tusitala (Araneae: Salticidae) species from southern Africa, with a new synonymy and description of a new species from Botswana', African Invertebrates 56, 285-307. https://doi.org/10.5733/afin.056.0204 [ Links ]
Dippenaar-Schoeman, A.S., 2002, 'Status of South African Arachnida Fauna', Proceedings of the symposium on the Status of South African species organized by the Endangered Wildlife Trust (EWT) of South Africa, Rosebank, September 4-7, 2001, pp. 70-81. [ Links ]
Dippenaar-Schoeman, A.S., 2005, 'Interesting behaviour of a green lynx spider collected at Tswalu Game Reserve (Araneae: Oxyopidae: Peucetia)', Spider Club News 20, 8-9. [ Links ]
Dippenaar-Schoeman, A.S., 2013, 'First national species lists of South African arachnids available', Plant Protection News 95, 6. [ Links ]
Dippenaar-Schoeman, A.S., 2014a, 'What is new in SANSA - and plans for 2014', SANSA News 19, 3-6. [ Links ]
Dippenaar-Schoeman, A.S., 2014b, Field guide to the Spiders of South Africa, Lapa Publishers, Pretoria. [ Links ]
Dippenaar-Schoeman, A.S., 2017, 'Feedback on the Spider Red Listing Project (SRLP)', SANSA News 29, 3. [ Links ]
Dippenaar-Schoeman, A.S., De Jager, M. & Van den Berg, A., 1996a, 'Behaviour and biology of two species of termite-eating spiders, Ammoxenus amphalodes and A. daedalus (Araneae: Ammoxenidae), in South Africa', African Plant Protection 2, 15-17. [ Links ]
Dippenaar-Schoeman, A.S., De Jager, M. & Van den Berg, A., 1996b, 'Ammoxenus species (Araneae: Ammoxenidae) - Specialist predators of harvester termites in South Africa', African Plant Protection 2, 103-109. [ Links ]
Dippenaar-Schoemanl, A.S., Foord, S.H. & Haddad, C.R., 2013, Spiders of the Savanna Biome, University of Venda, Thohoyandou & Agricultural Research Council, Pretoria. [ Links ]
Dippenaar-Schoeman, A.S. & Haddad, C.R., 2006, 'What is the South African National Survey of Arachnida (SANSA) all about?', SANSA News 1, 1-3. [ Links ]
Dippenaar-Schoeman, A.S., Haddad, C.R., Foord, S.H., Lyle, R., Helberg, L. & Mathebula, S., 2010, First Atlas of the Spiders of South Africa (Arachnida: Araneae), ARC - Plant Protection Research Institute, Pretoria. [ Links ]
Dippenaar-Schoeman, A.S., Haddad, C.R., Foord, S.H., Lyle, R., Lotz, L.N. & Marais, P., 2015, 'South African National Survey of Arachnida (SANSA): Review of current knowledge, constraints and future needs for documenting spider diversity (Arachnida: Araneae)', Transactions of the Royal Society of South Africa 70, 245-277. https://doi.org//10.1080/0035919X.2015.1088486 [ Links ]
Dippenaar-Schoeman, A.S., Lyle, R. & Van den Berg, A.M., 2012, 'Bioinformatics on the spiders of South Africa', Serket 13, 121-127. [ Links ]
Dippenaar-Schoeman, A.S. & Van den Berg, A.M., 2010, Spiders of the Kalahari, Plant Protection Handbook No. 17, Agricultural Research Council, Pretoria. [ Links ]
Foord, S.H., Dippenaar-Schoeman, A.S. & Haddad, C.R., 2011a, 'South African spider diversity: African perspectives on the conservation of a mega-diverse group', in O. Grillo & G. Venora (eds.), Changing diversity in changing environment, pp. 163-182, In Tech Publishing, Rijeka. [ Links ]
Foord, S.H., Dippenaar-Schoeman, A.S. & Haddad, C.R., 2011b, 'The faunistic diversity of spiders (Arachnida, Araneae) of the Savanna Biome in South Africa', Transactions of the Royal Society of South Africa 66, 170-201. https://doi.org/10.1080/0035919X.2011.639406 [ Links ]
Haddad, C.R. & Dippenaar-Schoeman, A.S., 2005, 'Epigeic spiders (Arachnida: Araneae) in Nama Karoo grassland in the Northern Cape Province', Navorsinge van die Nasionale Museum, Bloemfontein 21, 1-10. [ Links ]
Haddad, C.R. & Dippenaar-Schoeman, A.S., 2006, 'Epigeic spiders (Araneae) in pistachio orchards in South Africa', African Plant Protection 12, 12-22. [ Links ]
Haddad, C.R. & Dippenaar-Schoeman, A.S., 2015, 'Diversity of non-acarine arachnids of the Ophathe Game Reserve, South Africa: Testing a rapid sampling protocol', Koedoe 57, 1255. https://doi.org/10.4102/koedoe.v57i1.1255 [ Links ]
Haddad, C.R., Dippenaar-Schoeman, A.S. & Pekár, S., 2005, 'Arboreal spiders (Arachnida: Araneae) in pistachio orchards in South Africa', African Plant Protection 11, 32-41. [ Links ]
Haddad, C.R., Louw, S.vdM. & Dippenaar-Schoeman, A.S., 2004, 'Spiders (Araneae) in ground covers of pistachio orchards in South Africa', African Plant Protection 10, 97-107. [ Links ]
Haddad, C.R., Louw, S.vdM. & Pekár, S., 2008, 'Commercial pistachio orchards maintain lower density and diversity of spiders (Araneae): A study from South Africa', African Plant Protection 14, 24-36. [ Links ]
Low, A.B. & Rebelo, A.G., 1998, Vegetation of South Africa, Lesotho and Swaziland, 2nd edn., Department of Environmental Affairs and Tourism, Government Printers, Pretoria. [ Links ]
Lyle, R. & Dippenaar-Schoeman, A.S., 2013, 'Sampling in the Diamond Route Reserves', SANSA Newsletter 18, 10. [ Links ]
Lyle, R. & Dippenaar-Schoeman, A.S., 2015, 'Red Listing of South African spiders', SANSA Newsletter23, 1. [ Links ]
Lyons, C.-L., 2009, 'Evaluating restoration success of alluvial diamond mined sites in South Africa using invertebrate community indicators', Unpublished MSc thesis, University of Cape Town. [ Links ]
McGeoch, M.A., Sithole, H., Samways, M.J., Simaika, J.P., Pryke, J.S., Picker, M. et al., 2011, 'Conservation and monitoring of invertebrates in terrestrial protected areas', Koedoe 53, 1000. https://doi.org/10.4102/koedoe.v53i2.1000 [ Links ]
Petráková, L., Líznarová, E., Pekár, S., Haddad, C.R., Sentenská, L. & Symondson, W.O.C., 2015, 'Discovery of a monophagous true predator, a specialist termite-eating spider (Araneae: Ammoxenidae)', Scientific Reports 5, 14013. https://doi.org/0.1038/srep14013 [ Links ]
Van Rooyen, N., 1999, The vegetation types and veld condition of Tswalu Private Desert Reserve, Unpublished report to the management of Tswalu Kalahari Reserve. [ Links ]
Vasconcellos-Neto, J., Romero, G.O., Santos, A.J. & Dippenaar-Schoeman, A.S., 2007, 'Association of spiders of the genus Peucetia (Oxyopidae) with plants bearing glandular hairs', Biotropica 39, 221-226. https://doi.org/10.1111/j.1744-7429.2006.00250.x [ Links ]
Webb, P., 2013, 'Defense mechanism in burrow-dwelling wolf spiders', SANSA News 18, 4. [ Links ]
Correspondence:
Charles Haddad
haddadcr@ufs.ac.za
Received: 08 Aug. 2017
Accepted: 09 Apr. 2018
Published: 09 July 2018
^rND^sAcocks^nJ.P.H.^rND^sAzarkina^nG.N.^rND^sFoord^nS.H.^rND^sDippenaar-Schoeman^nA.S.^rND^sDippenaar-Schoeman^nA.S.^rND^sDippenaar-Schoeman^nA.S.^rND^sDippenaar-Schoeman^nA.S.^rND^sDippenaar-Schoeman^nA.S.^rND^sDippenaar-Schoeman^nA.S.^rND^sDe Jager^nM.^rND^sVan den Berg^nA.^rND^sDippenaar-Schoeman^nA.S.^rND^sDe Jager^nM.^rND^sVan den Berg^nA.^rND^sDippenaar-Schoeman^nA.S.^rND^sHaddad^nC.R.^rND^sDippenaar-Schoeman^nA.S.^rND^sHaddad^nC.R.^rND^sFoord^nS.H.^rND^sLyle^nR.^rND^sLotz^nL.N.^rND^sMarais^nP.^rND^sDippenaar-Schoeman^nA.S.^rND^sLyle^nR.^rND^sVan den Berg^nA.M.^rND^sFoord^nS.H.^rND^sDippenaar-Schoeman^nA.S.^rND^sHaddad^nC.R.^rND^sFoord^nS.H.^rND^sDippenaar-Schoeman^nA.S.^rND^sHaddad^nC.R.^rND^sHaddad^nC.R.^rND^sDippenaar-Schoeman^nA.S.^rND^sHaddad^nC.R.^rND^sDippenaar-Schoeman^nA.S.^rND^sHaddad^nC.R.^rND^sDippenaar-Schoeman^nA.S.^rND^sHaddad^nC.R.^rND^sDippenaar-Schoeman^nA.S.^rND^sPekár^nS.^rND^sHaddad^nC.R.^rND^sLouw^nS.vdM.^rND^sDippenaar-Schoeman^nA.S.^rND^sHaddad^nC.R.^rND^sLouw^nS.vdM.^rND^sPekár^nS.^rND^sLyle^nR.^rND^sDippenaar-Schoeman^nA.S.^rND^sLyle^nR.^rND^sDippenaar-Schoeman^nA.S.^rND^sMcGeoch^nM.A.^rND^sSithole^nH.^rND^sSamways^nM.J.^rND^sSimaika^nJ.P.^rND^sPryke^nJ.S.^rND^sPicker^nM.^rND^sPetráková^nL.^rND^sLíznarová^nE.^rND^sPekár^nS.^rND^sHaddad^nC.R.^rND^sSentenská^nL.^rND^sSymondson^nW.O.C.^rND^sVasconcellos-Neto^nJ.^rND^sRomero^nG.O.^rND^sSantos^nA.J.^rND^sDippenaar-Schoeman^nA.S.^rND^sWebb^nP.^rND^1A01^nNqobile S.^sZungu^rND^1A01^nTheo H.C.^sMostert^rND^1A01^nRachel E.^sMostert^rND^1A01^nNqobile S.^sZungu^rND^1A01^nTheo H.C.^sMostert^rND^1A01^nRachel E.^sMostert^rND^1A01^nNqobile S^sZungu^rND^1A01^nTheo H. C^sMostert^rND^1A01^nRachel E^sMostert

ORIGINAL RESEARCH
Plant communities of the uMlalazi Nature Reserve and their contribution to conservation in KwaZulu-Natal
Nqobile S. ZunguI; Theo H.C. MostertI; Rachel E. MostertII
IDepartment of Botany, University of Zululand, South Africa
IIDepartment of Biology, Felixton College, South Africa
ABSTRACT
Vegetation research is an important tool for the simplified and effective identification, management and conservation of the very complex ecosystems underlying them. Plant community descriptions offer scientists a summary and surrogate of all the biotic and abiotic factors shaping and driving ecosystems. The aim of this study was to identify, describe and map the plant communities within the uMlalazi Nature Reserve. A total of 149 vegetation plots were sampled using the Braun-Blanquet technique. Thirteen plant communities were identified using a combination of numeric classification (modified Two-way-Indicator Species Analysis) and ordination (non-metric multidimensional scaling). These communities were described in terms of their structure, floristic composition and distribution. An indirect gradient analysis of the ordination results was conducted to investigate the relationship between plant communities and their potentially important underlying environmental drivers. Based on the results, the floristic conservation importance of each plant community was discussed to provide some means to evaluate the relative contribution of the reserve to regional ecosystem conservation targets.
CONSERVATION IMPLICATIONS: The uMlalazi Nature Reserve represents numerous ecosystems that are disappearing from a rapidly transforming landscape outside of formally protected areas in Zululand. The descriptions of the plant communities of these relatively pristine ecosystems provide conservation authorities with inventories and benchmarks with which the ecological health of similar ecosystems in the region can be measured.
Introduction
Vegetation research is an important tool for the simplified and effective identification, management and conservation of the very complex underlying ecosystems. Plant community descriptions offer scientists a summary and surrogate for the bewildering combinations of biotic and abiotic factors shaping and driving ecosystems. In response to a recent request by Ezemvelo KwaZulu-Natal Wildlife (EKZNW), this study of the plant communities of the uMlalazi Nature Reserve (uMNR) was conducted as a first attempt to provide such a vegetation description. In order to establish the uniqueness and conservation importance of the uMNR's plant communities, comparisons were made with existing vegetation descriptions from the literature. Without scientifically based ecological information and interpretation of vegetation data, conservation authorities will not be able to either report meaningfully on the state of the vegetation under their management, or set and adapt conservation priorities as required by the National Environmental Management Biodiversity Act (Act 10 of 2004) (Von Maltitz, Van Wyk & Everard 1996:188-195).
Previous vegetation studies in the uMNR were conducted at a relatively coarse scale, aimed at providing very general trends within the major vegetation types (Nevill & Nevill 1995:51-58; Todd 1994; Weisser 1978a:95-97). Vegetation maps that were compiled in the past were based on dominant species and vegetation structure classes (Todd 1994; Weisser 1978b). To date, no detailed plant community descriptions based on total floristic composition have been conducted for the uMNR. The only detailed description of these ecosystems comes from the neighbouring Pennington Park by Moll (1972:615-626). Detailed vegetation descriptions for other ecosystems within the Indian Ocean Coastal Belt (IOCB) biome have been published for Tshanini Game Reserve (Gaugris et al. 2004:9-29), Tembe Elephant Park (Matthews et al. 2001:573-594), Lake Eteza Nature Reserve (Neumann, Scott, Bousman & Van As 2010:39-53) and Sileza Nature Reserve (Matthews et al. 1999:151-167). Other detailed plant ecology studies have focussed on foredune advancement, dune vegetation changes and changes in grassland communities (Weisser 1978a:95-97; Weisser, Garland & Drews 1982:127-130; Weisser & Muller 1983:661-667).
Study area
The uMNR (28°56′S, 31°46′E) is situated directly south of Mtunzini, within the northern half of KwaZulu-Natal, in the southern section of Zululand, South Africa (Todd 1994; Traynor et al. 2010). This coastal reserve (1469 ha) forms part of the Maputaland-Pondoland-Albany Biodiversity Hotspot and the Maputaland Centre of Floristic Endemism (Van Wyk & Smith 2001). The centre contains approximately 2500 infraspecific taxa, of which 9.2% are regarded as near-endemics. The climate of the study area is subtropical with hot, humid summers and mild winters with no frost (Nevill & Nevill 1995:51-58; Todd 1994). The mean annual rainfall fluctuates between 819 mm and 1272 mm, with approximately two-thirds falling in mid-summer and the remaining one-third falling in early winter (Mucina & Rutherford 2006; Tyson & Preston-Whyte 2000).
The ages of the dune fields of the Maputaland coastal plain range from the early Pleistocene (± 5 Ma) to 500 years ago. The dunes of the Maputaland coastal plain are among the most recent geological formations that are found in southern Africa (Gaugris et al. 2004:9-29), with the uMNR beachfront classified as prograding (actively expanding). The soil of the uMNR consists of fine-grained marine sands, typically yellowish or grey apedal soil with early horizon development. The A-horizon is usually thin and enriched with organic matter. Subsoil horizons often show sparse ferruginous mottles. The resulting soil types are classified according to the South African system as mainly cover sands, with some Fernwood soil forms and some very limited Champagne soil formations along the waterlogged bottomlands (Fey 2010:32-35; Matthews et al. 2001:573-594).
This combination of a water-rich environment and highly permeable sandy substrates is the main driver of the vegetation patterns of this biome. The region forms part of the IOCB biome, which is a complex mosaic of zonal, intrazonal and azonal vegetation types (Mucina & Rutherford 2006). The uMNR and its immediate surroundings contain the following major vegetation types: FOz 7 Northern Coastal Forest, FOa 2 Swamp Forest, FOa 3 Mangrove Forest, AZe Subtropical Estuarine Salt Marshes, AZs 3 Subtropical Dune Thicket, AZd 4 Subtropical Seashore Vegetation and AZf 6 Subtropical Freshwater Wetlands (Mucina & Rutherford 2006). Cultivation, afforestation, mining, urban sprawl and invasive alien plants are major threats to the remaining untransformed patches of IOCB vegetation (EKZNW 2009).
Methods
The study area was stratified into homogenous vegetation units using texture and colour classes on aerial imagery (Google Earth 7.1.2.2041 2016). After a reconnaissance of the area to ensure the homogeneity of vegetation units, 149 plots were randomly selected within each of the different homogenous units on the imagery. In the field, however, each sampling plot was critically evaluated according to the first rule of the Zurich-Montpellier sampling method (the placement of the sampling plot should be within a homogeneous vegetation patch that is representative of the perceived plant community). If the sampling plot did not fall within a homogeneous representative vegetation stand, it was moved to the nearest locality that fulfils this criterion. Accessibility to the plot was also taken into consideration.
The Braun-Blanquet sampling method (Werger & Coetzee 1978) was specifically chosen for its international recognition as the most appropriate technique for the description of vegetation when based on total floristic composition (Brown et al. 2013). By using an internationally accepted standard, the data and vegetation description will be compatible and comparable with data from other regions and landscapes. Such comparability and compatibility is crucial for the regional and international coordination of vegetation and ecosystem conservation. Based on the recommendations by Brown et al. (2013), plot sizes varied according to the vegetation types sampled (grasslands 9 m2, salt marshes 25 m2, wetland vegetation 25 m2, foredune communities 49 m2, swamp communities 49 m2 and forest communities 1000 m2) and were marked out in the field to ensure consistency. In all sample plots, each plant species was recorded and the cover-abundance value of each species determined using the modified Braun-Blanquet cover-abundance scale: r (very rare, with a negligible cover), + (present but not abundant, with a cover value of < 1% of the quadrat), 1 (numerous but covering less than 1% of the sample area), 2a (covering 5% - 12% of the sample area), 2b (covering 13% - 25% of the sample area), 3 (covering 25% - 50% of the sample area), 4 (covering 50% - 75% of the sample area), 5 (covering 75% - 100% of the sample area) (Brown et al. 2013).
The names of the plant species follow the latest taxonomy, as provided by the South African Biodiversity Institute online from the Plants of South Africa (POSA), which was last accessed at http://www.ville-ge.ch/musinfo/bd/cjb/africa/ on 15 June 2017. Fieldwork was conducted during the peak growing season (October 2014 - February 2015). The vegetation structure was recorded and described based on the height and canopy cover of the different strata (tall trees, short trees, shrubs, lianas and herbaceous strata) within each plant community and classified in accordance with Edwards' structural classification (Edwards 1983:705-712).
The phytosociological data were captured in TURBOVEG (Hennekens & Schaminee 2001:589-591), where relevés were created and exported as a Cornell condensed format file into JUICE 7.0.84 (Tichy 2002) for analysis. The modified Two-way-Indicator Species Analysis (TWINSPAN) algorithm as contained within JUICE (Tichy 2002) was used to classify the floristic data. The classification of different plant communities was based on total floristic composition, with pseudo-species cut levels set at 0, 1, 5, 12, 25, 50 and 75. Before the classification was performed, all relevé cluster sizes were standardised in order to remove phi coefficient dependence on cluster size. The fidelity of species to the various plant communities was calculated using the phi coefficient. Fisher's exact test was used to calculate the statistical significance (p > 0.001) of the fidelity values calculated for each species. The diagnostic values of species were based on their fidelity to each community, with phi coefficient threshold values set at > 33% (Chytrý et al. 2002:79-90), while dominant species were identified based on their relative cover-abundance within each of the resulting plant communities.
An ordination of the floristic data was performed using a non-metric multidimensional scaling (NMDS) within PC-ORD (McCune & Mefford 1999) in order to visualise dissimilarities between samples in a two-dimensional scatter plot. Environmental data gathered during the vegetation surveys were mostly qualitative descriptions of the physical parameters associated with the various sample sites. At each sample site, attention was focussed on those environmental variables that were deemed more influential with regard to driving vegetation composition and structure. A conscious decision was therefore made to gather detailed environmental data specific and relevant to each sample site, and not a standardised matrix of generalised environmental parameter data. For this reason, it was decided that an indirect gradient analysis would be attempted, based on the detailed sample site descriptions, instead of a direct gradient analysis based on generalised and often irrelevant environmental parameters. All the observations were made based on field testing, with no laboratory testing conducted. The following scales were used to ensure robust and reliable categories for the environmental variables recorded:
-
percentage of soil clay content (sausage texture method): < 10, 10-14, 15-19, 20-34, 35-55, > 55
-
water drainage from the soil column based on soil texture: fast, medium, slow, stagnant
-
water drainage from the landscape based on runoff potential: fast, medium, slow, stagnant
-
soil moisture: saturated, moist, dry
-
soil salt content (electrical conductivity): high (oceanic saltwater contamination), low (no oceanic saltwater contamination)
-
organic content of soil (visual recognition of fibre particles): high (> 10% of horizon volume), some (< 10%), none
-
anthropogenic disturbance levels: high, moderate, low, none
-
wind exposure: high, medium, low
-
sunlight penetration to lower vegetation strata: full shade (> 80%), partial shade (40% - 79%), highly exposed (< 40%).
Plant community names were assigned following the guidelines suggested by Brown et al. (2013), namely, a diagnostic species followed by a dominant species followed by a structural or landscape description. The mapping of the plant communities was performed using Google Earth 7.1.2.2041 (unprojected) and the final output was compiled in Quantum GIS 2.14.1.
Ethical considerations
A plant collection permit (OP 4829/2014) for identification and herbarium preparation was obtained from Ezemvelo KwaZulu-Natal Wildlife (EKZNW) for use in the uMlalazi Nature Reserve.
Results
Classification
The results from the modified TWINSPAN classification and the NMDS ordination are presented in a dendrogram (Figure 1), an ordination scatter plot (Figure 2), a synoptic table (Online Appendix 1) and a full phytosociological table (Online Appendix 2). The environmental parameters associated with the segregation of the various relevé clusters are presented as part of the classification dendrogram (Figure 1). The results from the indirect gradient analysis superimposed on the NMDS ordination scatter plot are presented in Figure 2. Based on the combined results from the modified TWINSPAN classification and the NMDS ordination of the uMNR vegetation, 13 different plant communities were identified:
-
Salicornia meyeriana-Avicennia marina salt marsh community
-
Bruguiera gymnorrhiza-Avicennia marina mangrove forest
-
Phragmites australis-Juncus kraussii saline wetland
-
Scaevola plumieri-Gazania rigens foredune community
-
Typha capensis-Cyperus dives wetland community
-
Digitaria eriantha-Dactyloctenium australe secondary coastal grasslands
-
Stenotaphrum secundatum-Phragmites australis temporary wetlands
-
Passerina rigida-Carpobrotus dimidiatus dune scrub community
-
Adenopodia spicata-Vachellia robusta riverine woodland community
-
Albizia adianthifolia-Trichilia emetica disturbed coastal dune forest
-
Tricalysia sonderiana-Apodytes dimidiata dune forest margin
-
Gymnosporia arenicola-Protorhus longifolia coastal dune forest
-
Carissa bispinosa-Mimusops caffra climax coastal dune forest.
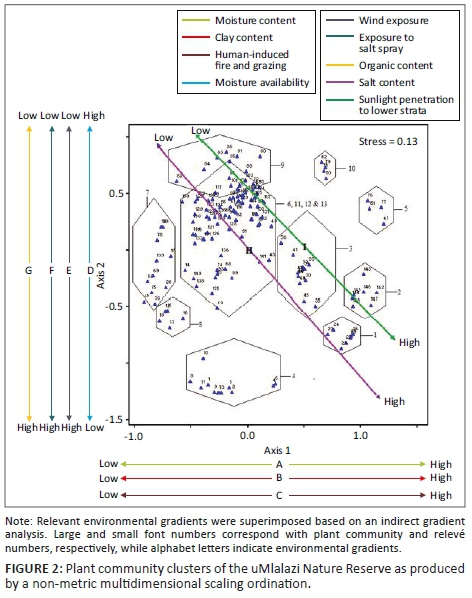
Representative photographs of the various plant communities are presented in Figure 3.
Ordination
The NMDS ordination (149 relevés) resulted in a scatter diagram with nine distinct clusters when viewed as a two-dimensional plot along axes 1 and 2 (Figure 2). The indirect gradient analysis superimposed onto the scatter diagram revealed the following potential environmental gradients between plant communities, based on the relative distances and sequences among clusters: soil moisture availability, water drainage capability of soils within different parts of the landscape, clay and salt content of soils, effects of fire and grazing, effects of organic content in the upper soil profile and effects of salt-clipping by oceanic salt spray driven by onshore winds.
Species richness
The mean species richness per relevé within plant communities is indicated in Figure 4. Plant communities 1-5 show very low levels of species richness and are associated with wetlands and newly formed dunes. These communities can generally be regarded as very harsh to plant life, with only a few specialist species adapted to survive in them. These environmental conditions include soils that are flooded for prolonged periods of time, tidal folding regimes, hyper-saline soils, mobile structureless soils and salt-laden oceanic wind. Plant communities 6, 8, 9, 10, 12 and 13 show relatively high species richness. These plant communities are associated with the more stable soils and more mesic conditions of the sheltered dune forests and grasslands. Communities 9, 10, 12 and 13 revealed the highest species richness in the uMNR.

Plant community descriptions
Plant community 1: Salicornia meyeriana-Avicennia marina salt marsh community
The Salicornia meyeriana-Avicennia marina salt marsh community is located within certain estuarine sections of the uMlalazi River floodplains (Figure 5). These sections of the floodplains do not drain freely after the regular seasonal flooding events, and act as natural evaporation pans. The combination of saltwater exposure from tidal movements and the evaporation of water from the temporary pans lead to the hyper-accumulation of salt in the soil of this plant community. These alluvial soils generally contain large percentages of silt, with very little organic matter. The community has a very low vegetation cover and a simple vegetation structure. Its structure varies from open (10%) to patches of closed (75%), low herbaceous vegetation, mostly clumped into colonies of S. meyeriana.
The diagnostic species for this plant community, the succulent species S. meyeriana, is listed in Species Group (SG A) of the synoptic table (Online Appendix 1). The dominant species for this community are displayed in the full phytosociological table (Online Appendix 2) and include the low-growing halophytic succulent S. meyeriana (SG A) and the tree species A. marina (SG B). However, A. marina has a low cover-abundance value within this plant community. Based on the vegetation structure and composition, this plant community is regarded as a part of the major vegetation type AZe 3 Subtropical Estuarine Salt Marshes, as described by Mucina and Rutherford (2006). Although some authors have described similar subtropical salt marsh vegetation (Colloty, Adams & Bate 2002; Lubke 1997; Venter 1972), no equivalent to that of the uMNR was observed in the literature.
Despite the very low species richness recorded for this plant community (2 ± 0.5 s.d.), its conservation value is considered to be high, based on its unique floristic composition and the unique and dynamic nature of this ecosystem. It acts as a refuge for Benthic organisms during low tides and as rich feeding grounds for many vertebrate species during unusually high tides (Bromberg-Gedan, Silliman & Bertness 2009).
Plant community 2: Bruguiera gymnorrhiza-Avicennia marina mangrove forest
The Bruguiera gymnorrhiza-Avicennia marina mangrove forest community is restricted to some of the very narrow intertidal zones of the uMlalazi River in the study area (Figure 5). The soils of this community are poorly drained, saline, anoxic and fine-grained. These silt- and clay-rich soils are mostly waterlogged. This community is typically species-poor, dominated by one or two species, and with a dense vegetation cover. Structurally, this community varies from medium to tall, closed mangrove forest (5 m - 8 m).
The diagnostic tree species for this community are B. gymnorrhiza and A. marina (SG B, Online Appendix 1). The most dominant tree species in this community are presented in the full phytosociological table (SG B, Online Appendix 2) and include the tree A. marina, with only a few other visually prominent species such as the perennial sedge Juncus kraussii. Based on the vegetation structure and composition, this plant community is regarded as a part of the major vegetation type FOa 3 Mangrove Forest, as described by Mucina and Rutherford (2006). The mangrove community of the uMNR is similar to those described by Moll and Werger (1978), Steinke (1995) and Colloty et al. (2002).
The very extreme and constantly changing environmental conditions of these intertidal ecosystems make them very challenging for terrestrial plant life. Only those plant species that are specifically adapted to deal with both flooded saline conditions, when the tide is in; and extreme desiccation, when the tide is out, are able to colonise these ecosystems. Without competition from less-adapted plant species, such plant communities become dominated by a handful of specialists, such as mangrove tree species. The conservation value of such plant communities therefore does not lie in its plant diversity, but in its ecosystem functionality.
Plant community 3: Phragmites australis-Juncus kraussii saline wetland
The Phragmites australis-Juncus kraussii saline wetland plant community occurs within the floodplains of the uMlalazi River in places where saltwater contamination occurs during super-tidal events. It is periodically flushed by freshwater flooding events from the river (Figure 5). Within the floodplains, this community forms a mosaic distribution pattern with the Salicornia meyeriana-Avicennia marina salt marsh community. Soils are typically saline, with high silt, clay and organic components. Water drainage is slow and even stagnant in some cases, leading to the accumulation of organic material in these anaerobic conditions. The vegetation is structurally characterised by a medium to tall, closed reed and sedgeland (1.5 m - 3.5 m). The vegetation of this very dynamic ecosystem is regularly harvested of the sedge species J. kraussii and the reed species P. australis for the weaving and building industry.
The only diagnostic species for this community is the sedge species J. kraussii (SG C, Online Appendix 1). The dominant species (Online Appendix 2) include the reed species P. australis (SG H), the sedge species J. kraussii (SG C), the forb species Ipomoea cairica (SG D) and the grass species Stenotaphrum secundatum (SG G).
This plant community, with its mosaic of reed and sedge-dominant patches, is the result of fluctuating salinity at both spatial and temporal scales. Wherever and whenever salinity rises, the reed species are negatively affected, and the more salt-tolerant J. kraussii outcompetes the reeds. When salt is flushed from the system, the reeds gain the competitive advantage and outcompete J. kraussii. The relatively high cover-abundance values recorded for the grass species S. secundatum are regarded as an artefact of the drought conditions that prevailed at the time when surveys were conducted. Under more normal flood conditions, this grass species would be drowned, only occupying the better drained fringes of these wetlands. Based on the vegetation structure and composition, this plant community is regarded as a part of the major vegetation type AZe Subtropical Estuarine Salt Marshes, as described by Mucina and Rutherford (2006). Juncus kraussii-dominated saline sedgelands occur widely, spread along the estuaries of the east coast of South Africa (Colloty et al. 2002; Taylor, Adams & Haldorsen 2006). Just like in the uMNR, these communities are dynamic in their response to fluctuations in salinity.
Plant community 4: Scaevola plumieri-Gazania rigens foredune community
The Scaevola plumieri-Gazania rigens foredune plant community occupies the seaward side of the first dune above the high-water mark along the beach (Figure 5). At this point in the landscape the sand is still very mobile and contains virtually no organic matter as yet. Water drainage is fast and salinity is relatively high because of oceanic salt spray. The vegetation structure is relatively simple, with mainly one layer of herbaceous plants with an average height of 0.4 m. As a result, the vegetation structure for this community can be described as patches of low, closed herblands, with large stretches of open, uncolonised mobile sand between the vegetation patches.
The diagnostic species for this plant community include the succulent shrublet S. plumieri (SG D Online Appendix 1), the perennial trailing herb Ipomoea pes-caprae (SG D) and the creeping perennial herb G. rigens (SG D). The most dominant species in this community (Online Appendix 2) is the creeping perennial herb G. rigens (SG D). Other visually prominent species include the forbs I. pes-caprae (SG D) and S. plumieri (SG D), the succulent forb Carpobrotus dimidiatus (SG I) and the shrubs Rhynchosia nitens(SG I) and Chrysanthemoides monilifera (SG I).
Although the recorded species richness is relatively low, this plant community plays a very important ecological role in stabilising the prograding (expanding) beaches of Zululand. This can be seen as the first in a long series of successional stages from dune colonisation to the final climax state of mature coastal dune forest. Based on the vegetation structure and composition, this plant community is regarded as a part of the major vegetation type AZd 4 Subtropical Seashore Vegetation, as described by Mucina and Rutherford (2006). Plant communities and vegetation types similar to the one described for the uMNR occur along large sections of the Zululand coast and have been described by Lubke et al. (1997).
Plant community 5: Typha capensis-Cyperus dives wetland community
The Typha capensis-Cyperus dives wetland community occurs in interdune depressions where groundwater breaks the surface to form perennial wetlands of various sizes (Figure 5). The sandy soils are waterlogged and contain high percentages of clay particles (30%) and very high percentages of organic matter (> 10%). No distinction was made between groundwater and surface water sources within these highly permeable sandy substrates. The structure of this community can be described as a tall, closed reedland (2 m - 4 m), with a cover value of > 85% at the height of the growing season.
The diagnostic species for this plant community (SG E, Online Appendix 1) include the perennial sedge C. dives, the forb Persicaria serrulata, the bulrush T. capensis, the fern Cyclosorus interruptus and the palm Phoenix reclinata. The aforementioned species were, incidentally, also recorded as the most dominant in terms of cover-abundance values (SG E, Online Appendix 2). Such patterns of low species richness coupled with an equally low evenness of dominant species are very typical of wetland ecosystems where only specially adapted species can compete for the available resources. As with many South African wetlands, the conservation value of the associated plant community does not lie in its floristic diversity or uniqueness, but rather in its ecosystem functionality. Within the southern sections of the uMNR, this plant community has been disturbed and degraded by illegal grazing practised by neighbouring rural communities. Based on the vegetation structure and composition, this plant community is regarded as a part of the major vegetation type AZf 6 Subtropical Freshwater Wetlands, as described by Mucina and Rutherford (2006). Very few vegetation descriptions that are floristically similar to the Typha capensis-Cyperus dives wetland community occurring within the uMNR could be found in the literature (Venter 1972). Despite its relatively common occurrence throughout the coastal dune systems of Zululand, it is very common for azonal vegetation types such as this to be overlooked and neglected during conventional mapping exercises.
Plant community 6: Digitaria eriantha-Dactyloctenium australe secondary coastal grasslands
The Digitaria eriantha-Dactyloctenium australe secondary coastal grassland community includes one section along the southern section of the uMNR and one section of the newly acquired land along the north-eastern border of the uMNR (Figure 5). The southern section was mainly forest and woodlands before being transformed into grassland by human activities. It is characterised by frequent disturbances in the form of fire and cattle grazing induced by the neighbouring human population along the southern border of the reserve. Soils are sandy with low levels of organic content. This fire-suppressed, subclimax plant community has a short, closed vegetation structure. The northern section of secondary grassland is a remnant of grassland transformed by agricultural activities.
The diagnostic species for this plant community (SG F, Online Appendix 1) include the grass species D. eriantha, D. australe, Sporobolus africanus, Imperata cylindrica and Stiburus alopecuroides, the sedges Kyllinga alata and Cyperus species and the forbs Helichrysum ruderale, Rhynchosia caribaea, Wahlenbergia benghalensis and Manulea parviflora. The dominant species (Online Appendix 2) in this community include the grass species D. australe, S. africanus, I. cylindrica and D. eriantha (SG F). Some woody species that occur within this community include the low shrub Eugenia capensis(SG N), the straggling shrub Searsia nebulosa (SG H) and the dwarf shrublet Chironia baccifera (SG H).
In its current state as a fire-suppressed, subclimax plant community, the conservation value of the southern secondary grassland, based on floristic composition, is regarded as relatively low. Although EKZNW strives to conserve as much tropical grasslands as possible, this secondary grassland should not be calculated as part of the proposed target set for grassland conservation. From a plant conservation perspective, it is recommended that this plant community be allowed to return to its climax state of coastal dune forest. The northern grassland, however, with its very different origins, is regarded as potentially very important for conservation, based on its potential recovery towards a tall and dense wet grassland. Its conservation value will predominantly lie in creating habitat for fauna species of potential concern. Based on the vegetation structure and composition, this northern grassland is regarded as a part of the very diverse major vegetation type CB 1 Maputaland Coastal Belt, as described by Mucina and Rutherford (2006). Although no equivalent for this uMNR plant community was found in the literature, Mucina and Rutherford (2006) specifically mentioned the abundance of these secondary coastal grasslands. However, all of them are floristically and structurally very different because of their varied origins and the varied disturbance regimes that created them. Most of them are species-poor and occur as early successional stages.
Plant community 7: Stenotaphrum secundatum-Phragmites australis temporary wetlands
The Stenotaphrum secundatum-Phragmites australis temporary wetlands community occurs along depressions within the uMlalazi River floodplain where enough surface water accumulates to form temporary wetlands (Figure 5). The alluvial soil contains enough clay to form a water-impermeable layer that prevents water from draining away. This ecosystem is driven by surface water from seasonal flooding events and rain water. It also occurs, to a limited extent, along small interdune sections where fluctuating groundwater levels create temporary wetlands. Depending on the duration and seasonality of each wetland, varying amounts of organic matter accumulate within them.
The vegetation structure can be described as tall, closed reedland (2 m - 4 m), with a cover value of > 85%. However, there is a cyclical alteration of dominance between the grass and the reed component of this wetland community. During high rainfall, soils are waterlogged, promoting reed growth and effectively drowning stoloniferous grass species. During low rainfall, soils tend to be better aerated, promoting the grass component. At the time of the field surveys, Zululand experienced severe drought conditions, with the lowest average annual rainfall in recorded history for the uMlalazi region (SA Weather Service 2017).
The diagnostic species include the grasses S. secundatum and Paspalum dilatatum, herbs such as Ipomoea cairica, Hibiscus trionum and Cissampelos hirta and the sedge Cyperus eragrostis (SG G, Online Appendix 1). The most dominant species (Online Appendix 2) for this community is the sedge P. australis (SG H). Other dominant species include the grass S. secundatum (SG G) and the herbs I. cairica (SG G), H. trionum (SG G) and Asystasia gangetica (SG U). Based on the vegetation structure and composition, this plant community is regarded as a part of the major vegetation type AZf 6 Subtropical Freshwater Wetlands, as described by Mucina and Rutherford (2006). Venter (1972), and Begg and Carser (1988) described similar plant communities and indicated their widespread occurrence within the Zululand region.
Plant community 8: Passerina rigida-Carpobrotus dimidiatus dune scrub community
The Passerina rigida-Carpobrotus dimidiatus dune scrub community is found along the second and third dunes from the beach (Figure 5). This community is established on young dunes, which have slightly higher organic matter content than beach sand with no vegetation. The vegetation structure can generally be described as low (1 m) coastal scrub and thickets, with an open to closed canopy structure (30% - 90%). The trees and shrubs that grow in this community are dwarfed, with a compact canopy flattened by wind-shearing and salt-clipping on the windward sides of dunes. The more protected leeward slopes of the older dunes, however, are characterised by a significantly taller thicket vegetation (3 m - 4 m). These tall thickets along the leeward sides are regarded as the early stages of forest formation.
The diagnostic species (SG I, Online Appendix 1) with the highest fidelity for this community is the shrub P. rigida, which usually grows up to 1.5 m in height. Other diagnostic species in this community include the shrubs Carissa bispinosa, C. monilifera, Osyris compressa, Brachylaena discolor, Tephrosia purpurea, Dichrostachys cinerea and Searsia nebulosa; the grass Stipagrostis zeyheri; the sedges Kyllingaspecies and Cyperus species; the perennial trailing succulent C. dimidiatus; the forbs Senecio species and Rhynchosia nitens; the creeper Abrus precatorius; and the woody climber Rhoicissus digitata.
The dominant species (Online Appendix 2) in this community include C. dimidiatus (SG I), the grass S. zeyheri (SG I), the sedges Kyllinga species (SG I) and Cyperus species (SG I), the herbs Senecio species (SG I) and R. nitens (SG I) and the shrubs Eugenia capensis (SG N), C. bispinosa (SG Q), C. monilifera (SG I), B. discolor (SG I), T. purpurea (SG I), D. cinerea (SG I), S. nebulosa (SG I) and Chironia baccifera (SG P). Other visually prominent trees in this community include Mimusops caffra (SG Q), Apodytes dimidiata (SG L), Kraussia floribunda (SG R) and Allophylus natalensis (SG U). Based on the vegetation structure and composition, this plant community is regarded as a part of the major vegetation type AZs 3 Subtropical Dune Thicket, as described by Mucina and Rutherford (2006). Weisser (1978b), Weisser et al. (1982:127-130) and Donnelly and Pammenter (1983:705-712) also described this widespread plant community at numerous other Zululand locations.
Plant community 9: Adenopodia spicata-Vachellia robusta riverine woodland community
The Adenopodia spicata-Vachellia robusta riverine woodland community occurs along the better-draining sections of uMlalazi River floodplain (Figure 5). The structure comprises a tall, dense tree layer and a well-developed dense shrub layer. It is associated with deep, fine-textured soils of recent alluvial deposits that are subject to frequent seasonal flooding. The soils drain freely and do not stay waterlogged for extended periods of time. Deep-rooted trees along the riverbank have year-round access to water from this perennial river.
The diagnostic species for this plant community (SG J, Online Appendix 1) include the shrubs A. spicata, Tricalysia lanceolata, Hibiscus tiliaceus, Canthium inerme, Pavetta lanceolata, Scutia myrtina, Tecoma capensis and Clausena anisata. The diagnostic herbs include Scadoxus membranaceus, Chenopodium ambrosioides, Oxalis droseroides, Nidorella undulata and Scadoxus puniceus. The diagnostic trees include V. robusta and Tarenna pavettoides.
The most dominant species for this community (Online Appendix 2) include the tree species V. robusta (SG J); the shrubs A. spicata, H. tiliaceus, C. inerme, P. lanceolata, S. myrtina, T. capensis and C. anisata; the herb Asystasia gangetica; and the geophytes S. membranaceus and S. puniceus (SG J). Because of the very dynamic nature of flooding events along this section of the uMlalazi River, the floodplain is highly heterogeneous at both a special and a temporal level. This prohibits the formation of typical Lowveld Riverine Forest (FOa 1) (Mucina & Rutherford 2006). However, we argue that the Adenopodia spicata-Vachellia robusta riverine woodland community is essentially an early successional stage within the major regional vegetation type. Similar plant communities were described by Whateley and Porter (1983:745-758) further inland along the Nyalazi, Hluluwe and uMfolozi rivers.
Plant community 10: Albizia adianthifolia-Trichilia emetica disturbed coastal dune forest
The Albizia adianthifolia-Trichilia emetica disturbed coastal dune forest community has weakly developed sandy-loamy soils with a high organic content in the upper layers. The average total cover for this community is 80% and bare patches make up 20% - 25%. Structurally, this community qualifies as a forest. However, because of varying degrees of disturbance to the different vegetation strata, these forests have lost their structural diversity and complexity. Disturbances recorded throughout this community include fire; wind; the presence of charcoal pits, animal traps, footpaths and roads; subtropical storms; the harvesting of timber, firewood and medicinal plants; alien plant invasions; and the slumping of unstable dunes and substrates. Footpaths were particularly widespread throughout the study area, leading to soil erosion.
The diagnostic species for this community include the trees T. emetica, A. adianthifolia, Euclea natalensis, Erythrina lysistemon, Apodytes dimidiata, Clerodendrum glabrum, Cussonia zuluensis, Trimeria grandifolia, Deinbollia oblongifolia and Ekebergia capensis; the invasive alien shrubs Chromolaena odorata and Lantana camara; the native shrubs Rhynchosia totta and Searsia nebulosa; the forb Bidens pilosa; and the grass species Digitaria longiflora (SG K, Online Appendix 1).
The most dominant species (Online Appendix 2) include the forb B. pilosa; the trees T. emetica (SG K), E. lysistemon (SG K), A. dimidiata (SG L), C. glabrum (SG K), C. zuluensis (SG K), E. capensis (SG K), T. grandifolia (SG K) and D. oblongifolia (SG K); and the shrubs C. odorata (SG K), L. camara (SG K), R. totta (SG K), S. nebulosa (SG I) and E. natalensis (SG M). Based on the vegetation structure and composition, this plant community is regarded as a middle-to-late successional stage of coastal dune forest within the major vegetation type FOz 7 Northern Coastal Forest, as described by Mucina and Rutherford (2006). Very few descriptions were found in the literature of the middle-to-late successional stages of forest communities before they reach their climax states (Grainger, Van Aarde & Wassenaar 2011; Von Maltitz, Van Wyk & Everard 1996:188-195). However, most of the coastal dune forests within Zululand that occur outside of formally protected areas are in this anthropogenic subclimax state (Berliner 2005).
Plant community 11: Tricalysia sonderiana-Apodytes dimidiata dune forest margin
The Tricalysia sonderiana-Apodytes dimidiata dune forest margin community occurs along the forest edges. It is demarcated as a narrow band along the forest (Figure 5). It has deep apedal sandy-loamy soils with a high accumulation of organic matter within the upper 150 mm of the soil column. Structurally, this community can be described as a medium-to-tall dune forest.
The diagnostic species for this plant community (SG L, Online Appendix 1) include the small tree species T. sonderiana and the tree species A. dimidiata. The most dominant species for this community (Online Appendix 2) includes the tree A. dimidiata (SG L), which grows best in these well-drained, organic-rich soils of the forest margin. Other dominant species include Psydrax obovata (SG R), the shrubs Euclea natalensis (SG M), Kraussia floribunda (SG R) and Ekebergia capensis (SG N) and the fern Microsorum scolopendrium (SG S).
This plant community contains surprisingly few plant species (8.3 ± 0.8 s.d.) when compared to the climax dune forest community (19.2 ± 4.9 s.d.). Generally, forest ecotones are relatively species rich, containing species from both the forest and the neighbouring plant community. In retrospect, the anomaly recorded here may very well have been an artefact of incorrect sample site selection. It is recommended that the forest ecotones of the uMNR be mapped and managed as an integral part of the dune forests. Based on the vegetation structure and composition, this plant community is regarded as a part of the major vegetation type FOz 7 Northern Coastal Forest, as described by Mucina and Rutherford (2006). No formal plant community descriptions of coastal dune forest margins were found in the literature.
Plant community 12: Gymnosporia arenicola-Protorhus longifolia coastal dune forest
The Gymnosporia arenicola-Protorhus longifolia coastal dune forest community was recorded between the Tricalysia sonderana-Apodytes dimidiata dune forest margin and the Carissa bispinosa-Mimusops caffra climax coastal dune forest; as a result, it displays strong floristic affinities towards these plant communities (Figure 5). The soils underlying this community are deep apedal sands, ranging from medium- to course-grained, with a high organic component within the upper 150 mm of the soil column. Structurally, this community is classified as a tall dune forest. The forest canopy is less dense than the climax dune forests because of the absence of very old and large trees with wide canopies. This results in more light reaching the forest floor, leading to a relatively well-developed shrub layer.
The diagnostic species for this plant community include the tree species P. longifoliaand Tricalysia capensis, the straggling shrub G. arenicola and the straggling climber Smilax anceps (SG O, Online Appendix 1). The dominant species for this community are displayed in the full phytosociological table (Online Appendix 2) and include Psydrax obovata (SG R) and P. longifolia (SG O). Other dominant species include the tree species Sideroxylon inerme (SG T) and Garcinia gerrardii (SG T); the climbers Smilex anceps (SG O) and Rhoicissus tomentosa (SG Q); the shrubs K. floribunda (SG R), G. arenicola, Peddia africana (SG R), Putterlickia verrucosa (SG Q) and C. baccifera (SG Q); the grass Panicum coloratum (SG O); and the geophyte Dietes species (SG M).
Based on the lack of older and larger trees normally found in a climax dune forest, this plant community may very well be a younger successional stage of dune forest. Some preliminary investigations showed that there may very well be a correlation between fire scars on old aerial photographs and the distribution of the Gymnosporia arenicola-Protorhus longifolia coastal dune forest community. However, the verification of this pattern has not been attempted in this study. This plant community is therefore regarded as a very late successional stage of dune forest within the major vegetation type FOz 7 Northern Coastal Forest, as described by Mucina and Rutherford (2006). Very few descriptions were found in the literature of the very late successional stages of forest communities (Venter 1972; Von Maltitz et al. 1996:188-195). Some authors (Venter 1972; Von Maltitz et al. 1996:188-195) view these very late successional stages of forest communities simply as variants of climax states.
Plant community 13: Carissa bispinosa-Mimusops caffra climax coastal dune forest
The Carissa bispinosa-Mimusops caffra climax coastal dune forest community is associated with the oldest and more protected dune forests, extending up to the northern edge of the uMNR (Figure 5). The soil underlying this community is deep sandy soil with a very high organic component within the upper 150 mm. Structurally, it can be described as a tall, closed forest.
The diagnostic species for this plant community (SG Q, Online Appendix 1) include the tree species with the highest fidelity values: M. caffra, Dovyalis longispina, Vepris lanceolata and Cussonia spicata. The diagnostic shrubs and small trees include C. bispinosa, Putterlickia verrucosa, Brachylaena discolor and Bersama lucens. The diagnostic woody climbers include Monanthotaxis caffra, Rhoicissus rhomboidea, Dalbergia armata, Rhoicissus tomentosa and Dalbergia obovata. The diagnostic species include the grass Oplismenus hirtellus, the geophyte Dietes species as well as the orchids Cyrtorchis praetermissa, Polystachya sandersonii and Ansellia africana.
The most dominant species for this community (Online Appendix 2) include the tree species M. caffra and shrub C. bispinosa (SG Q). Other dominant species include the trees Psydrax obovata, B. lucens, Kraussia floribunda (SG R), Ficus natalensis (SG U), Sideroxylon inerme (SG T), Psydrax obovata (SG T) and D. longispina (SG Q); the shrubs and small trees Peddia africana (SG T), B. discolor (SG Q), Grewia occidentalis(SG U), P. verrucosa (SG Q), Allophylus natalensis (SG U) and Carissa macrocarpa (SG Q); the woody climbers R. rhomboidea (SG U), Asparagus falcutus (SG U) and R. tomentosa (SG Q); the grasses O. hirtellus (SG Q) and Panicum coloratum (SG U); the geophyte Dietes species (SG Q); and the ferns Microsorum scolopendrium (SG S) and Microsorum punctatum (SG T).
As was expected, the recorded species richness was relatively high (19.2 ± 4.9 s.d.). This community also contains numerous protected plant species, including M. caffra, S. inerme, C. praetermissa, P. sandersonii, A. africana and the extremely rare and endangered saprophytic orchid Didymoplexis verrucosa (recorded just outside the uMNR). The conservation value of these forests is regarded as very high, based on their floristic composition and ecosystem functionality. They also contribute greatly to the stability of the dune fields of southern Zululand. Based on the vegetation structure and composition, this plant community is regarded as a part of the major vegetation type FOz 7 Northern Coastal Forest, as described by Mucina and Rutherford (2006). Although none of the forest communities described in the literature were based on total floristic composition, similar forest types were recorded by Venter (1972), Weisser (1978b) and MacDevette et al. (1989).
Discussion
The ordination clusters closely resemble the classification groupings of plant communities with relatively unique species assemblages. For heterogeneous vegetation types, such as forests, the ordination patterns were less distinct, reflecting the floristic overlap between such plant communities. When viewing the complex of the forest communities along ordination axes 1 and 3, slightly more defined clustering of the various communities occurred.
The patterns of species richness recorded within the various plant communities are generally what would be expected. Ecosystems that tend to fluctuate between extremes, such as intertidal zones, show relatively low species richness and are dominated by highly adapted stress-tolerant species such as mangrove species. Stable, mesic ecosystems tend towards high species richness levels dominated by competitive species. The ecotonal forest edge community, which was predicted to show the highest species richness, showed surprisingly few plant species. However, the suspicion is that the anomaly recorded here may very well have been an artefact of suboptimal sample site selection.
The indirect gradient analysis from the ordination scatter plot provided some valuable insights into the general trends in plant community affinities to a variety of environmental variables. Based on our deductions, specific environmental drivers of vegetation structure and plant community composition within the uMNR include the soil moisture availability, water drainage capability of soils within different parts of the landscape, clay and salt content of soils, the effects of fire and grazing, the effects of organic content in the upper soil profile and the effects of salt-clipping by oceanic salt spray driven by onshore winds.
The secondary grasslands within the southern sections of the uMNR show very low species richness, and no regional endemic species were recorded. The conversion of forest to secondary grasslands is therefore considered to contribute very little in terms of tropical grassland conservation. These secondary grasslands do not represent any stage or form of the pristine tropical grasslands observed in other nearby reserves under formal protection. However, it must be added that the grasslands and wetlands within the recently acquired northern sections of the uMNR are essentially very different from the secondary grasslands along the southern sections. The northern grasslands are recovering remnants of grasslands after the impact of agricultural activities. These tall, northern grasslands provide very valuable habitat for threatened bird species such as the Eurasian bittern (Botaurus stellaris), African marsh harrier (Circus ranivorus), corncrake (Crex crex), swamp nightjar (Caprimulgus natalensis) and grass owl (Tyto capensis). Their conservation status, based on the habitat provided to a wide range of fauna species, is therefore regarded as relatively high.
The climax coastal dune forest sections within the uMNR are species rich, with an even distribution of dominance among the more visually prominent species. Despite the many laws and regulations protecting coastal forests, very few outside of formally protected areas are still in an ecologically healthy condition. In light of the ongoing decimation of forests outside of protected areas within southern Zululand, the dune forests of the uMNR are regarded as forests of very high conservation value.
The riverine woodlands and wetlands within the uMlalazi River floodplain are relatively species poor and no endemic plant species were recorded there. Although these plant communities are not regarded as of very high conservation value based on their floristic composition, they are regarded as very important for ecosystem functioning and stability. However, the recorded levels of invasion by alien plant species within this heterogeneous mosaic of plant communities are of great concern.
The saline and intertidal ecosystems within the uMNR are not species rich, nor do they contain many endemic plant species. However, based on the ecological importance of mangroves and salt flats along tidal rivers, these ecosystems with their plant communities are critically endangered and under very strict formal protection. It is for this reason that the two mangrove tree species recorded in the uMNR, Bruguiera gymnorrhiza and Avicennia marina, are protected by law. From a sustainable use perspective, the biannual harvesting of materials from the Phragmites australis-Juncus kraussii saline wetland offers an important example of how nature reserves can contribute to the controlled use of natural resources.
The relatively unique prograding (extending) dune system along the uMNR provides a classical example of primary succession, the autogenic changes that drive coastal dune succession and the natural rates at which serial stages replace one another.
Conclusion
The described plant communities of the uMNR can be seen as surrogates for the ecosystems underlying them. These plant communities should form the basis for conservation and management planning within the uMNR. They should also be used as benchmarks and reference examples of undisturbed primary vegetation as well as successional stages in plant community development in order to measure the ecological integrity of similar systems within the Maputaland region.
Based on the floristic similarities between the plant communities of clusters of certain vegetation types, such as forest communities, these vegetation units can be managed and conserved as an integral unit. However, the monitoring of vegetation changes should be conducted on the basis of the individual plant communities. While the management of nature reserves can be done at a relatively coarse scale, monitoring should always be done at the finest relevant scale possible.
Acknowledgements
Competing interests
The authors declare that they have no financial or personal relationships that may have inappropriately influenced them in writing this article.
Authors' contributions
N.S.Z. was the main data collector as part of an MSc research project. He contributed to data analysis, interpretations and preparation of the original manuscript. T.H.C.M. was the co-worker and supervisor and contributed to data collection, analysis, interpretations and preparation of the original manuscript and its revision. R.E.M. contributed to literature reviews and comparisons, data analysis, and the editing and preparation of the extensively revised manuscript.
References
Begg, G. & Carser, A., 1988, The wetlands of Natal (part 2). The distribution, extent and status of wetlands in the Mfolozi catchment, Natal Town and Regional Planning Commission, Pietermaritzburg. [ Links ]
Berlilner, D., 2005, Systematic conservation planning for the forest biome of South Africa, Water and Forestry Support Programme and the Department of Water Affairs and Forestry, Pretoria. [ Links ]
Bromberg-Gedan, K., Silliman, B.R. & Bertness, M.D., 2009, 'Centuries of human-driven change in salt marsh ecosystems', Annual Review of Marine Science 1, 117-141. https://doi.org/10.1146/annurev.marine.010908.163930 [ Links ]
Brown, L.R., Du Preez, P.J., Bezuidenhout, H., Bredenkamp, G.J., Mostert, T.H.C. & Collins, N.B., 2013, 'Guidelines for phytosociological classifications and descriptions of vegetation in southern Africa', Koedoe 55(1), Art. #1103, 1-10. https://doi.org/10.4102/koedoe.v55i1.1103 [ Links ]
Chytrý, M., Tichý, L., Holt, J. & Botta-Dukát, Z., 2002, 'Determination of diagnostic species with statistical fidelity measures', Journal of Vegetation Science 13, 79-90. https://doi.org/10.1111/j.1654-1103.2002.tb02025.x [ Links ]
Colloty, B.M., Adams, J.B. & Bate, G.C., 2002, 'Classification of estuaries in the Ciskei and Transkei regions based on physical and botanical characteristics', South African Journal of Botany 68, 312-321. https://doi.org/10.1016/S0254-6299(15)30392-6 [ Links ]
Donnelly, F.A. & Pammenter, N.W., 1983, 'Vegetation zonation on a Natal coastal sand-dune system in relation to salt spray and soil salinity', South African Journal of Botany2, 46-51. https://doi.org/10.1016/S0022-4618(16)30144-9 [ Links ]
Edwards, D., 1983, 'A broad-scale structural classification of vegetation for practical purposes', Bothalia 14, 705-712. https://doi.org/10.4102/abc.v14i3/4.1231 [ Links ]
EKZNW, 2009, Amatikulu Nature Reserve: Integrated Management Plan: 2009-2013, Version 1.0, Ezemvelo KZN Wildlife, Pietermaritzburg, p. 82, and 7 maps. [ Links ]
Fey, M.V., 2010, 'A short guide to the soils of South Africa, their distribution and correlation with World Reference Base soil groups', in 19th World Congress of Soil Science, Soil Solutions for a Changing World, Brisbane, 1st-6th August, pp. 32-35. [ Links ]
Gaugris, J.Y., Matthews, W.S., Van Rooyen, M.W. & Bothma, J.D.P., 2004, 'The vegetation of Tshanini Game Reserve and a comparison with equivalent units in the Tembe Elephant Park in Maputaland, South Africa', Koedoe 47(1), 9-29. https://doi.org/10.4102/koedoe.v47i1.67 [ Links ]
Google Earth 7.1.2.2041, 2016, uMlalazi Nature Reserve. 28°57′ 29.53″ S,31°46′ 09.75″ E, elevation 55 m, viewed 22 March 2016, from http://www.google.com/earth/index.html [ Links ]
Grainger, M.J., Van Aarde, R.J. & Wassenaar, T.D., 2011, 'Landscape composition influences the restoration of subtropical coastal dune forest', Restoration Ecology 19, 111-120. https://doi.org/10.1111/j.1526-100X.2009.00630.x [ Links ]
Hennekens, S.M. & Schaminée, J.H.J., 2001, 'TURBOVEG, a comprehensive data base management system for vegetation data', Journal of Vegetation Science 12, 589-591. https://doi.org/10.2307/3237010 [ Links ]
Lubke, R.A., 1997, 'Vegetation and flora of the Kosi Bay Coastal Forest Reserve in Maputaland, northern KwaZulu-Natal, South Africa', MSc thesis, University of Pretoria. [ Links ]
Lubke, R.A., Avis, A.M., Steinke, T.D. & Boucher, C., 1997, 'Coastal vegetation', in R.M. Cowling & S.M. Pierce (eds.), Vegetation of Southern Africa, pp. 300-321, Cambridge University Press, Cambridge. [ Links ]
MacDevette, D.R., MacDevette, D.K., Gordon, I.G. & Bartholomew, R.L.C., 1989, 'The floristics of the Natal indigenous forests', in I.G. Gordon (ed.), Natal indigenous forests. A preliminary collection of reports on indigenous forest in Natal, pp. 1-20, Natal Parks Board, Pietermaritzburg. [ Links ]
Matthews, W.S., Van Wyk, A.E. & Van Rooyen, N., 1999, 'Vegetation of the Sileza Nature Reserve and neighbouring areas, South Africa, and its importance in conserving the woody grasslands of the Maputaland Centre of Endemism', Bothalia 29(1), 151-167. https://doi.org/10.4102/abc.v29i1.586 [ Links ]
Matthews, W.S., Van Wyk, A.E., Van Rooyen, N. & Botha, G.A., 2001, 'Vegetation of the Tembe Elephant Park, Maputaland, South Africa', South African Journal of Botany 67, 573-594. [ Links ]
McCune, B. & Mefford, M.J., 1999, PC-ORD for Windows. Multivariate analysis of ecological data, version 4.10, MjM Software, Gleneden Beach, OR. [ Links ]
Moll, E.J., 1972, 'A preliminary account of the dune communities at Pennington Park, Mtunzini, Natal', Bothalia 10(4), 615-626. https://doi.org/10.4102/abc.v10i4.1571 [ Links ]
Moll, E.J. & Werger, M.J.A., 1978, 'Mangrove communities', in M.J.A. Werger & A.C. Van Bruggen (eds.), Biogeography and ecology of southern Africa, pp. 1231-1238, Dr W. Junk, The Hague. [ Links ]
Mucina, L. & Rutherford, M.C., 2006, The vegetation of South Africa, Lesotho and Swaziland, Strelitzia 19, South African Biodiversity Institute, Pretoria. [ Links ]
Neumann, F.H., Scott, L., Bousman C.B. & Van As, L., 2010, 'A Holocene sequence of vegetation change at Lake Eteza, coastal KwaZulu-Natal, South Africa', Review of Palaeobotany and Palynology 162, 39-53. https://doi.org/10.1016/j.revpalbo.2010.05.001 [ Links ]
Nevill, H. & Nevill, E.M., 1995, 'A survey of the Culicoides (Diptera: Ceratopogonidae) of the Umlalazi Nature Reserve in Zululand, South Africa, with notes on two species biting man', Onderstepoort Journal of Veterinary Research 62, 51-58. [ Links ]
South African Weather Service, 2017, viewed n.d., from http://www.weathersa.co.za/compliments-complaints/climate-data-requests [ Links ]
Steinke, T.D., 1995, 'A general review of the mangroves of South Africa', in G.I. Cowan (ed.), Wetlands of South Africa, pp. 53-74, Department of Environmental Affairs and Tourism, Pretoria. [ Links ]
Taylor, R.H., Adams, J.B. & Haldorsen, S., 2006, 'Primary habitats in St Lucia Estuarine System, South Africa, and their response to mouth management', African Journal of Aquatic Science 31, 31-41. https://doi.org/10.2989/16085910609503869 [ Links ]
Tichy, L., 2002, 'JUICE, software for vegetation classification', Journal of Vegetation Science 13, 451-453. https://doi.org/10.1658/1100-9233(2002)013 [ Links ]
Todd, C.B., 1994, 'A comparison of the reproductive strategies of key species of a prograding dune system in the Mlalazi Nature Reserve, Natal', MSc thesis, Rhodes University. [ Links ]
Tyson, P.D. & Preston-Whyte, R.A., 2000, The weather and climate of southern Africa, 2nd edn., Oxford University Press, Cape Town. [ Links ]
Van Wyk, A.E. & Smith, G.F., 2001, Regions of floristic endemism in Southern Africa, Umdaus Press, Pretoria. [ Links ]
Venter, H.J.T., 1972, 'Die plantekologie van Richardsbaai, Natal', DSc thesis, University of Pretoria. [ Links ]
Von Maltitz, G.P., Van Wyk, G.F. & Everard, D.A., 1996, 'Successional pathways in disturbed coastal dune forest on the coastal dunes in north-east KwaZulu-Natal, South Africa', South African Journal of Botany 62(4), 188-195. https://doi.org/10.1016/S0254-6299(15)30633-5 [ Links ]
Weisser, P.J., 1978a, 'Changes in area of grasslands on the dunes between Richards Bay and the Mfolozi River, 1937 to 1974', Proceedings of the Annual Congresses of the Grassland Society of Southern Africa 13(1), 95-97. https://doi.org/10.1080/00725560.1978.9648841 [ Links ]
Weisser, P.J., 1978b, 'Conservation priorities in the dune area between Richards Bay and Mfolozi mouth based on a vegetation survey', Natal Town and Regional Planning Report 38, 1-64. [ Links ]
Weisser, P.J., Garland, I.F. & Drews, B.K., 1982, 'Dune advancement 1937-1977 at the Mlalazi Nature Reserve, Mtunzini, Natal, South Africa, and a preliminary vegetation-succession chronology', Bothalia 14(1), 127-130. https://doi.org/10.4102/abc.v14i1.1152 [ Links ]
Weisser, P.J. & Muller, R., 1983, 'Dune vegetation dynamics from 1937 to 1976 in the Mlalazi-Richards Bay area of Natal, South Africa', Bothalia 14(3), 661-667. https://doi.org/10.4102/abc.v14i3/4.1225 [ Links ]
Werger, M.J.A. & Coetzee, B.J., 1978, 'The Sudano-Zambesian Region', in M.J.A. Werger (ed.), Biogeography and ecology in southern Africa, pp. 231-299, Junk, The Hague. [ Links ]
Correspondence:
Theo Mostert
mostertt@unizulu.ac.za
Received: 18 Nov. 2017
Accepted: 06 Feb. 2018
Published: 28 May 2018
Note: Additional supporting information may be found in the online version of this article as Online Appendix 1: https://doi.org/10.4102/koedoe.v60i1.1449-1 and Online Appendix 2: https://doi.org/10.4102/koedoe.v60i1.1449-2


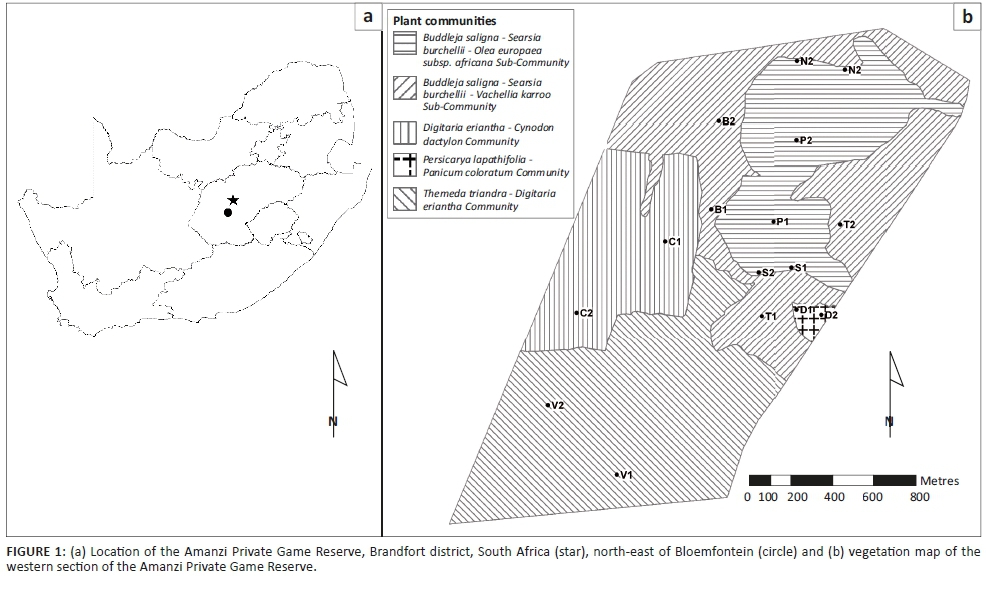
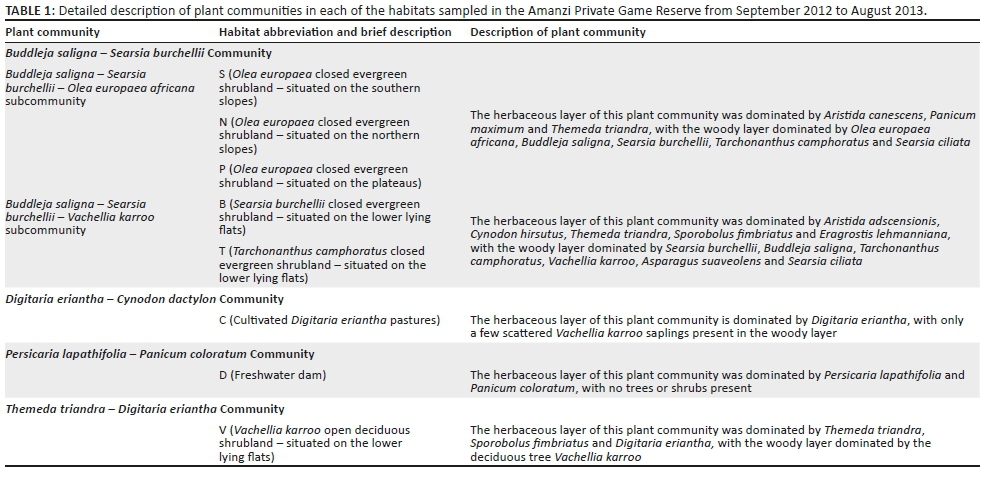
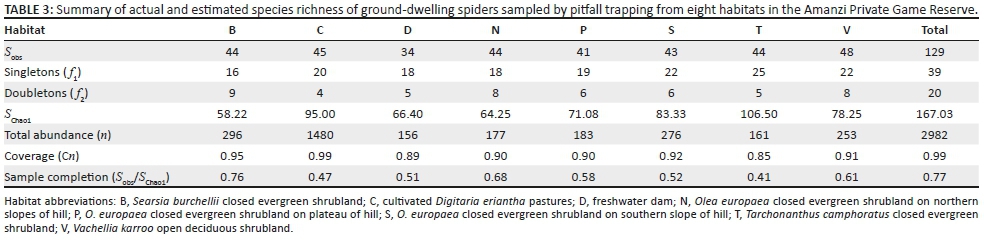
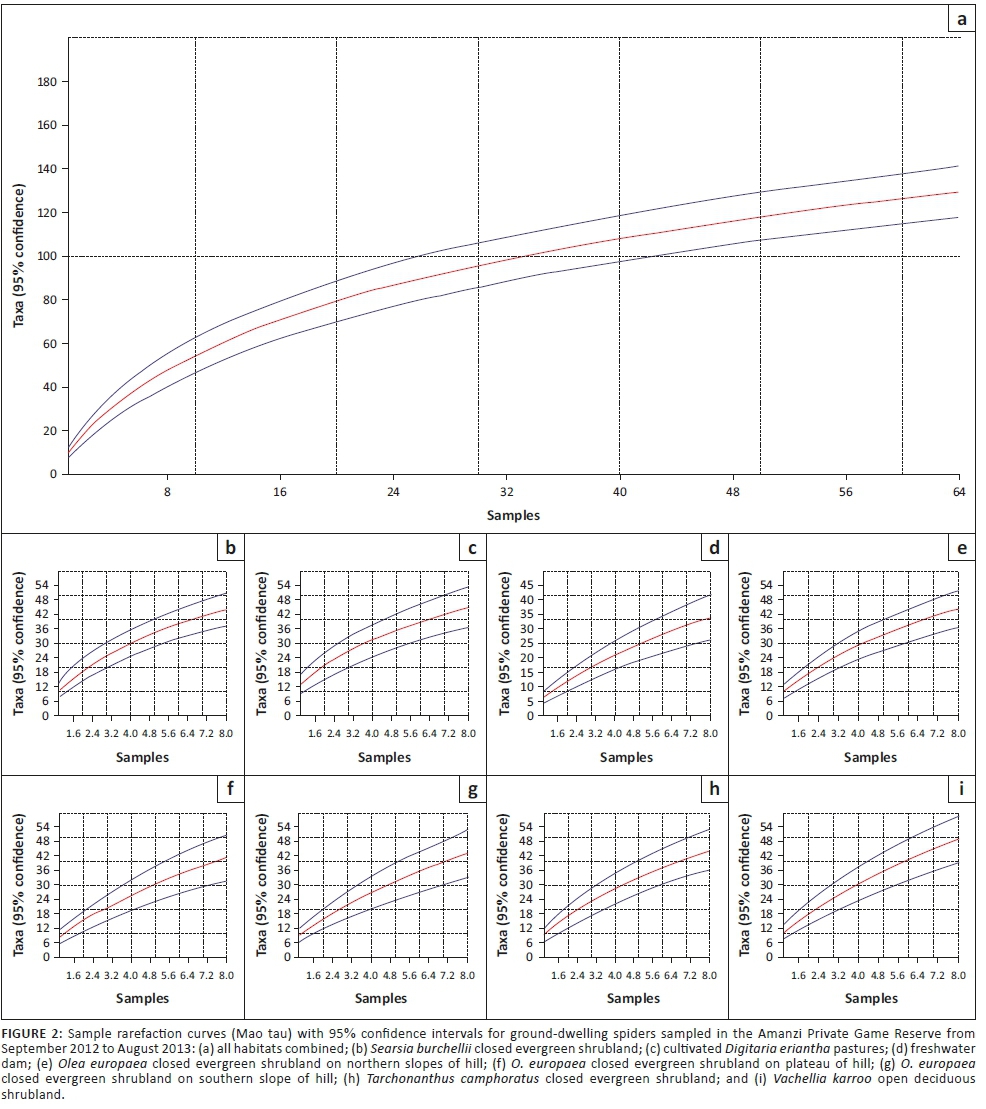
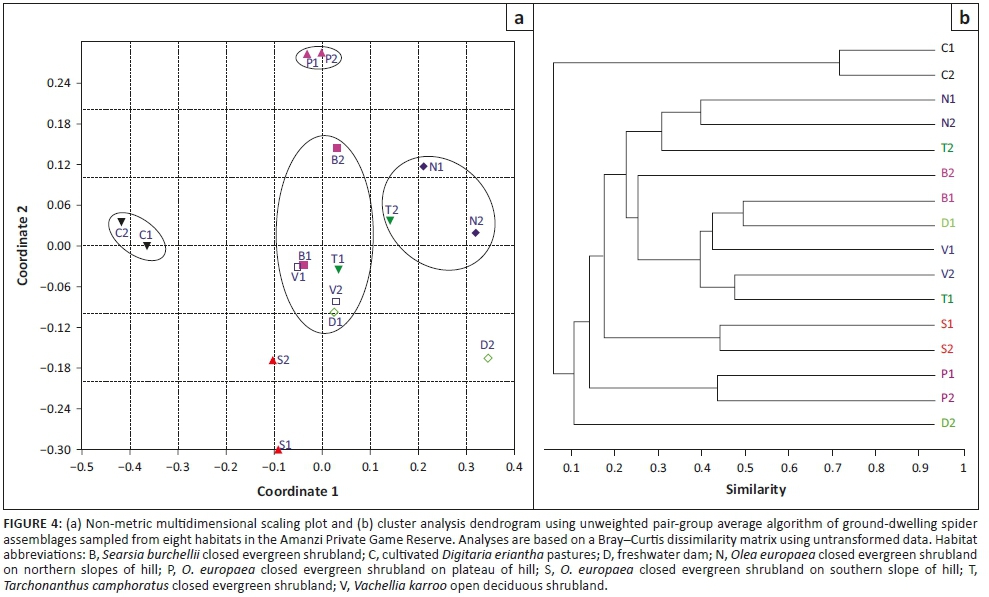
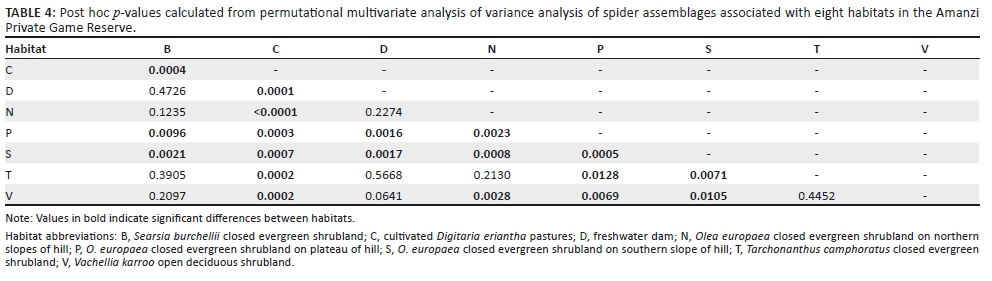
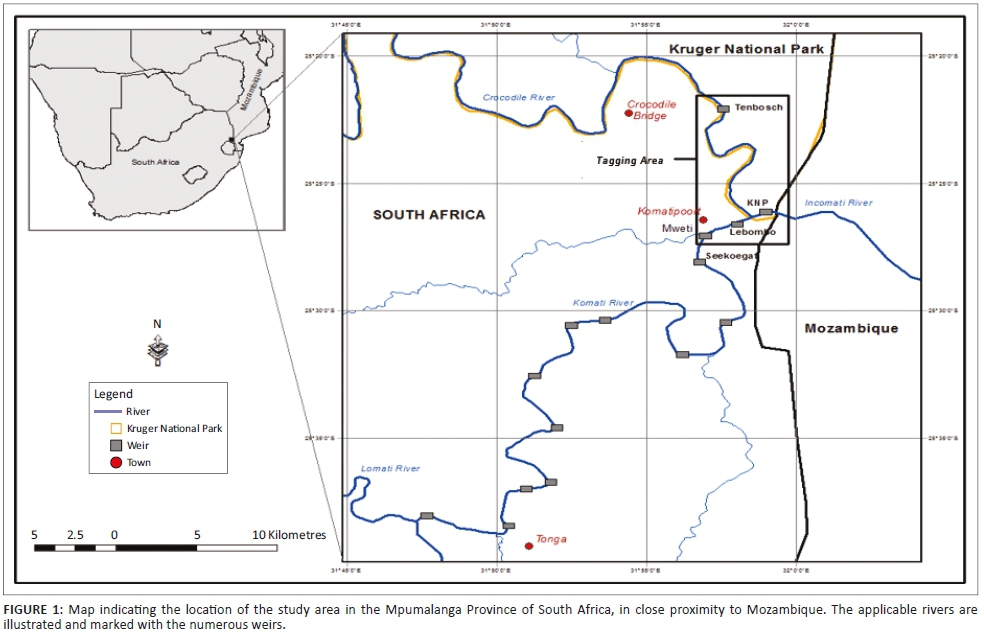
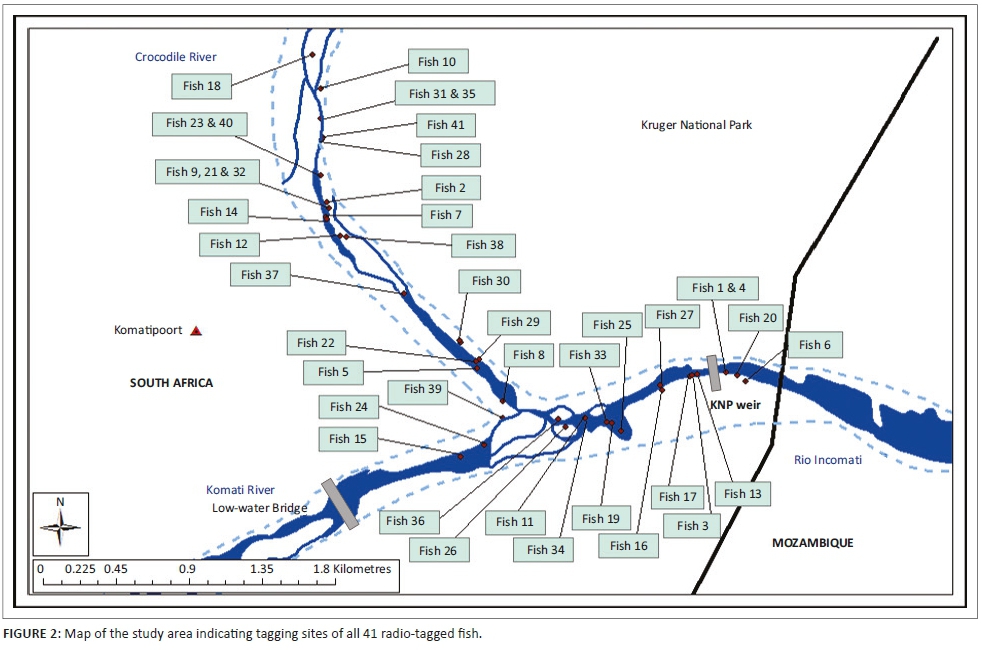
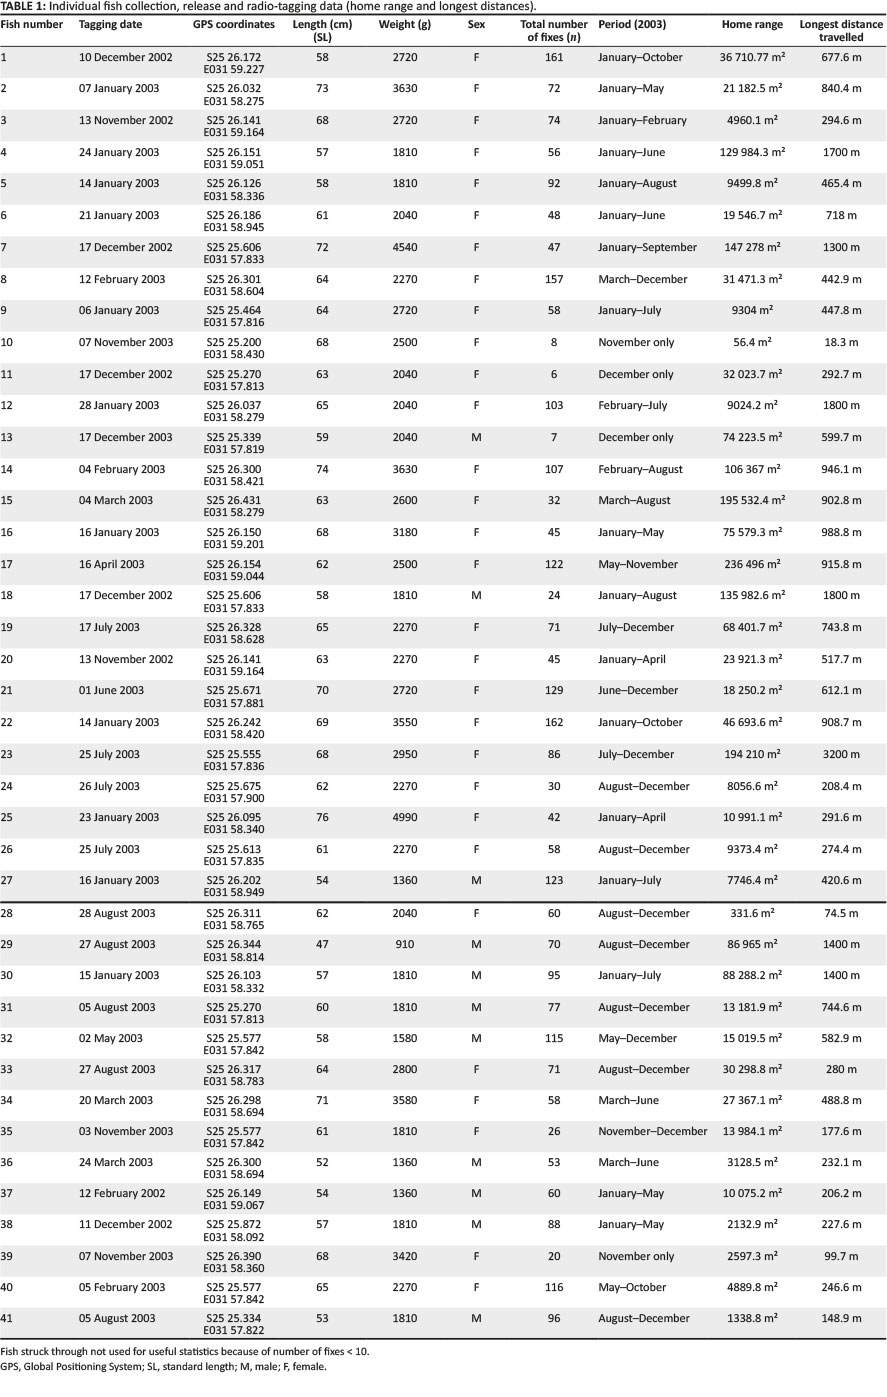
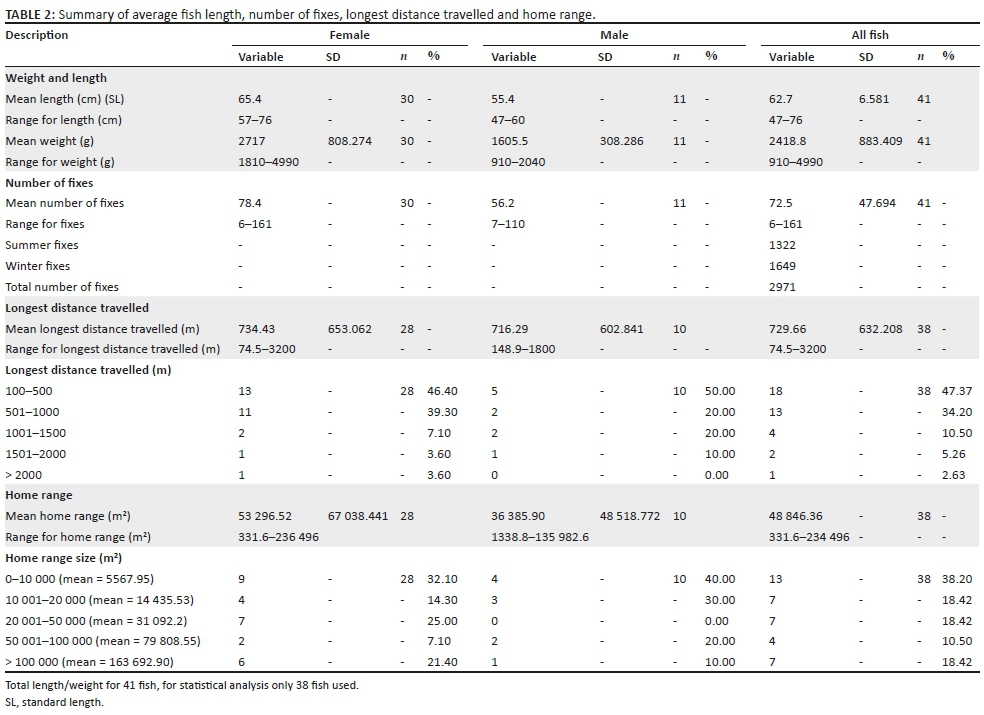
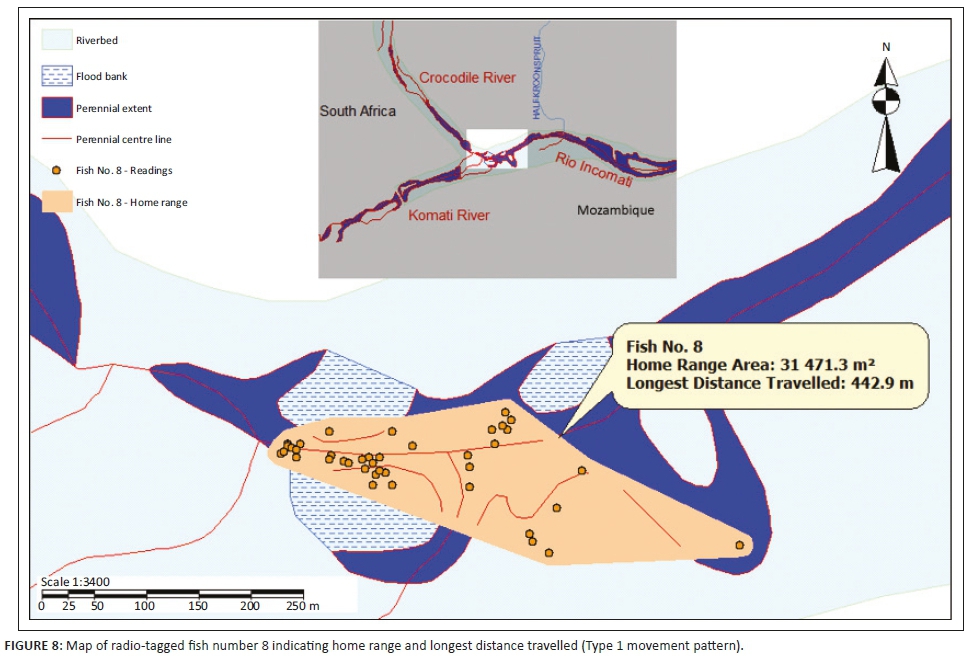
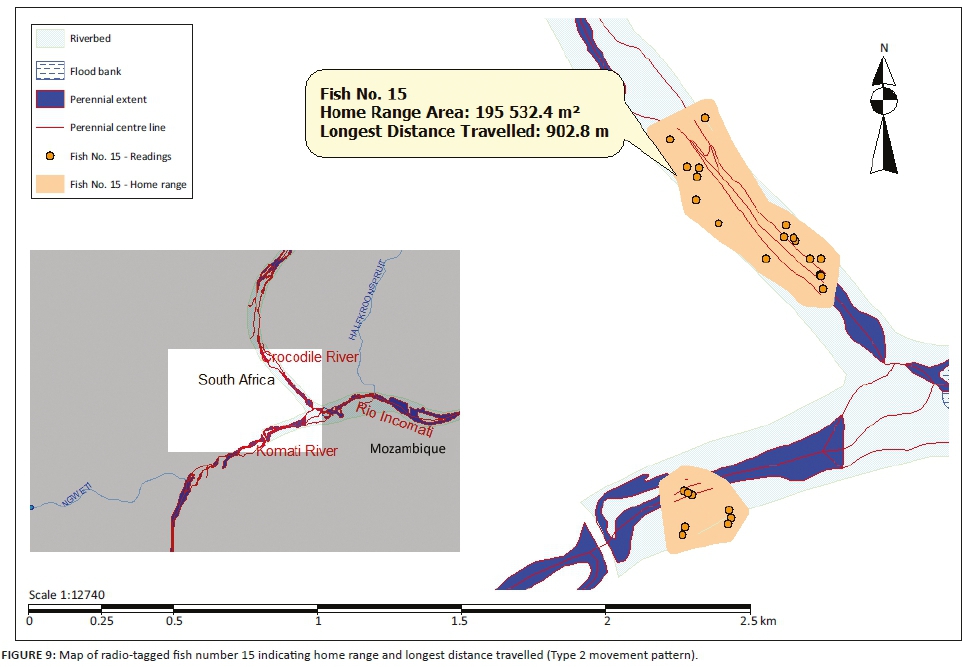
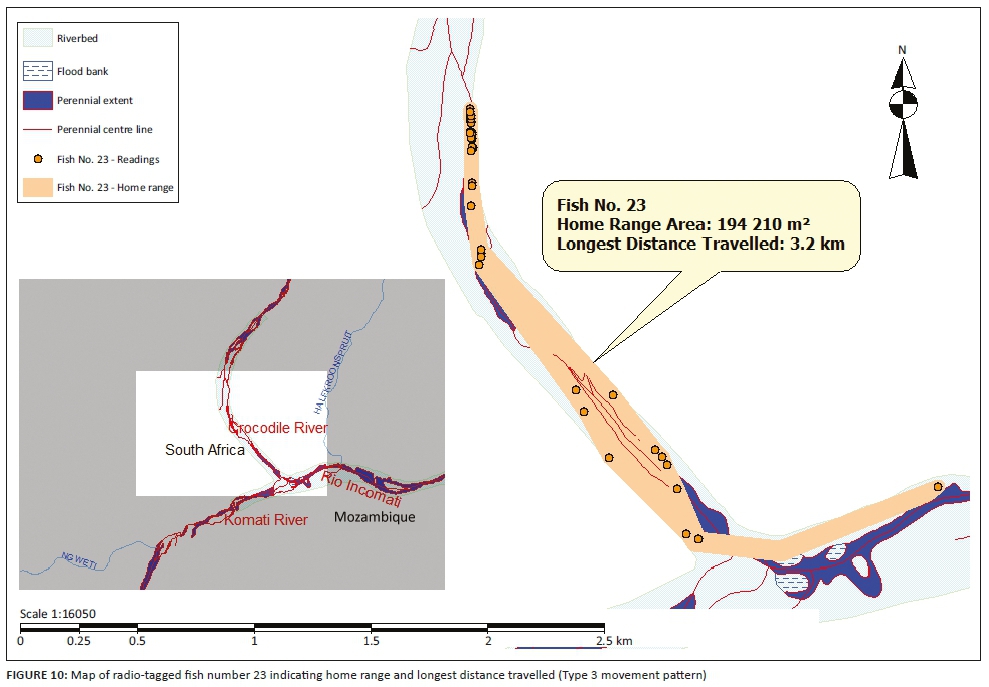
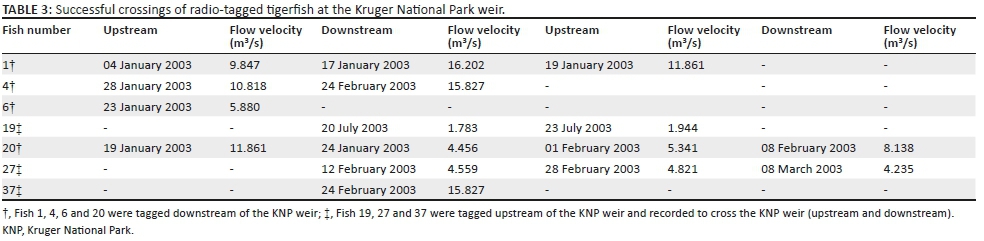
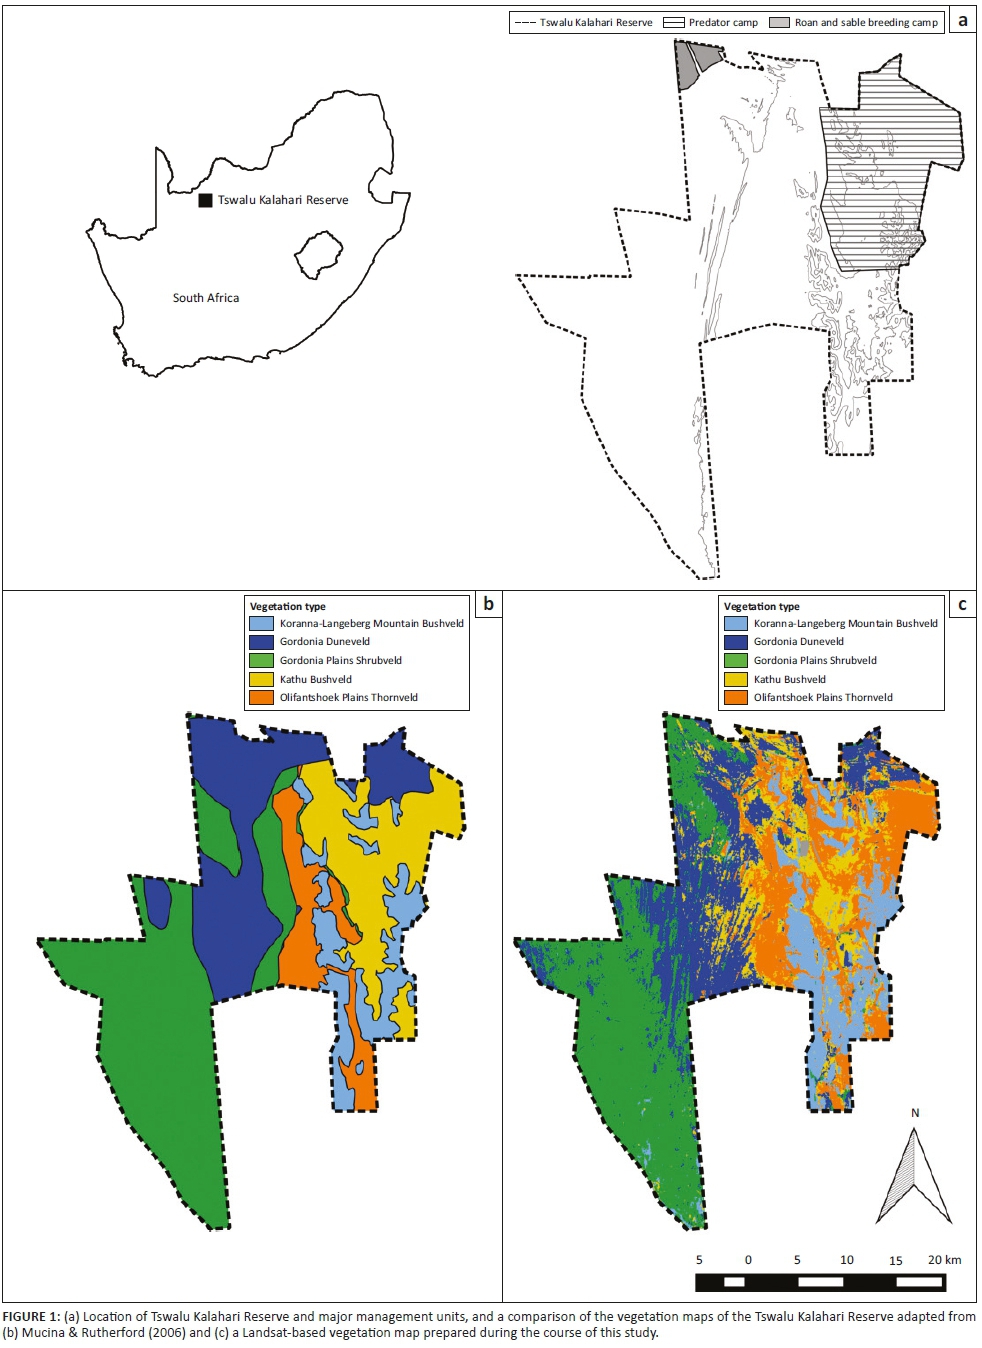
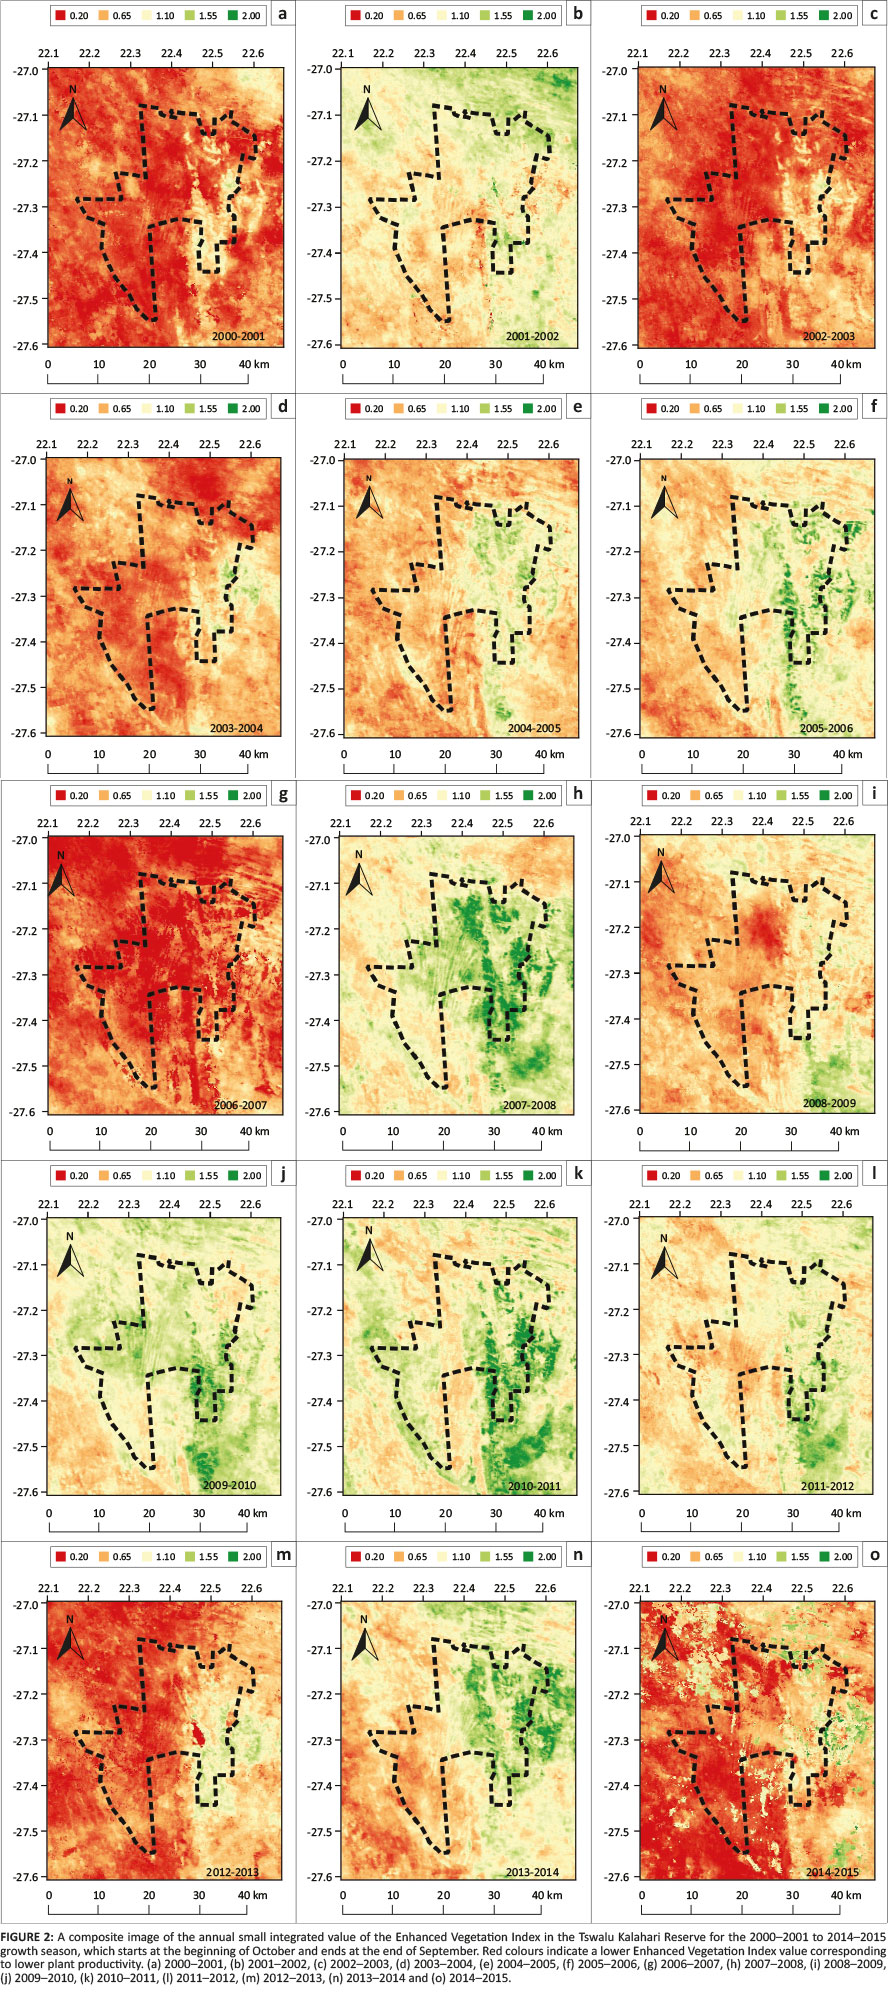
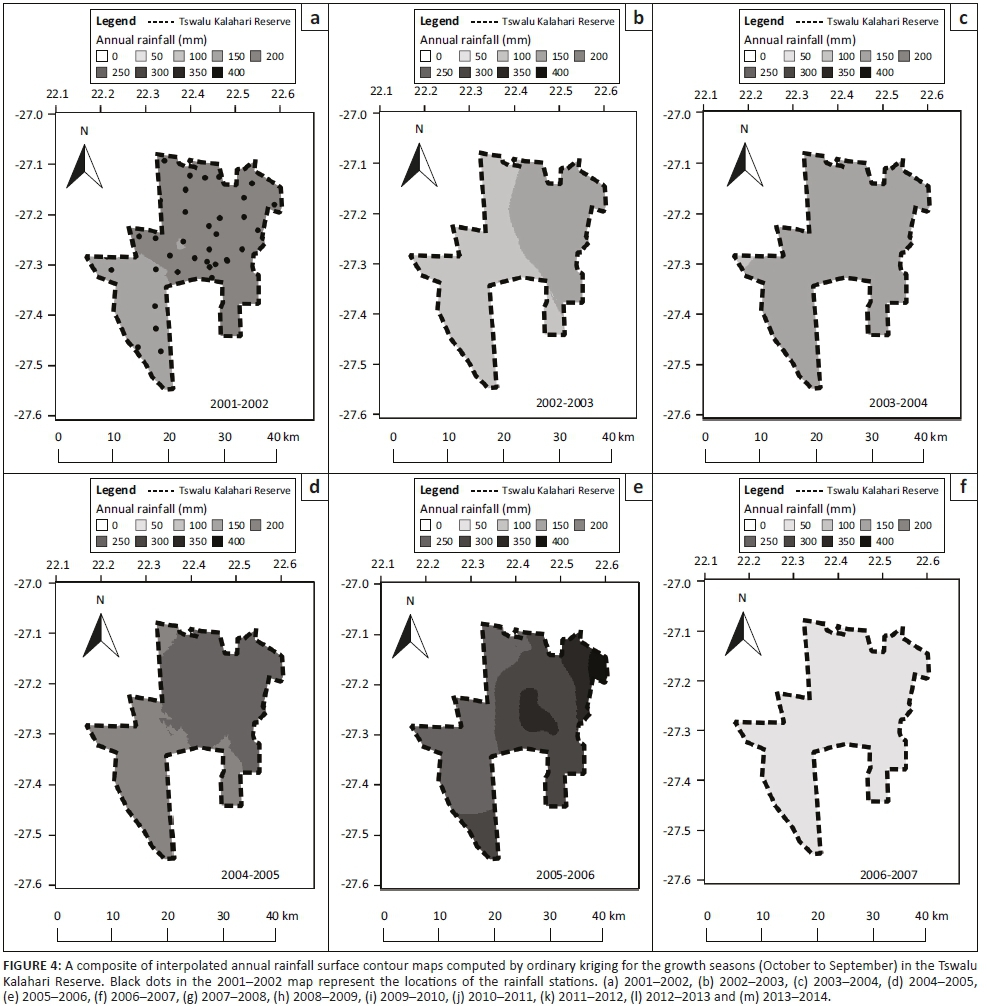
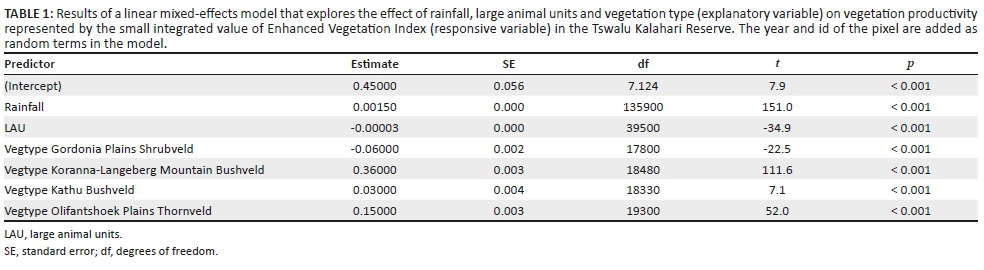
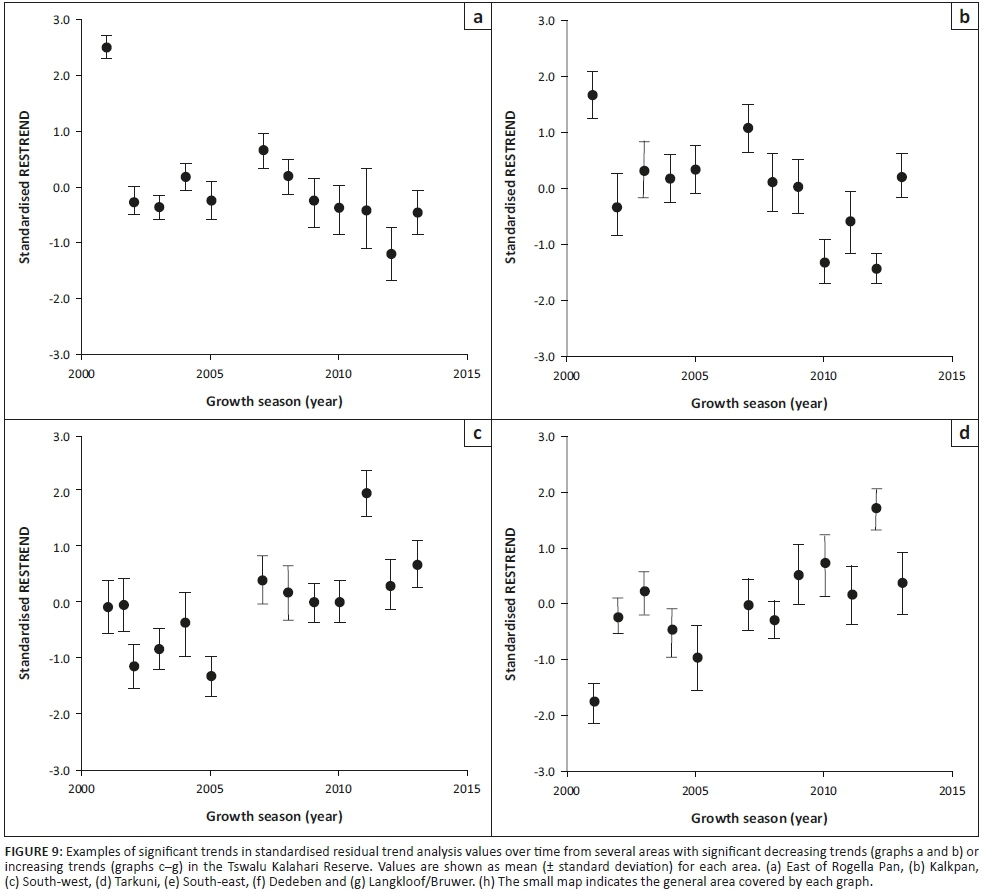
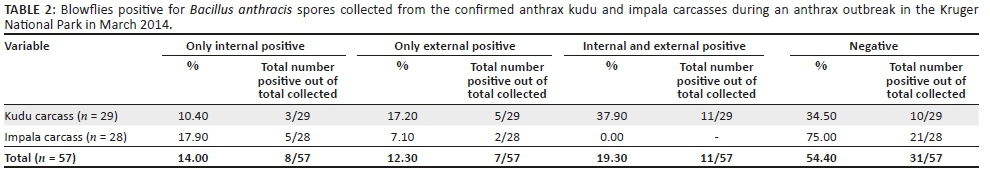
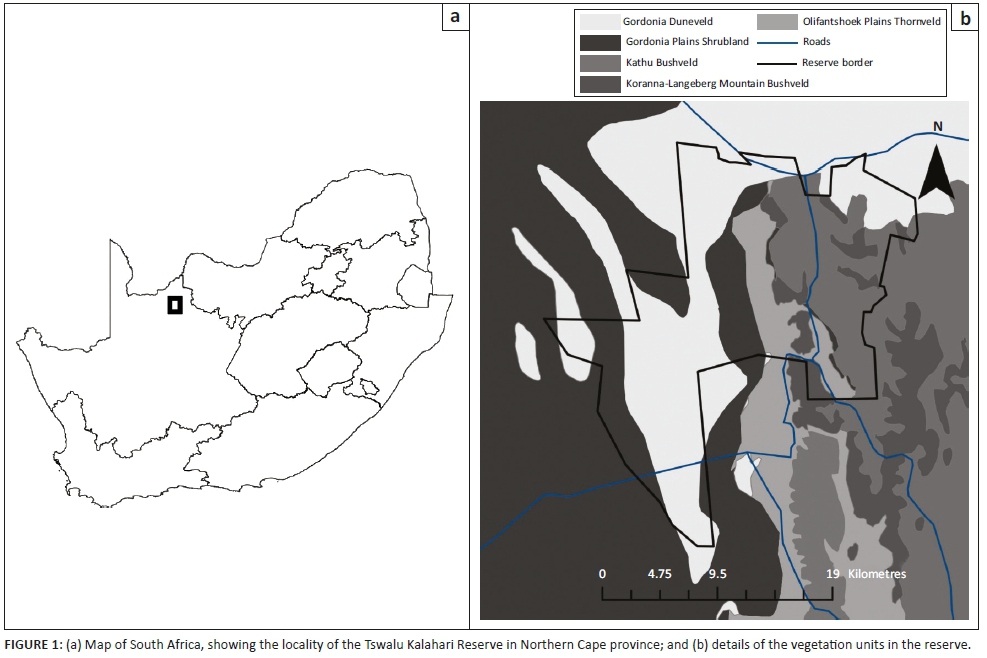
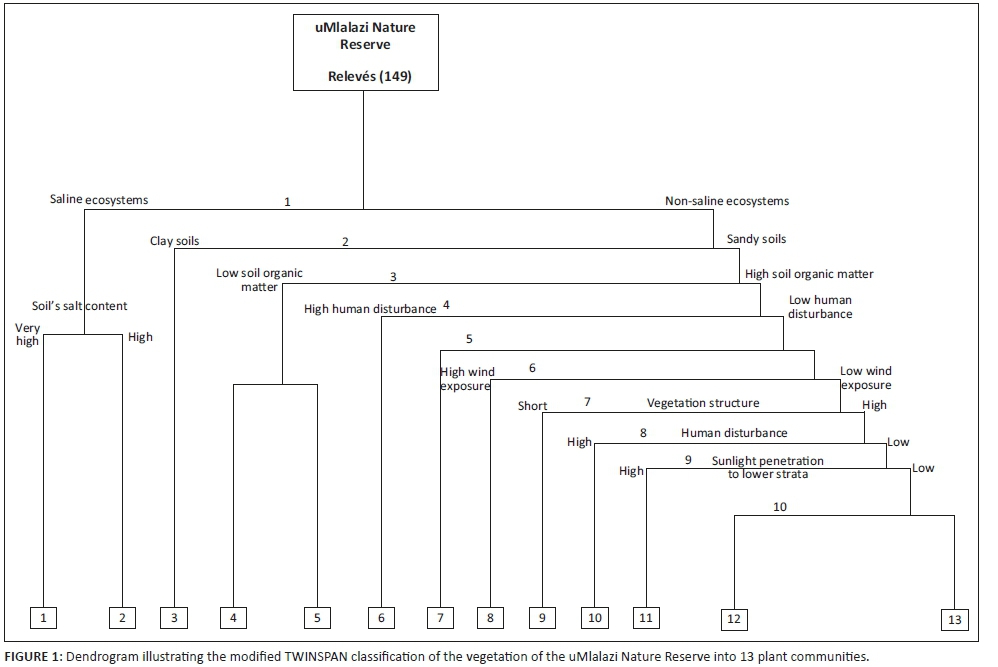
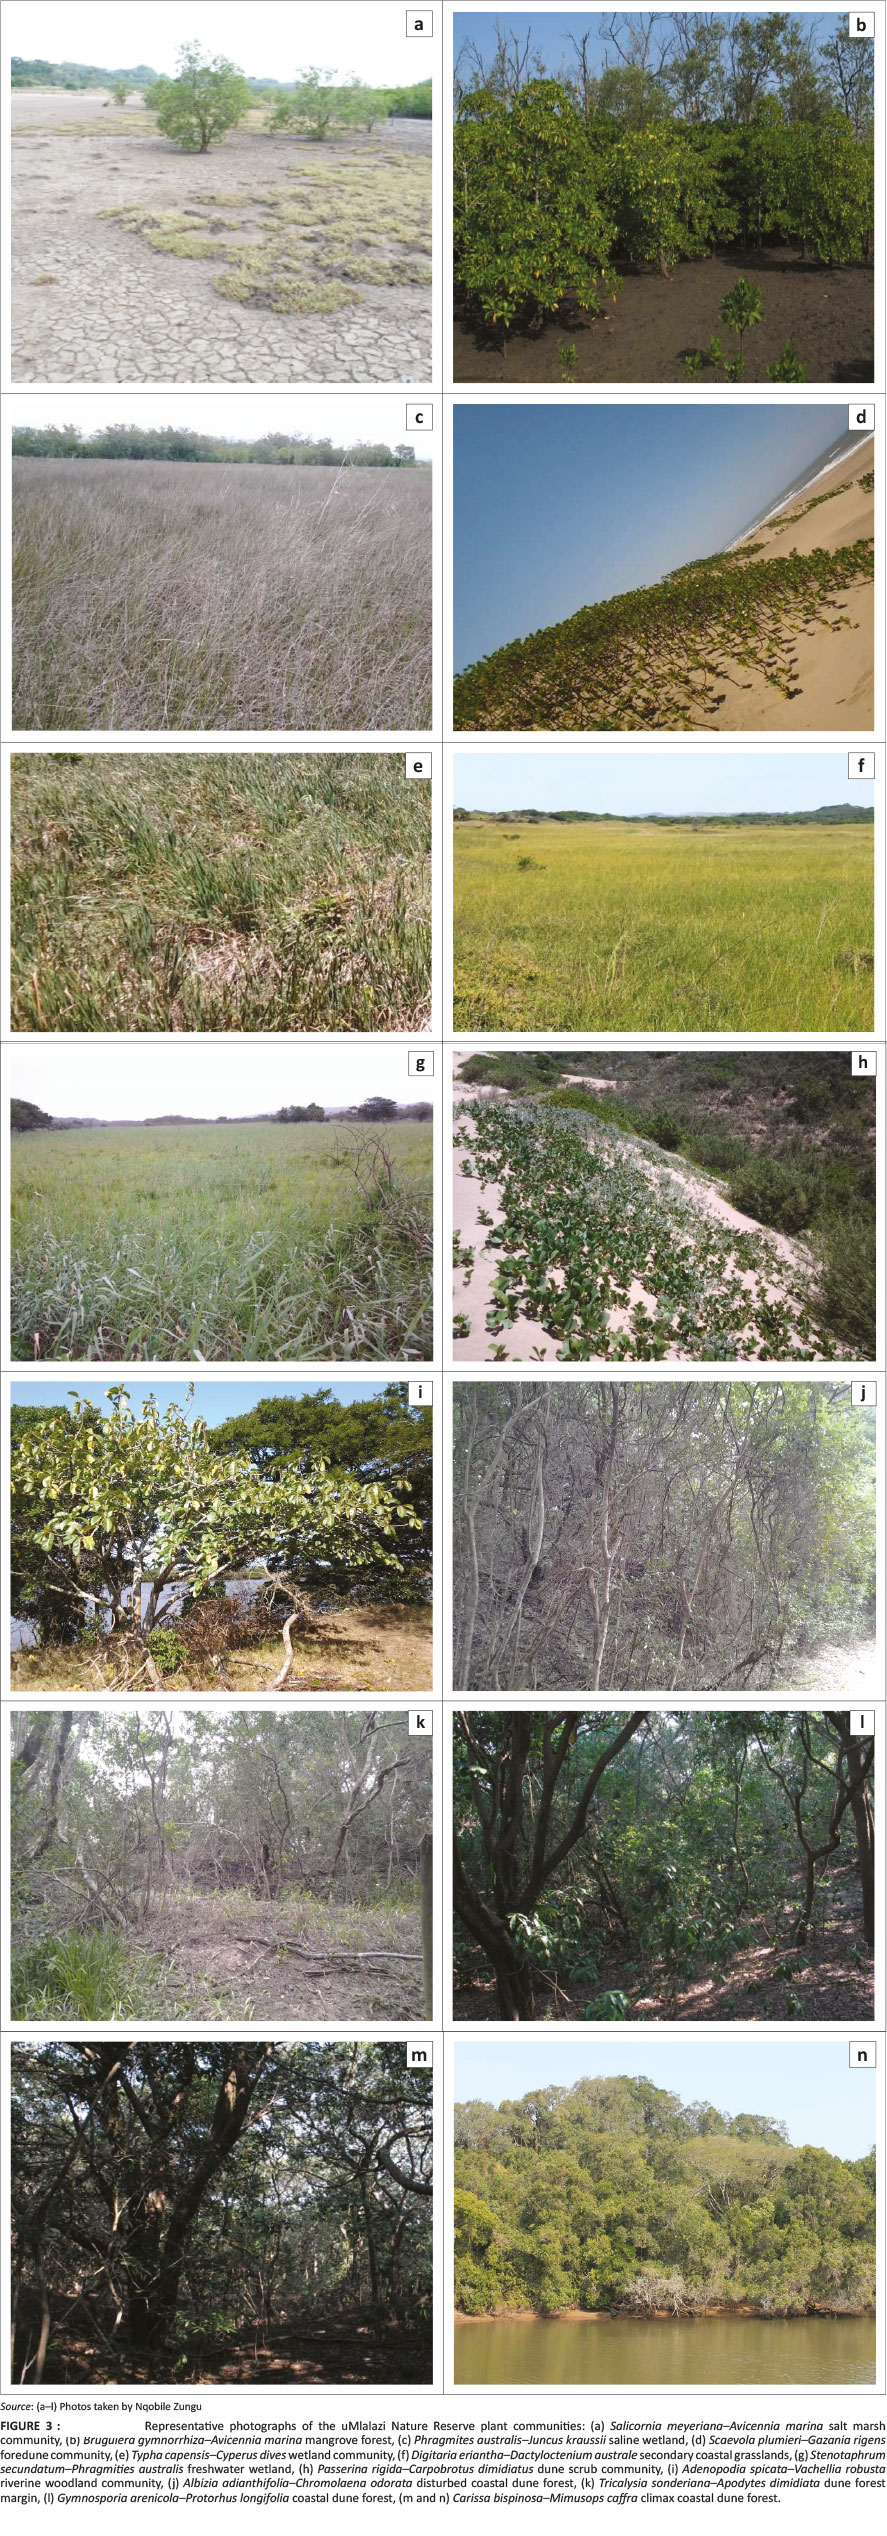
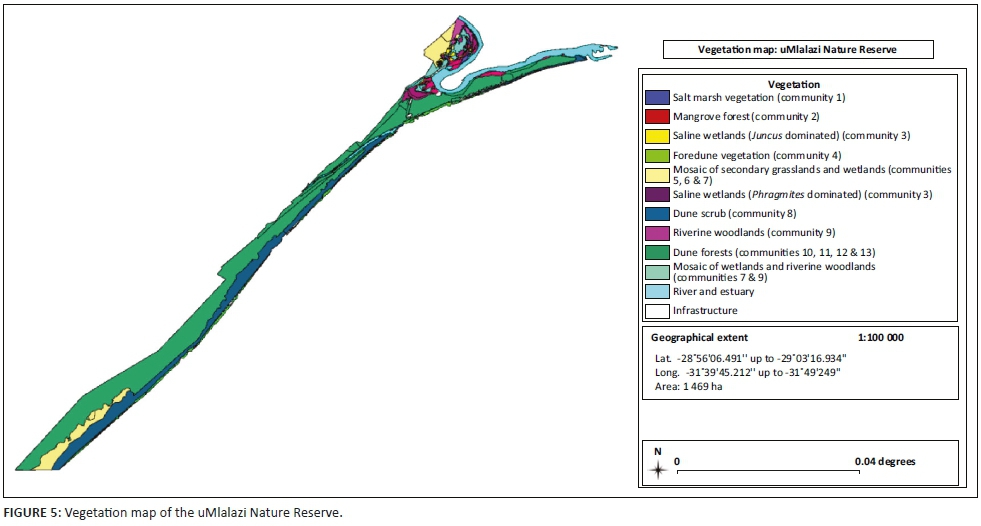