


Serviços Personalizados
Artigo
 Inglês (pdf)
 Artigo em XML
 Referências do artigo
Indicadores

Links relacionados
-
 Citado por Google
 -
 Similares em Google
Compartilhar

 Permalink
Koedoe
versão On-line ISSN 2071-0771
versão impressa ISSN 0075-6458
Koedoe vol.60 no.1 Pretoria 2018
http://dx.doi.org/10.4102/koedoe.v60i1.1452
ORIGINAL RESEARCH
The operational competitiveness of public protected areas managed by Ezemvelo KZN Wildlife
Karabo D. Motau; Edilegnaw Wale
Discipline of Agricultural Economics, University of KwaZulu-Natal, South Africa
ABSTRACT
The purpose of this study was to measure the operational competitiveness of public protected areas (PPAs) in the KwaZulu-Natal province, South Africa. Financial data for ecotourism operations in PPAs were collected from Ezemvelo KZN Wildlife (EKZNW) for 2007-2013, to construct an operational competitiveness profile for each PPA by using a non-parametric method called operational competitiveness rating analysis (OCRA). The results show that permanent staff, utilities, maintenance and repairs, and cost of sales were cost items with the highest average share of total costs, whereas accommodation, admissions, sales and tours, and rides and hikes received higher average shares of total revenues for most PPAs. The identification of the most important cost and revenue items was followed by the computation of resource consumption and revenue generation inefficiency ratings from 2007 to 2013, with the results showing that resource competitiveness had more impact on operational competitiveness relative to revenue competitiveness. This suggests that PPAs under EKZNW can improve operational competitiveness by reducing costs. Ecotourism is an economic incentive used in several countries to encourage biodiversity conservation. Because of declining public funding, conservation agencies such as EKZNW in South Africa should find new sources of funding or find cost-effective ways of managing ecotourism operations.
CONSERVATION IMPLICATIONS: This information will provide insights into the quality of operational efficiencies of ecotourism activities at EKZNW-controlled PPAs and motivate management to adopt cost-cutting and revenue-increasing strategies to improve operational competitiveness.
Introduction
The ownership of wildlife largely remains under state control in several countries, managed by conservation agencies (Muir-Leresche & Nelson 2000). However, despite government protection of wildlife and biodiversity, a record number of species are classified as threatened, endangered or vulnerable by the International Union for Conservation of Nature (IUCN), because of pressures emanating from economic activities such as agriculture, mining, timber production and poaching (Damania & Hatch 2005). Conservationists recognise that to prevent further deterioration, the preservation of many species rests on establishing their economic value and providing incentives for sustainable use (Baker 1997; Lindsey, Romanach & Davies-Mostert 2009).
Ecotourism as an economic incentive has become a tool for biodiversity conservation in public protected areas (PPAs) of many developing countries (Lindsey et al. 2005). This is based on the principle that nature or biodiversity must pay for itself by generating economic benefits (Kiss 2004). Ecotourism supports biodiversity conservation and at the same time promotes sustainable local development (Ross & Wall 1999). In South Africa, ecotourism is part of the sustainable development agenda, and it is viewed as an instrument of empowerment for underprivileged communities as it provides employment for rural communities (Holden 2013). For instance, several protected areas, both public and private, have promoted joint economic initiatives whereby specific services and functions are outsourced to local communities (Honey 2003; Mahony & Van Zyl 2002; Myburgh & Saayman 1999).
However, the significance of ecotourism is underrated, mainly because of a lack of information on the financial and economic performance of the ecotourism operations of PPAs (Barnes & De Jager 1996; Child et al. 2012; Eagles 2003; Musengezi 2010; Porter, Ferrer & Aylward 2003). This could in turn lead to an under-representation of the significance of ecotourism within fiscal sectors of government. This, according to James, Gaston and Balmford (2001), could lead to a lack of understanding on the expenditure of biodiversity conservation and create a perception that conservation initiatives are unfeasible. As Eagles (2003) states, this could result in cutbacks in funding for conservation agencies. Given that funding for PPAs has been inadequate and declining over the years (Emerton, Bishop & Thomas 2006), research on the financial and economic performance of ecotourism operations of PPAs will justify an investment in PPAs. The shortfall in annual spending for PPAs in developing countries is estimated to be in the range of $1 billion and $1.7 billion, which could be influenced by distinctive management objectives and activities (Bruner, Gullison & Balmford 2004). Moreover, easily accessible PPAs face an increased threat of degradation and thus would require more investment. Because of their respective unique desirable features, some PPAs will generate more revenue than others, making cross-subsidisation inevitable. As PPAs get larger, budgets have remained static, and therefore management costs per hectare in such PPAs would normally be higher, especially in easily accessible PPAs located close to disadvantaged communities (Bruner et al. 2004; Emerton et al. 2006).
In South Africa, funding for Ezemvelo KZN Wildlife (EKZNW), KwaZulu-Natal's wildlife agency, has been reduced by provincial government (Khumalo & Molla 2012). Reduced funding coupled with low admission fees is creating financial constraints and undermine the capacity of the agency. Eventually, this will compromise biodiversity conservation and local development. Therefore, for conservation managers to find cost-effective ways of managing ecotourism operations, they will need empirical information on detailed evaluations of income and expenditure patterns of ecotourism operations. Measuring the financial performance of ecotourism operations in PPAs will enable EKZNW to control and improve operational practices in the respective PPAs.
There are several operational performance measurement methods that have been employed in the literature to measure efficiency, prioritise conservation and justify investment in PPAs in various contexts. The most important of these include appraisal methods such as cost-effective analysis (e.g. Laycock et al. 2009; Moran, Pearce & Wendelaar 1997), benefit-cost ratios (e.g. Dixon & Sherman 1991), cost-benefit analysis (e.g. Dixon & Sherman 1990) and so on. The various methods of comparing the costs and benefits of protected areas are summarised in Dixon and Sherman (1991). Data envelopment analysis (DEA) is a non-parametric method used to measure the relative efficiency of decision-making units (DMUs) (Charnes, Cooper & Rhodes 1978; Speelman et al. 2008). It has often been employed to assess the relative efficiency of DMUs of protected areas and to indicate how it could be improved by providing a set of guidelines (Bosetti & Locatelli 2006). Moreover, another method that imposes internal benchmarks to measure operational performance is total factor productivity (TFP), which is used to measure the changes in aggregate output per unit of aggregate input (Thirtle & Bottomley 1992). Nevertheless, these ratios and methods have various features that make it challenging to aggregate them to provide an understanding of the overall operational performance (Parkan 1996). Only time series data, unit prices and quantities can be used in the model to obtain performance measurements with TFP (Parkan 1996).
Operational performance can be used for comparative analyses, as explained by Ghalayini and Noble (1996). According to Parkan (1996), examining the operational performance of a firm overtime introduces managers to aspects of comparison between operations across time and thus competition. Therefore, in each PPA, ecotourism operations that consume fewer resources and generate higher revenues in a specific year would have performed better or more competitively relative to other years. This means that operational performance measures the relative competitiveness of ecotourism operations over a period (Parkan 1996). Therefore, his study aims to examine the operational competitiveness of ecotourism operations in each PPA managed by EKZNW. This is performed using a non-parametric method called operational competitiveness rating analysis (OCRA). This method was selected because, according to the authors' knowledge, it is the first of its kind in South Africa to use the OCRA procedure to measure and assess the operational competitiveness of PPAs and it has an advantage over other methods. The advantage of the OCRA model is its capacity to show the period during which EKZNW's overall operational performance has been inadequate or more than adequate compared to other methods as well as the sources of those shortcomings and strengths (Parkan 1996). This is possible because of the way operational competitiveness ratings (revenue generation and resource consumption inefficiency ratings) are computed and its ability to incorporate management's perceptions of the relative importance of the cost and revenue categories.
The article begins with a brief account of the competitiveness of PPAs, followed by the study area and data description. Then the OCRA method, the empirical model, is explained. Thereafter, the operational competitiveness profiles of each PPA are presented. This is followed by the presentation of the results and discussion on the operational competitiveness of ecotourism operations. Finally, conclusions and strategic implications are drawn.
Ezemvelo KZN Wildlife and public protected areas
The majority of PPAs are managed by central governing bodies or conservation agencies (Eagles 2002; Porter et al. 2003). These conservation agencies collect revenues from PPAs and allocate operating budgets (Eagles 2002). However, budget allocations are not closely linked with ecotourism use levels (Eagles 2002) and the environmental value of the area, which reduces the incentives of PPAs to manage their operations sustainably and profitably. This is true of EKZNW because part of its budget comes from government and the the rest from own revenue generated.
According to EKZNW management authorities, the current budget of EKZNW is around R890 million, of which 25% is generated from its own operations and the rest is a government subsidy. EKZNW retains all its revenues and submits a budget request to the KZN Department of Economic Development, Tourism and Environmental Affairs. The department often allocates its financial resources on a 3-year cycle to different sectors (including EKZNW) in the province, based on the availability of its financial resources and priorities. Furthermore, when there is a budget deficit, EKZNW will negotiate with the department for more funding, seek other funding sources or attempt to increase its internal sources of revenue. However, if these options cannot make up the budget shortfall, EKZNW will typically reduce its budget for lower priority areas.
Still, increasing budget cuts from government have affected the capacity of EKZNW to cover its costs. EKZNW manages several protected areas of which some have ecotourism features that generate sufficient income whilst others have biodiversity value that lack income-generating features. Therefore, income from profitable protected areas with ecotourism features is used to cross-subsidise those with pure public good features in terms of biodiversity conservation. This has made it necessary for EKZNW to prioritise projects in its PPAs according to their ability to generate revenue.
There have been frequent demands by the South African government for EKZNW to design and implement a strategy that is aligned with current trends on sustainable funding for protected area management, in which there is a need to balance between biodiversity conservation objectives and revenue generation (Dube 2011). The reasons for this request range from poor corporate governance, recurrent financial mismanagement and pressing socio-economic development needs (Dube 2011; Ridl 2012). EKZNW is considering new business models aimed at achieving business efficiency by optimising the use of financial resources and increasing its resource base (EKZNW 2009). Furthermore, EKZNW plans to focus on more effective marketing strategies to increase revenues (EKZNW 2009). According to Dube (2011), for EKZNW to reduce its dependence on government finance, it needs to focus on three areas, namely, payment for ecosystems services, public-private partnerships and co-management with the private sector and communities.
Moreover, several PPAs in KZN and most of South Africa typically generate insufficient revenues to finance operations and cover costs, and as such, most are managed at a loss (Dube 2011; Myburgh & Saayman 1999). According to officials at EKZNW, PPAs are not mandated to aim for profit even though it is desirable to at least cover their full costs. Typical revenue sources for most PPAs, including the EKZNW PPAs, include accommodation, wildlife product sales, admission fees, rentals and concessions, and wildlife viewing (Eagles 2002; Parker & Khare 2005; Porter et al. 2003). According to Dixon and Sherman (1991), there are three types of costs in maintaining protected areas: direct costs (recurrent costs of maintaining and managing a protected area), indirect costs (damages caused by wildlife) and opportunity costs (foregone losses resulting from protecting such areas). The benefits and costs of ecotourism interact in complex ways, but it is imperative that PPAs maximise their benefits whilst minimising costs (Eagles et al. 2002).
Several PPAs in KZN and most of South Africa generate insufficient revenues to finance operations and cover their running costs (Dube 2011; Myburgh & Saayman 1999). There have been studies conducted on PPAs in KZN that have touched on the theme of performance or competitiveness in ecotourism (e.g. Flanagan 2014; Porter et al. 2003). Internationally, for instance, a report by Bovarnick et al. (2010) was compiled for the United Nations Development Programme (UNDP) to analyse the financial status and sustainability of protected areas in several Latin American and Caribbean countries. This report found that protected areas in these regions are underfunded and that funding needs are likely to increase considering the implications of climate change. Moreover, Rylance (2017) conducted a study to assess the revenue generation of tourism in 93 Mozambican protected areas. The findings of the study were that the total annual revenue generation from protected areas was $24m from tourism-related activities, contributing around 10% to the tourism sector. Accordingly, identifying and reporting all possible revenue flows will assist in justifying public support for protected areas. However, the literature on this subject in South Africa is very limited, particularly on operations cost estimation and assessment. Therefore, to contribute to this body of knowledge, this article will examine the allocation of resources or funds by EKZNW to ecotourism operations in PPAs and the financial performance or competitiveness of these operations relative to each other over time.
Study area
The KZN province covers an area of 92 285 km2, and is situated on the eastern coast of South Africa in a biologically rich transition zone between tropical biota in the north and subtropical biota in the south (Eeley, Lawes & Piper 1999; Goodman 2003). The abundance of KZN's biodiversity comes from its altitudinal gradient and its varied geology, topography and climate (Eeley et al. 1999; Goodman 2003).
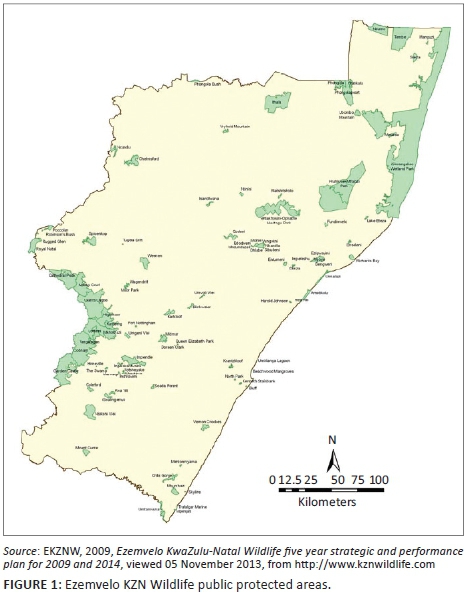
EKZNW is a government agency under the KZN Department of Agriculture, Environmental Affairs and Rural Development and manages biodiversity conservation in the KZN province (Goodman 2003). EKZNW was created in 1997 via a merger between the Natal Parks Board and the KwaZulu Department of Nature Conservation (Goodman 2003). It manages 110 PPAs that cover over 675 000 hectares (Aylward & Lutz 2003). Moreover, it receives financial support from government through the KZN Provincial Treasury (Dube 2011; Goodman 2003). Furthermore, the agency receives additional funding from non-governmental organisations (NGOs) and philanthropic organisations (Dube 2011). Protected areas considered in the study are shown in Figure 1.
The data
To evaluate the trends in the competitiveness of commercial operations in PPAs, financial data were collected from EKZNW for 2007-2013. Originally, the PPAs required were to be selected using the stratified random sampling strategy across all EKZNW administrative regions (uKhahlamba, Zululand and coastal regions), where between 35 and 50 PPAs mainly focused on ecotourism operations would have been selected. However, EKZNW was only able to provide 32 randomly selected PPAs from the 110 PPAs, some with a stronger conservation focus than a commercial operation, citing organisational privacy concerns. EKZNW provided PPAs selected randomly across uKhahlamba, Zululand and coastal regions with 14, 7 and 11 PPAs, respectively. Therefore, there is a reduced possibility of sample selection bias in the study.
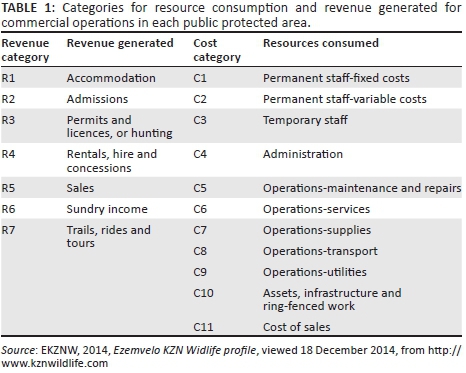
The financial data provided consisted of annual cost and revenue values of commercial operations. Cost and revenue values for each protected area were in nominal terms. Hence, the South African consumer price index was used to deflate the cost and revenue values for 2007-2013, taking 2005 as the base year. Cost and revenue items for each protected area were disaggregated and measured separately. In this study, cost categories are described as resources consumed and revenue categories as revenues generated. Thus, 11 cost categories and seven revenue categories were analysed per year, 2007-2013 (Table 1).
Empirical model: The operational competitiveness rating analysis procedure
Operational competitiveness rating analysis is a relative performance method used to measure the performance of operating entities called production units (PUs). PUs are purposeful entities that convert resources into goods and services (Parkan 1991). The OCRA procedure involves simple ratio-type, non-iterative computations that measure the PUs relative to operational competitiveness (Parkan et al. 1997). It is suitable for time series data: financial value, on quantities and unit prices, and has been used in different industries to measure operational competitiveness (Parkan 1996, 1999, 2003; Parkan et al. 1997; Parkan & Wu 1999).
Following Parkan (1996), the model can further be described as follows. In the model, an operating entity is represented by a PU in each year. A comparison is conducted of operational performance of k PUs that consume resources in C categories and generate revenues in the R categories. To compute cost and revenue inefficiency ratings, the prices and quantities of inputs and outputs could be used to obtain information about k PUs' relative input or output efficiency. Nonetheless, resource cost and revenue values can be used to obtain relative cost and revenue inefficiency ratings, respectively (see Parkan 1996 for details on derivation). In this study, because data on only cost and revenue values were used, the kth PU's cost and revenue vectors can be represented as vectors  , respectively, with
  as the cost incurred for the ith resource and
  as the revenue generated from the jth output. Cost and revenue at PUk are denoted as
  and
and  , where Ckm = costkm = 1ukm is the cost of the mth resource category, m = 1,……, M, and Rkh = revenuekh = 1vkh is the revenue generated from the hth category of outputs, h = 1, …, H, at PUk, k = 1,…., K.
According to Parkan and Wu (1999), the relative importance of a PU's performance in a cost or revenue category is dependent on that category's impact on the overall performance of the PU. This relative importance is reflected by calibration constants, denoted as akm and bkh for resource consumption and revenue generation, respectively, for PUk. The calibration constants can be computed by:
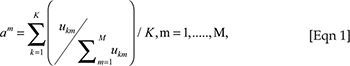
The first equation defines am as the average cost share of the mth cost category, and the second equation describes bh as the average revenue share of the hth revenue category (for details, see Parkan 1996).
The resource consumption inefficiency model is meant to determine whether input quantities would give information about a PU's relative input inefficiency. The kth PU's resource inefficiency rating, Ckm, is computed with respect to the mth input category and is expressed as:
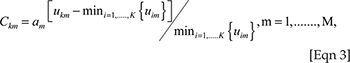
where the  is the lowest cost incurred by a PU amid K PUs with respect to the mth cost category. Then, the sum is linearly scaled by:

which is the kth PU's relative resource inefficiency rating. The least inefficient PU will receive an inefficiency rating of zero. For details of the derivation, see Parkan (1999).
The same approach can be adopted to determine revenue generation inefficiency ratings for related PUs. The first step is to compute the relative inefficiency rating of the kth PU in relation to the hth revenue category by:
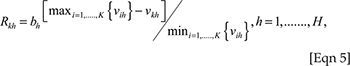
where  is the highest realised revenue in relation to the hth revenue category. The scaled sum was calculated (see Parkan 1999) and the equation is:

which is the kth PU's relative revenue generation inefficiency rating. The assessment is such that the least inefficient rating has a lower value relative to other PUs in the hth revenue category. The computation of the kth PU's combined inefficiency rating, Ek, as the scaled sum of its combined resource consumption and revenue generation inefficiency ratings is as follows:

According to Parkan (1996), the rating Ek measures the overall performance of kth PU relative to other PUs. The best performing PU or least inefficient rating receives a rating of zero and larger Ek values reflect inferior performance or higher inefficiency. For details on the derivation, see Parkan (1999).
The results and discussion
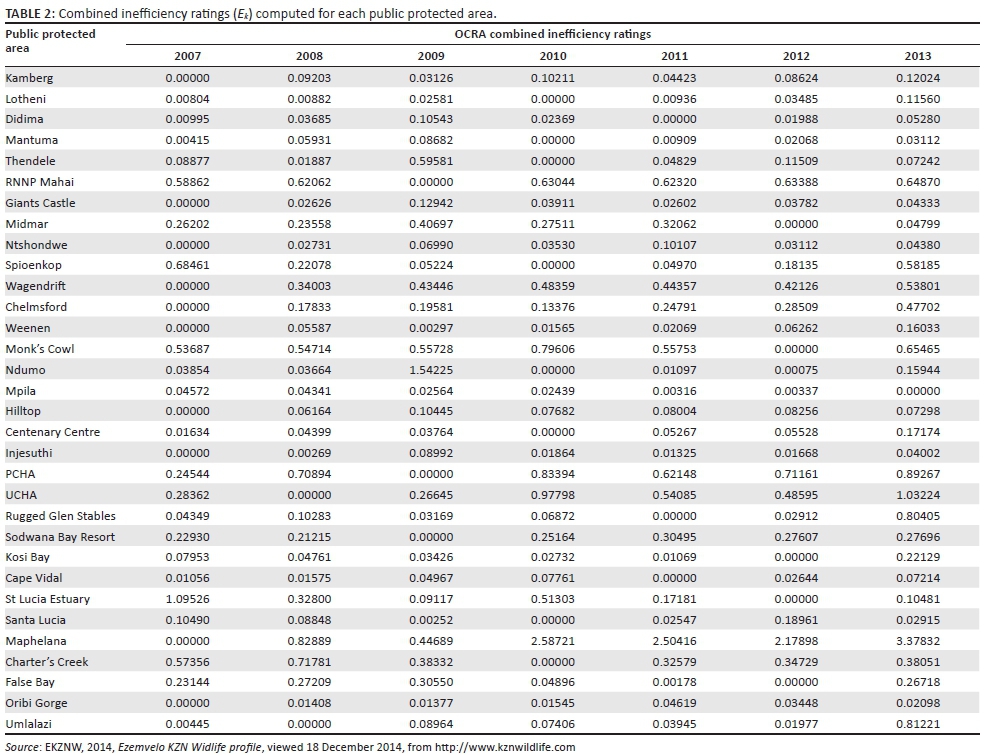
Combined inefficiency ratings for public protected areas
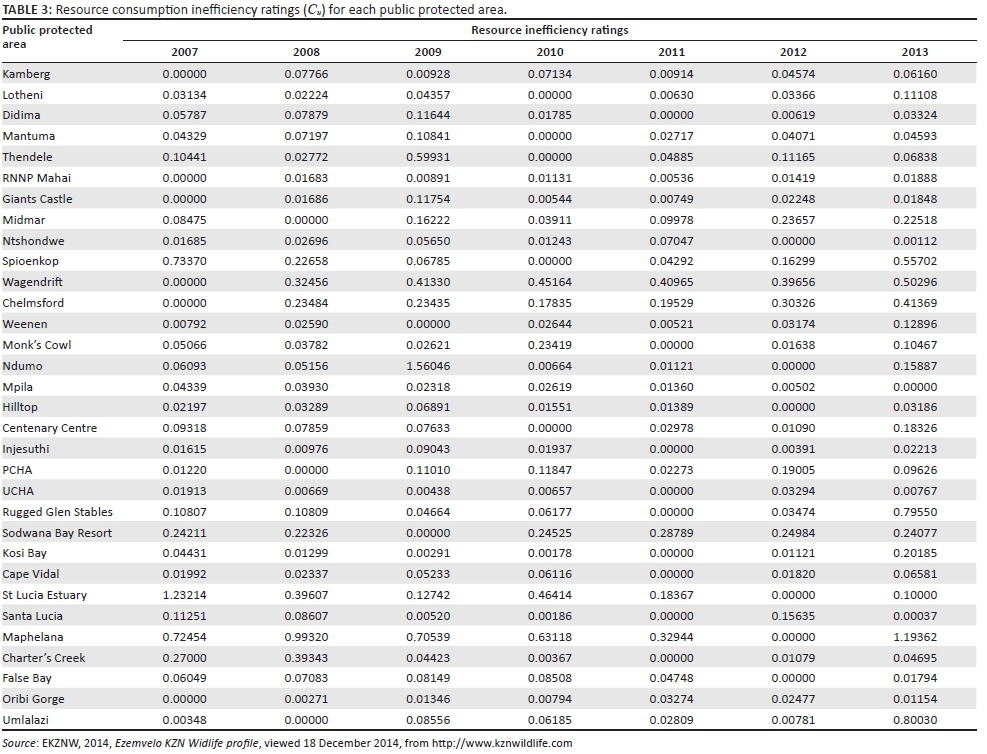
The results in Table 2 show that the combined inefficiency ratings for Kamberg were at their lowest in 2007, improved in 2008 and then increased in 2009. From 2010 to 2013, they fluctuated several times, improving again in 2011. The results suggest that disparities in operational competitiveness can be accounted for by the high share of total revenues and costs that largely influenced the performance of revenue and resource competitiveness, which in turn affected operational competitiveness. A closer examination reveals that the fluctuations of combined inefficiency ratings coincide with observed fluctuations in resource consumption inefficiency ratings, implying that the performance of resource competitiveness had more influence on the operational competitiveness of Kamberg.
In Midmar, efficiency improvements coincided with resource competitiveness improvements in 2008 and 2010 (tables 2 and 3), whereas with revenue competitiveness it was from 2010 to 2012. It seems that Midmar was able to improve operational competitiveness when the revenue competitiveness was low and resource competitiveness was high in 2008 and vice versa in 2012.
For Ntshondwe, the combined inefficiency ratings were closely linked to the performance of resource consumption inefficiency ratings, implying that these had a greater impact on combined inefficiency ratings and thus operational competitiveness.
At Mpila, meanwhile, the years that registered improvements in resource consumption inefficiency ratings, 2007-2009, coincided with the years that registered improvements in the combined inefficiency ratings. Furthermore, it was only in the year 2011 that Mpila registered the lowest relative combined inefficiency rating (Table 2), the same year resource consumption and revenue generation inefficiency ratings performed better. First, this implies that resource competitiveness had more influence on operational competitiveness because it performed better than revenue competitiveness in some years. Second, the results also imply that a combination of better performing revenue and resource competitiveness had a greater effect in improving operational competitiveness. The results seem to support the findings by Shieh (2012) that better cost efficiency leads to improved financial performance and by Tsaur (2001) that both low inefficiencies in revenue and costs can enhance operational performance.
At the Phongolo Controlled Hunting Area (PCHA), revenue competitiveness influenced operational competitiveness more than resource competitiveness because revenue generation inefficiency ratings were more than 10 times the size of resource consumption inefficiency ratings (Table 3). This suggests that, in this study, high inefficiencies in revenue generation have resulted in poor operational competitiveness.
For Rugged Glen Stables (RGS), Table 3 shows that resource consumption inefficiency ratings were higher than revenue generation inefficiency ratings between 2007 and 2010. These coincide with the years that operational competitiveness was worse, whereas revenue generation inefficiency ratings were lower in the same period. Moreover, between 2011 and 2012, resource competitiveness improved whilst revenue competitiveness declined, again coinciding with better operational competitiveness in this period. Therefore, in this study, it suggests that resource competitiveness had a greater effect than revenue competitiveness on operational competitiveness.
Resource consumption and revenue generation inefficiency ratings for public protected areas
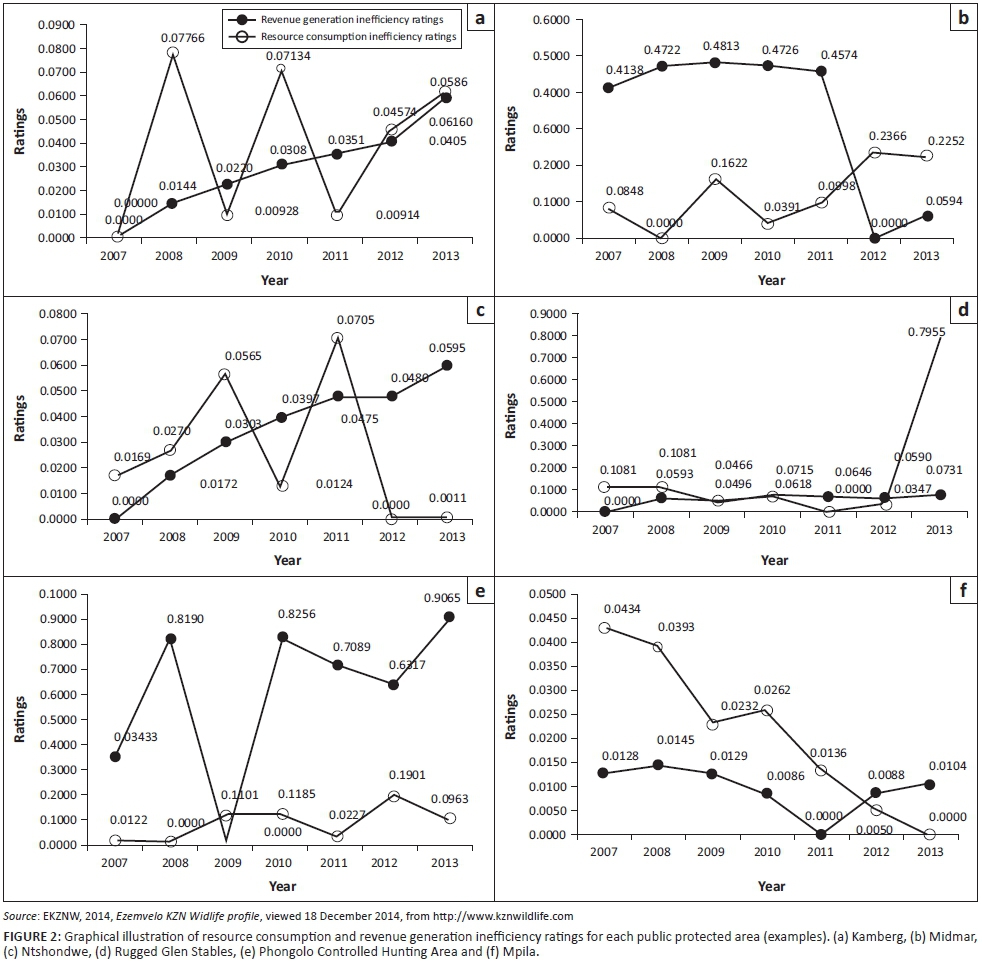
Resource consumption and revenue inefficiency ratings reflect the resource and revenue competitiveness of each PU. Examples of resource consumption and revenue generation inefficiency ratings corresponding to each PPA are illustrated graphically to obtain a better sense of relative competitiveness of resources consumed and revenues generated by each PPA between 2007 and 2013 (Figure 2).
According to the results of Table 4 and Figure 2, for Kamberg in 2007, the most competitive year was 2007. Revenue became increasingly less competitive from 2008 to 2013. Mostly, the average shares of total revenues come from the R1, R2 and R3 categories. This suggests that from 2008 to 2013, revenue generators did not produce significant returns to offset the increasing inefficiency. There were sharp declines and increases in resource competitiveness between 2008 and 2011, and then a gradual decrease in competitiveness between 2012 and 2013. From Table 5, staff costs take the largest share of costs incurred by Kamberg, followed by utilities. This result suggests that increased cost control in staff and utility costs could improve Kamberg's resource competitiveness profile.
The results presented in Table 3 (also see Figure 2) show that Midmar's resource competitiveness declined from 2007 to 2008. However, the inefficiency ratings increased in 2009 and declined in 2010. There was a gradual increase in the value of the ratings from 2011 to 2013. This suggests that categories with a higher average share of total costs (C1, C3, C5 and C9) had minimal impact on the improvement of resource competitiveness because of a lack of cost control, and improvements in this area will occur only if Midmar adopts cost-cutting strategies, without compromising on the quality of its services. Revenue generation inefficiency ratings increased slightly from 2007 to 2009, then declined dramatically from 2010 to 2012 and increased again in 2013. The revenue generation inefficiency ratings were still unacceptably high. The main revenue generators came from the R1 and R2 categories, and these did little to improve revenue competitiveness. This has the important implication that increasing the revenue share of accommodation and entrance fees can impact revenue competitiveness positively. According to Dube (2011), EKZNW offers outdated products that few clients can relate to and is stuck in traditional conservation practices that prevent it from taking advantage of new markets. It must modernise its services and products, maintaining natural capital and traditions of heritage value.
Revenue generation inefficiency ratings in Ntshondwe gradually increased from 2007 to 2013, suggesting that revenue competitiveness worsened (Figure 2). Although a large share of revenue was derived from accommodation and sales, this share was insufficient to improve revenue competitiveness. Moreover, Ntshondwe offers trails, rides and tours, but the share of revenue from these activities was insufficient to make meaningful improvements on revenue competitiveness. Noticeable inefficiencies for resource consumption were in 2009 and 2011. An improvement in the revenue and resource competitiveness profile of Ntshondwe will occur if management diversifies ecotourism activities and reduces costs. Cost-effective marketing strategies can be adopted to increase demand, which can lead to lower inefficiency (Barros 2005).
For Mpila, the best performing revenue generation inefficiency ratings lie in the R2 and R7 categories, implying that management can redirect efforts to improve revenue competitiveness by focusing on these categories. As for resource consumption inefficiency ratings, there was a notable decline from 2007 to 2009 (Table 3 and Figure 2), and a slight increase in 2010, followed by a dramatic decrease in resource consumption inefficiency ratings in the remaining years. This improvement stems from a decrease in costs in the C1, C2, C5, C9 and C11 categories in that period. Furthermore, the results indicate that if management shifted resources away from the C5, C9 and C11 categories, this could improve resource competitiveness.
In PCHA, revenue generation inefficiency ratings increased from 2007 to 2008, suggesting that revenue competitiveness declined in this period. The least inefficient year was 2009, and then revenue generation inefficiency ratings increased in 2010, and then decreased in 2012, increasing again in 2013 (Figure 2). In 2008, resource competitiveness was stable, but resource consumption inefficiency ratings increased in 2009 and 2010. A slight upward trend continued from 2011 to 2013, which may have been because of weak cost control. The C1, C5 and C7 categories had more influence on resource competitiveness because of higher average shares of total costs (Table 5). The main revenue generators in PCHA were hunting and accommodation. The result is not surprising because many studies (ABSA 2003; Baker 1997; Damm 2005; Mossman & Mossman 1976; Van der Merwe, Saayman & Krugell 2004) have shown that hunting is the most lucrative ecotourism enterprise and as such, should have a greater effect on increasing revenue competitiveness.
In RGS, revenue generation inefficiency ratings increased from 2007 to 2008 and then remained steady until 2013 (Figure 2). The R1, R4 and R7 categories had larger shares of total revenue. On the contrary, resource competitiveness worsened between 2011 and 2013. Activities such as services and utilities took a considerable share of costs, next to personnel-related expenses.
Resource consumption calibration constants for public protected areas
The evaluation of resource consumption calibration constants indicates, for instance, that in Kamberg, for category C1 (Basic Salary, Unemployment Insurance Fund [UIF], Housing Subsidy, Pension, Medical Aid and Service Bonus) had the highest average share of total costs at 4.8%. Moreover, category C2 (Overtime, Subsistence, Danger, Night Shift and Standby Allowance) had the least average share of total costs at 0.18%. This suggests that Kamberg allocates more funds to paying permanent staff members.
The category with the highest average share of total costs for Midmar was the C1 category at 3.5%, followed by the C3 (Short-Term Contractual Work) category because its average share of total cost was 0.64%. The use of temporary staff or contractual workers has several benefits such as a reduction in recruitment costs and employee costs (David, Brendan & Mike 2006). Therefore, Midmar should use contractual workers for short-term tasks and assignments to control staffing costs. The C9 (Gas, Water and Electricity) and C5 (Roads, Tools and Equipment, Furniture and Fittings, Buildings and Structures) categories each had an average share of total costs of 0.55% and 0.53%, respectively. High utility costs can reduce the revenue maximisation of any organisation significantly (Hassanien & Dale 2013). Midmar has campsites with electric plug points and chalets fitted with refrigerators, electric stoves and cable TV (DSTV), and with running cold and hot water (EKZNW 2014). Furthermore, Midmar hosts sporting and music events during weekends and peak periods and has multiple recreational activities which include boating, swimming, water skiing, picnicking and fishing (EKZNW 2014). According to Flanagan (2014), the provision of electricity or plug-in points at EKZNW has a positive effect on the desirability of a PPA site as a tourist destination. Thus, EKZNW could introduce cheaper and greener alternatives such as solar panels to reduce the cost of utilities. Moreover, the C6 (Security Expenses, Security Bank Expenses and Fire Extinguisher Services) category had an average share of total costs of 0.41%. Spending on security should be informed by assessed risks and threats. Considering that crime in South Africa, especially in KwaZulu-Natal, has been increasing consistently in all crime categories (SAPS 2016) and that the dam is adjacent to Mpophomeni township, Midmar management is advised to increase funds allocated for security to ensure the safety of tourists and integrity of its conservation area. Townships are places of socio-economic hardship and this often compels some people to turn to criminal activities.
For Ntshondwe, the C1 category had the highest calibration constant and thus the highest average share of total costs at 4.1%. This result is consistent with several studies that have shown that salaries and wages are the largest costs for tourism operations (e.g. Bovarnick et al. 2010; Eagles 2002). Labour costs should be assessed against the marginal value product of each labour category, and it will remain essential to align the qualities of labour with their respective costs and revenue contributions. For instance, management can review salaries and wages, reduce weekday hours, remunerate employees based on their level of expertise or contribution to the organisation, reward exceptional performance and eliminate redundant positions that add no significant value to Ntshondwe and EKZNW.
The C11 (Cost of Sales Fuel, Curios and Other) category had the second largest average share of total costs at 0.9%. Cost of sales refers to the purchase price of goods sold at Ntshondwe such as fuel and curios. Because this cost is high, EKZNW can revise its business model around, for instance, outsourcing fuel sales to fuel companies or curio sales to local craft shops. The C9, C7 and C5 categories stand at 0.53%, 0.52% and 0.48%, respectively. One way in which management can reduce the high cost of utilities (C9) is by 'going green' (Pfister & Tierney 2008). This approach provides Ntshondwe and other PPAs with the opportunity to improve long-term profitability by lowering expenses and enshrining environmental stewardship, adding value to the EKZNW brand image of ecological responsibility. Ntshondwe and most PPAs can install solar panels in their accommodation facilities and in the camping area where electric plug points are available. The upfront cost of implementing these eco-friendly alternatives is high, but in most cases the returns on investment in the long term are excellent, largely because of recurrent cost savings (Rahman, Reynolds & Svaren 2012). Moreover, management should also review its maintenance strategies. According to PlantWeb (2003), the most basic and common maintenance strategy is the reactive and needs-based maintenance ('fix it when it breaks' strategy), but repair costs for infrastructure and equipment are higher than in most strategies. Therefore, management at Ntshondwe could utilise preventive, predictive and proactive maintenance strategies interchangeably, depending on the scale of the maintenance required.
In Mpila, the relative importance of the C11 category comes second to the C1 category. Still, the C10, C5 and C9 categories had an average share of total cost of 0.7%, 0.5% and 0.47%, respectively. It appears that Mpila incurred higher costs from its bar and restaurant sales. Mpila can reduce the relatively high average share of total costs in the C11 category by offering concessions to private enterprises which are motivated by profits and may have the management skills and operating procedures required to run such operations efficiently (Guasch 2004). The C10 and C5 categories had higher shares; however, these costs are to some extent necessary because it is another way Mpila can offer quality ecotourism products to retain its customers. According to Beerli and Martin (2004), cited in Mmopelwa, Kgathi and Molefhe (2007), the image of a tourist destination is essential in influencing the satisfaction of visitors. Moreover, tourists are willing to pay higher fees if services are improved and funds are invested in environmental conservation (Mmopelwa et al. 2007), especially wealthy consumers. Therefore, management needs to ensure that adequate funds are available to conduct maintenance operations on the infrastructure and necessary equipment. Utilities were mostly driven up by high electricity accounts. The best alternative for Mpila to reduce utility costs in the long run is to invest in sustainable and energy efficient technologies such as solar power.
The results presented in Table 5 show that at PCHA, the C3, C10 and C7 categories had average shares of total costs at 0.8%, 0.76% and 0.42%, respectively. Much of the costs are centred on contractual work which at PCHA includes live animal capture using helicopters and bomas, an expensive task routinely conducted by professionals (Hudson, Drew & Baskin 1989). Moreover, Hudson et al. (1989) state that fencing is a major development cost with different animals requiring fences with different heights, numbers of strands and types of poles.
Furthermore, Table 5 shows that RGS, Sodwana Bay Resort and Kosi Bay had average shares of total costs of 6.5%, 2.44% and 5.2%, respectively, in the C1 category. The high costs in the C1 category seems to be a common phenomenon across EKZNW PPAs. In RGS, the C6 and C9 categories had the second and third highest average cost shares of 0.95% and 0.34%, respectively. The high cost of stable management services in the C6 category, relative to other categories, is mainly because of costly horse and stable management activities (Knight 2010).
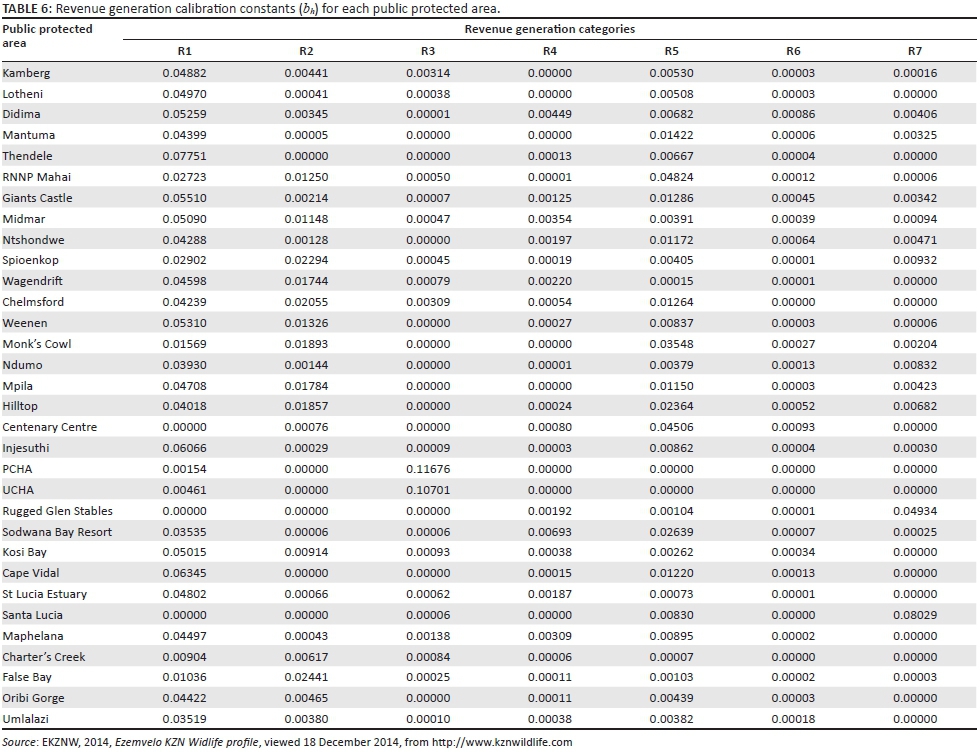
Revenue generation calibration constants for public protected areas
According to Table 6, Kamberg's main revenue generators between 2007 and 2013 were 'Accommodation' (R1-Chalets, Rustic Cottages and Rondavels), 'Admissions' (R2-Entrance Fees) and 'Sales' (R5-Sales Revenue from Operating Retail Stores). The revenue calibration constant or average share of total revenue for the 'Trails, Tours and Rides' (R7) was low at 0.016%. In addition, Giants Castle, Midmar and Ntshondwe also derived a large share of their total revenues from the R1 category with average revenue shares of 5.5%, 5.1% and 4.2%, respectively. Furthermore, the R5 category had the second highest relative importance to Giants Castle and Ntshondwe with average shares of total revenues of 1.3% and 1.2%, respectively. Meanwhile, Midmar's second highest revenue generator came from the R2 category, and this category had 1.2% of average shares of total revenues. In Midmar, the main activities were boating, yachting and fishing (EKZNW 2014). Therefore, it was rather surprising to find that the R3 category had the second lowest average share of total revenue at 0.047%. Giants Castle and Ntshondwe received significant revenues from the R7 category with average shares of total revenue at 0.34% and 0.47%, respectively.
Kamberg offers tours to San rock art, and is regarded as the highlight of visiting the area (EKZNW 2014). However, the results above show that this activity generated very low revenue despite it being one of the main attraction at Kamberg. Similarly, the R7 category in Giants Castle and Ntshondwe generated lower revenues relative to other revenue-generating categories. These results are consistent with the findings of Flanagan (2014), who suggested that cultural or tour areas did not have any significant impact on revenues received. Moreover, in Midmar, strict regulations around freshwater recreational use could be causing the low revenues because boat skippers are required to adhere to strict zoning areas (EKZNW 2014). Furthermore, the results suggest that accommodation is the main revenue generator for Kamberg, Giants Castle, Midmar and Ntshondwe. Flanagan (2014) also found that increases in occupation rates in EKZNW accommodation have significant impacts on revenue, especially when associated with popular tourist activities.
The results further indicate that Mpila derived a considerable proportion of its average shares of total revenues from the R1 category at 4.7%. This result is not surprising as accommodation has been found to be one of the main revenue generators for PPAs (Eagles 2002; Flanagan 2014; Porter et al. 2003). Accommodation at Mpila consists of 20 chalets and 15 tented camps. According to Flanagan (2014), chalets on average experience higher visitor occupation than other accommodation types offered by EKZNW. Therefore, PPAs with fewer chalets (like Mpila and Hilltop) should have been generating less revenue. Furthermore, Mpila, found in the Hluhluwe-iMfolozi Park, with an array of wildlife including the 'Big Five', derives low revenue from the R7 category with an average share of total revenue of 0.43%, which rather is surprising. This result, however, is consistent with Flanagan (2014), who has shown that the 'Big Five' animals had a statistically insignificant effect on revenues in PPAs. It could be that instead of paying for guided tours, visitors prefer to pay entrance fees to such areas and drive themselves to view wildlife. This also explains the 1.7% average share of total revenue in the R2 category, higher than the R7 category.
PCHA had two categories (R1 and R3) generating revenues. The R3 category for PCHA had the largest average share of total revenues at 11.7%, making this category the best revenue generator in the commercial operations of EKZNW across all categories considered. Permits and licences in PCHA are usually granted for hunting and fishing in the Phongola River and the Phongolopoort Dam (EKZNW 2014). This indicates that hunting and fishing contribute significantly to revenues in PCHA. The result is consistent with many studies in the past (e.g. ABSA 2003; Damm 2005; Van der Merwe et al. 2004), which show that hunting is a highly profitable operation in the nature-based tourism industry. Thus, EKZNW management could be forced to enact stricter permit and licencing regulations to control the quantity of wildlife being harvested.
In RGS, the category with the highest average share of total revenues was R7 at 4.9%. According to EKZNW (2014), RGS mainly conducts horse riding operations, the main revenue generator. This operation mainly attracts Europeans Ollenburg (2005). Considering the growing African middle class in South Africa (Van Loggerenberg & Herbst 2010), RGS needs to tap into this lucrative market to grow its revenue. According to Cini and Saayman (2014), younger people at national parks have been shown to have a higher propensity to spend money at national parks. Therefore, EKZNW can also market to these younger groups.
Conclusion and management implications
The aim of this study was to measure the operational competitiveness of ecotourism operations of PPAs in EKZNW. This was performed through constructing an operational competitiveness profile for each PPA, using the OCRA procedure. Financial data for ecotourism operations in PPAs were collected from EKZNW for 2007-2013.
The study showed that hunting generated more revenue than most of EKZNW's ecotourism operations and had the greatest effect on operational competitiveness. This implies that for management in EKZNW to improve its revenue competitiveness, it should implement strategies to scale up hunting-operations. However, it will only be possible to implement this strategy if EKZNW increases the number of hunting-sanctioned protected areas because currently only five have that status. This result has other implications as well, one of which is creating perverse incentives that could encourage EKZNW to move away from 'deep ecotourism', which is in line with conservation objectives, to 'shallow ecotourism', which is driven by local community development and beneficiation other than just conservation without the human dimension. Ecotourism activities such as trails, rides and tours generally had the lowest average share of total revenue. The implication is that management either needs to make guided tours more attractive or increase park fees to generate more income. The implementation of the latter will depend on the demand elasticities of park visits at EKZNW.
The results show that PPAs in EKZNW place a higher importance on salaries and wages, maintenance and repairs, and utilities. Therefore, improved cost control is required in these resource consumption activities that adversely affect operational competitiveness. For instance, management needs to explore different methods of minimising labour costs by reducing the number of staff or the level of compensation. Moreover, considering that biodiversity management is a labour-intensive activity and relies heavily on human capital, EKZNW can ensure that personnel are remunerated in accordance with skill sets that add value to PPAs. However, minimising the labour force might reduce incentives for staff to work effectively and lower morale, which in turn might reduce the quality of services provided and thus the capacity of PPAs to generate revenue. EKZNW should revise its utility expenses (especially electricity) and find alternative sustainable energy sources to reduce not only the utility bill but also its environmental footprint. The capital outlay for such a project in the short term is expected to be high. Thus, it is recommended for EKZNW to pursue this incrementally. Also, the agency should continue allocating funds for maintenance and repairs to improve tourist flows in the long term.
It is also recommended that EKZNW implement policies and strategies to increase its share of revenue from the main revenue-generating operations (accommodation, permits, licences and admissions) to improve revenue competitiveness. Moreover, EKZNW needs to appeal to new markets based on demographic changes (the African middle class) as a strategy to increase revenues. By constantly reviewing its policies and strategies, EKZNW will be better positioned to take advantage of such changes. Furthermore, this result implies that by upgrading accommodation facilities and its product offering, EKZNW could provide better services which would increase its revenue and ultimately improve its operational competitiveness. However, this will require major investment from the government, which will prove difficult given the current economic climate and will also depend on whether the supply of facilities in a PPA will match visitor demand.
Nonetheless, EKZNW can initiate partnerships with the private sector and environmental NGOs. Again, caution should be taken in increasing tourist flows to these areas as this could reduce the quality, and aesthetic and amenity value of the environment. To create lower inefficiencies in overall operations, PPAs under EKZNW should employ various strategies to increase revenues or reduce costs.
Each PPA allocates resources and generates revenues differently. Therefore, flexibility in the centralised resource allocation system is required so that PPAs that perform better and manage funds properly can retain some fraction of their earnings to reward staff and pay for maintenance, repairs, utilities and new projects. However, this will only be possible if EKZNW raises the standard of its facilities in some of its (ecotourism-based) PPAs to appeal more to a broader market. PPAs with high costs, low revenues and poor operational competitiveness but high ecological or environmental value should be monitored closely, with stricter control by EKZNW so that they can develop strategies to diversify revenues and improve cost management. In other words, EKZNW should generate better incentives for ecotourism in PPAs to increase competitiveness and for nature to contribute to its conservation.
Revenue and resource competitiveness varied erratically throughout the study period, with minor improvements in some years and a worsening competitiveness in most of the years. Therefore, EKZNW needs to ensure that both cost reduction and high revenue generation are a priority at any one time to improve operational competitiveness. However, the combination of these strategies will vary among PPAs in EKZNW and will depend on the nature and degree of operations in the PPA concerned. Moreover, increasing revenues through increasing service charges will require information on the price elasticity of demand for the services of PPAs under investigation. This information will assist in devising a fee system that could be adopted to maximise revenues and improve the economic efficiency of PPAs. For instance, rural communities that surround these PPAs generally have a higher price elasticity of demand than wealthier international visitors, making them more sensitive to fee increases. Therefore, EKZNW can adopt a multi-layered fee system (price discrimination), drawing lessons from other countries so as to make their services sensitive to income inequalities among local visitors whilst generating adequate revenues from international visitors. This is certainly an area of study that needs further investigation.
Acknowledgements
The authors wish to thank Mr Rahman Devduth, the natural resources trade coordinator, and Mr Ebrahim Mulla, the finance manager, both at Ezemvelo KZN Wildlife, for providing the data and additional information. Insightful comments from two anonymous reviewers of the journal are duly acknowledged. Any remaining errors or omissions are the responsibilities of the authors.
Competing interests
The authors declare that they have no financial or personal relationships that may have inappropriately influenced them in writing this article.
Authors' contributions
K.D.M. was the main author responsible for data collection and analysis. E.W. was responsible for supervising the study, contributing to the write-up in terms of regular inputs and comments for improvement at various stages of the study, identifying relevant literature, reviewing the article, revising the article following reviewers' comments and responding to reviewers' comments.
References
ABSA, 2003, Game ranch profitability in South Africa, Absa Group Economic Research, Rivonia, South Africa. [ Links ]
Aylward, B.A. & Lutz, E., 2003, Nature tourism, conservation, and development in KwaZulu-Natal, South Africa, World Bank, Washington, DC. [ Links ]
Baker, J.E., 1997, 'Trophy hunting as a sustainable use of wildlife resources in southern and eastern Africa', Journal of Sustainable Tourism 5, 306-321. https://doi.org/10.1080/09669589708667294 [ Links ]
Barnes, J.I. & De Jager, J., 1996, 'Economic and financial incentives for wildlife use on private land in Namibia and the implications for policy', South African Journal of Wildlife Research 26, 37-46. [ Links ]
Barros, C.P., 2005, 'Measuring efficiency in the hotel sector', Annals of Tourism Research 32, 456-477. https://doi.org/10.1016/j.annals.2004.07.011 [ Links ]
Beerli, A. & Martin, J.D., 2004, 'Tourists' characteristics and the perceived image of tourist destinations: A quantitative analysis - a case study of Lanzarote, Spain', Tourism Management 25, 623-636. https://doi.org/10.1016/j.tourman.2003.06.004 [ Links ]
Bosetti, V. & Locatelli, G., 2006, 'A data envelopment analysis approach to the assessment of natural parks' economic efficiency and sustainability: The case of Italian national parks', Sustainable Development 14(4), 277-286. https://doi.org/10.1002/sd.288 [ Links ]
Bovarnick, A., Fernández-Baca, J., Galindo, J. & Negret, H., 2010, Financial sustainability of protected areas in Latin America and the Caribbean: Investment policy guidance, United Nations Development Programme and the Nature Conservancy. [ Links ]
Bruner, A.G., Gullison, R.E. & Balmford, A., 2004, 'Financial costs and shortfalls of managing and expanding protected area systems in developing countries', BioScience 54, 12. https://doi.org/10.1641/0006-3568(2004)054%5B1119:FCASOM%5D2.0.CO;2 [ Links ]
Charnes, A.C., Cooper, W.W. & Rhodes, E., 1978, 'Measuring the efficiency of decision making units', European Journal of Operational Research 2, 429-444. https://doi.org/10.1016/0377-2217(78)90138-8 [ Links ]
Child, B.A., Musengezi, J., Parent, G.D. & Child, G.F., 2012, 'The economics and institutional economics of wildlife on private land in Africa', Pastoralism 2, 1-32. https://doi.org/10.1186/2041-7136-2-18 [ Links ]
Cini, F. & Saayman, M., 2014, 'Which age group spends the most in a national park?', Koedoe 56(2), Art. #1158, 8 pages. https://doi.org/10.4102/koedoe.v56i2.1158 [ Links ]
Damania, R. & Hatch, J., 2005, 'Protecting Eden: Markets or government?', Ecological Economics 53, 339-351. https://doi.org/10.1016/j.ecolecon.2004.09.015 [ Links ]
Damm, G., 2005, 'Hunting in South Africa: Facts, risks and opportunities', African Indaba 3, 1-23. [ Links ]
David, B., Brendan, B. & Mike, M., 2006, 'The changing world of the temporary worker: The potential HR impact of legislation', Personnel Review 35, 191-206. https://doi.org/10.1108/00483480610645821 [ Links ]
Dixon, J.A. & Sherman, P.B., 1990, Economics of protected areas: A new look at benefits and costs, Island Press, Washington, DC. [ Links ]
Dixon, J.A. & Sherman, P.B., 1991, 'Economics of protected areas', Ambio 20, 68-74. [ Links ]
Dube, T.B., 2011, 'An analysis of alternative funding strategies for protected area management: A case study of Ezemvelo KZN Wildlife', Master of Development Finance thesis, Stellenbosch University. [ Links ]
Eagles, P.F., 2002, 'Trends in park tourism: Economics, finance and management', Journal of Sustainable Tourism 10, 132-153. https://doi.org/10.1080/09669580208667158 [ Links ]
Eagles, P.F., 2003, 'International trends in park tourism: The emerging role of finance', The George Wright Forum 20(1), 25-57. [ Links ]
Eagles, P.F., Mccool, S.F., Haynes, C.D. & Phillips, A., 2002, Sustainable tourism in protected areas: Guidelines for planning and management, vol. 8, IUCN, Gland, Switzerland. [ Links ]
Eeley, H.A., Lawes, M.J. & Piper, S.E., 1999, 'The influence of climate change on the distribution of indigenous forest in KwaZulu-Natal, South Africa', Journal of Biogeography 26, 595-617. https://doi.org/10.1046/j.1365-2699.1999.00307.x [ Links ]
EKZNW, 2009, Ezemvelo KwaZulu-Natal Wildlife five year strategic and performance plan for 2009 and 2014, viewed 05 November 2013, from http://www.kznwildlife.com [ Links ]
EKZNW, 2014, Ezemvelo KZN Widlife profile, viewed 18 December 2014, from http://www.kznwildlife.com [ Links ]
Emerton, L., Bishop, J. & Thomas, L., 2006, Sustainable financing of protected areas: A global review of challenges and options, IUCN, Gland, Switzerland. [ Links ]
Flanagan, O.J., 2014, 'Spatial prioritisation of conservation areas on the fringes of KwaZulu-Natal protected areas: Application of the characteristics framework using tourism competitiveness', Master of Science in Agriculture (Agribusiness) thesis, University of KwaZulu-Natal. [ Links ]
Ghalayini, A.M. & Noble, J.S., 1996, 'The changing basis of performance measurement', International Journal of Operations and Production Management 16, 63-80. https://doi.org/10.1108/01443579610125787 [ Links ]
Goodman, P.S., 2003, 'Assessing management effectiveness and setting priorities in protected areas in KwaZulu-Natal', BioScience 53, 843-850. https://doi.org/10.1641/0006-3568(2003)053%5B0843:AMEASP%5D2.0.CO;2 [ Links ]
Guasch, L., 2004, 'Granting and renegotiating infrastructure concessions: Doing it right', The World Bank, Washington, DC. [ Links ]
Harris, P.A., 1999, 'Review of equine feeding and stable management practices in the UK concentrating on the last decade of the 20th century', Equine Veterinary Journal 31, 46-54. https://doi.org/10.1111/j.2042-3306.1999.tb05156.x [ Links ]
Hassanien, A. & Dale, C. (eds.), 2013, 'Tourism, hospitality and events facilities', in Facilities management and development for tourism, hospitality and events, pp. 20-36, CABI, Edinburgh. [ Links ]
Holden, A., 2013, Tourism, poverty and development, Routledge, London. [ Links ]
Honey, M., 2003, 'Protecting Eden: Setting green standards for the tourism industry', Environment: Science and Policy for Sustainable Development 45(6), 8. https://doi.org/10.1080/00139157.2003.10544694 [ Links ]
Hudson, R.J., Drew, K. & Baskin, L.M., 1989, Wildlife production systems: Economic utilisation of wild ungulates, CUP, Cambridge, UK. Archive. [ Links ]
James, A., Gaston, K.J. & Balmford, A., 2001, 'Can we afford to conserve biodiversity?', BioScience 51, 1. https://doi.org/10.1641/0006-3568(2001)051%5B0043:CWATCB%5D2.0.CO;2 [ Links ]
Khumalo, S. & Molla, Y., 2012, 'Funding shock for KZN wildlife', The Mercury Newspaper, 28 September, viewed n.d., from https://www.iol.co.za/news/politics/funding-shock-for-kzn-wildlife-1392062 [ Links ]
Kiss, A., 2004, 'Is community-based ecotourism a good use of biodiversity conservation funds?', Trends in Ecology & Evolution 19, 232-237. https://doi.org/10.1016/j.tree.2004.03.010 [ Links ]
Knight, R., 2010, 'Horse business management: Managing a successful yard', Australian Veterinary Journal 88, 509-509. https://doi.org/10.1111/j.1751-0813.2010.00656.x [ Links ]
Laycock, H., Moran, D., Smart, J., Raffaelli, D. & White, P., 2009, 'Evaluating the cost-effectiveness of conservation: The UK Biodiversity Action Plan', Biological Conservation 142, 3120-3127. https://doi.org/10.1016/j.biocon.2009.08.010 [ Links ]
Lindsey, P.A., Alexander, R.R., Du Toit, J.T. & Mills, M., 2005, 'The potential contribution of ecotourism to African wild dog (Lycaon pictus) conservation in South Africa', Biological Conservation 123, 339-348. https://doi.org/10.1016/j.biocon.2004.12.002 [ Links ]
Lindsey, P.A., Romanach, S. & Davies-Mostert, H., 2009, 'The importance of conservancies for enhancing the value of game ranch land for large mammal conservation in southern Africa', Journal of Zoology 277, 99-105. https://doi.org/10.1111/j.1469-7998.2008.00529.x [ Links ]
Mahony, K. & Van Zyl, J., 2002, 'The impacts of tourism investment on rural communities: Three case studies in South Africa', Development Southern Africa 19, 83-103. https://doi.org/10.1080/03768350220123891 [ Links ]
Mmopelwa, G., Kgathi, D. & Molefhe, L., 2007, 'Tourists' perceptions and their willingness to pay for park fees: A case study of self-drive tourists and clients for mobile tour operators in Moremi Game Reserve, Botswana', Tourism Management 28, 1044-1056. https://doi.org/10.1016/j.tourman.2006.08.014 [ Links ]
Moran, D., Pearce, D. & Wendelaar, A., 1997, 'Investing in biodiversity: An economic perspective on global priority setting', Biodiversity and Conservation 6, 1219-1243. https://doi.org/10.1023/A:1018360924079 [ Links ]
Mossman, S.L. & Mossman, A.S., 1976, Wildlife utilization and game ranching, Report on the recent progress in this field in southern Africa, IUCN Occasional Paper 17, 97, International Union for the Conservation of Nature, World Wildlife Fund and Humbolt State University, Gland, Switzerland. [ Links ]
Muir-Leresche, K. & Nelson, R., 2000, Private property rights to wildlife: The southern African experiment, International Centre for Economic Research, Washington, DC. [ Links ]
Musengezi, J., 2010, 'Wildlife utilization on private land: Understanding the economics of game ranching in South Africa', Doctor of Philosophy, University of Florida. [ Links ]
Myburgh, E. & Saayman, M., 1999, Ecotourism in action: Practical guidelines and principles, 1st edn., Leisure Consultants and Publications, Potchefstroom. [ Links ]
Ollenburg, C., 2005, 'Worldwide structure of the equestrian tourism sector', Journal of Ecotourism 4, 47-55. https://doi.org/10.1080/14724040508668437 [ Links ]
Parkan, C., 1991, 'The calculation of operational performance ratings', International Journal of Production Economics 24, 165-173. https://doi.org/10.1016/0925-5273(91)90163-N [ Links ]
Parkan, C., 1996, 'Measuring the performance of hotel operations', Socio-Economic Planning Sciences 30, 257-292. https://doi.org/10.1016/S0038-0121(96)00013-4 [ Links ]
Parkan, C., 1999, 'Performance measurement in government services', Managing Service Quality 9, 121-135. https://doi.org/10.1108/09604529910257911 [ Links ]
Parkan, C., 2003, 'Measuring the effect of a new point of sale system on the performance of drugstore operations', Computers & Operations Research 30, 729-744. https://doi.org/10.1016/S0305-0548(02)00047-3 [ Links ]
Parkan, C., Lam, K. & Hang, G., 1997, 'Operational competitiveness analysis on software development', Journal of the Operational Research Society 48, 892-905. https://doi.org/10.1057/palgrave.jors.2600446 [ Links ]
Parkan, C. & Wu, M.L., 1999, 'Measurement of the performance of an investment bank using the operational competitiveness rating procedure', Omega 27, 201-217. https://doi.org/10.1016/S0305-0483(98)00041-3 [ Links ]
Parker, S. & Khare, A., 2005, 'Understanding success factors for ensuring sustainability in ecotourism development in southern Africa', Journal of Ecotourism 4, 32-46. https://doi.org/10.1080/14724040508668436 [ Links ]
Pfister, R.E. & Tierney, P.T., 2008, Recreation, event, and tourism businesses: Start-up and sustainable operations, Human Kinetics, IL. [ Links ]
PlantWeb, 2003, White paper: Reducing operations and maintenance costs, viewed 13 January 2015, from http://www.PlantWeb.com [ Links ]
Porter, S., Ferrer, S. & Aylward, B., 2003, 'The profitability of nature tourism in Zululand: A survey of private reserves and public protected areas', in B. Aylward & E. Lutz (eds.), Nature tourism, conservation, and development in KwaZulu-Natal, South Africa, pp. 287-324, The World Bank, Washington, DC. [ Links ]
Rahman, I., Reynolds, D. & Svaren, S., 2012, 'How "green" are North American hotels? An exploration of low cost adoption practices', International Journal of Hospitality Management 31, 720-727. https://doi.org/10.1016/j.ijhm.2011.09.008 [ Links ]
Ridl, J., 2012, 'Ezemvelo KZN Wildlife on its knees', The Witness Newspaper, 04 October, viewed n.d., from https://www.news24.com/Archives/Witness/Ezemvelo-KZN-Wildlife-on-its-knees-20150430 [ Links ]
Ross, S. & Wall, G., 1999, 'Ecotourism: Towards congruence between theory and practice', Tourism Management 20, 123-132. https://doi.org/10.1016/S0261-5177(98)00098-3 [ Links ]
Rylance, A., 2017, 'Estimating tourism's contribution to conservation area financing in Mozambique', Tourism and Hospitality Research 17, 24-33. https://doi.org/10.1177/1467358415613119 [ Links ]
Shieh, H.S., 2012, 'Does cost efficiency lead to better financial performance? A study on Taiwan international tourist hotels', The Journal of Hospitality Financial Management 20, 17-30. https://doi.org/10.1080/10913211.2012.10721889 [ Links ]
South African Police Services (SAPS), 2016, Annual crime report 2015/2016: Addendum to the SAPS annual report, Report No. 218/2016, viewed 28 September 2017, from https://www.saps.gov.za/services/c_thumbnail.php?id=282 [ Links ]
Speelman, S., D'Haese, M., Buysse, J. & D'Haese, L., 2008, 'A measure for the efficiency of water use and its determinants, a case study of small-scale irrigation schemes in North-West Province, South Africa', Agricultural Systems 98, 31-39. https://doi.org/10.1016/j.agsy.2008.03.006 [ Links ]
Thirtle, C. & Bottomley, P., 1992, 'Total factor productivity in UK agriculture, 1967-90', Journal of Agricultural Economics 43, 381-400. https://doi.org/10.1111/j.1477-9552.1992.tb00233.x [ Links ]
Tsaur, S.H., 2001, 'The operating efficiency of international tourist hotels in Taiwan', Asia Pacific Journal of Tourism Research 6, 73-81. https://doi.org/10.1080/10941660108722090 [ Links ]
Van der Merwe, P., Saayman, M. & Krugell, W., 2004, 'Factors that determine the price of game', Koedoe - African Protected Area Conservation and Science 47(2), 105-113. https://doi.org/10.4102/koedoe.v47i2.86 [ Links ]
Van Loggerenberg, M. & Herbst, F., 2010, 'Brand-building: A telling story', USB Leaders' Lab 4(2), 13-17. http://www.usb.ac.za/ThoughtPrint/Leaders%20Lab%20PDFs/Brand-building%20-%20a%20telling%20story.pdf [ Links ]
 Correspondence:
Karabo Motau
209501788@stu.ukzn.ac.za
Received: 04 Dec. 2016
Accepted: 21 Nov. 2017
Published: 27 Mar. 2018

