


Services on Demand
Article
 English (pdf)
 Article in xml format
 Article references
Indicators

Related links
-
 Cited by Google
 -
 Similars in Google
Share

 Permalink
Koedoe
On-line version ISSN 2071-0771
Print version ISSN 0075-6458
Koedoe vol.58 n.1 Pretoria 2016
http://dx.doi.org/10.4102/koedoe.v58i1.1388
ORIGINAL RESEARCH
Classification and mapping of the woody vegetation of Gonarezhou National Park, Zimbabwe
Francesco MartiniI; Robert CunliffeI; Alessio FarcomeniII; Michele de SanctisI; Giacomo d'AmmandoIII; Fabio AttorreI
IDepartment of Environmental Biology, Sapienza University of Rome, Italy
IIDepartment of Public Health and Infectious Diseases, Sapienza University of Rome, Italy
IIISchool of Animal, Plant and Environmental Sciences, University of the Witwatersrand, South Africa
ABSTRACT
Within the framework of the Great Limpopo Transfrontier Conservation Area (GLTFCA), the purpose of this study was to produce a classification of the woody vegetation of the Gonarezhou National Park, Zimbabwe, and a map of its potential distribution. Cover-abundance data of woody species were collected in 330 georeferenced relevés across the Park. These data were used to produce two matrices: the first one using the cover-abundance values as collected in five height layers and the second one based on merging the layers into a single cover value for each species. Automatic classifications were produced for both matrices to determine the optimal number of vegetation types. The two classification approaches both produced 14 types belonging to three macro-groups: mopane, miombo and alluvial woodlands. The results of the two classifications were compared looking at the constant, dominant and diagnostic species of each type. The classification based on separate layers was considered more effective and retained. A high-resolution map of the potential distribution of vegetation types for the whole study area was produced using Random Forest. In the model, the relationship between bioclimatic and topographic variables, known to be correlated to vegetation types, and the classified relevés was used. Identified vegetation types were compared with those of other national parks within the GLTFCA, and an evaluation of the main threats and pressures was conducted.
CONSERVATION IMPLICATIONS: Vegetation classification and mapping are useful tools for multiple purposes including: surveying and monitoring plant and animal populations, communities and their habitats, and development of management and conservation strategies. Filling the knowledge gap for the Gonarezhou National Park provides a basis for standardised and homogeneous vegetation classification and mapping for the entire Great Limpopo Transfrontier Conservation Area.
Introduction
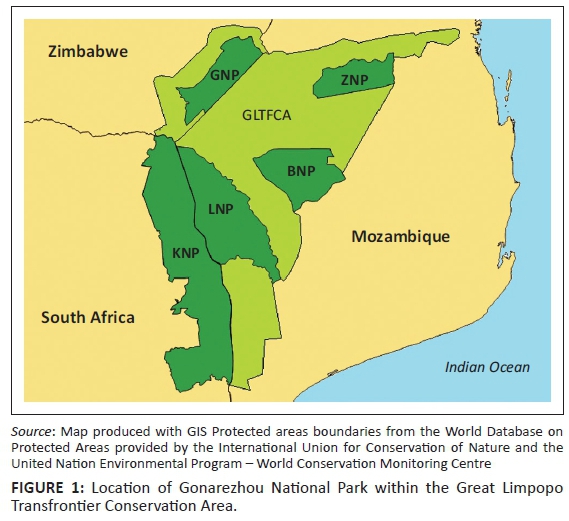
Gonarezhou National Park (GNP) was established in 1975, in the southeast of Zimbabwe alongside the border with Mozambique, stretching between the Mwenezi and Save Rivers, 21°00'-22°15' S and 30°15'-32°30' E (Figure 1). It comprises a roughly rectangular strip of land some 35 km - 45 km in width and some 135 km long. Together with the adjacent Malapati Safari Area, the total size of the study area is about 5000 km2. In conjunction with the Kruger National Park (KNP) of South Africa and the Limpopo (LNP), Banhine (BNP) and Zinave (ZNP) National Parks of Mozambique, the GNP forms part of the Great Limpopo Transfrontier Conservation Area (GLTFCA). To support the establishment of the GLTFCA, a standardised vegetation survey of the three parks in Mozambique has been carried out (Stalmans, Gertenbach & Carvalho-Serfontein 2004; Stalmans & Peel 2010; Stalmans & Wishart 2005), while comprehensive studies of vegetation in the KNP go back to the 1980s of the last century (Gertenbach 1983; Venter & Gertenbach 1986). A number of vegetation studies have been carried out for the GNP (Gandiwa et al. 2011a, 2011b, 2012; O'Connor & Campbell 1986; Tafangenyasha 1997, 2001; Wild1955; Zisadza-Gandiwa et al. 2013), but these focused only on certain areas or species. Only one study produced a comprehensive vegetation map with a description of 15 vegetation types (Sherry 1970), but was largely based on work carried out in 1959-1960 in connection with tsetse fly control operations (Farrell 1968). The aim of this paper is to provide an updated and comprehensive woody vegetation survey of the GNP, to analyse the relationships between vegetation types and environmental factors and to produce a map of potential natural vegetation. An evaluation of the main threats to the vegetation types was also conducted. Such a study is a fundamental requirement in order to develop appropriate conservation and management measures and to monitor landscape changes in the future within the framework of the GLTFCA.
Study area
The climate of the GNP can be regarded as semi-arid (Gandiwa et al. 2011b). Mean annual rainfall was 499 mm over the period from 1970 to 2009 (Gandiwa et al. 2016). The bulk of the rain falls between November and March, with May - September being the driest months. Annual rainfall is highly variable. Droughts are relatively common with occasional severe occurrences, while parts of the Park are prone to flooding, particularly around the Save-Runde junction. Temperatures are relatively high, with daily temperatures exceeding 30 °C occurring in all months of the year.
Elevation ranges from 160 m a.s.l. at the Save-Runde junction to a maximum of 578 m a.s.l. on the Chiwonja hills. Morphologically, the GNP forms part of the Limpopo-Save Lowlands of Zimbabwe. These extend across the southernmost part of the country between the Shashe and the Save Rivers, in the form of a relatively flat plain that rises gently to the north from the Limpopo River, and form part of the Pliocene erosion cycle (Lister 1987). Within the Park, there are minor localised exposures of the earlier Post-African surface on the highest parts of the Chiwonja Hills, and the more recent quaternary surface along the major wide sand-bed drainages of the lower reaches of the Mwenezi, Runde and Save Rivers. Geologically, the GNP forms part of a down-faulted basin that has subsequently been filled by various igneous intrusions and sedimentary deposits. The central and major part of the Park is covered by cretaceous sedimentary deposits, known locally as the Malvernia Beds, comprising a succession of gently dipping red and white sandstones, grits and conglomerates, variably cemented by calcite. Portions of the Park to both the north and south are underlain by deep basalt beds, intruded in places by more recent intermediate acid rocks. Small areas of more recent quaternary alluvial deposits are found in association with the major drainages.
Given the relatively young geology and prevailing semi-arid climatic conditions, the soils tend to be relatively shallow and unleached and with appreciable reserves of weatherable materials such that they are inherently fertile (Nyamapfene 1991; Thompson & Purves 1978).
Methods
Vegetation data set
We classified the vegetation of GNP through the analysis of woody species composition. Woody plants represent one of the most distinguishing features of the vegetation in southern Africa (Germishuizen & Meyer 2003; O'Brien, Field & Whittaker 2000), and have been widely used for modelling vegetation structure and physiognomy in the region and elsewhere (Daru et al. 2015; Kubota et al. 2014; O'Brien 1993).
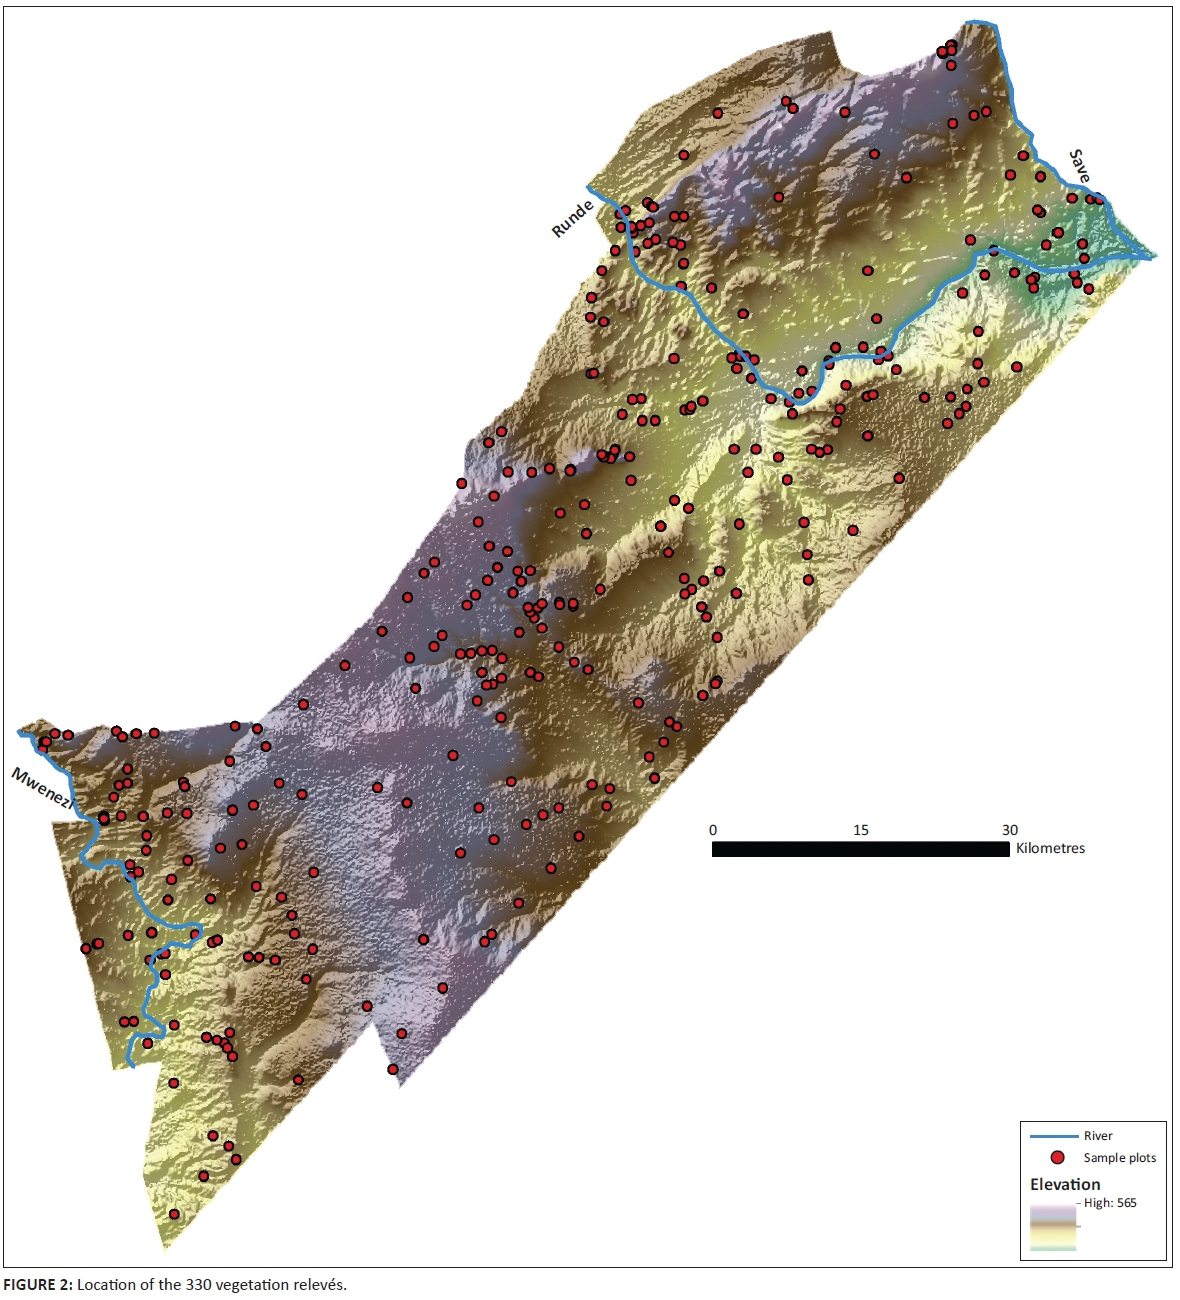
A total of 330 relevés were conducted between March and July 2010 (Figure 2), following the methodology of Timberlake, Nobanda and Mapaure (1993). Sampling was targeted to distinct vegetation communities that were clearly recognisable on satellite imagery (Landsat and Google Earth) and/or in the field. A plotless method was used for each relevé, whereby all woody species present within an area of 0.5 ha - 2 ha were recorded and classified in five height classes: seedlings, less than 0.5 m (mainly regeneration), 0.5 m - 3 m (shrubs and young trees), trees taller than 3 m (tall shrubs and trees); and mature trees (canopy height trees). Each species was allocated to a cover-abundance value in each layer using a six-point modified Braun-Blanquet scale: + = < 2%, 1 = 2% - 10%, 2 = 11% - 25%, 3 = 26% - 50%, 4 = 51% - 75% and 5 = 76% - 100%. Any species that could not be reliably identified in the field was collected and later compared with the collection available at the National Herbarium in Harare.
Environmental parameters considered relevant to the interpretation of plant distribution were also recorded. These included landscape type, lithology, soil type, slope, aspect, presence of termitaria, proportion of bare ground and litter cover, presence of surface capping, gulley and sheet erosion.
A database was created in TURBOVEG (Hennekens & Schaminee 2001). The cover values in different layers for each species were subsequently combined, in order to obtain a single value of cover per species per relevé. Calculations were performed under the assumption of random species distribution within a plot.
Environmental data set
A Digital Elevation Model (DEM) with a spatial resolution of 90 m, representing the geographic area of interest, was downloaded from the data set of the CGIAR Consortium for Spatial Information (www.cgiar-csi.org). The DEM cell size was re-scaled to a resolution of 100 m. Eighteen bioclimatic variables were downloaded from WorldClim (www.worldclim.org) at a spatial resolution of 1 km, and subsequently downscaled to a resolution of 100 m according to the methodology of Zimmermann et al. (2007). A linear regression presenting altitude as the response variable and the bioclimatic variables as explanatory covariates was performed in STATISTICA (version 8, StatSoft Inc., Tulsa), after testing for the normality of the covariates using the Kolmogorov-Smirnov test. In case normality was rejected, an appropriate Box-Cox transformation was used. The intercept and angular coefficient values of each bioclimatic variable were then used in ArcGIS (version 10.1, Esri Inc., Redlands, California) to produce bioclimatic raster maps at a spatial resolution of 100 m. Four additional topographic variables were calculated: slope, curvature, aspect and incoming solar radiation.
Data analyses
Two classifications were carried out: a traditional one based on the percentage cover for each species summed across all layers and one based on the individual cover values of each species in each layer, which can be considered similar to the Integrated Synusial approach developed in Switzerland and France (Gillet & Gallandat 1996), where the classification scheme is built based on the classifications of separate vegetation layers.
In order to identify the optimal number of vegetation types for the 330 relevés, a dissimilarity matrix was created using the Kulczynsky distance method (Faith, Minchin & Belbin 1987) to calculate dissimilarities between them. For each matrix, classifications based on 2, 3, 4, and continuing up to 15 types were calculated. The clustering technique used was Partitioning Around Medoids. For each of these classifications, the Gap statistic was obtained, and the optimal number of types was set as the minimum number of types no lower than one standard error of the maximum Gap statistic observed (Tibshirani, Walther & Hastie 2001). The modified Rand Index was used in order to quantify the similarity between the two selected classifications. All statistical analyses were performed in R (www.r-project.org).
For the two classifications, for each type, diagnostic, constant and dominant species were identified in JUICE (Tichy 2002) according to the following selection criteria:
• Constant species: frequency threshold of 50%.
• Dominant species: cover threshold of 25%.
• Diagnostic species: fidelity threshold of 15 (phi coefficient; Chytrý et al. 2002).
For the identification of diagnostic species, in order to remove dependence from the size of the vegetation types, a standardisation was first performed. The Fisher's exact test was calculated, and a zero fidelity value was given to species with significance p > 0.001.
After selection of the best classification, and after verifying the normality of the environmental data, a supervised classification was performed using the observed data (i.e. the classified relevés) as a training set and the bioclimatic and topographic variables as covariates in order to produce a map of the potential natural vegetation. This procedure has its theoretical background in predictive vegetation modelling, which has been defined as 'predicting the distribution of vegetation across the landscape based on the relationship between the spatial distribution of vegetation and environmental variables' (Franklin 1995). Based on this assumption, several methods have been used to model the spatial distribution of vegetation types (Attorre et al. 2014; Brzeziecki, Kienast & Wildi 1993; Maggini et al. 2006). In our study, Random Forests (RF) (Breiman 2001) was used as the classifying method, and the probability of each background cell being assigned to one of the types was estimated using their climatic and topographic data. RF was chosen because of its widely recognised efficacy in such vegetation studies (Attorre et al. 2011; Bradter et al. 2011; Mellor et al. 2013; Rodriguez-Valiano et al. 2012).
The optimal type for each cell was decided through a Maximum A-Posteriori criterion. To confirm the validity of the spatialisation procedure, we used two methods: Cramer's V index was calculated by comparing the percentage of relevés for each vegetation type expressed as a percentage of the total number of relevés with the percentage of background cells attributed to each vegetation type. Cramer's V index is a measure of association for cross-classification tables. Additionally, we computed the out-of-bag classification error, which is an unbiased measure of misclassification directly obtained as a by-product of RF estimation. The out-of-bag-classification error is based on repeatedly sampling subsets of the available data for estimation; the data not sampled are then used as a test set for evaluating the misclassification probability.
A non-metric multidimensional scaling (NMDS) was performed in R in order to investigate the relationship between the resulting vegetation types and the environmental variables (bioclimatic, topographic and geological features).
Results
Woody species
A total of 333 woody species were identified. This included three new records for Zimbabwe (Commiphora schlechteri, Croton steenkampianus andPutterlickia verrucosa) and 12 new records for southern Zimbabwe. Fifteen of the recorded species, within Zimbabwe, are confined to the south of the country, with nine of them being recorded only from the GNP. Twenty four of the recorded species are classified as red data species within Zimbabwe, including four species classified as critically endangered (Commiphora neglecta, Periploca nigrescens, Rinorea elliptica and Schotia capitata), two endangered species (Adenium multiflorum and Milicia excelsa) and five vulnerable species (Acacia exuvialis, Adenia fruticosa subsp. simplicifolia, Manilkara concolor, Pachypodium saundersii and Suregada zanzibariensis). Thirteen alien species were recorded comprising four woody species (Lantana camara, Senna occidentalis, Senna septemtrionalis and Withania somnifera) and nine herbaceous species (Acanthospermum hispidum, Alternanthera pungens, Corchorus trilocularis, Datura stramonium, Euphorbia heterophylla, Ocimum americanum var. americanum, Sida cordifolia, Sorghum halepenseand Xanthium strumarium). One or more exotic species were recorded from 28 out of the 330 samples (8%), with an overall total of 31 observations.
Vegetation classification
For both classifications, based on separate or merged cover values, the results of the Gap statistic indicated that 14 was the optimum number of vegetation types. In both cases, the resulting 14 vegetation types were allocated to three major groups corresponding to biogeographical regions: mopane, miombo and azonal alluvial woodlands. While the differences in classification were relatively minor, as confirmed by the relatively high value obtained for the modified Rand Index (58%), through comparing diagnostic, constant and dominant species, and in conjunction with expert knowledge, the classification using 'separate layers' was considered more effective and representative than the 'merged layers' classification. For instance, in the former classification, only one type was considered intermediate or ecotonal between mopane and miombo woodlands (Type 12), while for the latter classification two types were ecotonal between mopane and miombo woodlands: one comprised a rather fuzzy type of Spirostachys africana woodland and the other had similarities with the surrounding Combretaceae mixed woodlands.
Three major groups were identified consisting of miombo vegetation (covering approximately 46.97% of the GNP), mopane vegetation (38.19%) and alluvial woodlands (6.67%). Approximately 8.18% of the relevés (Type 12) could not be unequivocally assigned to any of these three main groups and have been classified as 'intermediate'.
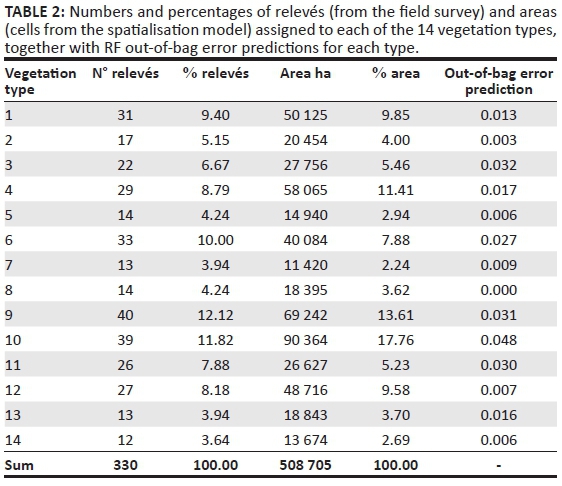
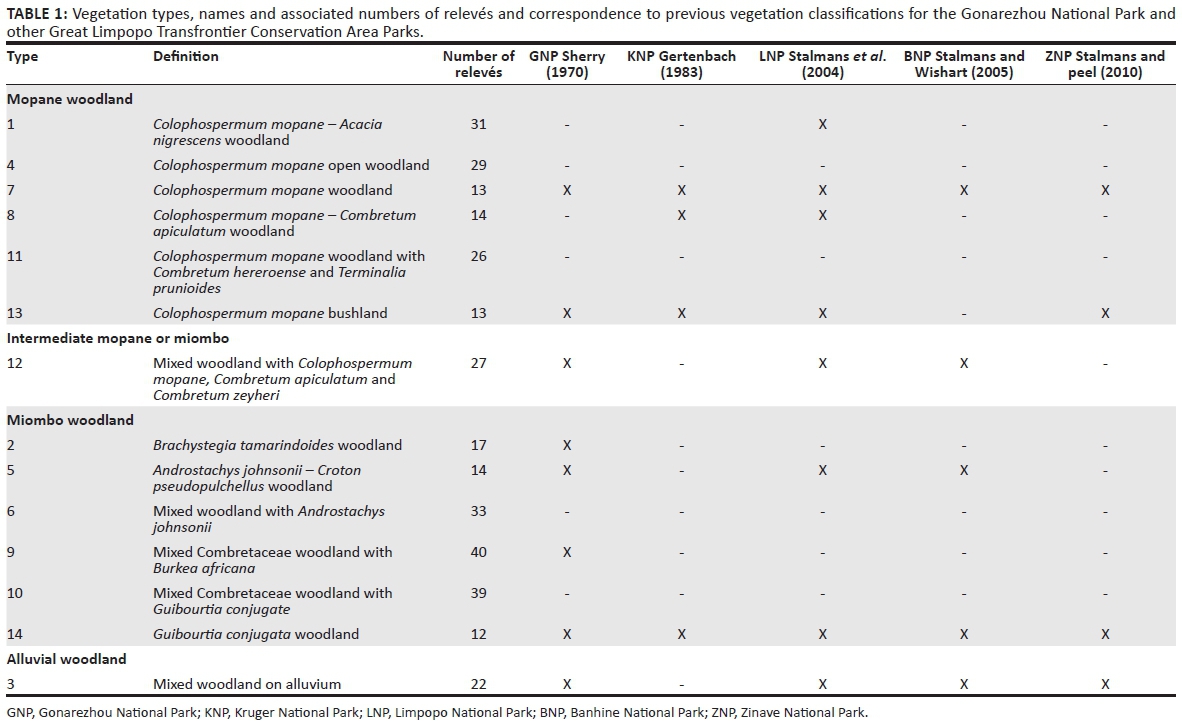
The vegetation types identified through the 'separate layers' classification, together with the number of relevés for each type, are shown in Table 1. Although there was considerable variation in the number of relevés per type (range = 12-40, Table 1), none of the vegetation types were represented by either a very small or excessively large proportion of relevés (range = 3.6% - 12.1%, Table 2). Descriptions of the 14 vegetation types based on their dominant, constant and diagnostic species, and a synoptic table with the frequencies of all woody species in each of the 14 types, are presented in Online Appendixes 1 and 2, respectively.
In the miombo woodlands group (Types 2, 5, 6, 9, 10 and 14), dominant species included Brachystegia tamarindoides subsp. torrei, Combretum celastroides subsp. celastroides, Combretum collinum subsp. collinum, Guibourtia conjugata, Julbernardia globiflora, Millettia usaramensis subsp.australis, Pteleopsis myrtifolia and Terminalia sericea. Constant species included Xeroderris stuhlmannii (five types), Cassia abbreviata subsp. beareana, Combretum apiculatum, Hugonia orientalis and Strychnos madagascariensis (each four types), and Combretum collinum subsp. collinum, Guibourtia conjugata, Monodora junodii v. junodii, Pteleopsis myrtifolia and Senna petersiana (each three types).
The dominant species in the mopane woodlands group (Types 1, 4, 7, 8, 11 and 13) were Colophospermum mopane and Combretum apiculatum, followed by Acacia exuvialis, Combretum zeyheri and Mimusops zeyheri. Colophospermum mopane and Combretum apiculatum were constant throughout all seven mopane types.
Type 12 was somewhat intermediary in nature: Combretum zeyheri achieved dominance in 4% of the samples, and the presence of Colophospermum mopane and Combretum apiculatum was 70% and 67%, respectively, which was generally lower than for the other mopane types. While the group included a number of typical mopane constant species (Cassia abbreviata subsp. beareana, Cissus cornifolia, etc.), it also shared a number of constant species that were characteristic of the miombo woodlands (Strychnos madagascariensis and Xeroderris stuhlmannii, etc.).
The alluvial woodlands were quite distinctive. The only dominant species was Cordyla africana, but there were a high number of constant species: Acacia tortilis subsp. heteracantha, Berchemia discolor, Boscia mossambicensis, et cetera. Most of these were unique to the alluvial woodlands, other thanCombretum imberbe, Combretum mossambicense, Diospyros loureiriana subsp. loureiriana, Drypetes mossambicensis, Flueggea virosa subsp. virosa andPhilenoptera violacea, which were shared predominantly with mopane types, but also a few species with the miombo types (Combretum mossambicenseand Drypetes mossambicensis).
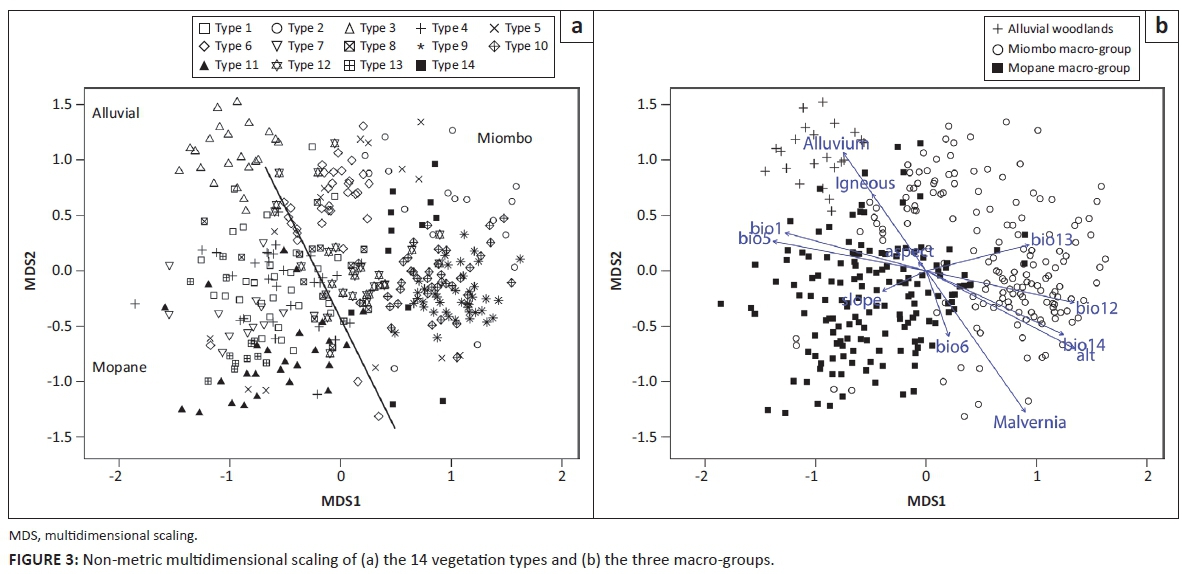
The results of the NMDS are shown in Figure 3a for the 14 vegetation types and Figure 3b for the three macro-groups. The correlation between the climatic gradient and the mopane and miombo macro-groups is evident (Figure 3b). The mopane macro-group is centred on the left of the graphic; these plots were generally located in 'warmer, more arid and steeper' areas, while the miombo macro-group is centred on the right of the graphic representing 'cooler, moister, and higher altitude' locations. Geology does not appear to be important for the segregation of vegetation types, except for the alluvial group.
The segregation between the 14 vegetation types is less clear (Figure 3a). Vegetation types are more readily identifiable within the miombo macro-group (e.g. Types 2, 6, 9, 10 and 14). Within the mopane macro-group it is difficult to identify single vegetation types except for Types 11 and 13. Of note is the intermediate position of Type 12 which is located at the centre of the diagram.
Vegetation mapping
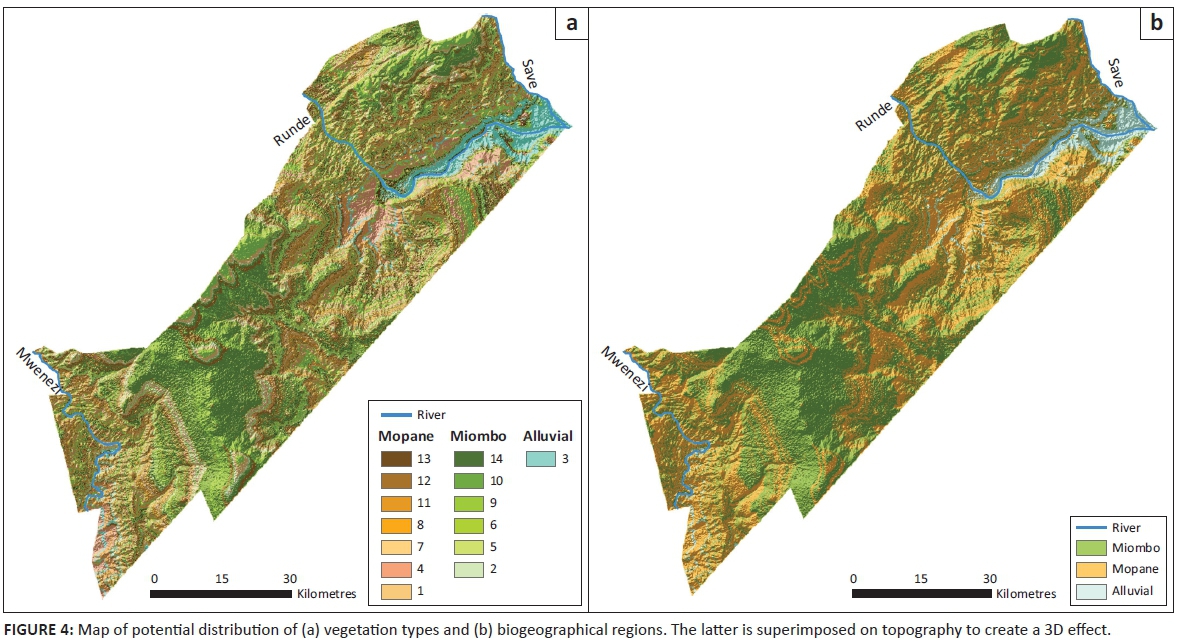
Potential natural vegetation maps for the 14 types and the three biogeographical regions are presented in Figure 4. The most potentially widespread types are Types 9 and 10 of the miombo region, comprising mixed Combretaceae woodland, respectively, with Burkea africana (Type 9) or Guiburtia conjugata(Type 10), generally found on sand-loam soils on flat upland areas (Figure 4a). Type 3 mixed woodland on alluvium is mainly localised on the clay-loam soils along the Runde River. The mopane types are mainly restricted to the intervening lowlands, where they occur interspersed with one another (Figure 4b).
Assessment procedures highlighted the reliability of the map. In particular, Cramer's index is very low (< 0.007), confirming a very small (and not significant) difference between the proportion of relevés assigned to each vegetation type based on species composition and that of cells classified in the same type based on the RF model (Table 2). This result is confirmed by the low out-of-bag prediction error values obtained for each type (range = 0.000-0.048, Table 2).
Discussion
Vegetation types
The paper was aimed at providing an updated and comprehensive analysis of the woody vegetation of the GNP, within the framework of the GLTFCA.
From a methodological point of view, we demonstrated that a classification based on layers can be as effective as a traditional one where species abundance measures are merged in one value. We speculate that in averaging some information might be lost; hence, we recommend clustering based on layers measurements, which give a more direct assessment. The analysis of the 330 relevés allowed the identification of 14 vegetation types belonging to three macro-groups: alluvial (one type), mopane (six types) and miombo (six types) woodlands and one intermediate type between the last two (Table 1, Online Appendixes 1 and 2). The first two correspond to well-known biogeographical regions and confirm the findings of Daru et al. (2015) that the GLTFCA belongs to a specific phyloregion 'Zambesian transition zone' at the interface of mopane or miombo. We also confirmed that the mopane and miombo, even though phylogenetically similar, differ in respect to environmental parameters, with mopane vegetation being located in the lower lying, drier and warmer parts of the GNP and miombo types in moister and cooler upland areas (Figures 3b and 4b). Specifically, within the GLTFCA, beside in the GNP, true miombo (Brachystegia or Julbernardia) vegetation has been found only in the ZNP (Stalmans & Peel 2010), which is also located in the northern part of the area, while it is absent to the south (BNP, LNP and KNP).
When comparing the results of our analysis with the only previous comprehensive vegetation classification for the GNP (Sherry 1970), which found 15 vegetation types, we recorded only 8 types in common (Table 1). Among those that did not match well are, for instance, Sherry's Spirostachys africana-Terminalia prunioides woodland that can be generically associated with the mopane macro-group, but not to any one of our types, as Spirostachys africana had significant presence in Types 4 and 12, and Terminalia prunioides in Types 11 and 13 (Online Appendix 2). Moreover, Sherry's Kirkia, Commiphora, Adansonia open woodland occupies an intermediate position; Kirkia acuminata had a significant presence in Type 6 (miombo macro-group),Commiphora mollis was predominantly recorded from relevés classified under the mopane macro-group but was not significant for any type, andAdansonia digitata was significant for both Type 6 and for Type 3 mixed woodland on alluvium. Similarly, for Sherry's Acacia nigrescens-Acacia welwitschii tree savanna, Acacia nigrescens was significant for Type 1 while Acacia welwitschii was not a significant component for any of the 14 types here and was mainly recorded from relevés classified under the miombo macro-group.
Other types of Sherry (1970) are difficult to match with any types from the present study. None of their characteristic species, Combretum fragrans, Terminalia stenostachya, Baphia obovata and Millettia stuhlmannii, were identified as constant, dominant or diagnostic species in any of the 14 vegetation types described here.
These differences could be because of differences in terms of data collection and classification methods. Additionally, they may relate to vegetation changes that have occurred during the past 40 years, for example, as described by Tafangenyasha (1997, 2001), Gandiwa and Kativu (2009) and Gandiwa et al. (2011a, 2011b), who investigated the decline of several tree species in the GNP.
Methodological sampling differences also influenced the comparison between the current GNP classification and those of the other parks of the GLTFCA. However, based on our results, we were able to identify several vegetation types in common.
Colophospermum mopane is the dominant species in three types that differentiate structurally as woodland (Type 7), open woodland (Type 4) and bushland (Type 13). Together with similar vegetation types recognised for the three Mozambican Parks (BNP, ZNP and LNP), they can all be compared to the wide and diversified Cissus cornifolia-Colophospermum mopane community, which was described with a large number of relevés mainly for the KNP in the revision of mopaneveld vegetation by Siebert, Bredenkamp and Siebert. (2003). In the GNP, the structural differences among the three types is hypothesised to be because of the combined effect of environmental factors, with Type 7 mopane woodland found mainly on clay soils and the other two types on various loamy soils, from clay to sandy loams (Online Appendix 1), and the impacts of elephants and fire (Gandiwa & Kativu 2009).
Colophospermum mopane-Acacia nigrescens woodland (Type 1) is mainly found on clay soils and similar communities have been found in the LNP, asColophospermum mopane-Combretum imberbe woodland (Stalmans et al. 2004).
Colophospermum mopane-Combretum apiculatum woodland (Type 8) occupies hills and ridges similarly to the vegetation found on the central-western part of the KNP (Gertenbach 1983) as well as in protected area adjacent to its western boundaries (Peel, Kruger & MacFadyen 2007) and on the rugged veld of the LNP (Stalmans et al. 2004).
The last vegetation type belonging to the mopane group seems not to have any corresponding type in the other GLTFCA parks. Type 11 (Colophospermum mopane woodland with Combretum hereroense and Terminalia prunioides) occupies the drier areas of the Park on shallow soils and the only similar vegetation can be the Terminalia prunioides-Grewia bicolor thicket of the LNP.
Type 12 (mixed woodland with Colophospermum mopane, Combretum apiculatum and Combretum zeyheri) is an intermediate type between mopane and miombo as is indicated by its central position in the NMDS diagram of Figure 3a. In particular, Type 12 shares species from the two macro-groups: Cassia abbreviata subsp. beareana, Cissus cornifolia, Combretum mossambicense, Dichrostachys cinerea subsp. africana, Flueggea virosa subsp. virosa, Maerua parvifolia and Markhamia zanzibarica from the mopane group, and Strychnos madagascariensis, Combretum zeyheri, Lannea schweinfurthii v.stuhlmannii, Pseudolachnostylis maprouneifolia and Xeroderris stuhlmannii from the miombo group. However, considering the significant frequency ofColophospermum mopane, we decided to include this type in the corresponding group when elaborating the potential natural vegetation maps (Figure 4). Similar mixed communities are recorded from the LNP (Stalmans et al. 2004) and the BNP (Stalmans & Wishart 2005).
Mopane vegetation types identified in the GNP are very similar in term of species composition, as can be observed in the NMDS diagram (Figure 3a) where several types are strongly intermixed (Types 1, 4, 7 and 8), and in the map of the potential natural vegetation (Figure 4a), which is characterised by a marked salt-and-pepper effect. In this last case, the use of a soil map, still lacking for the entire GNP, would have increased the predictive capacity of the RF model.
Of the six miombo types identified in the present study, four correspond to types recognised by Sherry (1970), one of which is Brachystegia tamarindoides woodland (Table 1). The continued presence of this type is noteworthy as Brachystegia tamarindoides is one of the tree species considered to be in marked decline, according to Tafangenyasha (1997, 2001) being almost completely eliminated from some parts of the Park.
Other common types with Sherry (1970) include Guibourtia conjugata woodland (Type 1) and dry deciduous sandveld woodland and scrub, which corresponds to Types 9 and10 of the present study (mixed Combretaceae woodland with Burkea africana or Guibourtia conjugata, respectively). The latter two types are the most widespread ones in the GNP, particularly in the central part of the Park on cretaceous sedimentary upland areas (Figure 4a). Guibourtia-characterised vegetation types have also been identified in the other four GLTFCA parks.
Within the miombo group, we also included two vegetation types (Types 5 and 6) characterised by the presence of Androstachys johnsonii. Type 5 is similar to the Androstachys johnsonii-Croton pseudopulchellus woodland that was described by Sherry (1970) and also Van Rooyen, Theron and Grobbelaar (1981) in the northern part of the KNP, and subsequently recognised also for the LNP (Stalmans et al. 2004) and BNP (Stalmans & Wishart2005). In the case of the GNP, the significant presence of miombo associated species such as Brachystegia tamarindoides subsp. torrei, Combretum celastroides subsp. celastroides, Combretum collinum subsp. collinum, Guibourtia conjugata, Hugonia orientalis, Hymenocardia ulmoides, Monodora junodii var. junodii, Pseudolachnostylis maprouneifolia, Pteleopsis myrtifolia, Senna petersiana, Strophanthus kombe, Strychnos madagascariensis, Terminalia sericea, Vitex mombassae and Xeroderris stuhlmannii, allowed its inclusion in this group, together with Type 6, which is very similar, as shown in Figure 3a.
Vegetation on alluvium (Type 3) was principally found along the Runde River in the north and the Mwenezi River in the south (Figure 4a). It occurred in fringing ribbons or pockets along water courses, on alluvial terraces and on flood plains. At the Save-Runde junction, it constitutes one of the largest expanses of this vegetation type in Zimbabwe. Although riparian woodlands occur widely throughout the country and adjacent regions, the portion around the Save-Runde junction comprises one of the largest remaining and relatively intact portions and is already formally recognised as comprising one of 20 Important Bird Areas in Zimbabwe, on the basis of regularly supporting a significant number of range-restricted bird species (Childes & Mundy 1997). Although alluvial vegetation was found in all the GLTFCA parks, the most similar one is that from ZNP along the banks of the Save River, with many species in common (e.g. Cordyla africana, Philenoptera violacea and Trichilia emetica).
Land-use patterns and their influence on the vegetation of the Gonarezhou National Park
Direct human disturbances to the vegetation have resulted through clearing for agriculture and bush clearing for the control of tsetse fly. Prior to declaration as a park, resident communities cultivated scattered fields on alluvial deposits along parts of the lower Runde River and in the vicinity of the Save-Runde junction. More recently, there has been extensive settlement and cultivation within the northern basalt plain in association with the Gulugi drainage (Dunham et al. 2010). Moreover, the bulk of the vegetation throughout the Park is highly degraded. There has been a massive reduction of trees, with upper canopy trees, in particular, having been virtually eliminated or greatly reduced over large areas, as documented in specific studies focused on Brachystegia tamarindoides (Tafangenyasha 1997, 2001), Colophospermum mopane and Combretum apiculatum in the northern part of the Park (Gandiwa & Kativu 2009), and Androstachys johnsonii and Acacia tortilis (Gandiwa et al. 2011a, 2011b). Many of the remaining large trees have serious bark damage and/or have been reduced to the level of the sub-canopy or even the shrub layer, while many of the younger trees are multi-trunked from having been knocked or burned down to ground level, probably repeatedly, and then resprouted. In many stands, relatively high numbers of dead trees were observed. Despite high levels of degradation of vegetation resources, the physical environment has remained relatively intact, with only localised occurrences of sheet and gully erosion, presumably because most of the terrain is virtually flat or gently undulating.
As for the neighbouring KNP (Eckhardt, Van Wilgen & Biggs 2000), the cause of the tree reduction appears to be because of elephants acting in concert with fire (Gandiwa & Kativu 2009; Magadza, Coulson & Tafangenyasha 1993; Tafangenyasha 2001). During the present survey, evidence of elephant damage to woody vegetation and of burning was widespread throughout the Park. Elephant densities have been sustained at relatively high levels since about 1970, although prior to 1992/1993, elephant populations were kept in check largely through culling. Since then, there has been steady growth, to the extent that the total elephant population is now higher than ever recorded, with the overall density approaching two animals per km2, according to results of the most recent aerial survey carried out in September 2009 (Dunham et al. 2010).
All the four woody alien plant species, recorded during the field campaign, occur in the Type 3 mixed woodland on alluvium (Online Appendix 2). This confirms the findings of Foxcroft and Richardson (2003), who for the KNP indicated riverbanks and floodplains as ideal habitats for the establishment of invasive plants, because of disturbances caused by floods and the competitive capacity of alien species being able to germinate and to establish quicker than indigenous species after floods and to produce allelopathic agents to inhibit the growth of other species.
Beside alien species, the principal river systems of the GNP have been seriously impacted through upstream dam construction leading to reduced flow regimes and upstream agricultural activities leading to marked siltation and water pollution in the form of agricultural chemicals.
Conclusion
In order to effectively manage protected areas, it is important to have a comprehensive description of the vegetation at a scale that is relevant to management. Our work was aimed at updating the knowledge on the vegetation of the GNP in the context of the GLTFCA where previous vegetation studies concerning the other parks (Kruger, Limpopo, Banhine and Zinave) have been recently conducted. Moreover, because appropriate management and conservation strategies rely on a better understanding of the functioning of these savanna systems, the predictive method proposed for the elaboration of the natural potential vegetation map of the Park is a useful tool for a better understanding the functioning of these savanna systems. Its application can be further extended to the other GLTFCA parks in order to provide a reference model for the elaboration of appropriate and effective transboundary management and conservation strategies.
Acknowledgements
We gratefully acknowledge the assistance of Anthony Mapaura, Tom Muller and Julius Shimbani and staff of the Zimbabwe Parks and Wildlife Management Authority in collecting the field data, as well as logistical and financial support provided by the Frankfurt Zoological Society. The work has been conducted within the framework of the SECOSUD II project supported by the Italian Development Cooperation.
Competing interests
The authors declare that they have no financial or personal relationships which may have inappropriately influenced them in writing this article.
Authors' contributions
F.A. planned the research; R.C. conducted the field work and built the classification; F.M. performed the ArcGIS and vegetation analyses; F.M. and F.A. led the writing; A.F. and M.d.S. performed the statistical analyses; and G.d'A. performed the analyses for the validation of the spatialisation model. All authors critically revised the manuscript.
References
Attorre, F., Alfò, M., De Sanctis, M., Francesconi, F., Valenti, R., Vitale, M. et al., 2011, 'Evaluating the effects of climate change on tree species abundance and distribution in the Italian peninsula', Applied Vegetation Science 14(2), 242-255. http://dx.doi.org/10.1111/j.1654-109X.2010.01114.x [ Links ]
Attorre, F., Francesconi, F., De Sanctis, M., Alfò, M., Martella, F., Valenti, R. et al., 2014, 'Classifying and mapping potential distribution of forest types using a finite mixture model', Folia Geobotanica 49(3), 313-335. http://dx.doi.org/10.1007/s12224-012-9139-8 [ Links ]
Bradter, U., Thom, T.J., Altringham, J.D., Kunin, W.E. & Benton, T.G., 2011, 'Prediction of National vegetation classification communities in the British uplands using environmental data at multiple spatial scales, aerial images and the classifier Random Forest', Journal of Applied Ecology 48, 1057-1065. http://dx.doi.org/10.1111/j.1365-2664.2011.02010.x [ Links ]
Breiman, L., 2001, 'Random forests', Machine Learning 45, 5-32. http://dx.doi.org/10.1023/A:1010933404324 [ Links ]
Brzeziecki, B., Kienast, F. & Wildi, O., 1993, 'A simulated map of the potential natural forest vegetation of Switzerland', Journal of Vegetation Science 4, 499-508. http://dx.doi.org/10.2307/3236077 [ Links ]
Childes, S.L. & Mundy, P.J., 1997, Important bird areas of Zimbabwe, BirdLife International, Cambridge, United Kingdom. [ Links ]
Chytrý, M., Tichý, L., Holt, J. & Botta-Dukát, Z., 2002, 'Determination of diagnostic species with statistical fidelity measures', Journal of Vegetation Science13, 79-90. http://dx.doi.org/10.1111/j.1654-1103.2002.tb02025.x [ Links ]
Daru, B.H., Van der Bank, M., Maurin, O., Yessoufou, K., Schaefer, H., Slingsby, J.A. et al., 2015, 'A novel phylogenetic regionalization of phytogeographical zones of southern Africa reveals their hidden evolutionary affinities', Journal of Biogeography 43(1), 155-166. http://dx.doi.org/10.1111/jbi.12619 [ Links ]
Dunham, K.M., Van der Westhuizen, E., Van der Westhuizen, H.F. & Gandiwa, E., 2010, Aerial survey of elephants and other large herbivores in Gonarezhou National Park (Zimbabwe), Zinave National Park (Mozambique) and surrounds: 2009. Parks and Wildlife Management Authority, Harare. [ Links ]
Eckhardt, H.C., Van Wilgen, B.W. & Biggs, H.C., 2000, 'Trends in woody vegetation cover in the Kruger National Park, South Africa between 1940 and 1998', African Journal of Ecology 38, 108-115. http://dx.doi.org/10.1046/j.1365-2028.2000.00217.x [ Links ]
Faith, D.P., Minchin, P.R. & Belbin, L., 1987, 'Compositional dissimilarity as a robust measure of ecological distance', Vegetatio 69, 57-68. http://dx.doi.org/10.1007/BF00038687 [ Links ]
Farrell, J.A.K., 1968, 'Preliminary notes on the vegetation of the lower Sabi-Lundi basin, Rhodesia', Kirkia 6, 223-248. [ Links ]
Foxcroft, L.C. & Richardson, D.M., 2003, 'Managing alien plant invasions in the Kruger National Park, South Africa', in L.E. Child, J.H. Brock, G. Brundu, K. Prach, P. Pyšek, P.M. Wade et al. (eds.), Plant invasions: Ecological threats and management solutions, pp. 385-403, Backhuys Publishers, Leiden, The Netherlands. [ Links ]
Franklin, J., 1995, 'Predictive vegetation mapping: Geographic modeling of biospatial patterns in relation to environmental gradients', Progress in Physical Geography 19, 474-499. http://dx.doi.org/10.1177/030913339501900403 [ Links ]
Gandiwa, E., Chikorowondo, G., Zisadza-Gandiwa, P. & Muvengwi, J., 2011a, 'Structure and composition of Androstachys johnsonii woodland across various strata in Gonarezhou National Park, southeast Zimbabwe', Tropical Conservation Science 4(2), 218-229. [ Links ]
Gandiwa, E., Heitkonig, I.M.A., Eilers, P.H.C. & Prins, H.H.T., 2016, 'Rainfall variability and its impact on large mammal populations in a complex of semi-arid African savanna protected areas', Tropical Ecology 57(2), 163-180. [ Links ]
Gandiwa, E. & Kativu, S., 2009, 'Influence of fire frequency on Colophospermum mopane and Combretum apiculatum woodland structure and composition in northern Gonarezhou National Park, Zimbabwe', Koedoe 51(1), 36-41. http://dx.doi.org/10.4102/koedoe.v51i1.685 [ Links ]
Gandiwa, E., Magwati, T., Zisadza, P., Chinuwo, T. & Tafangenyasha, C., 2011b, 'The impact of African elephants on Acacia tortilis woodland in northern Gonarezhou National Park, Zimbabwe', Journal of Arid Environments 75, 809-814. http://dx.doi.org/10.1016/j.jaridenv.2011.04.017 [ Links ]
Gandiwa, E., Tupulu, N., Zisadza-Gandiwa, P. & Muvengwi, J., 2012, 'Structure and composition of woody vegetation around permanent-artificial and ephemeral-natural water points in northern Gonarezhou National Park, Zimbabwe', Tropical Ecology 53, 169-175. [ Links ]
Germishuizen, G. & Meyer, N.L., 2003, Plants of southern Africa: An annotated checklist. Strelitzia 14, National Botanical Institute, Pretoria, South Africa. [ Links ]
Gertenbach, W.P.D., 1983, 'Landscapes of the Kruger National Park', Koedoe 26, 9-121. http://dx.doi.org/10.4102/koedoe.v26i1.591 [ Links ]
Gillet, F. & Gallandat, J.D., 1996, 'Integrated synusial phytosociology: Some notes on a new, multiscalar approach to vegetation analysis', Journal of Vegetation Science 7, 13-18. http://dx.doi.org/10.2307/3236411 [ Links ]
Hennekens, S.M. & Schaminée, J.H.J., 2001, 'TURBOVEG, a comprehensive data base management system for vegetation data', Journal of Vegetation Science 12, 589-591. http://dx.doi.org/10.2307/3237010 [ Links ]
Kubota, Y., Hirao, T., Fujii, S.J., Shiono, T. & Kusumoto, B., 2014, 'Beta diversity of woody plants in the Japanese archipelago: The roles of geo-historical and ecological processes', Journal of Biogeography 41, 1267-1276. http://dx.doi.org/10.1111/jbi.12290 [ Links ]
Lister, L.A., 1987, The Erosion Surfaces of Zimbabwe. Bulletin No. 90, Zimbabwe Geological Survey, Geological Survey Department, Harare. [ Links ]
Magadza, C., Coulson, I. & Tafangenyasha, C., 1993, 'Ecology of Gonarezhou National Park', in B.K. Downie (ed.), Gonarezhou National Park management planning programme, Phase I, March 1993: Background data reports. Department of National Parks and Wild Life Management, Harare. [ Links ]
Maggini, R., Lehmann, A., Zimmermann, N.E. & Guisan, A., 2006, 'Improving generalised regression analysis for the spatial prediction of forest communities', Journal of Biogeography 33, 1729-1749. http://dx.doi.org/10.1111/j.1365-2699.2006.01465.x [ Links ]
Mellor, A., Haywood, A., Stone, C. & Jones, S., 2013, 'The performance of Random Forests in an operational setting for large area sclerophyll forest classification', Remote Sensing 5, 2838-2856. http://dx.doi.org/10.3390/rs5062838 [ Links ]
Nyamapfene, K., 1991, Soils of Zimbabwe, Nehanda Publishers, Harare. [ Links ]
O'Brien, E.M., 1993, 'Climatic gradients in woody plant species richness: Towards an explanation based on an analysis of southern Africa's woody flora',Journal of Biogeography 20, 181-198. http://dx.doi.org/10.2307/2845670 [ Links ]
O'Brien, E.M., Field, R. & Whittaker, R.J., 2000, 'Climatic gradients in woody plant (tree and shrub) diversity: Water energy dynamics, residual variation, and topography', Oikos 89, 588-600. http://dx.doi.org/10.1034/j.1600-0706.2000.890319.x [ Links ]
O'Connor, T.G. & Campbell, B.M., 1986, 'Classification and condition of the vegetation types of the Nyahungwe area on the Lundi River, Gonarezhou National Park, Zimbabwe', South African Journal of Botany 52, 117-123. http://dx.doi.org/10.1016/S0254-6299(16)31575-7 [ Links ]
Peel, M.J.S., Kruger, J.M. & MacFadyen, S., 2007, 'Woody vegetation of a mosaic of protected areas adjacent to the Kruger National Park, South Africa',Journal of Vegetation Science 18, 807-814. http://dx.doi.org/10.1111/j.1654-1103.2007.tb02597.x [ Links ]
Rodriguez-Valiano, V.F., Ghimire, B., Rogan, J., Chica-Olmo, M. & Rigol-Sanchez, J.P., 2012, 'An assessment of the effectiveness of a Random Forest classifier for land-cover classification', ISPRS Journal of Photogrammetry and Remote Sensing 67, 93-104. http://dx.doi.org/10.1016/j.isprsjprs.2011.11.002 [ Links ]
Sherry, B.Y., 1970, Vegetation map of Gonarezhou National Park, Unpublished map, Department of National Parks, Harare. [ Links ]
Siebert, F., Bredenkamp, G.J. & Siebert, S.J., 2003, 'A comparison of mopaneveld vegetation in South Africa, Namibia and Zimbabwe', Bothalia 33, 121-134. http://dx.doi.org/10.4102/abc.v33i1.439 [ Links ]
Stalmans, M., Gertenbach, W.P.D. & Carvalho-Serfontein, F., 2004, 'Plant communities and landscapes of the Parque Nacional do Limpopo, Mocambique',Koedoe 47, 61-81. http://dx.doi.org/10.4102/koedoe.v47i2.83 [ Links ]
Stalmans, M. & Peel, M., 2010, 'Plant communities and landscapes of the Parque Nacional de Zinave, Mozambique', Koedoe 52(1), 1-11. http://dx.doi.org/10.4102/koedoe.v52i1.703 [ Links ]
Stalmans, M. & Wishart, M., 2005, 'Plant communities, wetlands and landscapes of the Parque Nacional de Banhine, Moçambique', Koedoe 48, 43-58. http://dx.doi.org/10.4102/koedoe.v48i2.99 [ Links ]
Tafangenyasha, C., 1997, 'Tree loss in the Gonarezhou National Park (Zimbabwe) between 1970 and 1983', Journal of Environmental Management 49, 355-366. http://dx.doi.org/10.1006/jema.1996.9987 [ Links ]
Tafangenyasha, C., 2001, 'Decline of the mountain acacia, Brachystegia glaucescens in Gonarezhou National Park, southeast Zimbabwe', Journal of Environmental Management 63, 37-50. http://dx.doi.org/10.1006/jema.2001.0458 [ Links ]
Thompson, J.G. & Purves, W.D., 1978, A guide to the soils of Zimbabwe, Zimbabwe Agricultural Journal Technical Handbook No. 3, Government Printer, Harare. [ Links ]
Tibshirani, R., Walther, G. & Hastie, T., 2001, 'Estimating the number of data clusters via the Gap statistic', Journal of the Royal Statistical Society 63, 411-423. http://dx.doi.org/10.1111/1467-9868.00293 [ Links ]
Tichy, L., 2002, 'JUICE, software for vegetation classification', Journal of Vegetation Science 13, 451-453. http://dx.doi.org/10.1111/j.1654-1103.2002.tb02069.x [ Links ]
Timberlake, J., Nobanda, N. & Mapaure, I., 1993, 'Vegetation survey of the communal lands - North and west of Zimbabwe', Kirkia 14, 171-270. [ Links ]
Van Rooyen, N., Theron, G.K. & Grobbelaar, N., 1981, 'A floristic description and structural analysis of the plant communities of the Punda Milia-Pafuri-Wambiya area in the Kruger National Park', Journal of South African Botany 47, 585-626. [ Links ]
Venter, F.J. & Gertenbach, W.P.D., 1986, 'A cursory review on the climate and vegetation of the Kruger National Park', Koedoe 29, 139-148. http://dx.doi.org/10.4102/koedoe.v29i1.526 [ Links ]
Wild, H., 1955, 'Observations on the vegetation of the Sabi-Lundi junction area', Rhodesia Agricultural Journal 52, 533-546. [ Links ]
Zimmermann, N.E., Edwards, T.C., Moisen, G.G., Frescino, T.S. & Blackard, J.A., 2007, 'Remote sensing-based predictors improve distribution models of rare, early successional and broadleaf tree species in Utah', Journal of Applied Ecology 44, 1057-1067. http://dx.doi.org/10.1111/j.1365-2664.2007.01348.x [ Links ]
Zisadza-Gandiwa, P., Parakasingwa, C., Mashapa, C., Muboko, N. & Gandiwa, E., 2013, 'Status of woody vegetation along riparian areas in Gonarezhou National Park, Zimbabwe', Greener Journal of Agricultural Sciences 3, 592-597. [ Links ]
 Correspondence:
Fabio Attorre
fabio.attorre@uniroma1.it
Received: 07 Mar. 2016
Accepted: 06 July 2016
Published: 29 Sept. 2016

