


Servicios Personalizados
Articulo
 Inglés (pdf)
 Articulo en XML
 Referencias del artículo
Indicadores

Links relacionados
-
 Citado por Google
 -
 Similares en Google
Compartir

 Permalink
Koedoe
versión On-line ISSN 2071-0771
versión impresa ISSN 0075-6458
Koedoe vol.58 no.1 Pretoria 2016
http://dx.doi.org/10.4102/koedoe.v58i1.1383
ORIGINAL RESEARCH
An assessment of rehabilitation success in an African grassland using ants as bioindicators
Samantha-Leigh JamisonI; Mark RobertsonII; Ian EngelbrechtIII; Peter HawkesIII, IV
IDepartment of Plant Science, University of Pretoria, South Africa
IICentre for Invasion Biology, Department or Zoology & Entomology, University of Pretoria, South Africa
IIIDepartment of Zoology and Entomology, University of Pretoria, South Africa
IVAfriBugs CC, Pretoria, South Africa
ABSTRACT
Many studies that evaluate rehabilitation make use of invertebrate bioindicators. Invertebrates, especially ants, make useful indicators as they are sensitive to environmental change. We compared ant assemblages in rehabilitated and control sites in the Rietvlei Nature Reserve, a protected area important for grassland conservation in South Africa. Pitfall traps were used to sample ant assemblages at six control sites and six rehabilitated sites. In addition, environmental and vegetation surveys were conducted at each site. We found that the ant assemblages differed significantly between the control and rehabilitated sites, although there was considerable overlap; the control sites supported a greater species density and higher abundance of ants than the rehabilitated sites. In total, 36 ant species were collected (control sites: 34 species; rehabilitated sites: 26 species). The environmental survey revealed that percentages of bare ground and coarse sand, as well as soil pH, differed significantly between the control and rehabilitated sites. The control and rehabilitated sites also supported significantly different plant assemblages. Three indicator ant species were identified for the control sites:Crematogaster rectinota, Crematogaster amita and Monomorium fastidium. No indicator species were identified for the rehabilitated sites. These results suggest that recovery from the previous agricultural use of the area is still incomplete and highlights the lack of research examining the success of rehabilitation in the grassland biome.
CONSERVATION IMPLICATIONS: The present study illustrates the need for further research on rehabilitation techniques utilised in the grassland biome. This is of value as the remainder of South African grasslands are considered critically endangered.
Introduction
Rehabilitation and the need for bioindicators
Increasing human impacts on the environment have resulted in widespread degradation of ecosystems (Hobbs & Norton 1996). As a result, there is a global drive to rehabilitate terrestrial and freshwater environments (Lake 2001). Typically, rehabilitation projects monitor aspects such as vegetation structure, species diversity and richness as well as nutrient cycling (Ruiz-Jaén & Aide 2005; Van Aarde & Smit 1997). A number of rehabilitation studies make use of biological indicators. These indicators provide a means to monitor and assess the state of an ecosystem over time (Cairns, McCormick & Niederlehner 1993; Morellet et al. 2007). However, in order to be practical, these bioindicators need to meet certain criteria. They need to be sensitive enough to provide an early warning in the event of a disturbance, they should have a wide spatial distribution and they must provide a continuous assessment for several disturbance factors (Noss 1990). Such indicators can aid us in understanding the rehabilitation of previously disturbed land and prove valuable for future management projects.
Ants as bioindicators
Invertebrates are potentially valuable indicators for monitoring the success of rehabilitation (Andersen & Sparling 1997). In particular, ants (Hymenoptera: Formicidae) have received much attention as ecological bioindicators. They are widespread, abundant, have a manageable species richness and perform many keystone functions and thus have the potential to be used for the assessment of rehabilitation (Fagan et al. 2010; Van Hamburg et al. 2004). They are important ecosystem engineers that are responsible for turning soil, seed dispersal, forming mutualistic relationships and are among the top predators of other invertebrates (Hölldobler & Wilson 1990; Lach, Parr & Abott 2010). As they are colonial, their response to disturbance may be very different from other invertebrates that are more susceptible to disturbance events (Lach et al. 2010). The removal of individuals, resulting from mortality caused by disturbance, may not lead to the eradication of the colony from the habitat. Thus, the response of ants to disturbance differs from that of other terrestrial plants and animals that may become locally extinct after a disturbance event (Andersen 2000; Lach et al.2010). In response to disturbance, such as agriculture or mining activities, ant communities may show changes in species composition and interspecific interactions, as well as loss of taxonomic diversity and variation in the provision of ecosystem services (Lach et al. 2010).
Ants have been used as bioindicators in several projects involving ecosystem management, land rehabilitation and monitoring the degree of land degradation, as well as investigating the conservation status of various zones of land (Majer 1983). They have been successfully used as bioindicators of mine site rehabilitation in northern Australia (Andersen, Hoffman & Somes 2003) and on rehabilitated ash dams associated with coal-fired power stations around the Highveld of South Africa (Van Hamburg et al. 2004). They have also been used to indicate pesticide contamination in cotton-growing areas in Australia (Weir 1978). Ants thus provide an important indication of the biotic and abiotic state of an ecosystem and ultimately reveal the impacts that various environmental changes can have on an ecosystem (Hodkinson & Jackons 2005).
The importance of grasslands
Grasslands are regions of global importance and provide a series of important ecosystem services. These include the purification of water, flood attenuation and nutrient cycling, as well as carbon sequestration and storage (South African National Biodiversity Institute [SANBI] 2013). The South African grassland biome covers nearly 30% of the country's land surface and is home to a large majority of the country's population and several endangered and endemic species (Neke & Du Plessis 2004; SANBI 2013). Increasing urbanisation and development has resulted in a substantial amount of land degradation in the South African grassland biome, resulting in its classification as critically endangered (Neke & Du Plessis 2004). Despite this, grasslands throughout the country have received little conservation protection (Neke & Du Plessis 2004). Despite the necessity to rehabilitate grasslands following disturbances such as mining or agriculture, there appears to be limited knowledge on grassland rehabilitation (Zaloumis & Bond 2010). As rehabilitation may take many years, there is a need to quantify the extent to which ecosystems (such as grasslands) have been rehabilitated (Legg & Nagy 2006). Bioindicators such as ants can fulfil this purpose. However, to date surprisingly little research has been done in South Africa on ant diversity in grasslands and how ant communities resemble each other following a disturbance.
This study investigated the success of the rehabilitation measures applied in an old agricultural land area on Rietvlei Nature Reserve. We compared ant assemblages in areas where rehabilitation measures were applied and in nearby untransformed, natural grassland areas as an indication of the effectiveness of rehabilitation. We also aimed to identify whether any indicator species were present in the rehabilitating and untransformed (control) sites of the reserve.
Research method and design
Study area
The study took place on the southern region of Rietvlei Nature Reserve (between 25°50'S, 28°15'E and 25°56'S, 28°19'E), a protected area important for grassland conservation in South Africa. The reserve covers an area of approximately 3870 ha. It is situated in close proximity to urban centres. The climate of the area is characterised by warm, wet summers that are followed by cold, dry winters, when frost is prevalent. Summer temperatures may reach highs of 34 °C, which are contrasted by the low winter temperatures that can fall to -2 °C (Marais 2004). The area has a mean annual rainfall of approximately 724 mm (1970-1999; Marais 2004). The plant composition of the reserve is typical of the grassland biome; the vegetation type of the area is described as Rand Highveld Grassland (Mucina & Rutherford 2006).
Around 23 years ago, the reserve extended its southern boundary and incorporated land that was previously used for agriculture. Rehabilitation measures were employed on the land in an attempt to improve species diversity and ecological function. The rehabilitated areas were ploughed and sown with a mix of indigenous grass seeds (R. Marais 2014, pers. comm., Rietvlei Nature Reserve, Pretoria).
Procedure
Ant sampling
Sampling was carried out at 12 sites, 6 located in the rehabilitated area and 6 in untransformed (control) areas of the reserve. All sites were at a minimum distance of 200 m from old land boundaries to avoid edge effects and 300 m from other sampling sites to ensure independent sampling. At each site, 10 plastic pitfall traps (55 mm in diameter and 70 mm deep) were arranged in two rows of five, positioned 10 m apart. The study was designed in such a manner so as to avoid or minimise the possibility of pseudoreplication that may have been introduced by having a single larger array with many traps and treating each array (rather than each trap) as a replicate. The traps were placed in the soil with the rim flush with the soil surface and partially filled with a mixture of water and propylene glycol. This non-toxic solution ensures the successful preservation of the captured specimens. A rain cover (20-cm plastic lid with four wire legs) was placed above each trap to avoid flooding. The traps were left in place for 3 days from 08 to 11 April 2014. The ant specimens found in each trap were removed and identified to species level where possible and their abundances recorded. Ants were identified to genus using Bolton (1994) and then to species where possible, using the most recent available keys to the genera concerned: for Agraulomyrmex, Prins (1983); Anoplolepis, Prins (1982); Crematogaster, Arnold (1920); Lepisiota, Arnold (1920); Leptogenys, Bolton (1975); Meranoplus, Bolton (1981);Monomorium, Bolton (1987); Technomyrmex, Bolton (2007) and Tetramorium, Bolton (1980). For some genera, such as Camponotus, Carebara, Dorylus,Pheidole, Plagiolepis and Solenopsis, no keys are presently available for the Afrotropical fauna; for these genera, as well as for species in other genera that could not be identified using the available keys, specimens were identified by comparison with reference material in the AfriBugs collection (AFRC). Where no formal name could be assigned, a morphospecies code matched to voucher material in the AFRC collection was applied. These codes are globally unique and images of most are available on AntWeb (http://www.antweb.org) to allow cross-referencing between studies. All identifications were performed by S.L. Jamison under the guidance of P.G. Hawkes. A specimen of each of the species identified was mounted and labelled to produce a reference collection, which is housed at the Department of Zoology & Entomology, University of Pretoria.
Environmental factors
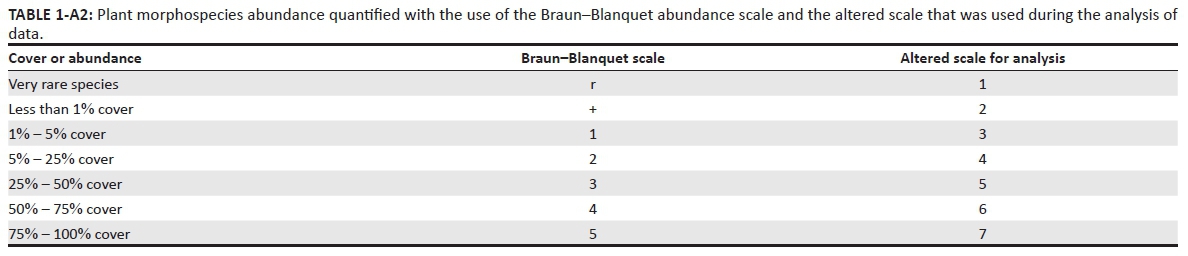
Estimates of the percentage bare ground, rock, grass, shrub cover and height of the tallest plant were recorded in five 1-m2 quadrats at each site. These quadrats were randomly selected from the immediate area around each of the sites. The quadrats were placed within a 10-m perimeter around the pitfall traps in order to establish the best estimate of environmental factors within each of the respective sites. The Braun-Blanquet cover-abundance scale was used to quantify the cover of all plant species in three 1-m2 quadrats at each site. A disk pasture meter was used to obtain measures of above-ground vegetation biomass. A total of 20 disk pasture meter height measurements were recorded at random at each site. We refer to these height measurements as a biomass index from here onwards.
A soil auger was used to collect a soil sample from the first 20 cm of soil at each of the sites. Soil was randomly sampled within a 10-m perimeter around the pitfall traps. Three soil samples were randomly taken from each of the 12 sites. The three soil samples collected at each site were then combined and used as one sample to get an indication of the average soil conditions at each site. The percentage coarse sand, sand, silt and clay content of the soil as well as the soil pH and soil organic matter were determined using standard methods (Appendix 1). All soil analyses were conducted at the University of Pretoria in the Soil Sciences Department.
Analysis
Species diversity indices for the ant data were generated using PRIMER 5.2.0 software package (Clarke & Warwick 2001). The indices included the Pielou (Pielou 1969) and Shannon-Weiner diversity indices (Shannon 2001). These diversity indices were compared between the rehabilitated and control sites with Welch two-sample t-tests (Welch 1947). Furthermore, Welch two-sample t-tests were used to test for significant differences between the number of ant species and the number of individuals found between rehabilitated and control sites.
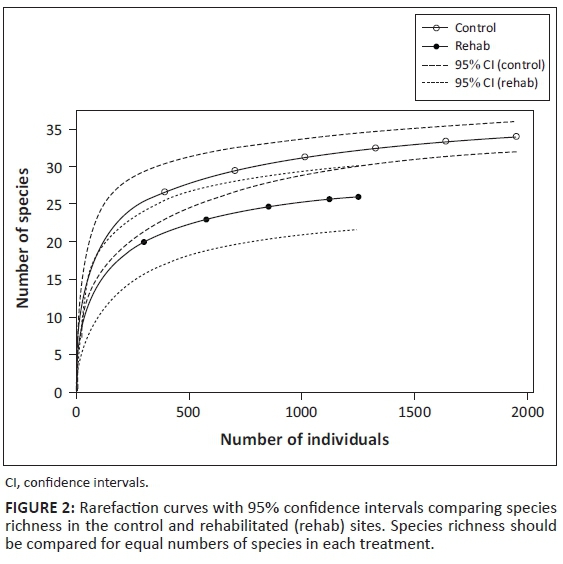
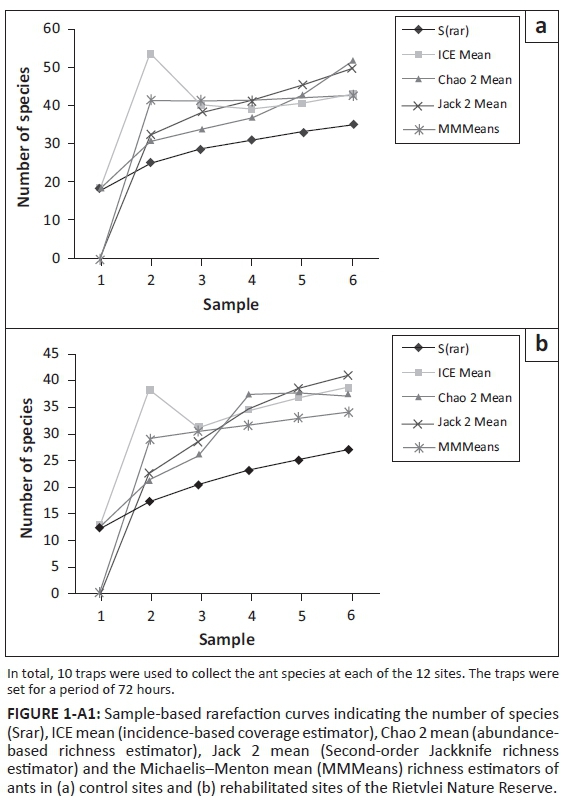
Species richness in the two sites was compared using rarefaction curves with 95% confidence intervals derived from unconditional variance estimates (Colwell et al. 2012). Richness estimators were generated using Estimate-S (v 9.1.0; Colwell 2013). We used three non-parametric species richness estimators and one parametric estimator in our analysis to correct for sampling bias. The non-parametric estimators were the incidence-based coverage estimator (ICE), the Chao 2 abundance-based richness estimator (Chao 2) and the Second-order Jackknife richness estimator (Jack 2). We used the Michaelis-Menton mean (MMMean) as the parametric estimator. We chose this suite of estimators as estimator performance varies depending on a range of factors, and no single estimator is universally accepted as superior to others (Smith & Jones 2005). Sampling was considered adequate if the sample-based rarefaction curves and the curves of the species richness estimators converged closely at the highest observed values (Cardoso 2009; Cardoso et al. 2009; Longino, Coddington & Colwell 2002; Magurran 2004). Observed richness as a percentage of estimated richness was used as a measure of inventory completeness (Jiménez-Valverde et al. 2010). The mean sampling completeness was calculated for the control and rehabilitated sites by averaging the completeness calculated for each of the different species richness estimators. Species richness was compared between the rehabilitated and control sites by plotting rarefaction curves with their 95% confidence intervals. If the intervals overlapped, the differences between the treatments were taken to be not significant (Colwell et al. 2012).
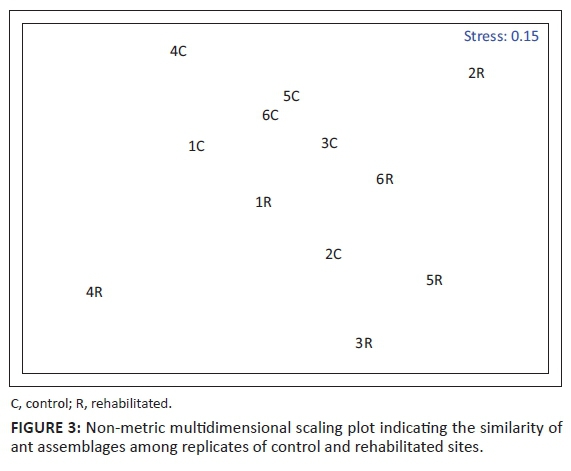
An analysis of similarity (ANOSIM) and non-metric multidimensional scaling (nMDS) were performed to compare the ant assemblages in the rehabilitated and control areas. The similarity matrix was calculated using a Bray-Curtis similarity measure and a fourth-root transformation in PRIMER 5.2.0 (Clarke & Warwick 2001). The fourth-root transformation reduces the contribution of very abundant species (French & Major 2001). ANOSIM generates a Global Rstatistic that provides an indication of average dissimilarity between the assemblages being compared. Values closer to 1 indicate distinct differences, while values closer to 0 indicate high levels of similarity in species composition. To assess the contribution of different species to the differences between the rehabilitated and control sites, the similarity percentages for species contributions were applied to the data (SIMPER, PRIMER 5.2.0). A fourth-root transformation was again used to reduce the influence of dominant species.
Characteristic ant species (indicator species) were identified for each of the sites with the use of the Indicator Values Method (Dufrêne & Legendre 1997) in the package labdsv (Roberts 2014), run in R 3.1.1 (R Development Core Team 2011). An analysis of the relative indicator values (IndVal) was performed to determine the specificity (uniqueness to specific sites) and fidelity (rate of recurrence within each site) of each species for a particular site and treatment (e.g. rehabilitating or control). Species that were found to have a value greater than 70%, that is, species that occur predominantly in a particular habitat and occur frequently in that habitat were considered as reliable indicator species for the different sampling units. Rank abundance curves were also generated and allowed comparison of species composition between control and rehabilitated sites.
The values for percentage of bare ground, rock, grass, shrub and height of tallest plant were compared between control and rehabilitated sites using Welch's two-sample t-tests, which were also used to compare the percentages of coarse sand, sand, silt and clay, as well as soil pH and soil organic matter.
ANOSIM and nMDS were performed to compare the plant assemblages in the rehabilitated and control sites. The similarity matrix was calculated using a Bray-Curtis similarity measure and a fourth-root transformation in PRIMER 5.2.0 (Clarke & Warwick 2001). The Braun-Blanquet scale was rescaled to range from 1 to 7 for the purpose of the ANOSIM and nMDS (Table 1-A2).
Results
Ants
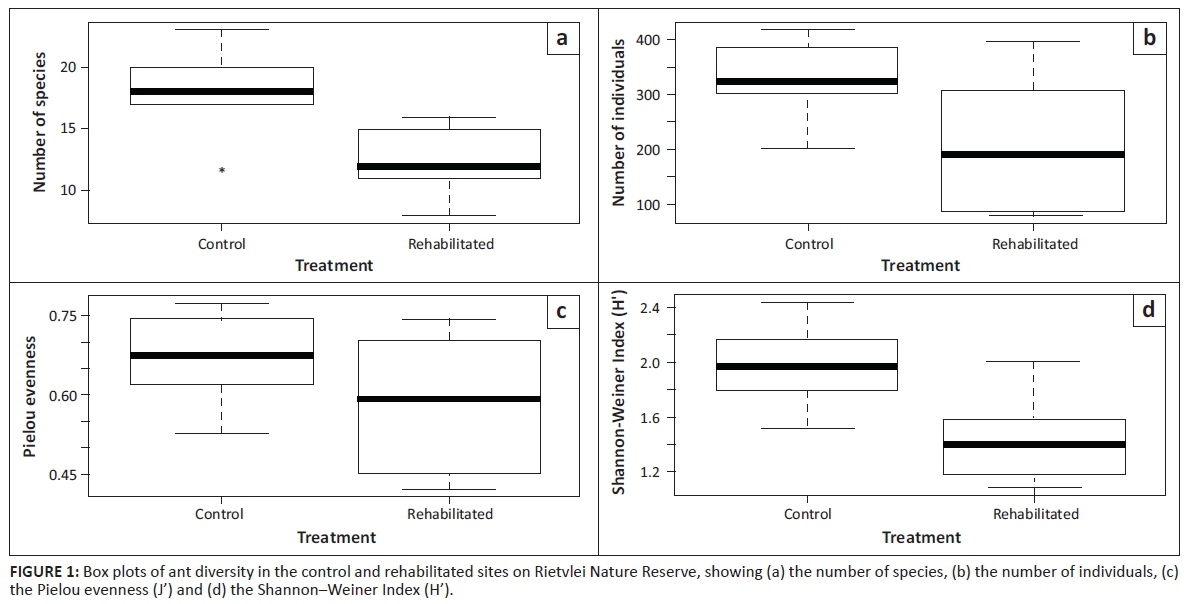
In total, 3206 individuals representing 36 species were collected during the study (Table 1-A3). The control sites had a significantly higher species density (t = 6.618, p < 0.001) and abundance (t = 4.674, p < 0.001) than the rehabilitated sites (Figure 1). Additionally, the control sites had a significantly higher Pielou evenness index (t = 3.125, p < 0.05) and Shannon-Weiner index (t = 6.789, p < 0.001) than the rehabilitated sites (Figure 1). In total, 34 ant species were collected from the control sites, whereas only 26 species were collected from the rehabilitated sites. Of the 36 species collected in this study, 24 species (66.7%) were present in both the control and rehabilitated sites. In total, 10 species (27.8%) were unique to the control sites, whereas only 2 species (5.6%) were unique to the rehabilitated sites (Table 1-A3).
The estimated species richness (Sest) for the ant samples collected from the control and rehabilitated sites did not converge closely with the richness estimators (Figure 1-A1). The mean sampling completeness for the rehabilitated sites was found to be 65.70%, whereas the average sampling completeness for the control sites was 70.31% (from Table 1-A4 to Table 5-A4). However, as it is unlikely that we will ever reach an asymptotic endpoint, particularly for ants and other invertebrates (Gotelli et al. 2014), this level of sampling completeness is likely sufficient to draw conclusions about grassland rehabilitation. The confidence intervals on the rarefaction curves for the rehabilitated and control sites overlapped, indicating that there were no significant differences in species richness (Figure 2).
ANOSIM indicated that ant assemblages differed significantly between the treatments (Global R = 0.507, p = 0.002). The nMDS plot revealed that there was some separation between the control and rehabilitated sites, although some overlap is still evident (Figure 3). The replicates representing the control sites (C) are clustered together at the top of the plot indicating smaller assemblage differences between these replicates than for the rehabilitated sites. The replicates representing four of the rehabilitated sites (1R, 3R, 5R and 6R) are clustered together in the lower right quadrant of the plot. They are clustered less tightly than the control sites at the top of the plot. This indicates fairly large assemblage differences between the replicates within the rehabilitated sites compared with those of the control sites. In particular, sites 1R and 6R are plotted in close proximity to the control sites indicating that the ant assemblages at these rehabilitated sites are similar to those of the control sites. Sites 2R and 4R are isolated from the clusters on either side of the plot indicating that the ant assemblages found at these sites are different from those found at the other sites of both treatment types. It is interesting that 2C is located near the rehabilitated sites within the nMDS plot. The potential impact of human-mediated activities could have influenced the habitat at this site. However, we have no information regarding the use of the area before the establishment of the reserve and cannot give a fully informed explanation.
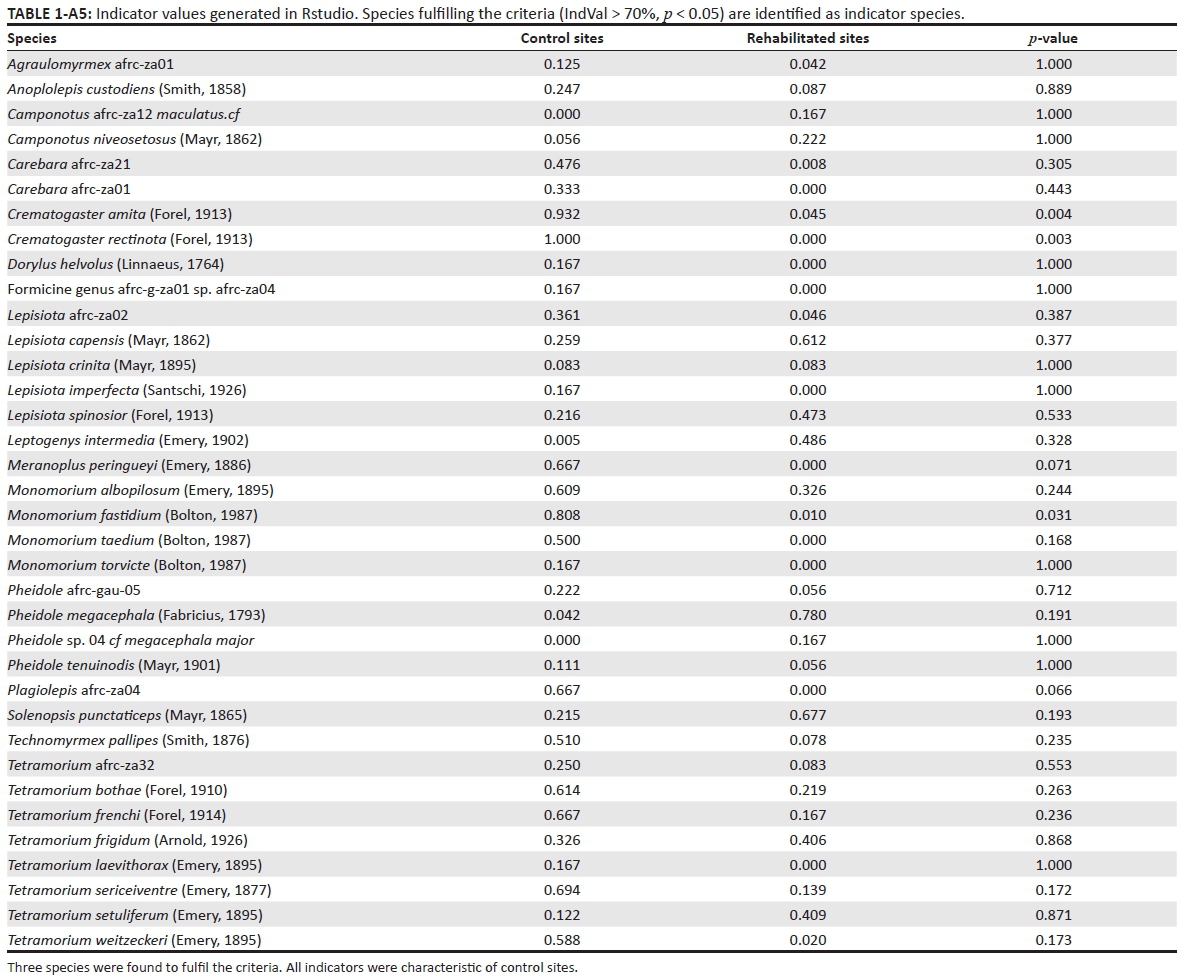
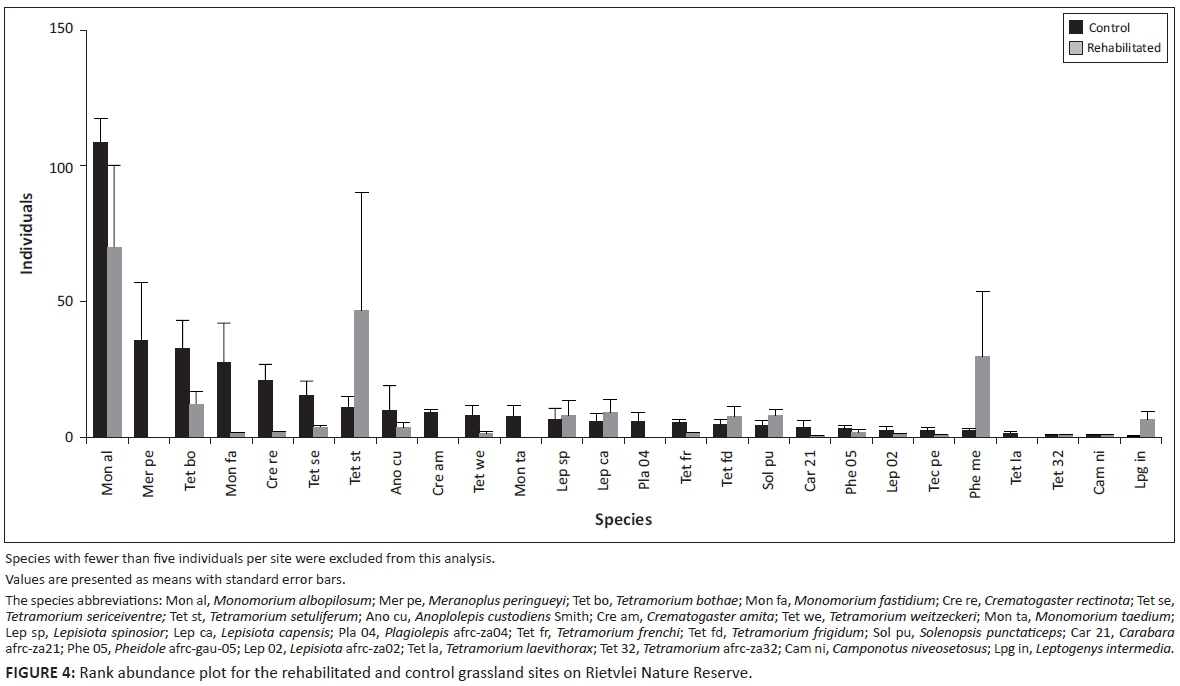
The assemblage differences are further supported by the rank abundance curves observed for the different treatments (Figure 4). These rank abundance curves show only species that were represented by more than five individuals. The three most abundant species found in the control sites wereMonomorium albopilosum Emery (641 individuals), Meranoplus peringueyi Emery (209 individuals) and Tetramorium bothae Forel (193 individuals). In comparison, the three most abundant species found in the rehabilitated sites included M. albopilosum (411 individuals), Tetramorium setuliferum Emery (278 individuals) and Pheidole megacephala Fabricius (177 individuals). Although many of the highly abundant species were present in both the rehabilitated and control sites, the control sites had more unique species than the rehabilitated sites (control: 10 unique species, rehabilitated: 2 unique species; Table 1-A3). The criteria needed to identify indicator species (IndVal > 70%) were fulfilled for three species present in the control sites (Table 1-A5). These species include Crematogaster rectinota Forel (IndVal = 0.932, p = 0.004), Crematogaster amita Forel (IndVal = 1, p = 0.003) andMonomorium fastidium Bolton (IndVal = 0.808, p = 0.031). No indicator species were identified for the rehabilitated sites. The results from the rank abundance curves are further supported by the SIMPER results, which found C. amita to have the greatest contribution to the separation of the control and rehabilitated sites (6.31% of total abundance; 51 individuals in total for the control sites), followed by M. peringueyi (5.67%; 209 individuals in control sites) and lastly M. fastidium (5.53%; 167 individuals across control and rehabilitated sites). Although M. albopilosum had a total of 1052 individuals for both the control and rehabilitated sites, the overall contribution of this species to the separation of sites was only 4.27%. The contribution of the other species was greater because of the difference in average abundance of the species between the sites. The mean abundance of M. albopilosum was 106.83 in the control sites and 68.50 in the rehabilitated sites.
Environmental variables
The mean percentage of bare ground was significantly higher in the rehabilitated than the control sites (t = -3.193, p = 0.003; Figure 1-A2). There were no significant differences in the percentage cover of grass, rock, height of tallest plant and biomass index between the rehabilitated and control sites. The pH of the soil (t = -2.754, p = 0.021) and the percentage coarse sand (t = 2.275, p = 0.0495) differed significantly between the rehabilitated and control sites (Figure 1-A3). However, the t-tests revealed that there was no significant difference in soil organic matter and percentage of sand, silt and clay content between the rehabilitated and control sites.
Vegetation assemblages
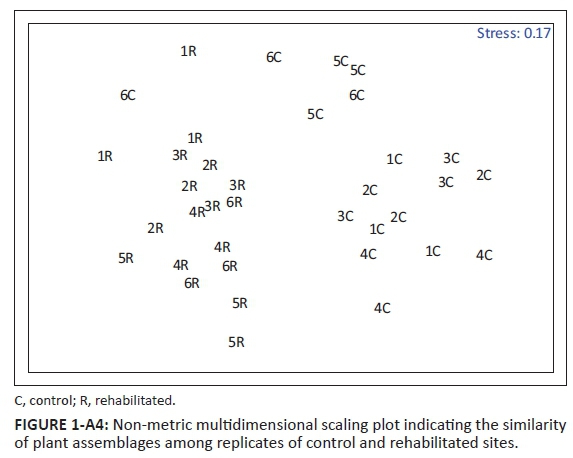
ANOSIM indicated that the plant assemblages differed significantly between the treatments (Global R = 0.712, p = 0.001). The Global R statistic indicates fairly large assemblage differences between the control and rehabilitated sites. The nMDS plot illustrates that there is a clear distinction between the control and rehabilitated sites (Figure 1-A4). There is a larger amount of variation in the plant communities between the various control sites than there is between the rehabilitated sites. It can be seen that the plant community of the control and rehabilitated sites is still very different, 23 years after rehabilitation.
Discussion
This study found that the control sites on the Rietvlei Nature Reserve had significantly higher ant species density and abundance than the rehabilitated sites. In total, 34 ant species were collected from the control sites, whereas only 26 species were collected from the rehabilitated sites. Moreover, the control sites had a significantly higher Pielou evenness index and Shannon-Weiner diversity index than the rehabilitated sites. However, species richness was not significantly different between control and rehabilitated sites. There was a significant difference in the ant assemblages between the rehabilitated and control sites, although some convergence was evident.
Influence of dominant ant species
Of the 36 ant species collected in this study, 66.7% were present in both the control and rehabilitated sites (i.e. 24 species shared). However, a large portion of the difference between ant assemblages of the rehabilitated and control sites was because of the higher abundance of individuals present in the control sites (control: 1954 individuals, rehabilitated: 1252 individuals). The difference between ant assemblages may thus be because of a combination of the abundance of individuals and the composition of species present in the control and rehabilitated sites. In particular, two ant species (T. setuliferumand P. megacephala) had higher abundances in the rehabilitated sites than in the control sites, though neither species was identified as an indicator.Pheidole megacephala and several species of Tetramorium and Monomorium are said to be characteristic of disturbed areas (Andersen 2003; Samways, Caldwell & Osborn 1996). Furthermore, dominant ant species are known to affect the ant assemblages present in a region as well as influence species coexistence (Majer, Delabie & Smith 1994; Samways et al. 1996). Samways et al. (1996) attributed the lower abundance of species recorded in the disturbed sites in their study to the presence of P. megacephala. Consequently, the high abundance of an aggressive species such as P. megacephalamay explain the lower abundance of other ant species recorded in the rehabilitated sites in this study.
Environmental variables
Many of the environmental variables investigated in this study did not differ between the control and rehabilitated sites. The sites were similar in terms of total grass cover, other cover, rock cover, height of tallest plant and several soil properties (e.g. percentage sand, silt and clay content as well as soil organic matter). As a result, it could be said that the old agricultural land on the reserve has started to recover. Despite this, the percentage bare ground, soil pH and the percentage coarse sand differed significantly between the rehabilitated and control sites. This is important as such factors could influence the ant assemblages present in the sites. For instance, soil type is known to have an effect on the ant species present in a specific area (Andersen 1993; Koen & Breytenbach 1988; Lindsey & Skinner 2001). Unfortunately, the exact habitat requirements of ants are not well known (Lindsey & Skinner 2001). However, the little research that has been done on this topic has revealed that ant assemblages are influenced by a number of habitat variables; soil moisture, soil type, the geology of an area, plant structural complexity and leaf litter cover (Andersen 1993; Koen & Breytenbach 1988; Lindsey & Skinner 2001).
Many rehabilitation studies that have compared ant assemblages on rehabilitated and reference sites have established that the vegetation between the two compared treatments is very different. For example, van Hamburg et al. (2004) noted that the vegetation composition on rehabilitated ash dams and nearby natural grasslands was distinct. Consequently, these differences in plant composition result in different ant species assemblages as well as differences in ant species diversity (Van Hamburg et al. 2004). Also, a study by Zaloumis and Bond (2010) found differences between rehabilitated and control sites in a South African grassland; rehabilitated sites supported a much smaller community of resprouting forb species than the control sites. This is important as forb species make up much of the diversity of South African grasslands. The poor ability of forb species to reestablish after disturbance is attributed to their poor dispersal ability and lack of propagating sources (Dickson & Busby 2008; Kardol et al. 2008; Zaloumis & Bond 2010).
Several environmental factors such as soil properties can alter the direction of succession as well as the plant species present (Zaloumis & Bond 2010). Also, the addition of nutrients such as nitrogen from fertilisers can influence the spread and species richness of weeds and alien plants, which has negative consequences for the native flora of the region (Zaloumis & Bond 2010). Thus, a thorough understanding of the region's environmental variables and their impact on plant species is of importance, as ants are dependent on vegetation structure (Andersen 1995). The failure of successful rehabilitation of the plant community in grasslands could consequentially affect the ant assemblages present within the area. This is important as the present study found a significant difference between the plant assemblages of the control and rehabilitated sites on Rietvlei Nature Reserve. This difference in plant assemblages could possibly explain the difference in ant assemblages on the reserve because of factors such as substrate and vegetation have direct effects on the colonisation ability of different ant species (Van Hamburg et al. 2004). As a result, the differences in plant assemblages and specific environmental factors may explain the variation between ant assemblages of control and rehabilitated sites. Similarly, as ants are considered ecosystem engineers and often cause changes to soil, they too could be a contributing factor affecting the plant species composition within the area. As a result, ants could be driving much of the rehabilitation in the reserve old lands; however, more research is required before a conclusive decision can be made.
Indicator species
Three indicator species were identified, all of which were characteristic of the control sites. The indicator species were C. rectinota, C. amita and M. fastidium. No indicator species were identified for the rehabilitated sites.
Specialist ant predators are said to be highly sensitive to disturbance and thus are rarely recorded in disturbed habitats (Andersen et al. 2003; Hoffmann & Andersen 2003). Included in the list of specialist predators (Andersen 2000) is the genus Leptogenys, in the tribe Ponerini. Only one species of this genus, Leptogenys intermedia Emery, was recorded during this study. However, the fact that this species was recorded in both the rehabilitated and control sites suggests that the rehabilitated sites have started acquiring the vegetation structure, compostition and arthropod fauna that is necessary to support the specialised diet of these predators (Andersen 2000). This is noteworthy as many authors have found specialist predators to be among the last species to colonise rehabilitating areas (Majer & Beeston 1996; Hoffman & Andersen 2003). This is interesting as not much is known regarding the potential effects of these species on their environment and thus requires further research.
Conclusion
Our results show that the ant assemblages on rehabilitated areas of the reserve are significantly different from those of surrounding undisturbed areas, although some convergence is evident. These differences are likely to be explained by a combination of factors, including the presence of certain dominant ant species, differences in plant species composition and differences in environmental factors (including percentage bare ground, percentage coarse sand and soil pH). A conclusive statement regarding the success of rehabilitation efforts on the reserve is not possible given the lack of background information on recovery rates and compositional changes, but our study shows that rehabilitation of grasslands would benefit from a greater understanding of ant diversity and the factors that are responsible for driving this diversity. Further studies are needed to investigate the functional roles of particular ant species, especially those that are considered to be good indicator species.
Acknowledgements
We are grateful to everyone who assisted with this project; Chantal Ferreira and Jonathan Fisher are thanked for their assistance with the ant identifications. Our gratitude is also extended to the Rietvlei Nature Reserve and its staff members, especially Riaan Marais, who made this study possible. Furthermore, Wesley Daniels, Chantal Ferreira, Michael Potgieter, André van Tonder, Cavin Shivambu and Paul Akkermans are gratefully acknowledged for their assistance in the field. Our thanks are extended to the Soil Sciences Department of the University of Pretoria who allowed us to use their facilities when conducting the soil analyses. We would also like to thank the anonymous reviewers whose comments helped to improve the manuscript. We are grateful for funding received from the National Research Foundation.
Competing interests
The authors declare that they have no financial or personal relationships which may have inappropriately influenced them in writing this article.
Authors' contributions
S-L.J., M.R., I.E. and P.H. conceived and designed the study. S-L.J., M.R. and I.E. performed fieldwork. S-L.J. and P.H. performed ant identifications. S-L.J., I.E. and M.R. performed statistical analyses; P.H. contributed identification tools. S-L.J., M.R., I.E. and P.H. wrote and edited the manuscript.
References
Andersen, A., 1993, 'Ants as indicators of restoration success at a uranium mine in tropical Australia', Restoration Ecology 1(3), 156-167.http://dx.doi.org/10.1111/j.1526-100X.1993.tb00022.x [ Links ]
Andersen, A., 1995, 'A classification of Australian ant communities based on functional groups which parallel plant life-forms in relation to stress and disturbance', Journal of Biogeography 22(1), 15-29. http://dx.doi.org/10.2307/2846070 [ Links ]
Andersen, A., 2000, 'A global ecology of rainforest ants: Functional groups in relation to environmental stress and disturbance', in D. Agosti, J.D. Majer, L.E. Alonso & T.R. Schultz (eds.), Ants: Standard methods for measuring and monitoring biodiversity, pp. 25-34, Smithsonian Institution Press, Washington, DC. [ Links ]
Andersen, A., 2003, 'Ant biodiversity in arid Australia: Productivity, species richness and community organisation', Records of the South Australian Museum Monograph Series 7, 79-92. [ Links ]
Andersen, A., Hoffmann, B. & Somes, J., 2003, 'Ants as indicators of minesite restoration: Community recovery at one of eight rehabilitation sites in central Queensland', Ecological Management and Restoration 4(1), 12-19. http://dx.doi.org/10.1046/j.1442-8903.4.s.2.x [ Links ]
Andersen, A. & Sparling, G., 1997, 'Ants as indicators of restoration success: Relationship with soil microbial biomass in the Australian seasonal tropics',Restoration Ecology 5(2), 109-114. http://dx.doi.org/10.1046/j.1526-100X.1997.09713.x [ Links ]
Arnold, G., 1920, 'A monograph of the Formicidae of South Africa, Myrmicinae', Annuals of the South African Museum 14(5), 403-578. [ Links ]
Bolton, B., 1975, 'A revision of the ant genus Leptogenys Roger (Hymenoptera: Formicidae) in the Ethiopian region with a review of the Malagasy species',Bulletin of the British Museum (Natural History) Entomology 31(7), 235-305. http://dx.doi.org/10.5962/bhl.part.29487 [ Links ]
Bolton, B., 1980, 'The ant tribe Tetramoriini (Hymenoptera: Formicidae). The genus Tetramorium Mayr in the Ethiopian zoogeographical region', Bulletin of the British Museum (Natural History) Entomology 40(3), 193-384. [ Links ]
Bolton, B., 1981, 'A revision of the ant genera Meranoplus F. Smith, Dicroaspis Emery and Calyptomyrmex Emery (Hymenoptera: Formicidae) in the Ethiopian zoogeographical region', Bulletin of the British Museum (Natural History) Entomology 42(2), 43-81. [ Links ]
Bolton, B., 1987, 'A review of the Solenopsis genus-group and revision of Afrotropical Monomorium Mayr (Hymenoptera: Formicidae)', Bulletin of the British Museum (Natural History) Entomology 54(3), 263-452. [ Links ]
Bolton, B., 1994, Identification guide to the ant genera of the world, Harvard University Press, Cambridge. [ Links ]
Bolton, B., 2007, 'Taxonomy of the dolichoderine ant genus Technomyrmex Mayr (Hymenoptera: Formicidae) based on the worker caste', Contributions of the American Entomological Institute 35(1), 1-150. [ Links ]
Cairns, J.R.J., McCormick, P.V. & Niederlehner, B.R., 1993, 'A proposed framework for developing indicators of ecosystem health', Hydrobiologia 263(1), 1-44. http://dx.doi.org/10.1007/BF00006084 [ Links ]
Cardoso, P., 2009, 'Standardization and optimization of arthropod inventories - the case of Iberian spiders', Biodiversity and Conservation 18(14), 3949-3962. http://dx.doi.org/10.1007/s10531-009-9690-7 [ Links ]
Cardoso, P., Crespo, L.C., Carvalho, R., Rufino, A.C. & Henriques, S.S., 2009, 'Ad-hoc vs. standardized and optimized arthropod diversity sampling',Diversity 1(1), 36-51. http://dx.doi.org/10.3390/d1010036 [ Links ]
Clarke, K.R. & Warwick, R.M., 2001, Change in marine communities: An approach to statistical analysis and interpretation, 2nd edn., PRIMER-E, Plymouth. [ Links ]
Colwell, R.K., 2013, 'EstimateS: Statistical estimation of species richness and shared species from samples', version 9.1.0, viewed May 2014, from http://www.purl.oclc.org/estimates [ Links ]
Colwell, R.K., Chao, A., Gotelli. N.J., Lin, S.Y., Mao, C.X., Chazdon, R.L. et al., 2012, 'Models and estimators linking individual-based and sample-based rarefaction, extrapolation, and comparison of assemblages', Journal of Plant Ecology 5(1), 3-21. http://dx.doi.org/10.1093/jpe/rtr044 [ Links ]
Dickson, T.L. & Busby, W.H., 2008, 'Forb species establishment increases with decreased grass seeding density and with increased forb seeding density in a Northeast Kansas, U.S.A., experimental prairie restoration', Restoration Ecology 17(5), 597-605. http://dx.doi.org/10.1111/j.1526-100X.2008.00427.x [ Links ]
Dufrêne, M. & Legendre, P., 1997, 'Species assemblages and indicator species: The need for a flexible asymmetrical approach', Ecological Monographs67(3), 345-366. http://dx.doi.org/10.2307/2963459 [ Links ]
Fagan, K.C., Pywell, R.F., Bullock, J.M. & Marrs, R.H., 2010, 'Are ants useful indicators of restoration success in temperate grasslands?', Restoration Ecology 18(3), 373-379. http://dx.doi.org/10.1111/j.1526-100X.2008.00452.x [ Links ]
French, K. & Major, R.E., 2001, 'Effect of an exotic Acacia (Fabaceae) on ant assemblages in South African fynbos', Austral Ecology 26(4), 303-310.http://dx.doi.org/10.1046/j.1442-9993.2001.01115.x [ Links ]
Gotelli, N.J., Ellison, J.A., Dunn, R.R. & Sanders, N.J., 2014, 'Counting ants (Hymenoptera: Formicidae): Biodiversity sampling and statistical analysis for myrmecologists', Myrmecological News 15, 13-19. [ Links ]
Hobbs, R.J. & Norton, D.A., 1996, 'Towards a conceptual framework for restoration ecology', Restoration Ecology 4(2), 93-110.http://dx.doi.org/10.1111/j.1526-100X.1996.tb00112.x [ Links ]
Hodkinson, I.D. & Jackson, J.K., 2005 'Terrestrial and aquatic invertebrates as bioindicators of environmental monitoring with particular reference to mountain ecosystems', Environmental Management 35(5), 649-666. http://dx.doi.org/10.1007/s00267-004-0211-x [ Links ]
Hoffmann, B.D. & Andersen, A.N., 2003, 'Responses of ants to disturbance in Australia, with particular reference to functional groups', Austral Ecology28(4), 444-464. http://dx.doi.org/10.1046/j.1442-9993.2003.01301.x [ Links ]
Hölldobler, B. & Wilson, E.O., 1990, The ants, Springer-Verlag, Cambridge. [ Links ]
Howard, S., 1998, 'Verbal protocol analysis', in B. Henderson-Sellers, A. Simons & H. Younessi (eds.), The open process specification, pp. 272-274, Addison Wesley, Sydney. [ Links ]
Jiménez-Valverde, A., Baselga, A., Melic, A. & Txasko, N., 2010, 'Climate and regional beta-diversity gradients in spiders: Dispersal capacity has nothing to say?', Insect Conservation and Diversity 3(1), 51-60. http://dx.doi.org/10.1111/j.1752-4598.2009.00067.x [ Links ]
Kardol, P., Wal, A.V.D., Bezemer, T.M., Boer, W.D., Duyts, H., Holtkamp, R. et al., 2008, 'Restoration of species-rich grasslands on ex-arable land: Seed addition outweighs soil fertility reduction', Biological Conservation 141(9), 2208-2217. http://dx.doi.org/10.1016/j.biocon.2008.06.011 [ Links ]
Koen, J.H. & Breytenbach, W., 1988, 'Ant species richness of fynbos and forest ecosystems in the southern Cape', South African Journal of Zoology 23(3), 184-188. http://dx.doi.org/10.1080/02541858.1988.11448100 [ Links ]
Lach, L., Parr, C.L. & Abott, K.L., 2010, Ant ecology, Oxford University Press, Oxford. [ Links ]
Lake, P.S., 2001, 'On the maturing of restoration: Linking ecological research and restoration', Ecological Management and Restoration 2(2), 110-115.http://dx.doi.org/10.1046/j.1442-8903.2001.00074.x [ Links ]
Legg, C.J. & Nagy, L., 2006, 'Why most conservation monitoring is, but need not be, a waste of time', Journal of Environmental Management 78(2), 194-199. http://dx.doi.org/10.1016/j.jenvman.2005.04.016 [ Links ]
Lindsey, P.A. & Skinner, J.D., 2001, 'Ant composition and activity patterns as determined by pitfall trapping and other methods in three habitats in the semi-arid Karoo', Journal of Arid Environments 48(4), 551-568. http://dx.doi.org/10.1006/jare.2000.0764 [ Links ]
Longino, J.T., Coddington, J. & Colwell, R.K., 2002, 'The ant fauna of a tropical rain forest: Estimating species richness three different ways', Ecology83(3), 689-702. http://dx.doi.org/10.1890/0012-9658(2002)083[0689:TAFOAT]2.0.CO;2 [ Links ]
Magurran, A.E., 2004, Measuring biological diversity, Blackwell, Oxford. [ Links ]
Majer, J.D., 1983, 'Ants: Bio-indicators of minesite rehabilitation, land-use, and land conservation', Environmental Management 7(4), 375-383. http://dx.doi.org/10.1007/BF01866920 [ Links ]
Majer, J.D. & Beeston, G., 1996, 'The biodiversity integrity index: An illustration using ants in Western Australia', Conservation Biology 10(1), 65-73. http://dx.doi.org/10.1046/j.1523-1739.1996.10010065.x [ Links ]
Majer, J.D., Delabie, J.H.C. & Smith, R.B., 1994, 'Arboreal ant community patterns in Brazilian cocoa farms', Biotropica 26(1), 73-83. http://dx.doi.org/10.2307/2389112 [ Links ]
Marais, R., 2004, 'A plant ecological study of the Rietvlei Nature Reserve, Gauteng Province', Magister Agriculturae thesis, Department of Animal, Wildlife and Grassland Sciences, University of the Free State. [ Links ]
Morellet, N., Gailllard, J.M., Hewison, A.J., Ballon, P., Boscardin, Y., Duncan, P. et al., 2007, 'Indicators of ecological change: New tools for managing populations of large herbivores', Journal of Applied Ecology 44(3), 634-643. http://dx.doi.org/10.1111/j.1365-2664.2007.01307.x [ Links ]
Mucina, L. & Rutherford, M.C., 2006, The vegetation of South Africa, Lesotho and Swaziland, South African National Biodiversity Institute, Pretoria. [ Links ]
Neke, K.S. & Du Plessis, M.A., 2004, 'The threat of transformation: Quantifying the vulnerability of grasslands in South Africa', Conservation Biology 18(2), 466-477. [ Links ]
Noss, R.F., 1990, 'Indicators for monitoring biodiversity: A hierarchical approach', Conservation Biology 4(4), 355-364. http://dx.doi.org/10.1111/j.1523-1739.1990.tb00309.x [ Links ]
Pielou, E.C., 1969, An introduction to mathematical ecology, Wiley, New York. [ Links ]
Prins, A.J., 1982, 'Review of Anoplolepis with reference to male genitalia, and notes on Acropyga (Hymenoptera, Formicidae)', Annuals of the South African Museum 89(3), 215-247. [ Links ]
Prins, A.J., 1983, 'A new ant genus from southern Africa (Hymenoptera, Formicidae)', Annuals of the South African Museum 94(1), 1-11. [ Links ]
R Development Core Team, 2011, R: A language and environment for statistical computing, R Foundation for statistical Computing, Vienna, viewed June 2014, from http://www.R-project.org [ Links ]
Rawson-Tetley, R., Animal shelter manager, computer software, viewed 11 January 2005, from http://sheltermanager.sourceforge.net [ Links ]
Roberts, D.W., 2014, 'Labdsv: Ordination and multivariate analysis for ecology' R package version 1.6-1', viewed June 2014, from http://CRAN.R-project.org/package=labdsv [ Links ]
Ruiz-Jaén, M.C. & Aide, T.M., 2005, 'Vegetation structure, species diversity, and ecosystem processes as measures of restoration success', Forest Ecology and Management 218(1), 159-173. [ Links ]
Samways, M.J., Caldwell, P.M. & Osborn, R., 1996, 'Ground-living invertebrate assemblages in native, planted and invasive vegetation in South Africa',Agriculture, Ecosystems and Environment 59(1), 19-32. [ Links ]
South African National Biodiversity Institute (SANBI), 2013, Grasslands Ecosystem Guidelines: Landscape interpretation for planners and managers, Compiled by Cadman, M., de Villiers, C., Lechmere-Oertel, R. & McCulloch, D. South African National Biodiversity Institute, Pretoria. [ Links ]
Shannon, C.E., 2001, 'A mathematical theory of communication', ACM SIGMOBILE Mobile Computing and Communications Review 5(1), 3-55. http://dx.doi.org/10.1145/584091.584093 [ Links ]
Smith, K.L. & Jones, M.L., 2005, 'Watershed-level sampling effort requirements for determining riverine fish species composition', Canadian Journal of Fisheries and Aquatic Sciences 62(7), 1580-1588. http://dx.doi.org/10.1139/f05-098 [ Links ]
Van Aarde, R. & Smit, A., 1997, The ecology of rehabilitating coastal dunes at Richards Bay, University of Pretoria, Pretoria. [ Links ]
Van Hamburg, H., Andersen, A.N., Meyer, W.J. & Robertson, H.G., 2004, 'Ant community development on rehabilitated ash dams in the South African Highveld', Restoration Ecology 12(4), 552-558. http://dx.doi.org/10.1111/j.1061-2971.2004.00421.x [ Links ]
Weir, J.S., 1978, The ant Iridomyrmex as a biological indicator of pesticide contamination, Report for N.S.W. State Pollution Control Commission, New South Wales, Australia. [ Links ]
Welch, B.L., 1947, 'The generalization of "student's" problem when several different population variances are involved', Biometrika 34(1/2), 28-35. http://dx.doi.org/10.2307/2332510 [ Links ]
Zaloumis, N.P. & Bond, W.J., 2010, 'Grassland restoration after afforestation: No direction home?', Austral Ecology 36(4), 357-366. http://dx.doi.org/10.1111/j.1442-9993.2010.02158.x [ Links ]
 Correspondence:
Samantha-Leigh Jamison
samjam@live.co.za
Received: 02 Feb. 2016
Accepted: 23 June 2016
Published: 29 Sept. 2016
Appendix 1: Methods and materials used for soil analyses
Soil samples were taken from each of the sites with the aid of a soil auger. The auger was twisted into the soil until the chamber filled with soil. The soil was placed into labelled plastic bags. Three soil samples were taken randomly from the area around each site. The three samples taken at each site were combined and used as one sample. The soil pH, soil organic matter, sand, silt and clay contents were determined for the 12 sites surveyed.
The pH of the soil was determined with the use of a pH meter (accurate to 0.05 pH units). Initially, twelve 50-cm3 beakers were labelled and weighted on a balance (accurate to 0.1 g) and their weights recorded. A 10-g sample of each of the 12 soil samples was placed into the respectively labelled beakers. An automatic dispenser was used to dispense 25 cm3 of de-ionised water into each of the beakers. The beakers were shaken for approximately 5 s and allowed to stand for 60 min. Each beaker was then shaken before the electrodes of the pH meter were placed into the soil sample. The results obtained are reported as pH (H2O).
The sand, silt and clay contents of the soil were determined with the use of the particle size distribution method. Twelve beakers (250 cm3 capacity) were weighed and their weights recorded. Each beaker received 50 g of soil from a respective site. To each beaker of soil, 10 cm3 of Calgon dispersing solution (a mixture that contains sodium hexametaphosphate [NaPO4] and sodium carbonate [Na2CO3] and de-ionised water) was added. The contents of a beaker were placed into a dispersion cup and filled to approximately 150 cm3 with de-ionised water. The sample was then mixed for 5 min with the use of an electric mixer (10 000 rpm - 13 000 rpm). The sand fraction of the soil was removed by washing the dispersed sample on a 0.053-mm-size sieve. This sieve would ensure that only silt and clay could pass through the funnel into a 1-dm3 cylinder. The washing process was continued until the percolate was clear. The sieve was then removed from the cylinder, and the sand was transferred into a labelled beaker. This process was repeated for all 12 soil samples. The beakers containing the separated sand were dried in a drying oven at 105 °C to constant mass. The samples were then weighed and the masses of the sand (excluding the weight of the beaker) were recorded. The mass of the sand fraction was given as A. Following this, the cylinders containing the silt and clay were filled to the 1-dm3 mark. Each of the cylinders was stirred with a hand stirrer for a period of 30 s. A 'blank' was prepared by adding 10 cm3 Calgon to a 1-dm3 cylinder of water. The cylinders were left undisturbed for a total period of 6 hours 30 ± 5 min. Once this time had elapsed, a standard hydrometer (with Bouyoucos scale in grams per litre, ranging from -5 to 60) was slowly inserted into the suspension of each cylinder and the recording (C) was taken. The hydrometer was placed into each suspension carefully in order not to mix the solution. At this time, a temperature reading was taken.
The particle sizes were calculated as follows:
A = Mass of sand fraction (g)
B = Hydrometer reading of blank
C = Hydrometer reading of sample
M = Mass (g) of soil used
Sand fraction:

Clay fraction:
To calculate the clay reading, the blank hydrometer reading was subtracted from the sample reading (C − B) and the percentage clay under the appropriate temperature was determined using a particle size distribution table (where E is the reading obtained from the table).

Silt fraction:

The soil organic matter was determined by weighing 12 labelled beakers (50 cm3) and recording the masses of each. An approximate mass of between 10 g and 20 g of each soil sample was weighed and placed into the relevant beakers. The beakers were placed in a drying oven at 105 °C and left overnight to ensure that any moisture in the samples was removed. When removed from the drying oven, the samples were weighed and transferred to a furnace (550 °C) and left for a period of 16 hours. The beakers were then weighed and the mass of the soil organic matter determined. This percentage was then subtracted from the previously determined sand fraction to produce a new adjusted sand fraction.
Appendix 2: Braun-Blanquet scale for vegetation cover

Appendix 3: Ant species lists for various data sets
Specimens were identified to species level where possible. Specimens that could not be identified to species level were identified to genus and assigned to numbered morphospecies.
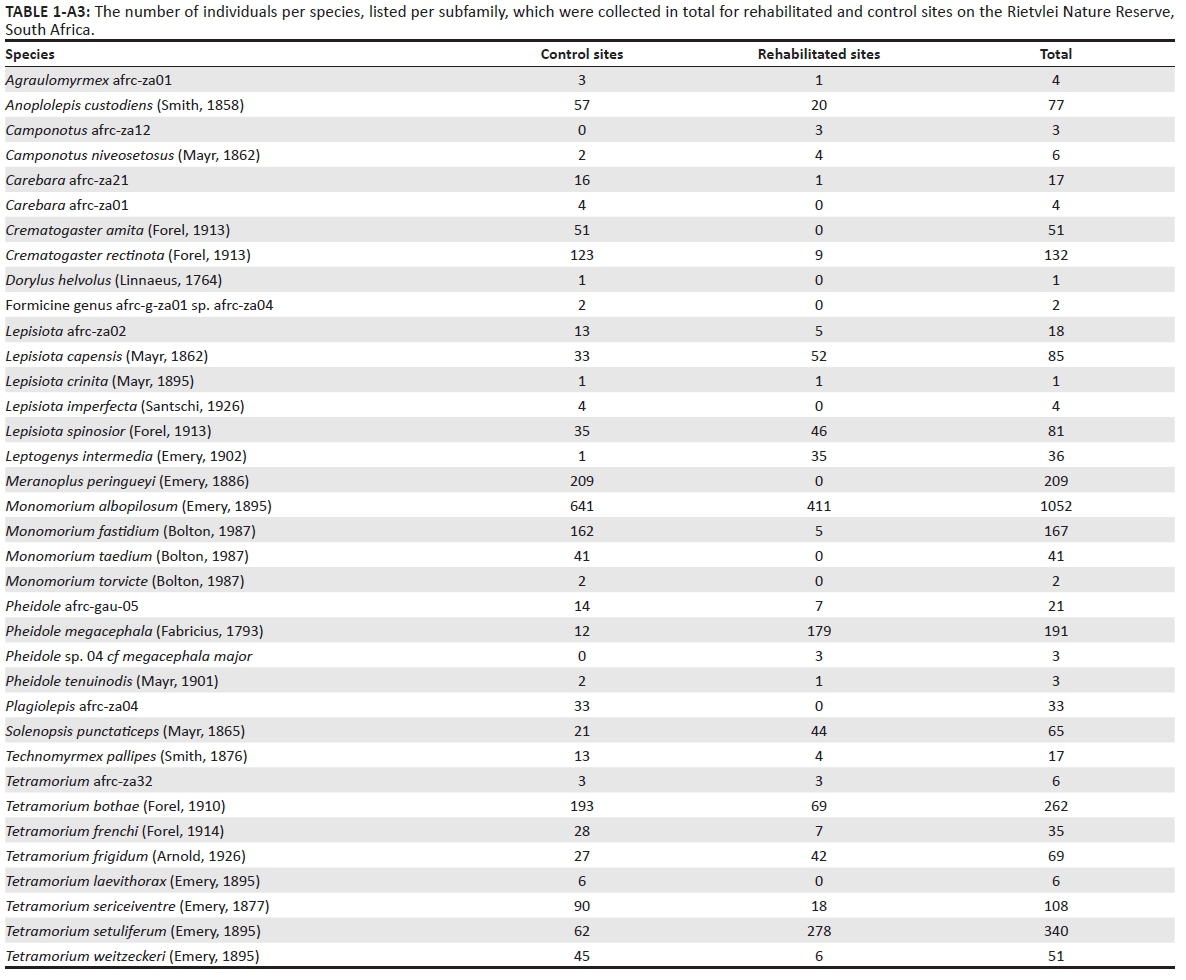

FIGURE 1-A3 - Click to enlarge
Appendix 4: Tables illustrating sampling completeness calculated for the rehabilitated and control sites
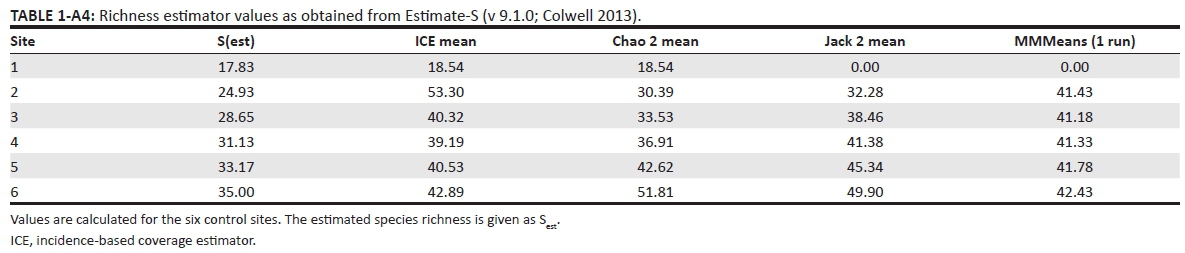
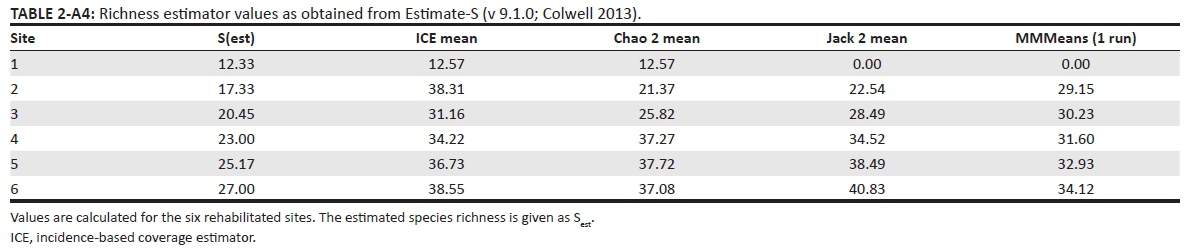
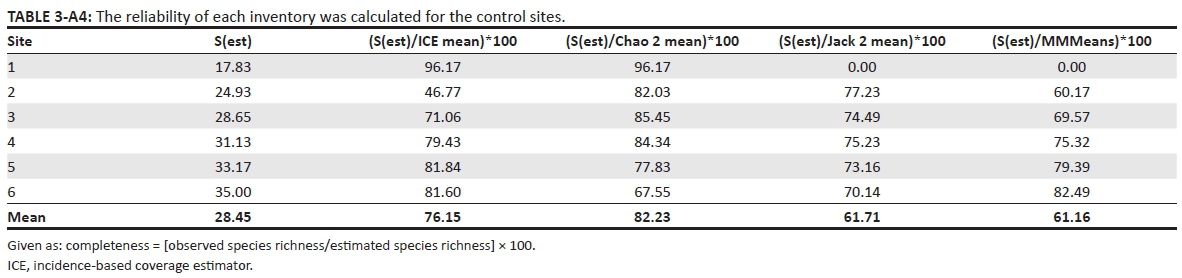
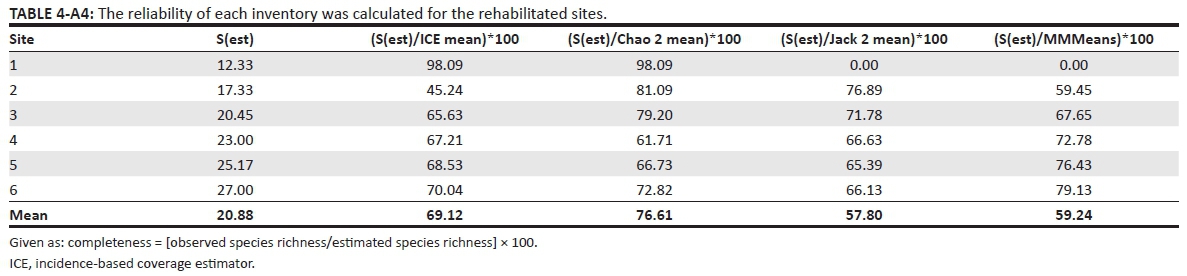
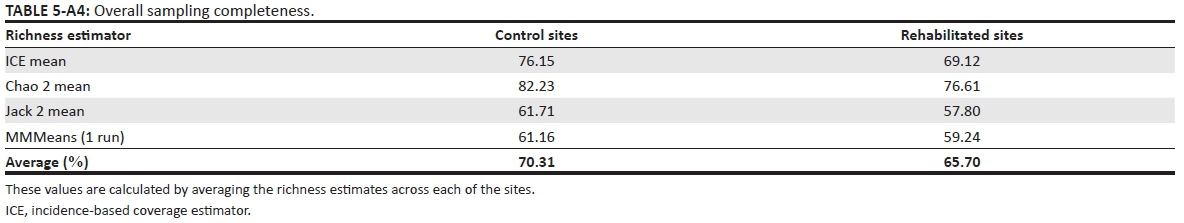
Table 5 - A4 -Click to enlarge
Appendix 5: List of Indicator values

