


Serviços Personalizados
Artigo
 Inglês (pdf)
 Artigo em XML
 Referências do artigo
Indicadores

Links relacionados
-
 Citado por Google
 -
 Similares em Google
Compartilhar

 Permalink
Koedoe
versão On-line ISSN 2071-0771
versão impressa ISSN 0075-6458
Koedoe vol.57 no.1 Pretoria 2015
http://dx.doi.org/10.4102/koedoe.v57i1.1244
ORIGINAL RESEARCH
An inventory of epigeal ants of the western Soutpansberg Mountain Range, South Africa
Thinandavha C. MunyaiI; Stefan H. FoordII
I1Centre for Invasion Biology, Department of Ecology and Resource Management, University of Venda, South Africa
IICentre for Invasion Biology, and South African Research Chair for Biodiversity Value and Change, Department of Zoology, University of Venda, South Africa
ABSTRACT
The distribution, abundance and sensitivity of invertebrates to habitat change are largely unknown. Long-term monitoring of ecological gradients with standardised and comparable protocols can form the basis of a better understanding. Altitudinal gradients are particularly relevant within this context. Here we provide a check list and baseline data for ant species collected over a 5-year period across the Soutpansberg Mountain Range, South Africa. Standardised pitfall surveys across 11 sites yielded a total of 133 species in 38 genera and 6 subfamilies. Sample coverage of epigeal ants was 0.98 for the transect as a whole. Of these species, 21% were restricted to the southern slope of the mountain and 14% to the northern slope. Extrapolated richness estimates reached an asymptote for all, except for three sites. These were the only sites impacted by bush encroachment. Observed richness was the highest at a low-altitude mesic site that is exposed to considerable disturbance by megaherbivores and mechanical clearing of woody vegetation. Structural classification of vegetation was predictive of a broad-scale ant assemblage structure. On a smaller scale, however, structure was a function of elevation, space and temperature.
CONSERVATION IMPLICATIONS: Future monitoring should target indicator taxa associated with bush encroachment, particularly with reference to their impacts on grasslands. Bush encroachment could endanger several ant species associated with mesic grasslands and woodlands on the mountain, as well as ant diversity, as these were the habitats with the highest ant diversity.
Introduction
Although invertebrates comprise the bulk of diversity in an ecosystem, they are often excluded from conservation initiatives. Cardoso et al. (2011) identified seven reasons for this. Three of the shortfalls had to do with: (1) the distribution of invertebrate species is unknown (Wallacean), (2) invertebrate abundance and their changes in space and time are unknown (Prestonian) and (3) invertebrates' way of life and sensitivity to habitat types are largely unknown (Hutchinsonian). These three shortfalls are particularly relevant to how ecologists practise their science, as the distribution, abundance in time and space, and sensitivities to habitat change are largely unknown for most species. These constraints can be resolved through inventories that follow standardised and comparable protocols (Cardoso et al. 2011).
Ants respond to the environment at small scales and considerable support exists for their use as indicators of disturbance and habitat degradation (see Andersen & Majer [2004] for review). Ants are easily collected and species or morpho-species level determination are aided through readily available taxonomic expertise (Ward 2010). In addition to being diverse, abundant and a dominant component of animal biomass in terrestrial ecosystems (Hölldobler & Wilson 1990), they also perform important functions in ecosystems, including pollination, myrmechory and nutrient cycling, among others (Wielgoss et al. 2014).
The Soutpansberg Mountain Range is a centre of endemism (Hahn 2002) and is the focal point for the newly proclaimed Vhembe Biosphere Reserve, one of the United Nations Educational, Scientific and Cultural Organisation (UNESCO) World Network of Biosphere Reserves (http://www.unesco.org). It has the highest plant generic and family level diversity among the 18 recognised Centres of Plant Endemism in southern Africa (Van Wyk & Smith 2001). Recent results suggest that this diversity and endemism is mirrored by spiders (Foord 2008) and reptiles (Kirchhof et al. 2010). As an inselberg that rises 1000 m above the surrounding plains, the Soutpansberg Mountain Range has provided a refuge for several taxa during periods of climate change and will once more play a biogeographic role in the region as regional climate changes take effect in response to elevated global greenhouse gases (Tshialaet al. 2011).
Transects can provide valuable diversity, distribution and abundance information as well as population trends. Altitudinal transects are particularly relevant within the context of contemporary climate changes. Here we summarise the results of a standardised inventory of epigeal ants over a 5-year period (2009-2013), along a transect across the western Soutpansberg Mountain Range. We provide a checklist of epigeal ants with a sample coverage of 0.98 for the whole transect. A posteriori defines distinct ant assemblages across the transect and tests for differences between these groups.
Materials and methods
Study area
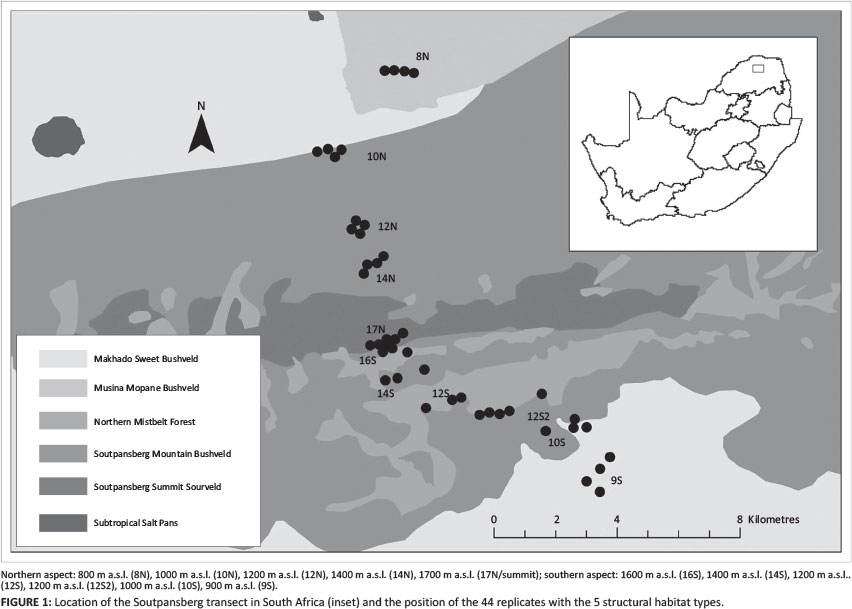
The 16.5 km altitudinal transect extends over the highest point of the Soutpansberg Mountain Range, Lajuma (1748 m), in the Luvhondo Nature Reserve. It includes the northern and southern slopes of the mountain and consists of 11 sites, spaced at 200 m altitudinal intervals. It starts at 800 m a.s.l. in the Limpopo valley to the north of the mountain, ascends 900 m to Lajuma, and descends another 800 m to the plains south of the range (Figure 1).
The study area stretches across five broad structural vegetation types, namely woodland, sedgeland-herbland, forest, thicket and shrubland. All the sites on the northern aspect are woodland (total tree cover 0.1% - 75%; shrub cover < 10%; mean crown-gap ratio > 0.1). They can be characterised as low (1 m - 5 m-tall trees), open (crown-gap ratio of 2-8.5) and woodland (Figures 2a-2d), mostly on shallow quartzitic soils (Figures 2b-2d). One site is characterised by deep sandy soils (Figure 2a). Dominant trees species include Burkea africana, Ochna pulchra, Diospyros dichrophylla, Rhus magalismontanum, Boscia albitrunca, Adansonia digitata, Acacia nigrescens and Terminalia sericea.
Vegetation types along the plains and lower southern foothills are largely thicket (Figure 3d) and shrubland (Figure 3e), located on red loamy-clay soils dominated by woody species such as Dichrostachys cinerea, Acacia caffra and Olea europaea.
Structurally, the lowest site on the southern aspect (Figure 3e) is tall, closed shrubland (< 0.1% tree cover). It is dominated by aD. cinerea matrix with patches that are mechanically cleared of all woody plants. Site 10S (Figure 3d) is low thicket (10% - 100% tree cover and > 10% shrub cover). The forests are found at mid-elevation, between 1200 m a.s.l. and 1400 m a.s.l. on the southern slope and include both short (Figure 3c) and tall (Figure 3b) forest sites with a crown-gap ratio of < 0.1. They are dominated by woody species such as Croton sylvaticus and Ekebergia capensis. The higher elevational zones of the southern aspect and summit consist of a sedgeland-herbland matrix with low shrubland patches that grow on shallow rocky soils on quartzite, dominated by Coleochloa species (Figures 2e-3a).Soil temperature extremes were the highest on the summit of the mountain (mean annual range 10 °C - 55 °C) and the lowest in the tall forests of the southern aspect (14 °C - 32 °C).
Ant sampling
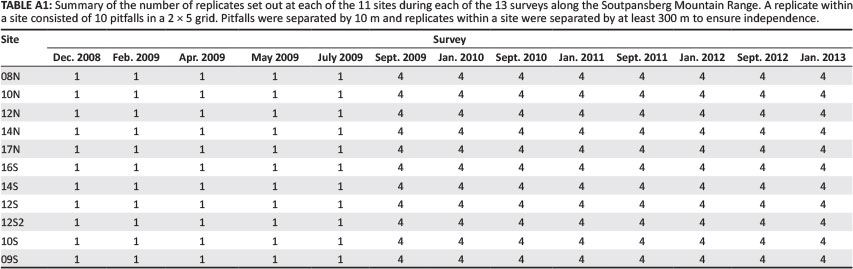
Ants were sampled through standardised pitfall trapping (Munyai & Foord 2012) at each of the 11 sites. Sample units consisted of 10 pitfall traps (ø62 mm) laid out in a sampling grid (2 x 5) with 10 m spacing between traps. Pitfall traps were left open for 5 days, since it is considered representative and does not sample excessive ants (see Munyai & Foord [2012] and references therein). From September 2009 onwards (Appendix 1), sampling units were spatially replicated four times at each site. Replicates were separated by < 300 m to avoid pseudo-replication (Ness et al. 2004). The traps contained a 50% solution of propylene glycol because it neither attracts nor repels ants (Abensperg-Traun & Steven 1995).
The ant samples were washed in a laboratory and stored in 70% ethanol. They were sorted to morpho-species and, where possible, identified to species by comparison with reference collections housed in the Kruger National Park in South Africa and the Commonwealth Scientific and Industrial Research Organisation (CSIRO) Tropical Ecosystems Research Centre in Darwin, Australia. Bolton (1994) was used to identify some specimens to genus level, while valid names were confirmed using AntCat (http://www.antcat.org) and AntWeb (http://www.antweb.org). The unidentified (morpho) species were given the following number codes: University of Venda Collection_01, 02, etc. (i.e. UVOC_01, 02, etc.).
Bothroponera, Mesoponera, Ophthalmopone and Pseudoponera were considered valid genera rather than being subsumed underPachycondyla (Schmidt & Shattuck 2014). Subfamilies Aenictinae and Cerapachyinae were both considered invalid and therefore subsumed under Dorylinae, as treated by Brady et al. (2014). Reference collections are housed at the University of Venda and CSIRO Tropical Ecosystems Research Centre (Darwin, Australia).
Data analysis
Chao 2 and ICE, in EstimateS version 9.1.0 (Colwell 2013), were used to estimate species richness. Sample coverage at each site and the transect as a whole was done with sample-based rarefaction and extrapolation of the incidence matrix. Sample coverage represents the proportion of the total number of individuals in the ant assemblage along the transect that belong to the species represented in our sample (Chao & Jost 2012).
Both interpolation and extrapolation of samples was based on the Bernoulli product model as well as unconditional variance estimates for the rarefaction (interpolation) (Chao & Jost 2012) and extrapolation curves. This sample-based estimation provides both unconditional variance abundance data of this study and species richness predicted by a 1000 pitfall samples and were considered to be a fair reflection of the richness at a site.
Samples within each replicate were pooled over the period of the study for multivariate analysis. Ant assemblage structure was mapped using non-metric multidimensional scaling of Bray-Curtis similarity measures (Clarke & Gorley 2006). A posteriori groups of ant assemblages were defined based on hierarchical clustering with group average linking. Support for these groups was tested with the permutational procedure SIMPROF in PRIMER version 6.1.6 (Clarke & Gorley 2006).
Results
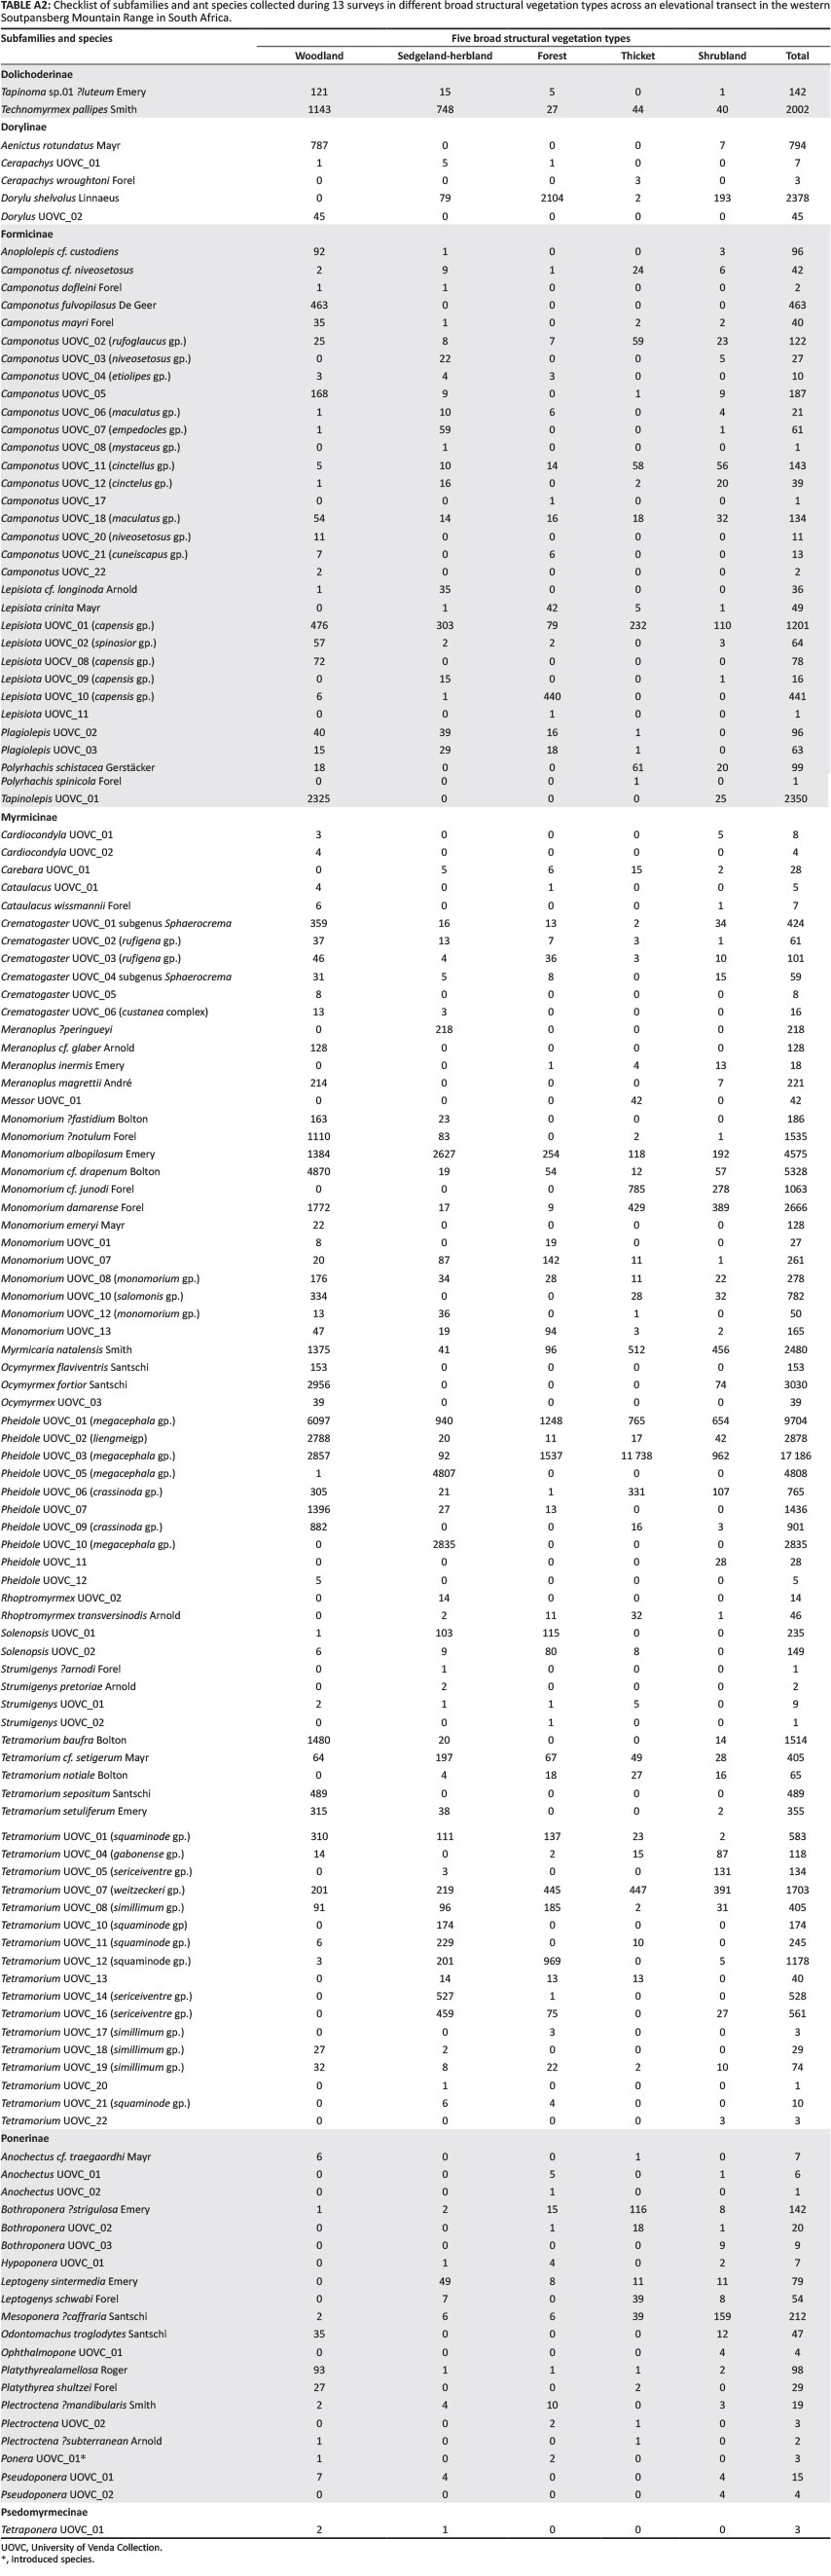
In total, 85 759 ant specimens were collected during the 13 sampling periods (Appendix 2), comprising 133 species in 38 genera and 6 subfamilies.
Myrmicinae (with 72 species, 86% of the total abundance and 15 genera) was the most diverse and abundant subfamily, followed by Formicinae (27 species and 6 genera). Ponerinae (12 genera) had the second highest generic diversity.
The most specious genera were Tetramorium (22 species), Camponotus (19 species), Monomorium (13 species), Pheidole (9 species), Crematogaster (6 species), Meranoplus (4 species), and Ocymyrmex, Anochectus, Bothroponera and Plectroctena, each with 3 species (Appendix 2).
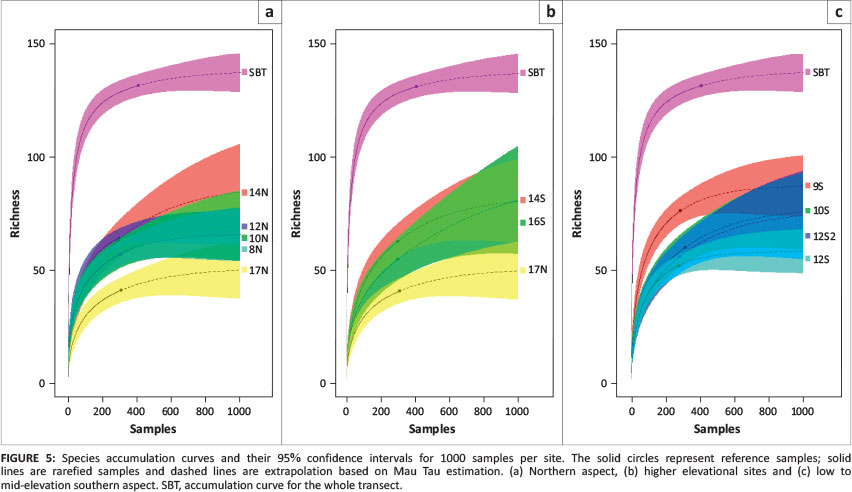
Sample-based species rarefaction and extrapolation curves for the transect as a whole approximated an asymptote, indicating that most of the epigeal species were collected with a sample coverage of 0.98. Sample coverage for all sites was > 0.95, while the forest site 12S coverage was the lowest, at 0.955. Based on richness estimations (Table 1) and species richness extrapolations (Figures 4 and 5), ant richness peaked at mid-elevations on the northern aspect. Only at woodland site 14N was species richness significantly greater that of 17N, the summit (Figure 4).
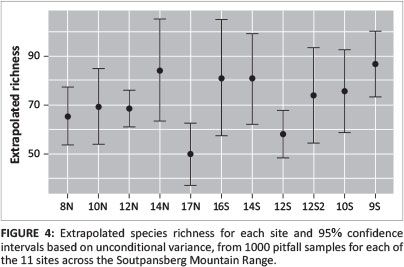
The pattern on the southern aspect was more complex, with richness decreasing significantly from shrubland site 9S to forest site 12S (Figure 4) and then increasing at sedgeland sites 14S and 16S before decreasing again towards the summit (Figure 4). Based on predicted richness of sites (Figure 5), the ranking of sites changes only for 14N. Notably, the predicted curve for 16S also suggests a considerable increase in richness with increased sampling. The sites with the highest and lowest variation in mean annual temperature variation (17N and 12S) also had the lowest species richness.
In total, 104 species were collected along the northern slope and 117 species on the southern slope. Twenty-eight species were restricted to the southern slope and nineteen species to the northern slope. Ten species, Camponotus UOVC_18 (maculatus gp.),Lepisiota UOVC_01 (capensis gp.), Monomorium albopilosum Emery, Monomorium UOVC_07, Monomorium_08 (monomorium gp.),Pheidole UOVC_01 (megacephala gp.), Tetramorium cf. setigerum Mayri, Tetramorium UOVC_01 (squaminode gp.), TetramoriumUOVC_08 (simillimum gp.) and Technomyrmex pallipes Smith, occurred at all the sites (Appendix 2).
A total of 20 Ponerine species were sampled from both the southern and the northern aspects. Fifty per cent of all Ponerine species, namely Anochectus UOVC_01, Bothroponera ?strigulosa Emery, Bothroponera UOVC_02, Bothroponera UOVC_03,Hypoponera UOVC_01, Leptogenys intermedia Emery, Leptogenys schwabi Forel, Ophthalmopone UOVC_01, Plectroctena UOVC_02 and Pseudoponera UOVC_01, were restricted to the southern slope of the mountain. The other 10 species occurred on both slopes of the mountain.
The non-metric multidimensional scaling plot identified three major groupings: the high elevation sedgeland-herbland sites (14S - summit); woodlands (08N - 14N); and shrubland, thicket and forest sites (09S - 12S) (Figure 6). At Bray-Curtis similarity measures of 50, each of the 3 groups divides into 2 (Figure 6). The groupings reveal distinct assemblages associated with the summit (17N) at higher elevations, while 14N was distinct from all the lower elevation sites on the northern aspect. Low elevation (shrubland and thicket sites 09S - 10S) and mid-elevation (forest sites 12S2 - 12S) of the southern aspect formed a distinct grouping.

Discussion
The level and higher taxon diversity of this study compares favourably with that of similar studies in the Cederberg and Drakensberg mountains, both of which employ a protocol similar to this study. The Cederberg transect located in the Cape Floristic Kingdom includes 17 sites over a distance of 160 km. That study recorded 86 species in 24 genera (Botes et al. 2006). The transect in the grasslands of the Drakensberg, with 9 elevational sites over a distance of 104 km along the Sani Pass, collected 98 species in 28 genera and 7 subfamilies (Bishop et al. 2014). Only one other study of ants along an altitude exists for the Savanna Biome in South Africa, where Schoeman & Foord (2012) found 104 species in 29 genera along a 1000 m elevational range in the Marakele National Park. With a higher generic plant diversity than the Cape Floristic Kingdom (Hahn 2006) and 90% of all spider families found in the Savanna Biome (Foord et al. 2011), the Soutpansberg is characterised by rich, higher taxon diversity.
Myrmicinae and Formicinae were the most diverse subfamilies. The most speciose genera were Tetramorium, Camponotus,Pheidole and Monomorium. This conforms to results from other studies in South Africa (Botes et al. 2006). Monomorium is very diverse in Australia, while Camponotus and Pheidole are the most diverse in Brazil (Campos et al. 2011), although the highly diverse genus in Australia, Polyrhachis, is only represented by two species along this transect. Except for Lepisiota, genera found throughout the transect belong to cosmopolitan genera (Camponotus, Monomorium, Pheidole and Tetramorium).
Most of the species accumulation curves of predicted richness based on 1000 pitfall samples reached an asymptote. There were two exceptions: a woodland site 14N and sedgeland site 16S, both of which also had the lowest coverage. Although 14N is in the woodland vegetation type, it is near the ecotone between sedgeland and woodland. The large turnover of taxa at this site could be the result of mass effects from taxa found in sedgeland. The steep slope of the 16S accumulation curve might suggest a temporal change in the ant assemblages of this site. Based on photographic records at each of the pitfalls, the Coleochloa species that dominate this site are being invaded by short woody shrubs. Turnover at this site might be linked to this encroachment and could probably lead to increased abundance of taxa associated with sites that are structurally more complex, such as forest sites 12S and 12S2 and shrubland site 9S. This has particularly important implications for the management of the few remaining grassland habitats in the Soutpansberg.
The high diversity of Ponerinae species at the base of southern aspect might be due to more productive ecosystems associated with the basalt intrusions, and higher rainfall. Disturbance also seems to positively impact Ponerine richness, which peaks in shrubland site 9S. This site is inside a wildlife sanctuary that is stocked with buffalo and where the bush is mechanically cleared. The three major groupings of ant assemblages across the study area conform to the broad structural classification of the vegetation used in this study (Edwards 1983).
Conclusion
This study provides a thorough inventory of ground-dwelling ants, with a sample coverage of 0.98. The sample coverage represents the proportion of the total number of individuals in the ant assemblage along the transect that belongs to the species represented in our sample (Chao & Jost 2012). Extrapolated richness for most sites reached an asymptote, except for three sites. All three of these sites can be considered to be sites that have experienced increased levels of bush encroachment. This is particularly concerning at 16S, which represents some of the last remaining grassland habitats in the Soutpansberg.
Ant taxa that act as indicators of bush encroachment should be identified in order to monitor the rate of these impacts. A single site on the lowest elevation of the southern aspect (09S) yielded 57% of the total ant species. This site experiences higher levels of disturbance through herbivory and bush clearing and provides support for the important role of disturbance as a driver of ant diversity in the Savanna Biome. The structural classification of vegetation in this study is a good predictor of broad-scale ant assemblage structure. Finer scale distinctions were linked to elevation, structural elements and temperature.
Acknowledgments
Special thanks to Alan Andersen and Hendrick Sithole for verifying ant identifications. We are grateful to Ian Gaigher (Lajuma Research Centre), Steven Fick (Koedoesvlei Farm) and Dave Dewsnap (Goro Nature Reserve) for providing access to their farms. Several volunteers from the University of Venda and Lajuma Research Centre are thanked for their assistance in the field. This study was funded by the DST-NRF Center of Excellence for Invasion Biology and the University of Venda.
Competing interests
The authors declare that they have no financial or personal relationships which may have inappropriately influenced them in writing this article.
Authors' contributions
T.C.M. (University of Venda) and S.H.F. (University of Venda) were responsible for the project design. T.C.M. identified the specimens. T.C.M. and S.H.F. performed the analysis and wrote the manuscript.
References
Abensperg-Traun, M. & Steven, D., 1995, 'The effects of pitfall trap diameter on ant species richness (Hymenoptera: Formicidae) and species composition of the catch in a semi-arid eucalypt woodland', Journal of Ecology 20(2), 282-287. [ Links ]
Andersen, A.N. & Majer, J.D., 2004, 'Ants show the way Down Under: Invertebrates as bioindicators in land management', Frontiers in Ecology and the Environment 2(6), 291-298. http://dx.doi.org/10.1890/1540-9295(2004)002[0292:ASTWDU]2.0.CO;2 [ Links ]
Bishop, T.R., Robertson, M.P., Van Rensburg, B.J. & Parr, C.L., 2014, 'Elevation-diversity patterns through space and time: Ant communities of the Maloti-Drakensberg Mountains of southern Africa', Journal of Biogeography 41, 2256-2268. http://dx.doi.org/10.1111/jbi.12368 [ Links ]
Bolton, B., 1994, Identification Guide to the Ant Genera of the World, Harvard University Press, Cambridge, Massachusetts. [ Links ]
Botes, A., Mcgeoch, M.A., Robertson, H.G., Van Niekerk, A., Davids, H.P. & Chown, S.L., 2006, 'Ants, altitude and change in the northern Cape Floristic Region', Journal of Biogeography 33, 71-90. http://dx.doi.org/10.1111/j.1365-2699.2005.01336.x [ Links ]
Brady, S.G., Fisher, B.L., Schultz, T.R. & Ward, P.S., 2014, 'The rise of army ants and their relatives: diversification of specialized predatory doryline ants', BMC Evolutionary Biology 14(5), 93. http://dx.doi.org/10.1186/1471-2148-14-93 [ Links ]
Campos, R.I., Vasconcelos, H.L., Andersen, A.N., Frizzo, T.L.M. & Spena, K.C., 2011, 'Multi-scale ant diversity in savanna woodlands: an intercontinental comparison', Austral Ecology 36, 983-992. http://dx.doi.org/10.1111/j.1442-9993.2011.02255.x [ Links ]
Cardoso, P., Erwin, T.L., Borges, P.A.V. & New, T.R., 2011, 'The seven impediments in invertebrate conservation and how to overcome them', Biological Conservation 144, 2647-2655. http://dx.doi.org/10.1016/j.biocon.2011.07.024 [ Links ]
Chao, A. & Jost, L., 2012, 'Coverage-based rarefaction and extrapolation: standardizing samples by completeness rather than size', Ecology 93, 2533-2547. http://dx.doi.org/10.1890/11-1952.1 [ Links ]
Clarke, K.R. & Gorley, R.N., 2006, PRIMER v6: User Manual/Tutorial. PRIMER-E, Plymouth. [ Links ]
Colwell, R.K., 2013, EstimateS: Statistical estimation of species richness and shared species from samples. Version 9. Persistent URL <purl.ocls.org/estimates> [ Links ].
Edwards, D., 1983, 'A broad-scale structural classification of vegetation for practical purposes', Bothalia 14, 705-712. [ Links ]
Foord, S.H., 2008, 'Cladistic analysis of the Afrotropical Hersiliidae (Arachnida: Araneae) with the first records of Murricia and the description of a new genus from Madagascar', Journal of Afrotropical Zoology 4, 111-142. [ Links ]
Foord, S.H., Dippenaar-Schoeman, A.S., Haddad, C.R., Lotz, L.N. & Lyle, R., 2011, 'The faunistic diversity of spiders (Arachnida: Araneae) of the Savanna Biome in South Africa', Transactions of the Royal Society of South Africa 66, 170-201.http://dx.doi.org/10.1080/0035919X.2011.639406 [ Links ]
Hahn, N., 2002, 'Endemic flora of the Soutpansberg', MSc thesis, Faculty of Science and Agriculture, University of KwaZulu-Natal. [ Links ]
Hahn, N., 2006, 'Floristic diversity of the Soutpansberg, Limpopo Province, South Africa', PhD thesis, Faculty of Natural and Agricultural Sciences, University of Pretoria. [ Links ]
Hölldobler, B. & Wilson, E.O., 1990, The Ants, Harvard University Press, Cambridge, Massachusetts. http://dx.doi.org/10.1007/978-3-662-10306-7 [ Links ]
Kirchhof, S., Kramer, M., Linden, J. & Richter, K., 2010, 'The reptile species assemblage of the Soutpansberg (Limpopo Province, South Africa) and its characteristics', Salamandra 46, 147-166. [ Links ]
Munyai, T.C. & Foord, S.H., 2012, 'Ants on a mountain: spatial, environmental and habitat associations along an altitudinal transect in a centre of endemism', Journal of Insect Conservation 16(5), 677-695. http://dx.doi.org/10.1007/s10841-011-9449-9 [ Links ]
Ness, J.H., Bronstein, J.L., Andersen, A.N. & Holland, J.N., 2004, 'Ant body size predicts dispersal distance of ant-adapted seeds: Implications of small-ant invasions', Ecology 85, 1244-1250. http://dx.doi.org/10.1890/03-0364 [ Links ]
Schmidt, C.A. & Shattuck, S.O., 2014, 'The Higher Classification of the Ant Subfamily Ponerinae (Hymenoptera: Formicidae), with a Review of Ponerine Ecology and Behavior', Zootaxa 3817(1), 001-242. http://dx.doi.org/10.11646/zootaxa.3817.1.1 [ Links ]
Schoeman, C.S. & Foord, S.H., 2012, 'A checklist of epigaeic ants from Marakele National Park, Limpopo Province, South Africa (Hymenoptera: Formicidae)', Koedoe 54(1), 1-7. http://dx.doi.org/10.4102/koedoe.v54i1.1030 [ Links ]
Tshiala, M.F., Olwoch, J.M. & Engelbrecht, F.A., 2011, 'Analysis of Temperature Trends over Limpopo Province, South Africa',Journal of Geography and Geology 3, 13-21. http://dx.doi.org/10.5539/jgg.v3n1p13 [ Links ]
Van Wyk, A.E. & Smith, G.F., 2001, Regions of Floristic Endemism in Southern Africa, Umdaus Press, Pretoria. [ Links ]
Ward, P.S., 2010, 'Taxonomy, phylogenetics, and evolution', in L. Lach, C.L. Parr & K.L. Abbott (eds.), Ant Ecology, pp. 3-17, Oxford University Press, New York. [ Links ]
Wielgoss, A., Tscharntke, T., Rumede, A., Fiala, B., Seidel, H., Shahabuddin, S. et al., 2014, 'Interaction complexity matters: Disentangling services and disservices of ant communities driving yield in tropical agroecosystems', Proceedings of the Royal Society B: Biological Sciences 281, 2013-2144. [ Links ]
 Correspondence:
Thinandavha Munyai
Private Bag X5050, Thohoyandou 0950
South Africa
caswell.munyai@univen.ac.za
Received: 22 July 2014
Accepted: 20 Nov. 2014
Published: 30 Mar. 2015
Appendix 1
Appendix 2
Appendix 3

