


Servicios Personalizados
Articulo
 Inglés (pdf)
 Articulo en XML
 Referencias del artículo
Indicadores

Links relacionados
-
 Citado por Google
 -
 Similares en Google
Compartir

 Permalink
Koedoe
versión On-line ISSN 2071-0771
versión impresa ISSN 0075-6458
Koedoe vol.54 no.1 Pretoria ene. 2012
http://dx.doi.org/10.4102/KOEDOE.V54I1.1047
ORIGINAL RESEARCH
DOI:10.4102/KOEDOE.V54I1.1047
Large herbivore population performance and climate in a South African semi-arid savanna
Armin H. SeydackI; Cornelia C. GrantII; Izak P. SmitII; Wessel J. VermeulenI; Johan BaardI; Nick ZambatisII
IScientific Services, Garden Route National Park, South African National Parks, South Africa
IIScientific Services, Kruger National Park, South African National Parks, South Africa
ABSTRACT
Long-term population performance trends of eight large herbivore species belonging to groups of disparate foraging styles were studied in the semi-arid savanna of the Kruger National Park, South Africa. Over the past century the number of bulk feeders (buffalo, waterbuck, blue wildebeest and plains zebra) had increased towards comparatively high population densities, whereas population numbers of selectively feeding antelope species (sable antelope, roan antelope, tsessebe and eland) declined progressively. Detailed analyses revealed that population numbers of buffalo and waterbuck fluctuated in association with food quantity determined by rainfall. Population performance ratings (1944-2003) of the species for which forage quality was important (blue wildebeest, zebra and selective grazers) were correlated negatively with minimum temperature and positively with dry-season rainfall.
Interpretation according to a climate-vegetation response model suggested that acclimation of forage plants to increasing temperature had resulted in temperature-enhanced plant productivity, initially increasing food availability and supporting transient synchronous increases in population abundance of both blue wildebeest and zebra, and selective grazers. As acclimation of plants to concurrently rising minimum (nocturnal) temperature (Tmin) took effect, adjustments in metabolic functionality occurred involving accelerated growth activity at the cost of storage-based metabolism. Growth-linked nitrogen dilution and reduced carbon-nutrient quality of forage then resulted in phases of subsequently declining herbivore populations. Over the long term (1910-2010), progressive plant functionality shifts towards accelerated metabolic growth rather than storage priority occurred in response to Tmin rising faster than maximum temperature (Tmax), thereby cumulatively compromising the carbon-nutrient quality of forage, a key resource for selective grazers.
The results of analyses thus revealed consistency between herbivore population trends and levels of forage quantity and quality congruent with expected plant metabolic responses to climate effects. Thus, according to the climate-vegetation response model, climate effects were implicated as the ultimate cause of large herbivore population performance in space and over time.
CONSERVATION IMPLICATIONS: In its broadest sense, the objective of this study was to contribute towards the enhanced understanding of landscape-scale functioning of savanna systems with regard to the interplay between climate, vegetation and herbivore population dynamics
Introduction
The abundance of herbivore communities in African savannas is determined principally by the availability of food resources of adequate quality (East 1984; Fritz & Duncan 1994; Sinclair, Dublin & Borner 1985). The influence of rainfall, especially during the dry season, on the availability of forage of adequate quality and large herbivore population performance has been recorded in numerous studies (inter alia De Bie 1991; Dunham, Robertson & Grant 2004; Mduma, Sinclair & Hilborn 1999; Mills, Biggs & Whyte 1995; Owen-Smith & Ogutu 2003). However, in many studies the emphasis is placed on top-down control of herbivore populations through predation (Owen-Smith & Mills 2006; Owen-Smith & Mills 2008a). Large herbivore population trends in the Kruger National Park (KNP) over the past century have been characterised by a notable dichotomy: a progressive increase of the three main bulk-feeding large herbivore species, namely blue wildebeest (Connochaetes taurinus), zebra (Equus burchelli) and buffalo (Syncerus caffer), stabilising at relatively high population densities, and the population decline of four selectively feeding species, namely sable antelope (Hippotragus niger), roan antelope (Hippotragus equinus), tsessebe (Damaliscus lunatus lunatus) and eland (Taurotragus oryx). Initial population increases of bulk-feeding antelope and browsing species during the first half of the twentieth century were attributed largely to population recovery from decimation by hunting and epizootics (Joubert 2007a; Pienaar 1963). Impacts by boundary fencing of the park, culling operations and water provisioning further shaped population abundance and spatial distributions of some species (Joubert 2007a, 2007b). Furthermore, ongoing impacts by predation and climate (rainfall) on large herbivore population abundance in the KNP have been documented (Dunham et al. 2004; Harrington et al. 1999; Joubert 2007a, 2007b; Owen-Smith & Ogutu 2003; Owen-Smith, Mason & Ogutu 2005; Owen-Smith 2008; Whyte & Joubert 1988).
The long-term and spatially widespread nature of population trends, however, suggested that over-arching landscape-scale influences may not as yet have been accounted for in currently available studies. A greater role of climate effects as a long-term landscape-scale factor was therefore implicated. In this context, dry-season rainfall and ambient temperature were considered important climate variables. Ambient temperatures have been increasing progressively over the past century (Figure 1), with minimum (nocturnal) temperature (Tmin) having increased more steeply than maximum (daytime) temperatures (Tmax) (Houghton et al. 1996). Accordingly, in this study we explored to what extent climate-vegetation responses could plausibly explain diverse and divergent spatiotemporal patterns in population performance of eight large herbivore species with divergent forage requirements in a semi-arid savanna system. Preliminary assessments had revealed large herbivore species groups with similar within-group population trends over time. These appeared to be matched by commonalities of habitat preferences (with regard to altitude, underlying geology, northern compared with southern KNP) and features of nutritional ecology [Seydack et al. 2012; for roughage bulk feeders such as buffalo and waterbuck, see Hofmann (1973, 1989); for short-grass preference grazers such as blue wildebeest and zebra, see Bodenstein, Meissner and Van Hoven (2000) and Grange and Duncan (2006); for selectively feeding antelope species such as sable, roan, tsessebe and eland, see Skinner and Chimimba (2005)]. The study involved three components:
• establishing correlations (patterns) between herbivore population performance trends and climate features (rainfall, temperature)
• application of the climate-vegetation response model (Seydack et al. 2012), which defined the expected effects of climate on key indices of forage availability for herbivores (process) towards the interpretation of herbivore population performance patterns in space and over time
• exploring the degree of consistency with which climate-controlled forage quantity and quality can explain correlations between climate and herbivore population trends.
Through such pattern/process matching the output of this study is intended to represent an explanatory framework that may effectively serve to direct further research in pursuit of rigorous verification of inferred causal linkages. The results of this study were interpreted and discussed in the context of making a contribution towards the ongoing endeavour to disentangle the relative effects of bottom-up control (nutrition) compared with top-down regulation (predation) of large herbivore abundance in African savannas. In its broadest sense, the objective of this study was to contribute towards the enhanced understanding of landscape-scale functioning of savanna systems with regard to the interplay between climate, vegetation and herbivore population dynamics.
Study area
The Kruger National Park (KNP) is situated in north-eastern South Africa and represents a large (approximately 2 000 000 ha) semi-arid savanna system, covering an altitudinal range of between 200 m a.s.l. and 700 m a.s.l. The KNP south of the Olifants River falls within the lowveld bushveld climatic zone (500 mm - 700 mm rain per year), whilst northern areas fall within the northern arid bushveld zone (300 mm - 500 mm rain per year) (Venter, Scholes & Eckhardt 2003). Rainfall is concentrated in the austral summer, between October and April. High temperatures are experienced (mean annual temperature = 21.9 °C), with winters generally being frost free (Venter et al. 2003).
The park is longitudinally subdivided into granitic substrates forming relatively nutrient-poor sandy soils in the west and more nutrient-rich basalt-derived clay soils in the east (Venter et al. 2003). The savanna vegetation on nutrient-poor substrates tends to be dominated by trees of Combretaceae (e.g. Combretum and Terminalia species) and Caesalpineaceae, whereas those on more nutrient-rich clay soils are dominated by trees of Mimosaceae - especially Acacia species (Gertenbach 1983; Venter et al. 2003). The vegetation of the northern KNP is characteristically dominated by mopane (Colophospermum mopane) in tree or shrub form (Gertenbach 1983; Venter et al. 2003). The herbaceous layer of the KNP is dominated by C4 grass species (Kennedy, Biggs & Zambatis 2003) and the more nutrient-rich savanna vegetation types on clay soils carry dense stands of nutritious, high-bulk grasses (Venter et al. 2003).
Materials and methods
Pattern/process matching
The meaningful assessment of climate effects on long-term herbivore population performance requires suitable data spanning time periods containing sufficient replication of population abundance to climate variability. The nature, quality and comparability of such data are generally variable, ranging from mere population performance trend ratings to reasonably accurate census estimates. Accordingly, there is limited scope for sophisticated statistical analyses that directly link herbivore population numbers and climate. In this study we explored correlations between herbivore population performance trends and climate through pattern/process matching; that is, through establishing to what extent climate-herbivore population trend correlations (pattern) were consistent with expected climate effects on forage availability over time and space (process). The expected climate effects were made explicit through the development of a climate-vegetation response model, where existing knowledge, inter alia through literature review and local research, was interpreted and synthesised to produce a framework that outlined how vegetation response to climate was expected to shape forage quantity and quality (Seydack et al. 2012). In accordance with this approach, this study involved three main components. Firstly, spatiotemporal patterns of herbivore population performance trends were established and associations with climate variables assessed (pattern). The impact of vegetation responses to climate on indicators of forage availability parameters and species-specific requirements of the herbivores in respect of forage quantity and quality were then defined through the climate-vegetation response model (process). We then inferred causality of climate-herbivore population patterns from the consistency with which parameters of forage availability, as shaped by vegetation response to climate, could explain correlations between climate and herbivore population trends.
Patterns in herbivore population performance
Population performance trends
The eight large herbivore species selected for this study were chosen to represent contrasting demographic patterns and feeding styles. Bulk-grazing species included the African buffalo, blue wildebeest and plains zebra. Less common than the three principal bulk-feeding species, the waterbuck, was selected to represent a habitat specialist with a contrasting feeding style to the selective grazers. The four antelope species grouped as selectively feeding species were sable antelope, roan antelope, tsessebe and eland. Archival annual reports were perused for population trend observations and estimates [Ludorf 1918; Archives (Skukuza) 1946-1952; Steyn 1953-1961; Archives (Skukuza) 1902-1945]. Population estimates for the period 1961-1976 were furthermore retrieved from scientific services records (see Joubert 1976; Joubert & Bronkhorst 1977; Pienaar 1963; Whyte & Joubert 1988). Population counts conducted by fixed-wing aircraft of most of the larger ungulates in the KNP were undertaken irregularly between 1965 and 1975 and annually from 1977 to 1997. The full extent of the KNP was covered only between 1980 and 1993, with total aerial coverage being pursued every year between May and August using four observers. Parallel strips of about 800 m wide (400 m on each side) were flown at 65 m - 70 m above ground level (Viljoen 1996). Since 1998 aerial census counts were undertaken at relatively low sampling intensities (Kruger, Reilly & Whyte 2008), using the distance sampling method (Buckland et al. 1993). After 1993 population estimates of the four rare antelope species for the years 2005/2006 were extracted from Whyte (2007). African buffalo counts had been conducted separately by using a helicopter to split herds into smaller groups and then photographing them. Animals on the photographs were then counted with visual aids.
Spatiotemporal patterns
To gain greater understanding of factors that controlled population performance of the species studied, an analysis of habitat preferences in respect of altitude and soil nutrient status was carried out. Between one and three burn blocks in the park were combined to form 123 compartments or spatial units for analyses (northern KNP: 1-65; southern KNP: 66-123). Each unit was created to encompass only a restricted range in altitude and was relatively homogeneous with regard to underlying geology. The average size of units was 154 km2, generally ranging between 70 km2 and 370 km2. For each unit, representative variable means were determined in respects of kernel population densities of the eight study species in 1977, 1980, 1986, 1990 and 1993 (for buffalo: 1986, 1990, 1993, 1999 and 2004), long-term rainfall, altitude and soil nutrient status.
Animal density distribution patterns were smoothed by converting the point-based census data to a 0.5-km grid using kernel densities with a 5-km search radius. The kernel function was based on the quadratic kernel function described in Silverman (1986). Mean altitudes for units of analysis were derived from a digital elevation model (Environmental Systems Research Institute 2006). Long-term rainfall was based on spline interpolation of long-term average rainfall of 23 ranger posts distributed across the park. Mean nutrient status ratings for spatial units of analysis were computed based on geology (Venter et al. 2003) and vegetation indicators of nutrient availability according to the landscape vegetation units of Gertenbach (1983). For the same geological substrate soil nutrient status was further differentiated according to the predominance of the following tree species in order of decreasing nutrient availability indication: fine-leaved Acacia species > Colophospermum mopane (clay soil) > Combretum species (Scholes & Walker 1993; Venter et al. 2003). Weighted means according to proportional spatial representation of soil nutrient availability ratings were calculated for each unit of analysis. The following soil nutrient availability ratings were applied:
• 1: Sandveld communities
• 2: granites with prominence of Combretum species
• 3: granites with prominence of Colophospermum mopane; vegetation associated with Lebombo north and south
• 4: thickets of Sabi and Crocodile Rivers
• 5: vegetation communities on gabbro, shales and amphibolites
• 6: basalts with dominance of Colophospernum mopane
• 7: basalts with prominence of Acacia species.
Multiple regression analyses of population densities on altitude and soil nutrient status were performed for the northern and southern KNP separately, corrected for spatial autocorrelation as required. Three types of regression analysis were applied, namely ordinary least squares, spatial lag model and spatial error model (Anselin 2005). The spatial neighbourhood had to be defined for each of the two spatial regression models: neighbouring polygons of all those sharing sides (rook contingency) or neighbouring polygons sharing a side or only a vertex (queen contingency). The spatial regression decision process based on the Lagrange multiplier test statistic was used to identify which of the models produced the most reliable results (Anselin 2005). Whenever one of the spatial models was selected, owing to the presence of spatial autocorrelation, Akaike information criteria were used to identify whether the rook or queen contingency models gave the best result.
Climate and herbivore population performance
Two types of analysis were conducted to explore any associations between climate variables and herbivore population performance. One was based on the population trends as reconstructed from historical records and extant census data over the period 1944-2003 and the other involved repeated measures analysis of variance (ANOVA) of actual census data from 1977 to 2005/2008, differentiated according to north-south subregions and altitude.
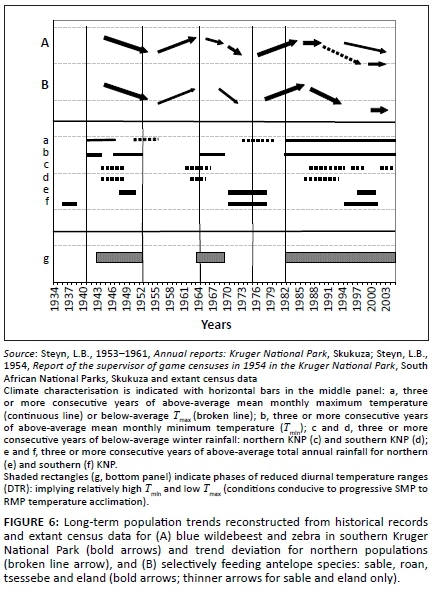
For the analysis of association of climate and herbivore population performance between 1944 and 2003 we reconstructed the temporal population trends for the groups of wildebeest/zebra, selective grazer species, buffalo and waterbuck from historical observations or population estimates (1944-1976) and census data (1977-2003). The temporal population performance trends were interpreted according to the following four categories, with assigned rank variables given in parentheses: decreasing (1); remaining low (2); high or sustained at relatively high levels (3); increasing (4). Spearman rank correlation analyses were performed between these rank variables and Tmax, Tmin, annual rainfall and mean monthly dry-season rainfall (April-September). Variable means for groups of two consecutive years were used, resulting in n = 30 for the period of analysis spanning 60 years. Analyses were differentiated according to northern and southern KNP in respect of the blue wildebeest and zebra group and performed in respect of three time lag periods (zero-, two- and four-year time lags).
Since the Spearman rank analyses implicated that temporal population trends were linked to climate, we further performed a series of repeated measures ANOVAs to explore space-time (climate) interactions. For this purpose we defined strata formed by grouping neighbouring units of analyses (compartments as described above). These strata, defined with regard to subregions on a north-to-south gradient and altitude groupings, thus contained replicates represented by neighbouring units of sampling (Legendre & McArdle 1997). Partly depending on data availability, three separate repeated measures ANOVAs were performed in respect of population density estimates determined for the relevant compartments and species or species groups from aerial survey census data:
• For blue wildebeest and zebra, data were used from the subregions north (150 m a.s.l. - 550 m a.s.l.), central lower (150 m - 350 m), central upper (350 m - 550 m), southern lower (150 m - 350 m) and southern upper (350 m - 650 m), for the years 1980, 1986, 1990, 1993, 2002 and 2008.
• Further analyses of population density data from the northern KNP for the four selective grazer species, blue wildebeest and zebra involved three altitudinal groupings (low, middle and upper altitude) and the years 1977, 1980, 1986, 1990, 1993 and 2005. Because granites and basalts stretched over divergent altitudinal ranges and the distributions of certain species were concentrated on specific substrates, analyses specific for species-substrate combinations were performed: sable antelope on granites, roan and tsessebe on basalts, and blue wildebeest, zebra and eland over both substrates combined (altitudinal ranges for granites or basalts combined: low: 150 m a.s.l. - 300 m a.s.l.; mid-altitude: 300 m - 400 m; upper: 400 m - 550 m).
• Of the selective grazers only sable antelope occurred at sufficient population densities in both the northern and the southern KNP. Analyses were performed for the years 1980, 1986, 1990, 1993 and 2005, and the following spatial units: upper, middle and lower altitudes in the northern KNP, upper and lower altitudes in the central KNP, and upper south-facing as well as north-facing, middle and lower altitudes in the southern KNP.
Subregions along the north-to-south gradient represented areas of increasing rainfall (Venter et al. 2003) and altitudinal groupings have implications for the prevailing temperature regimes according to lapse rates of -0.777 °C.100 m-1 (Tmax) and -0.465 °C.100 m-1(Tmin), respectively (Schulze 1995). Given the extent of global warming over the past century (Figure 1), these lapse rates imply the equivalent to a lowering of the average altitude of the KNP of between 100 m and 200 m. The analyses described in this section were aimed at revealing patterns in population performance of the relevant herbivore species in respect of climate variables in space (north-south gradient: rainfall; altitude: temperature) and over time (climate data: South African Weather Service), as well as spatiotemporal interactions.
Climate-vegetation response model (process)
Development of an explanatory framework
Exploration of spatiotemporal patterns in population performance of eight large herbivore species had revealed three population performance response groups (i.e. groups of large herbivore species which shared broad-scale habitat preferences and similar population performance trends over time) and group-specific correlations with climate variables. A climate-vegetation response model had been developed representing a framework for the interpretation of these spatiotemporal patterns of herbivore population performance in relation to climate effects (Seydack et al. 2012). As part of the climate-vegetation response model, we (1) defined indicators of forage availability (quantity and quality), (2) established forage selection requirements characteristic of and unique to the three herbivore population performance response groups (herbivore species guilds of nutritional requirements), and (3) developed a plant-climate response process model. The resulting climate-vegetation response model defined the expected effects of climate on indices of forage availability (process effects), allowing us to make inferences that linked spatiotemporal patterns in herbivore population performance and climate (Seydack et al. 2012).
Key forage resource indicators
The climate-vegetation response model differentiates between three key indicators affecting forage availability to herbivores, namely nitrogen productivity, nitrogen quality and carbon-nutrient quality. Nitrogen productivity refers to the quantitative availability of forage items for herbivores of a given nitrogen quality (plant protein content) as a result of biomass production. High nitrogen quality of forage implies high nitrogen concentrations of plant tissues; that is, plant protein content not unduly diluted by structural or non-structural carbon and of relatively high digestibility. Carbon-nutrient quality forage items are characterised by relatively high concentrations of non-structural carbohydrates (TNC) and ash minerals resulting from metabolic allocation to storage under circumstances promoted by constrained growth (low temperatures, moisture stress: tw conditions), but sustained photosynthesis.
At the plant species level, andropogonoid grass species are physiologically predisposed to cope with pronounced seasonality (Osborne 2008). The associated physiological capacity of species of Andropogoneae for sustained metabolic performance at variable and lower resource levels (dry-season growth) underpins their metabolic scope for storage of metabolites (TNC and minerals). Andropogonoid grass species accordingly tend to produce forage of relatively high carbon-nutrient quality (Seydack et al. 2012).
Herbivore species guilds of nutritional requirements
As inferred from the nature of the diets of eight large savanna herbivore species (Bodenstein et al. 2000; Grange & Duncan 2006; Heitkönig & Owen-Smith 1998; Macandza, Owen-Smith & Cross 2004; Magome et al. 2008; Parrini 2006; Watson & Owen-Smith 2000), three herbivore species guilds of nutritional requirements were identified (Seydack et al. 2012): bulk feeders with tolerance to fibrous herbage (buffalo and waterbuck), bulk feeders with preference for high nitrogen-quality forage (short-grass preference grazers: blue wildebeest and zebra) and selective feeders for which dietary items of relatively high carbon-nutrient quality, notably in the dry season, represent key forage resources (selective grazers: sable antelope, roan antelope, tsessebe and eland).
Plant metabolic performance trade-off constraints
The principal trade-off in the context of the metabolic performance trade-off model (Seydack et al. 2012) is between maximised peak performance closely tracking and responsive to conditions of resource surplus (RMP: resource-responsive metabolic performance mode) and sustained performance when subject to conditions of varying resource levels or deficits (SMP: sustained metabolic performance mode). The capacity for maximum metabolic performance under conditions of resource surplus is at the cost of the capacity for sustained performance under conditions of resource deficits or fluctuations. In line with this reasoning, we expect a propensity towards the RMP mode under conditions of high and less fluctuating levels of temperature and water availability (TW conditions: combined relatively high and sustained levels of water and temperature during the growing season), whereas under conditions of fluctuating resource levels and pronounced deficits (with reference to temperature and water: tW or Tw conditions), the SMP mode would be expected to predominate. The relative expression of SMP to RMP mode functionality or acclimation is thus a function of the combined availability levels of temperature and water (TW resource levels or conditions). The higher the concurrent and uninterrupted levels of temperature and water available to plants, the more pronounced the intraspecific metabolic adjustment towards higher RMP mode functionality settings. Depending on the spatiotemporal nature of resource availability for plants (water and temperature resource levels and variability or seasonality), the relative expression of sustained to resource responsive metabolic performance is determined, shaping forage quantity and quality as a consequence of the relative prevalence of SMP-tW/Tw to RMP-TW plant functionality.
Plants in relative SMP mode are comparatively stress tolerant in order to cope with resource level fluctuations. As such their metabolism is capable of functioning at relatively low temperature and water availability/optima (SMP-tw functional efficiency). Such metabolic capacity is, however, associated with relatively high storage-to-growth allocation priority and comparatively high maintenance respiration costs (i.e. they are temperature sensitive). In contrast, plants in relative RMP mode are geared to the maximum use of surplus resource conditions, with functionality at relatively high temperature and water resource level optima and high growth-to-storage priority (Seydack et al. 2012). Thus, abundance of resources such as water, nutrients and temperature enhances RMP mode productivity, but increasing productivity (increased RMP-TW functionality) progressively reduces plant tissue quality for herbivores through nutrient dilution (An et al. 2005; Dwyer et al. 2007; 't Mannetje 1982, 1984; Mutanga et al. 2004; Van Soest, Mertens & Deinum 1978; Wilson 1982; Wilson & Ford 1971), reduction in digestibility ('t Mannetje 1984; Van Soest et al. 1978; Wilson 1982; Wilson & Ford 1973) and reduced allocation to storage (low TNC content; Estiarte & Peñuelas 1999; Herms & Mattson 1992; Van Soest et al. 1978).
Three main groups of process effects are involved in the climate-vegetation response model (CVRM): adjustments in plant metabolic performance (SMP-RMP functionality) settings shaping the spatial distribution of forage resources (CVRM-1), SMP-to-RMP temperature acclimation responses (CVRM-2), and spatiotemporal interactions in these effects (CVRM-3).
Spatial distribution of key forage resources (CVRM-1)
Following the climate-vegetation response model, plant metabolic adjustments to the north-south water availability and altitudinal temperature gradients are expected to determine the spatial distribution of SMP-to-RMP functionality settings across the KNP (Seydack et al. 2012). The general pattern is one of higher SMP mode functional expression in the drier, northern KNP and at higher altitudes, and advanced RMP functionality settings towards the south. As the SMP mode involves relatively growth-curbed, storage-based metabolism, the availability of forage of enhanced carbon-nutrient quality is accordingly expected to be relatively higher in the northern KNP and at upper altitudes. Plant metabolic performance at intermediate SMP-RMP functionality favours lower levels of nitrogen dilution and is associated with forage of relatively high nitrogen quality, especially of plants growing on nutrient-rich geological substrates (central KNP).
Climate-driven temporal trends in forage availability (CVRM-2)
Increasing Tmin is expected to stimulate nocturnal maintenance respiration (Wan et al. 2009), promoting temperature acclimation in order to restore the original steady-state respiration-to-photosynthesis ratio (Dewar, Medlyn & McMurtrie 1999). As temperature increases, leaf metabolic pools adjust until the original steady-state respiration-to-photosynthesis ratio is re-established. Leaf labile carbon, starch and protein pools decrease in response to increased temperature, eventually reaching a new, lower steady state, which is consistent with the general pattern of plant carbohydrate and soluble protein content being negatively correlated with growth temperature (Dewar et al. 1999; Wan et al. 2009). These acclimation responses represent intraspecific SMP to more RMP functionality shifts (SMP-to-RMP temperature acclimation).
According to the climate-vegetation response model both shorter-term transient temperature acclimation pulses (Figure 1: increasing temperature towards 1940; increasing towards 1960; increasing after 1975) and longer-term shifts towards advanced RMP functionality settings are predicted to have occurred in response to temperature trends over the past century (Figure 1; Seydack et al. 2012).
• CVRM-2.1: Pulses of increased forage availability due to increased productivity of quality forage induced by pseudo-cyclic phases of temperature increases (Figure 1: increasing towards 1940; increasing towards 1960; increasing post-1975). In response to rising Tmax, transient pulses of SMP productivity (SMP-P temperature acclimation phase state) occur when the temperature optima for plant functionality are still relatively low (tw metabolic activity). However, as acclimation to Tmin takes effect, increased RMP-TW metabolic activity of plants results in reductions in forage quality (low metabolic allocation to storage and increased nitrogen dilution) and thus forage availability. The complete SMP-RMP-SMP temperature acclimation sequence involves four temperature acclimation phase states: 1: SMP-t (SMP functionality at relatively low temperatures; Np ↓, Nq ↓, CNq ↑↑); 2: SMP-P (enhanced SMP productivity due to rising Tmax; Np ↑, Nq ↑, CNq ↑, SMP-tw efficiency ↑); 3: SMP-T (SMP functionality at relatively higher/increased temperatures; Np ↑, Nq ↑, CNq ↓); 4: RMP-T (RMP functionality at high temperatures; Np ↑, Nq ↓, CNq ↓↓, SMP-tw efficiency ↓), reverting to phase states 3: SMP-T (lower altitudes) or 1: SMP-t (upper altitudes) as ambient temperatures decrease again.1
• CVRM-2.2: Long-term progressive shifts towards relatively advanced RMP functionality settings in response to cumulative acclimation to increasing Tmin and declining diurnal temperature ranges. Trends of progressively deteriorating carbon-nutrient quality and increasing nitrogen productivity to nitrogen quality ratios (Np/Nq ↑) over the past century were accordingly anticipated (Figure 1).
These temperature acclimation responses were expected to have resulted in transient pulses of increased forage availability (increased landscape-scale availability of forage items of favourable nitrogen and carbon-nutrient quality), as well as the progressive long-term decline of carbon-nutrient quality of forage and an increasing nitrogen productivity/nitrogen quality ratio associated with advanced RMP functionality settings (Seydack et al. 2012).
Spatiotemporal interaction in forage availability (CVRM-3)
Accentuated temperature acclimation responses were predicted for circumstances where low and unpredictable water availability favoured the prevalence of SMP mode settings; that is, in northern relative to southern KNP. More pronounced associated effects on nitrogen quality and carbon-nutrient quality are thus expected towards the northern KNP, with attenuation or absence of such responses as relatively high RMP functionality settings already predominate towards the southern KNP. As plants are already functioning at higher RMP settings in the southern KNP, SMP-RMP-SMP temperature response pulses (SMP-RMP temperature acclimation sequences) are expected to be attenuated relative to those of the northern KNP, where pronounced associated pulses of forage availability are expected to be encountered (Seydack et al. 2012).
Results
Patterns in long-term population performance trends
Historical population trends
Pertinent features of historical trends (1900-1970) in population performance regarding the eight species under study can be summarised as follows:
• From a situation prevailing before about 1920-1930, where population abundance of selective grazers and bulk feeders was of similar orders of magnitude, the former generally declined progressively over subsequent decades, whereas the latter had generally increased over this time span (Figure 2: following Ludorf 1918; Pienaar 1963).
• A pronounced declining phase occurred for 10 or more years preceding the mid-1950s; involving, particularly, sable antelope, roan antelope, tsessebe, wildebeest and eland. The only grazers not to show this trend were buffalo. Population decreases were more severe in the southern and central KNP (Steyn 1953-1961; Steyn 1954). After this decline, only sable antelope sustained reasonable population numbers south of the Olifants River (Figure 2). Main source habitat centres and prospering populations of selectively feeding antelope species were consistently recorded in respect of higher-lying areas in the western boundary zone and further west of the park [Joubert 1976; Archives (Skukuza) 1902-1945].
• Zebra population numbers surpassed those of wildebeest during 1955-1970 and stabilised at higher levels than the latter, especially in the northern KNP (Joubert 2007a; Steyn 1954; Figure 2).
Extant population trends
Blue wildebeest and zebra had largely similar population performance trends over the time span, as depicted in Figures 3a and 3b. Clear divergence in performance trends between northern and southern populations was evident. In the south, population numbers of both species increased (1978-1992) and then seemed to have stabilised, fluctuating around some asymptotic carrying capacity level. The seemingly high year-to-year fluctuations since 1998 were taken to be largely the result of sampling inefficiencies (Kruger et al. 2008), partly associated with relatively low sampling intensities of the censuses during that time period (Figures 3a and 3b). After exhibiting parallel population increases and stabilisation as for southern populations, northern populations of both species were subject to prolonged decreases in their population numbers. It is also evident that wildebeest population performance in the north had been substantially poorer than south of the Olifants River (Figure 3a). Population trends of buffalo and waterbuck were broadly similar and showed no fundamental north-south divergence (Figures 3c and 3d). Population numbers of both species declined substantially subsequent to the 1991/1992 drought and increased in the years thereafter (Figures 3c and 3d).
Relatively superior demographic performance was clearly evident in northern populations of selectively feeding antelope species, especially regarding roan antelope, tsessebe and eland (Figures 4a-d), contrasting the performance of populations in the south, which had been reduced to low numbers earlier in the first half of the previous century (historical population trends). Sable antelope, tsessebe and eland had pronounced population increases in the northern KNP, followed by steep population declines for all four selectively feeding antelope species manifesting around 1986/1987. Southern populations of sable antelope, roan and tsessebe, already at relatively low levels, further decreased to exceptionally low numbers between 1990 and 1994 (Figures 4a-c). Overall, population performance trends amongst the four selectively feeding antelope species were broadly similar (Figures 4a-d). These trends differed from those of the four bulk-feeding species in that the population performance of selectively feeding antelope species progressively deteriorated after 1986 without significant recovery. In contrast, buffalo and waterbuck numbers recovered in the years after the 1991/1992 drought (Figures 3c and 3d). In conclusion, it transpired that the eight species under study could be assigned to three groups of broadly similar population performance trends: buffalo/waterbuck (Figures 3c and 3d), blue wildebeest/zebra (Figures 3a and 3b), and the four selectively feeding antelope species (Figures 4a-d).
Landscape-scale spatial patterns in population performance
Three species groups of similar spatiotemporal population preferences were confirmed. Selectively feeding antelope species characteristically preferred upper altitude habitat (Table 1 and Figure 5) and northern populations seemed to perform better than southern populations (Figure 4). Roan antelope and tsessebe were found in higher-lying parts of their preferred habitat of higher nutrient status (Table 1), as is evidenced by higher population concentrations on basalts in north-eastern parts of the park (Figures 5c-d). Bulk-feeding species did not exhibit preferences for upper altitude habitat and population performance was either higher in the southern (central) KNP (blue wildebeest and zebra: Figures 3a-b) or indifferent in this respect (buffalo and waterbuck: Figures 3c-d). Blue wildebeest and zebra, as expected for high nitrogen quality short-grass grazers, preferred nutrient-rich areas (Table 1), in contrast to buffalo and waterbuck (Table 1) with their capacity to tolerate forage of lower quality (Hofmann 1973, 1989). The species of these emerging population performance groups exhibited within-group congruence regarding their spatiotemporal habitat preferences and also of their population trends over time, resulting in three consistent population performance response groups (buffalo/waterbuck; blue wildebeest/zebra, and the four selectively feeding antelope species).
The spatial distribution of buffalo and waterbuck was not consistently related to the landscape-scale habitat niche factors explored (altitude, north-south plant SMP-to-RMP metabolic performance mode gradient, geological substrate), presumably because of the less exacting forage quality requirements of these two species. Comparatively stable population performance of blue wildebeest and zebra was encountered in the southern (central) KNP (Figures 3a-b), which coincides with the expected landscape-scale prevalence of high nitrogen quality forage items (CVRM-1: intermediate RMP-SMP-Tw functionality on nutrient-rich sites, associated with reduced incidence of nitrogen dilution of forage items with structural and non-structural carbon). The preference of selective grazers for upper altitude or northern KNP sites was congruent with SMP-tW functionality of plants, which is conducive to relatively high carbon-nutrient quality of forage items (CVRM-1). These results confirm that populations of the species belonging to the identified population performance response groups are spatially distributed in the landscape as expected and in accordance with group-specific nutritional requirements. In the next section, we explore whether group-specific herbivore population performance trends were consistent with expectation of climate effects on the relevant key indices of forage availability (nitrogen productivity, nitrogen quality, carbon-nutrient quality), thereby linking landscape-scale temporal patterns of herbivore population performance to climate according to the climate-vegetation response model.
Climate and herbivore population performance
Buffalo and waterbuck
Population trends of buffalo (Figure 3c) and waterbuck (Figure 3d) broadly followed inter-annually declining and increasing rainfall trends from 1981 to 1992 and 1993 to 2006, respectively. A positive association of population performance trend ratings of these species with periodic rainfall confirmed this (Table 2), as also found by Mills et al. (1995) and Owen-Smith and Ogutu (2003). Because buffalo and waterbuck do not have high forage quality requirements (Hofmann 1973, 1989), population densities appeared to be tracking forage quantity largely determined by rainfall. Both these species are water dependent and their need to remain close to or have sufficient access to significant open water sources may further have constrained forage availability during drought years (Smit 2011).
Blue wildebeest and zebra
The long-term population trends of wildebeest and zebra combined, as reconstructed from historical records and extant census data (Figures 3a-b), are shown in Figure 6 (line A) against climate variables. Population performance trend ratings over the relevant time span for these two species were found to be negatively correlated with Tmin (four-year lag) and positively with dry-season rainfall (two-year lag; Table 2). Wildebeest and zebra population increases had occurred (Figure 6, line A: c.1955-1963, 1977-1986) following time periods of below-average Tmax (Figure 6: broken line a) and associated phases of temperature increases (Figure 7a: 1953-1959, mid-1970s onwards). These periods of population increases also coincided with phases of sustained, relatively high diurnal temperature ranges (Figure 7a), whereas years of population decline (c.1944-1953, 1967-1974, 1991-2002) were partially preceded and associated with elevated Tmin [Figure 6: line b (middle panel)] and phases of reduced diurnal temperature ranges [Figure 6: shaded rectangles, line g (bottom panel)]. Such conditions were expected to initiate the SMP-RMP temperature acclimation sequence in accordance with the climate-vegetation response model (CVRM-2.1). With an increased availability of forage with high nitrogen quality as key resource, blue wildebeest and zebra populations initially increased during the SMP-P phase state and then declined as temperature acclimation progressed into the RMP-T phase state and nitrogen quality of forage was compromised (CVRM-2.1). Three such temperature acclimation sequences and associated population cycles (i.e. increasing and then declining populations) seem to have occurred during the past century (approximately bounded by periods 1910-1955, 1956-1975 and 1976-2002; see Figures 6 and 7). The first of the three sequences would have been predominated by the prolonged initial occurrence of the SMP-t phase state (CVRM-2.1) owing to comparatively low atmospheric temperatures (Figure 1). According to the climate-vegetation response model, the associated conditions of reduced nitrogen productivity and relatively low nitrogen quality of available forage items (due to nitrogen dilution by non-structural carbohydrates) were expected to be unfavourable for the population performance of wildebeest and zebra. Their comparatively low population numbers at the time (1918: Figure 2) are consistent with expectations in this regard.
Spatiotemporal interactions in population performance along a north-south gradient were detected (Figure 8; time period: F = 12.87, df = 5, p < 0.000001; time period × species: F = 0.49, df = 5, p = 0.78; time period × subregions: F = 6.42, df = 20, p < 0.000001). In the northern KNP the population cycle was accentuated in that relatively high population peaks were achieved (1986), with population numbers declining to particularly low numbers later (2002/2008). In the central lower KNP population densities stabilised at pre-increase levels (1980) but in southern lower KNP no increase or decline cycle was evident (Figure 8). Also, the population cycle in southern upper KNP was attenuated in comparison with that seen in central upper KNP. These patterns are consistent with predictions of the climate-vegetation response model. SMP-to-RMP acclimation sequences (CVRM-2.1) underpinning the associated herbivore population cycles are expected to be accentuated where SMP mode settings are most pronounced (northern KNP) and much attenuated or absent with relative prevalence of RMP mode settings of the vegetation southwards (CVRM-3: reduced temperature acclimation response in plants with prevalence of RMP mode settings).
In the KNP overall, blue wildebeest numbers were higher than those of zebra during the first of the three reconstructed population cycles (Steyn 1954) and also at peak numbers of the second cycle (1963: Figure 2b). Thereafter, zebra population numbers remained higher than those of blue wildebeest (Figures 2 and 3a-b). This is in agreement with the greater tolerance of zebra to declining nitrogen quality of suitable forage (Bodenstein et al. 2000; Smuts 1972). With generally rising atmospheric temperatures since about 1910 (Figure 1) nitrogen productivity of especially C4 grasses would have increased, but at the cost of nitrogen quality (climate-vegetation response model). The ratio of nitrogen productivity to nitrogen quality thus increased progressively (CVRM-2.2), resulting in more and spatially extended availability of forage with comparatively reduced nitrogen quality. This disproportionately favoured the increase of zebra relative to blue wildebeest abundance.
Selectively feeding antelope species
Elevated Tmin and reduced levels of dry-season rainfall were found to be associated with poor population performance of selectively feeding antelope species [Table 2; Figure 6: line B (top panel), with reference to lines b and c (middle panel)]. The negative impact manifested in reduced population densities with some time lag (Table 2). Reconstructed population trends for the four selective grazer species manifesting in the northern KNP were crudely synchronous with those of blue wildebeest and zebra, exhibiting three cycles of increasing/declining population numbers over the past century (Figure 6: Line B). These periods of peak abundance followed phases of increasing temperature and reduced diurnal temperature ranges (DTRs: Tmax- Tmin; Figure 7a). The population cycles were thus in temporal concordance with pulses of temperature increases (Figure 7a), which were expected to initiate SMP-RMP temperature acclimation sequences (CVRM-2.1). During the initial stage of increasing temperature, Tmax is comparatively high relative to Tmin (increased DTR: Figure 7a). The associated SMP-P acclimation phase state (enhanced SMP mode productivity) supports increasing nitrogen productivity of forage of sustained nitrogen quality, and notably of increased carbon-nutrient quality of dry-season forage (CVRM-2.1), thereby forming the basis for increases of selective grazer and blue wildebeest/zebra population numbers alike (Figure 6; 1978-1986: Figures 4a-d). As temperature acclimation to nocturnal warming (rising Tmin) takes effect, CN-quality of forages declines during the SMP-T phase state (CVRM-2.1), resulting in population declines of selective grazers (Figure 6, Line B: after mid 1940s, mid 1960s and 1986; Figures 9a-d). This phase state is, however, still favourable for nitrogen quality forage (CVRM-2.1), the key resource for blue wildebeest and zebra, and thus their populations continued to prosper, expanding into upper-altitude habitat (Figures 9e-f, 1986-1990/1993). As temperature acclimation progressed to the final RMP-T phase state, both nitrogen quality and carbon-nutrient quality of forage were substantially compromised, resulting in declining populations also of blue wildebeest and zebra (Figures 9e-f). Forage of higher carbon-nutrient quality, a key resource for selective grazers, is expected under conditions of lower temperature, that is, higher altitudes (CVRM-1), which explains the preference of selective grazers species for upper-altitude habitat (Table 1, Figures 5, 9a-d and 10). Population declines of these species were, accordingly, also less pronounced at higher altitudes (Figures 9a-d; time period × altitude class interactions: p = 0.15; 0.0002; 0.03; 0.62; values indicate that population performance over time is not independent of altitude in the case of sable antelope, tsessebe and roan antelope).
Of the four selectively feeding antelope species, only sable antelope occurred in substantial numbers in the southern KNP during the time period representing the third population cycle. Whereas northern population abundance of these species exhibited a pronounced population cycle between 1978 and 1994 (Figures 4a-d), a similar pattern in sable antelope numbers in the southern KNP was comparatively attenuated and somewhat delayed (Figure 4a; for tsessebe, see Figure 4c). The relatively attenuated nature of population cycles in the southern KNP (CVRM-3), as also exhibited by blue wildebeest and zebra populations, is attributed to a reduced SMP-to-RMP temperature acclimation response owing to the relative prevalence of RMP mode settings (already) applicable to the area (CVRM-1). Sable antelope population densities in the southern KNP at upper altitudes (Pretoriuskop area) (Figure 10: upper south-facing and north-facing; 450 m a.s.l. - 650 m a.s.l.) were apparently sustained at levels similar to those historically encountered over larger areas towards lower altitudes [Figure 2a: 1918; Archives (Skukuza) 1902-1945]. The comparatively favourable population performance of sable antelope populations in the Pretoriuskop area is attributed to conditions supporting carbon-nutrient quality of forage items: comparatively high altitude, increased incidence of dry-season rainfall (mean monthly dry-season rainfall between 1982 and 2005: Letaba = 59 mm, Satara = 70 mm, Skukuza = 91 mm, Pretoriuskop = 104 mm), reduced SMP-to-RMP temperature acclimation response and the occurrence of andropogonoid grass species (cf. Le Roux 2010: Heteropogon contortus/Hyperthelia dissoluta). However, population densities progressively declined after 1990 (Figure 10), apparently more so in predominantly north-facing areas. Temperature conditions had been deteriorating progressively towards and beyond 1990. Increasing Tmin and decreasing diurnal temperature ranges (Figure 7b) and further SMP-to-RMP temperature acclimation (more pronounced RMT-T phase states) would have particularly compromised carbon-nutrient quality of forage plants. Accordingly, the associated observed decline in sable antelope population numbers was consistent with predictions of the climate-vegetation response model.
The crudely synchronous population cycles of blue wildebeest and zebra and the selective grazers (Figure 6), but long-term inverse population trends of these two groups (Figures 2a-b) represented a seemingly paradox result. However, the long-term increase of blue wildebeest and zebra, as nitrogen quality patch selectors, and the concurrent decline of antelope species selecting for carbon-nutrient quality plant parts (Figure 2a-b) were consistent with the predictions of the climate-vegetation response model. According to this model, increasing temperatures over the last eight to nine decades (with pronounced phases of temperature increases during approximately 1920-1940 and after about 1975: Figures 1 and 7) would have progressively enhanced nitrogen productivity and resulted in higher availability of nitrogen quality forage in the landscape for blue wildebeest and zebra owing to the predominance of the SMP-T phase state. (CVRM-2.1: nitrogen not diluted by high levels of storage-based carbohydrates, which is postulated to have applied before 1940 when the SMP-t acclimation phase state was expected to have predominated.) Concurrently, however, congruent with predictions of the climate-vegetation response model, acclimation of plants to progressively rising Tmin (nocturnal warming) since the 1910s (Figure 1) resulted in cumulative shifts of SMP-to-RMP functionality settings (CVRM-2.2). The associated metabolic allocation adjustments from storage towards growth priority were associated with reductions in the storage-based carbon-nutrient quality of forage in the landscape. Accordingly, the landscape-scale availability of carbon-nutrient quality forage, a key resource for selective grazers, would have declined (ongoing SMP-to-RMP temperature acclimation: CVRM-2.2), resulting in the long-term decline of their population numbers in the KNP.
Discussion
Linking climate-vegetation responses with large herbivore population performance
Initial assessments revealed the existence of three population performance response groups; that is, groups of large herbivore species which shared similar population performance trends over time (Figures 3 and 4: buffalo and waterbuck; blue wildebeest and zebra; sable antelope, roan antelope, tsessebe and eland). Member species of these groups also shared landscape-scale distribution patterns in relation to subregion on a north-to-south (rainfall) gradient, altitude and nutrient status based on the underlying geology. Perusal of relevant studies (herbivore species guilds of key nutritional requirements) further revealed that the species of the same population performance response groups had common key nutritional resource requirements (Seydack et al. 2012). This permitted the grouping of the eight species under study into congruent guilds: bulk feeders with tolerance to fibrous herbage (roughage bulk feeders: buffalo and waterbuck), bulk feeders with preference for high nitrogen quality forage (short-grass preference grazers: blue wildebeest and zebra) and selective feeders for which dietary items of high carbon-nutrient quality are of particular importance (selective grazers: sable antelope, roan antelope, tsessebe and eland). Accordingly, key nutritional requirements for these three population performance response groups related to the availability of forage quanity, nitrogen quality and carbon-nutrient quality, respectively. A climate-vegetation response model was developed, which defined the expected impact of climate on these key resources (Seydack et al. 2012).
According to the climate-vegetation response model forage quality is determined by the position of plant functionality on the SMP-RMP metabolic performance mode gradient (spatially: metabolic mode settings: CVRM-1; temporally: temperature acclimation sequences: CVRM-2). The SMP mode permits plant functionality at relatively low temperature and water availability levels, which supports storage-based nutrient accumulation and growth-curbed metabolic activity, resulting in comparatively high-quality forage. Plants in the RMP mode perform under conditions of high water and temperature levels, which results in low-quality forage. With the climate-vegetation response model being central to an explanatory framework, we proceeded to apply an approach of pattern/process matching where we explored the extent of consistency with which climate impacts on key nutritional resources (process) could explain spatiotemporal correlations between climate and herbivore population trends (pattern).
Whereas buffalo and waterbuck, grouped as roughage bulk feeders, seemed to be tracking forage quantity largely determined by rainfall (Table 2; Mills et al. 1995; Owen-Smith & Ogutu 2003), temperature and dry-season rainfall were identified as influential in determining the availability of quality forage in the landscape important for selective grazers and those that prefer short grasses. The importance of dry-season rainfall for these species has been identified in previous studies (Dunham et al. 2004; Owen-Smith & Ogutu 2003). However, the effectiveness of dry-season rainfall in determining the availability of quality forage in the landscape appears to be interdependent with the prevailing plant metabolic performance mode settings (spatial scale) and temperature acclimation responses (temporal scale), as controlled spatiotemporally by gradients of water availability and temperature effects.
According to the climate-vegetation response model, prevalence of the SMP mode in the arid northern KNP results in pronounced SMP-to-RMP temperature acclimation sequences (CVRM-2.1) in response to pulses of temperature increases [Figure 7a; broadly synchronous with temperature trends of the southern hemisphere (Figure 1)], thereby inducing accentuated population cycles of short-grass preference grazers (Figures 3a, b and 6) and selective grazers (Figures 4 and 6). Such pronounced temperature responses are expected since SMP mode plant functionality is sensitive to the impact of nocturnal warming on respiration (metabolic performance trade-off relationships) and pronounced phase states of temperature acclimation are associated with disproportionately enhanced (in SMP-P phase state) or reduced (RMP-T phase state) SMP-tw efficiency in responding to dry-season rainfall and producing high-quality forage in general. In the central KNP, with intermediate RMP-SMP mode settings and higher actual dry-season rainfall, a postulated favourable product of SMP-tw efficiency and dry-season rainfall seems to support the relatively sustained population performance of blue wildebeest and zebra. The higher rainfall in the southern KNP underpinned relative RMP mode settings (CVRM-1), which are inherently associated with poorer forage quality (lower carbon-nutrient quality, due to reduced storage allocation, and lowered nitrogen quality, due to dilution by structural carbon resulting from high TW growth priority). Here selective grazers, mainly sable antelope, were sustained only at the highest altitudes and because of reasonable amounts of dry-season rainfall and the availability of carbon-nutrient quality forage procurable from andropogonoid grass species. Extending the emerging pattern to near tropical conditions (RMP-TW metabolic mode settings), it follows that selective grazers can persist under such circumstances only if substantial dry-season rainfall occurs and suitable andropogonoid grass species are commonly available as forage plants. This seems to be the basis for the stable persistence of roan antelope in moist dystrophic West African savannas receiving 800 mm rainfall or more per year (De Bie 1991). Blue wildebeest and zebra do not occur under such conditions where extreme nitrogen dilution of forage items is encountered (RMP-TW functionality).
Whereas blue wildebeest and zebra populations performed poorly at extremes of the rainfall gradient (low rainfall: nitrogen dilution by storage products associated with SMP functionality and nitrogen dilution by structural carbon at higher rainfall: RMP-TW functionality), selective grazer species may cope with such conditions. At the arid extreme, SMP modes of plant functionality support forage with carbon-nutrient quality (given sufficiently low ambient temperatures or high altitude) and browsing then seems to be particularly advantageous (eland; roan antelope in more arid parts of West Africa; De Bie 1991). At the mesic end of the gradient, sufficient amounts of dry-season rainfall and andropogonoid grass species form the basis of their persistence. Blue wildebeest and zebra populations perform well under intermediate SMP-RMP plant functionality (central KNP), where nitrogen quality of forage is favoured by relative SMP-tw efficiency of plants, reasonable amounts of dry-season rainfall, growth activity curbed through moisture stress (SMP-Tw functionality) and nutrient-rich substrates. However, over the long term, populations of selective grazers declined (Figure 2a) because of plants' progressive acclimation to rising temperatures (since about 1910: Figure 1), which compromised storage-based carbon-nutrient quality of available forage (CVRM-2.2). In contrast, rising ambient temperature, by enhancing nitrogen productivity under conditions of SMP-Tw plant functionality, increased the availability of forage with adequate nitrogen quality, expectedly thereby favouring increased population densities of blue wildebeest and zebra (Figure 2b).
Bottom-up and top-down impacts on large herbivore population dynamics
Owen-Smith and Mills (2006) presented results of comprehensive analyses indicating that changes in population abundance within the multi-prey, general predator system in the KNP arose from a complex interplay between changing climatic conditions, variable food production, shifting habitat conditions, varying vulnerability to predation and spill-over effects on other species. Findings by Owen-Smith and Mason (2005) highlighted the importance of changes in adult survival rates in shaping population trends, implicating an interaction with nutritional shortfalls and the central involvement of predation by lions (Panthera leo), which prey largely on the adult segment of most of the larger herbivore species (Owen-Smith et al. 2005). Patterns of shifting prey selection depending on changing relative abundance and vulnerability of the three principal prey species (wildebeest, zebra and buffalo) further implicated predation as the main cause of the decline of alternative prey species such as waterbuck and the selectively feeding antelope species (Owen-Smith & Mills 2008a). However, Owen-Smith and Mills (2006) caution that attempting to separate the relative importance of top-down influences through predation from bottom-up processes operating through food resources is difficult, as susceptibility to predation depends on changing nutritional conditions and other habitat conditions (concealment), particularly as these factors also affect predator populations. The results of this study permit an interpretation of these complex interacting patterns, placing greater emphasis on bottom-up, climatically linked nutritional factors relative to predation impacts.
Prey selection for both buffalo and waterbuck was inversely dependent on rainfall averaged over three preceding years (Owen-Smith & Mills 2008a). Both buffalo and waterbuck seemed more vulnerable to malnutrition, and thus to predation, during periods of low rainfall (Owen-Smith & Mills 2006; Owen-Smith 2008; Owen-Smith & Mills 2008a). Despite heavy predation by lions on waterbuck (Mills et al. 1995), the resultant mortality did not seem to be additive and more important than the negative effects of drought, and populations increased during normal years despite heavy predation on the species by lions and other predators (Pienaar 1969). This also appears to be the case for buffalo. As forage resources improved after the 1991-1992 drought, both species showed recovery in abundance (Figures 3c-d). Prey selection on these species is thus considered rather to be a consequence of malnutrition and not the ultimate cause of declines in abundance.
Wildebeest and zebra were found to be more susceptible to predation under conditions of above-average rainfall. This was attributed to prey selection shifting towards these species owing to their susceptibility to predation being increased through the effect of higher vegetation cover facilitating hunting success of lions (Owen-Smith & Mills 2008a). Reduced exposure to predation was apparently associated with increasing abundance of these two species. Also, higher predation pressure on adult wildebeest than on zebra (Owen-Smith & Mills 2008b) was believed to have resulted in higher population numbers for zebra than for wildebeest in recent decades (Joubert 2007b). These patterns were interpreted to support the contention that wildebeest and zebra, the primary prey species selected by lions in the KNP (Owen-Smith & Mills 2008b), were held below the food ceiling through additive predation (Owen-Smith 2008). However, following from the results of this study, some of these patterns can be interpreted alternatively with reference to the dynamics of nitrogen quality of the forage selected by these two species. Accordingly, the reduced population performance during periods of above-average rainfall is attributed to reduced nitrogen quality due to nitrogen dilution associated with high grass productivity. Between 1955 and 1970 the abundance of zebra commenced to exceed that of wildebeest and stabilised at higher population levels. According to our study, this was interpreted as resulting from zebra being tolerant to relatively lower nitrogen quality forage than wildebeest, as such quality was expected to decline with increasing nitrogen productivity and the associated progressively increasing TW growth priority over this time span (climate-vegetation response model).
The provision of numerous artificial water points has been implicated to have benefited common water-dependent species, resulting in the influx of blue wildebeest and zebra into the range of the less water-dependent selective grazer species (Gaylard, Owen-Smith & Redfern 2003). Population declines of selective grazer species were consequently attributed to increased predation owing to the associated build-up of lion numbers in their ranges (Harrington et al. 1999). However, in spite of extensive water provisioning, the populations of blue wildebeest and zebra continued to fluctuate and the prolonged period of relatively low population densities of these species since the early 1990s in the northern KNP (Figures 3a-b) did not result in the recovery of selective grazer populations. Evidence of a marked shift in prey selection by lions towards the selectively feeding antelope species around 1987 was reported by Owen-Smith and Mills (2008a). The 2-3-fold increase in relative prey selection for these species was considered adequate to explain a similar rise in adult mortality observed after 1986 (Owen-Smith & Mason 2005; Owen-Smith & Mills 2008a). This shift in predation towards the selectively feeding antelope species was apparently induced by (1) lowered abundance and hence lower availability of buffalo as prey following the 1982-1983 drought and (2) coupled with reduced susceptibility of wildebeest and zebra over the period of low rainfall that set in during 1987. With all three principal prey species less available, lions apparently turned towards alternative prey species, including the selectively feeding antelope species and waterbuck (Owen-Smith & Mills 2008a). However, although the involvement of predation in the decline of selectively feeding antelope species after 1986 is implicated, it is difficult to decouple the interactive predator-prey dynamics from the extrinsically driven context provided by changing food resource conditions (Owen-Smith et al. 2005; Owen-Smith & Mills 2006). The results of this study support an interpretation of the decline of these antelope species involving an interaction between compromised forage quality and a resulting increased vulnerability to predation as a consequence. As accelerated rising temperatures since about 1980 (Figures 1 and 7) increasingly compromised carbon-nutrient quality of forage selected by selectively feeding antelope species (climate-vegetation response model), their nutritionally linked condition apparently declined and had involved most adults of the populations by 1986/1987. Rapid population declines ensued, with no signs of recovery to date (Figures 4a-d). In contrast, as food resource conditions (rainfall-based forage quantity) improved for waterbuck - a species heavily predated on by lions - their population numbers progressively increased (Figure 3d), whilst the population numbers of the selectively feeding antelope species remained low. According to the interpretation of this study the absence of recovery of these antelope populations is the result of continued low levels of carbon-nutrient quality of available forage due to sustained elevated ambient temperatures (Figures 6 and 7). Although impacts of predation on the small remaining populations of selectively feeding antelope species cannot be ignored (Grant et al. 2002), we conclude that even though proximate impacts of predation are considered of significance, the ultimate cause of population performance trends of these species appears to be related to the climatically compromised carbon-nutrient quality of their forage.
Conclusion
From a situation apparently prevailing during the first two to three decades of the 1900s, during which the abundance of selective grazers (sable antelope, roan antelope and tsessebe) was of similar orders of magnitude to that of bulk feeding species (wildebeest, zebra and buffalo), the former declined progressively, whilst the latter increased over subsequent decades. These herbivore population trends were paralleled by progressively enhanced nitrogen productivity, increasing the availability of nitrogen quality forage and declining carbon-nutrient quality (storage-based plant metabolism), apparently linked to increasing temperature over time. Further analysis revealed that population numbers of buffalo and waterbuck, as roughage bulk feeders, tracked forage quantity largely determined by rainfall. Wildebeest and zebra, with their preference for grazing short grasses, were identified as nitrogen quality patch selectors. As such their population performance was favoured in habitats of high nutrient status with sustained nitrogen productivity and nitrogen quality, mainly found in the southern (central) KNP. Population performance of these species, as more clearly manifesting in the northern KNP, was negatively associated with reduced dry-season rainfall and elevated temperatures, a syndrome of climate effects expected to reduce forage nitrogen quality through nitrogen dilution. The population performance of antelope species selecting for carbon-nutrient quality plant parts (sable antelope, roan antelope, eland and tsessebe) was relatively enhanced at higher altitude sites and in northern KNP. Relatively lower temperatures associated with upper altitudes were expected to conserve carbon-nutrient quality of forage and the prevalence of the sustained metabolic performance mode of plants in the northern KNP to support relative plant carbon excess (climate-vegetation response model). Population performance of these antelope species was found to be spatiotemporally negatively associated with high temperature conditions, consistent with predictions of the climate-vegetation response model, according to which carbon-nutrient quality is compromised by elevated ambient temperature. Accordingly, the long-term population decline and the absence of population recovery of these species to date were attributed to progressively increasing and sustained elevated ambient temperature conditions as progressive SMP-to-RMP temperature acclimation reduced the scope for storage-based metabolism in favour of biomass productivity (growth).
The results of pattern/process matching conducted in this study revealed remarkable consistency between herbivore population trends and key indices of forage quantity and quality, shaped in accordance with expectations of plant responses to climate (climate-vegetation response model). With regard to all eight species studied, their targeting by lion predation through shifting prey selection, as implicated by Owen-Smith and Mills (2008a), apparently coincided with time periods of compromised forage quantity or quality as predicted by climate-vegetation response processes in this study. Population trends of these species were found to be in apparent synchrony with features of a changing climate (rainfall, dry-season rainfall, and maximum and minimum ambient temperatures). Furthermore, some of the herbivore population trends, such as the lack of recovery of populations of the selectively feeding antelope species over recent years but population increases for waterbuck over the same period, cannot be readily explained with reference to predation, but conform to climatically driven forage availability as outlined in this study. We conclude that ultimate causality of the observed population trends of the species studied is linked to landscape-scale climate-vegetation responses controlling the availability of suitable forage (bottom-up regulation). Proximate impacts of predation additionally shaped the basic population dynamics in a complex and interactive manner (top-down impacts).
Acknowledgements
We acknowledge the effort of rangers, other field staff and scientists with regard to collecting diverse data sets (e.g. animal population censuses and grassland monitoring) over many decades, without which this study would not have been possible. Mss Judith Kruger, Sandra MacFadyen and Sharon Thomson of Scientific Services, KNP are acknowledged for providing data used in this study. We also thank Prof. Herbert Prins and Ignas Heitkönig for valuable discussions (both from Wageningen University). The South African Weather Service provided temperature and rainfall data. This study represents an output of the specialist scientist research programme in systems ecology conducted by members of the Conservation Services Division (Knysna and Skukuza) of South African National Parks. The main author, in his capacity as honorary research associate at the Botany Department, University of Cape Town thankfully acknowledges general support received from this institution.
Competing interests
The authors declare that they have no financial or personal relationship(s) which may have inappropriately influenced them in writing this paper.
Authors' contributions
A.H.S. (Garden Route National Park) was responsible for the development of the climate-vegetation response model and the interpretation of large herbivore population performance patterns and trends in accordance with this model. C.C.G. (Kruger National Park), I.P.S. (Kruger National Park), W.J.V. (Garden Route National Park) and N.Z. (Kruger National Park) contributed during in-depth discussions by sharing their knowledge of plant and animal ecology. I.P.S. (Kruger National Park) also performed some statistical analyses and J.B. (Garden Route National Park) was involved in the processing of spatial data used for analyses and the production of figures.
References
An, Y., Wan, S., Zhou, Z., Subedar, A.A., Wallace, L.L. & Luo, Y., 2005, 'Plant nitrogen concentration, use efficiency, and contents in a tallgrass prairie ecosystem under experimental warming', Global Change Biology 11, 1733-1744. http://dx.doi.org/10.1111/j.1365-2486.2005.01030.x [ Links ]
Anselin, L., 2005, Exploring spatial data with GeoDaTM: A workbook, University of Illinois, Urbana-Champaign. [ Links ]
Archives, Kruger National Park (Skukuza), Annual reports, Sabi and Shingwitsi game reserves, 1902-1925; Kruger National Park, 1926-1945. [ Links ]
Archives, Skukuza, Warden's annual reports: Kruger National Park, unpublished reports, 1946-1952. [ Links ]
Bodenstein, V., Meissner, H.H. & Van Hoven, W., 2000, 'Food selection by Burchell's zebra and blue wildebeest in the Timbavati area of the Northern Province Lowveld', South African Journal of Wildlife Research 30(2), 6-72. [ Links ]
Buckland, S.T., Anderson, D.R., Burnham, K.P. & Laake, J.L., 1993, Distance sampling estimating abundance of biological populations, Chapman, London. [ Links ]
De Bie, S., 1991, Wildlife resources of the West African savanna, Wageningen Agricultural University Papers 91-92, Wageningen. [ Links ]
Dewar, R.C., Medlyn, B.E. & McMurtrie, R.E., 1999, 'Acclimation of the respiration/ photosynthesis ratio to temperature: Insights from a model', Global Change Biology 5, 615-622. http://dx.doi.org/10.1046/j.1365-2486.1999.00253.x [ Links ]
Dunham, K.M., Robertson, E.F. & Grant, C.C., 2004, 'Rainfall and the decline of a rare antelope, the tsessebe (Damaliscus lunatus lunatus), in Kruger National Park, South Africa', Biological Conservation 117, 83-94. http://dx.doi.org/10.1016/S0006-3207(03)00267-2 [ Links ]
Dwyer, S.A., Ghannoum, O., Nicotra, A. & Von Caemmerer, S., 2007, 'High temperature acclimation of C4 photosynthesis is linked to changes in photosynthetic biochemistry', Plant, Cell and Environment 30, 53-66. http://dx.doi.org/10.1111/j.1365-3040.2006.01605.x, PMid:17177876 [ Links ]
East, R., 1984, 'Rainfall, soil nutrient status and biomass of large African savanna mammals', African Journal of Ecology 22, 245-270. http://dx.doi.org/10.1111/j.1365-2028.1984.tb00700.x [ Links ]
Environmental Systems Research Institute (ESRI), 2006, ESRI data and maps: Elevation and image data, ESRI, Redlands, California, USA. [ Links ]
Estiarte, M. & Peñuelas, J., 1999, 'Excess carbon: The relationship with phenotypical plasticity in storage and defense functions of plants', Orsis 14, 159-203. [ Links ]
Fritz, H. & Duncan, P., 1994, 'On the carrying capacity for large ungulates of African savanna ecosystems', Proceedings of the Royal Society of London B 256, 77-82. http://dx.doi.org/10.1098/rspb.1994.0052, PMid:8008761 [ Links ]
Gaylard, A., Owen-Smith, N. & Redfern, J., 2003, 'Surface water availability: Implications for heterogeneity and ecosystem processes', in J.T. du Toit, K.H. Rogers & H.C. Biggs (eds.), The Kruger experience: Ecology and management of savanna heterogeneity, pp. 171-188, Island Press, Washington DC. [ Links ]
Gertenbach, W., 1983, 'Landscapes of the Kruger National Park', Koedoe 26, 9-121. [ Links ]
Grange, S. & Duncan, P., 2006, 'Bottom-up and top-down processes in African ungulate communities: Resources and predation acting on the relative abundance of zebra and grazing bovids', Ecography 29, 899-907. http://dx.doi.org/10.1111/j.2006.0906-7590.04684.x [ Links ]
Grant, C.C., Davidson, T., Funston, P.J. & Pienaar, D.J., 2002, 'Challenges faced in the conservation of rare antelope: A case study on the northern basalt plains of the Kruger National Park', Koedoe 45(2), 45-62. [ Links ]
Harrington, R., Owen-Smith, N., Viljoen, P.C., Mason, D.R. & Funston, P.J., 1999, 'Establishing the causes of the roan antelope decline in the Kruger National Park, South Africa', Biological Conservation 90, 69-78. http://dx.doi.org/10.1016/S0006-3207(98)00120-7 [ Links ]
Heitkönig, I.M.A. & Owen-Smith, N., 1998, 'Seasonal selection of soil types and grass swards by roan antelope in a South African savanna', African Journal of Ecology 36, 57-70. http://dx.doi.org/10.1046/j.1365-2028.1998.114-89114.x [ Links ]
Herms, D.A. & Mattson, W.J., 1992, 'The dilemma of plants: To grow or defend', Quarterly Review of Biology 67(3), 283-335. http://dx.doi.org/10.1086/417659 [ Links ]
Hofmann, R.R., 1973, The ruminant stomach. Stomach structure and feeding habits of East African game ruminants, Vol. II, East African Literature Bureau, Nairobi. [ Links ]
Hofmann, R.R., 1989, 'Evolutionary steps of ecophysiological adaptation and diversification of ruminants: A comparative view of their digestive systems', Oecologia 78, 443-457. http://dx.doi.org/10.1007/BF00378733 [ Links ]
Houghton, J.T., Meira Filho, L.G., Callander, B.A., Harris, N., Kattenberg A. & Maskell, K., (eds.), 1996, Climate change 1995: The science of climate change, Cambridge University Press, Cambridge. [ Links ]
Joubert, S.C.J., 1976, 'The population ecology of the roan antelope (Hippotragus equinus equinus) (Desmarest, 1804) in the Kruger National Park', DSc thesis, Faculty of Science, University of Pretoria. [ Links ]
Joubert, S.C.J. & Bronkhorst, P.H.L., 1977, 'Some aspects of the history and population ecology of the Tsessebe Damaliscus lunatus lunatus in the Kruger National Park', Koedoe 20, 125-145. [ Links ]
Joubert, S., 2007a, The Kruger National Park: A history, Vol. I., High Branching, Johannesburg. [ Links ]
Joubert, S., 2007b, The Kruger National Park. A History, Vol. II., High Branching, Johannesburg. [ Links ]
Kennedy, A.D., Biggs, H. & Zambatis, N., 2003, 'Relationship between grass species richness and ecosystem stability in Kruger National Park, South Africa', African Journal of Ecology 41, 131-140. http://dx.doi.org/10.1046/j.1365-2028.2003.00391.x [ Links ]
Kruger, J.M., Reilly, B.K. & Whyte, I.J., 2008, 'Application of distance sampling to estimate population densities of large herbivores in Kruger National Park', Wildlife Research 35, 371-376. http://dx.doi.org/10.1071/WR07084 [ Links ]
Le Roux, E., 2010, 'Habitat and forage dependency of sable antelope (Hippotragus niger) in the Pretoriuskop region of the Kruger National Park', MSc thesis, School of Animal, Plant & Environmental Sciences, University of the Witwatersrand. [ Links ]
Legendre, B. & McArdle, B.H., 1997, 'Comparison of surfaces', Oceanologica Acta 20, 27-41. [ Links ]
Ludorf, J.F., 1918, Report of the Game Reserve Commission, Government Printer, Pretoria. [ Links ]
Macandza, V.A., Owen-Smith, N. & Cross, P.C., 2004, 'Forage selection by African buffalo in the late dry season in two landscapes', South African Journal of Wildlife Research 34(2), 113-121. [ Links ]
Magome, H., Cain, J.W.I., Owen-Smith, N. & Henley, S.R., 2008, 'Forage selection of sable antelope in Pilanesberg Game Reserve, South Africa', South African Journal of Wildlife Research 38(1), 35-41. http://dx.doi.org/10.3957/0379-4369-38.1.35 [ Links ]
't Mannetje, L., 1982, 'Problems of animal production from tropical pastures', in J.B. Hacker (ed.), Nutritional limits to animal production from pastures, pp. 67-85, Commonwealth Agricultural Bureaux, Farnham Royal. [ Links ]
't Mannetje, L., 1984, 'Nutritive value of tropical and subtropical pastures, with special reference to protein and energy deficiency in relation to animal production', in F.M.C. Gilchrist & R.I. Mackie (eds.), Herbivore nutrition in the subtropics and tropics, pp. 56-66, The Science Press, Craighall. [ Links ]
Mduma, S.A.R., Sinclair, A.R.E. & Hilborn, R., 1999, 'Food regulates the Serengeti wildebeest: a 40-year record', Journal of Animal Ecology 68, 1101-1122. http://dx.doi.org/10.1046/j.1365-2656.1999.00352.x [ Links ]
Mills, M.G.L., Biggs, H.C. & Whyte, I.J., 1995, 'The relationship between rainfall, lion predation and population trends in African herbivores', Wildlife Research 22, 75-88. http://dx.doi.org/10.1071/WR9950075 [ Links ]
Mutanga, O., Prins, H.H.T., Skidmore, A.K., Van Wieren, S., Huizing, H., Grant, R. et al., 2004, 'Explaining grass-nutrient patterns in a savanna rangeland of southern Africa', Journal of Biogeography 31, 819-829. http://dx.doi.org/10.1111/j.1365-2699.2004.01072.x [ Links ]
Osborne, C.P., 2008, 'Atmosphere, ecology and evolution: what drove the Miocene expansion of C4 grasslands?', Journal of Ecology 96, 35-45. PMid:18784799, PMid:2517376 [ Links ]
Owen-Smith, N., 2008, 'Changing vulnerability to predation related to season and sex in an African ungulate assemblage', Oikos 114, 602-610. http://dx.doi.org/10.1111/j.0030-1299.2008.16309.x [ Links ]
Owen-Smith, N. & Ogutu, J.O., 2003, 'Rainfall influences on ungulate population dynamics', in J.T. du Toit, H.C. Biggs & K.H. Rogers (eds.), The Kruger experience: Ecology and management of savanna heterogeneity, pp. 310-331, Island Press, Washington DC. [ Links ]
Owen-Smith, N. & Mason, D.R., 2005, 'Comparative changes in adult versus juvenile survival affecting population trends of African ungulates', Journal of Animal Ecology 74, 762-773. http://dx.doi.org/10.1111/j.1365-2656.2005.00973.x [ Links ]
Owen-Smith, N., Mason, D.R. & Ogutu, J.O., 2005, 'Correlates of survival rates of ten African ungulate populations: Density, rainfall and predation', Journal of Animal Ecology 74, 774-778. http://dx.doi.org/10.1111/j.1365-2656.2005.00974.x [ Links ]
Owen-Smith, N. & Mills, M.G.L., 2006, 'Manifold interactive influences on the population dynamics of a multispecies ungulate assemblage', Ecological Monographs 76, 73-92. http://dx.doi.org/10.1890/04-1101 [ Links ]
Owen-Smith, N. & Mills, M.G.L., 2008a, 'Shifting prey selection generates contrasting herbivore dynamics within a large-mammal predator-prey web', Ecology 89(4), 1120-1133. http://dx.doi.org/10.1890/07-0970.1, PMid:18481536 [ Links ]
Owen-Smith, N. & Mills, M.G.L., 2008b, 'Predator-prey size relationships in an African large-mammal food web', Journal of Animal Ecology 77, 173-183. http://dx.doi.org/10.1111/j.1365-2656.2007.01314.x, PMid:18177336 [ Links ]
Parrini, F., 2006, 'Nutritional and social ecology of the sable antelope in a Magaliesberg Nature Reserve', PhD thesis, School of Animal, Plant & Environmental Sciences, University of the Witwatersrand. [ Links ]
Pienaar, U de V., 1963, 'The large mammals of the Kruger National Park: Their distribution and present-day status', Koedoe 6, 1-37. [ Links ]
Pienaar, U de V., 1969, 'Predator-prey relationships among the larger mammals of the Kruger National Park', Koedoe 12, 108-176. [ Links ]
Scholes, R.J. & Walker, B.H., 1993, An African savanna: Synthesis of the Nylsvley study, Cambridge University Press, Cambridge. http://dx.doi.org/10.1017/CBO9780511565472 [ Links ]
Schulze, R.E., 1995, Hydrology and agrohydrology: A text to accompany the ACRU 3.00 agro-hydrological modeling system, University of Natal (Department of Agricultural Engineering), Pietermartizburg. [ Links ]
Seydack, A.H., Grant, C.C., Smit, I.P., Vermeulen, W.J., Baard, J. & Zambatis, N., 2012, 'Climate and vegetation in a semi-arid savanna: development of a climate-vegetation response model linking plant metabolic performance to climate and the effects on forage availability for large herbivores', Koedoe 54(1), Art. #1046, 12 pages. http://dx.doi.org/10.4102/koedoe.v54i1.1046 [ Links ]
Silverman, B.W., 1986, Density estimation for statistics and data analysis, Chapman and Hall, New York. [ Links ]
Sinclair, A.R.E., Dublin, H. & Borner, M., 1985, 'Population regulation of Serengeti wildebeest: A test of the food hypothesis', Oecologia 65, 266-268. http://dx.doi.org/10.1007/BF00379227 [ Links ]
Skinner, J.D. & Chimimba, C.T., 2005, The mammals of the Southern African subregion, 3rd edn., Cambridge University Press, Cambridge/Cape Town. [ Links ]
Smit, I.P.J., 2011, 'Resources driving landscape-scale distibution patterns of grazers in an African savanna', Ecography 34, 67-74. http://dx.doi.org/10.1111/j.1600-0587.2010.06029.x [ Links ]
Smuts, G.L., 1972, 'Seasonal movements, migration and age determination of Burchell's zebra (Equus burchelli antiquorum, H. Smith, 1841) in the Kruger National Park', MSc thesis, Faculty of Science, University of Pretoria. [ Links ]
Steyn, L.B., 1953-1961, 'Annual reports: Kruger National Park', unpublished reports, Skukuza, South Africa. [ Links ]
Steyn, L.B., 1954, Report of the supervisor of game censuses in 1954 in the Kruger National Park, South African National Parks, South Africa. [ Links ]
Van Soest, P.H., Mertens, D.R. & Deinum, B., 1978, 'Preharvest factors influencing quality of conserved forage', Journal of Animal Science 47, 712-720. [ Links ]
Venter, F.J., Scholes, R.J. & Eckhardt, H.C., 2003, 'The abiotic template and its associated vegetation patterns', in J.T. du Toit, K.H. Rogers & H.C. Biggs (eds.), The Kruger experience: Ecology and management of savanna heterogeneity, pp. 83-129, Island Press, Washington DC. [ Links ]
Viljoen, P.C., 1996, Ecological aerial surveys in the Kruger National Park, report 04/1995, Kruger National Park (Scientific Services), Skukuza. [ Links ]
Wan, S., Xia, J., Liu, W. & Niu, S., 2009, 'Photosynthetic overcompensation under nocturnal warming enhances grassland carbon sequestration', Ecology 90(10), 2700-2710. http://dx.doi.org/10.1890/08-2026.1, PMid:19886480 [ Links ]
Watson, L.H. & Owen-Smith, N., 2000, 'Diet composition and habitat selection of eland in semi-arid shrubland', African Journal of Ecology 38, 130-137. http://dx.doi.org/10.1046/j.1365-2028.2000.00229.x [ Links ]
Whyte, I.J., 2007, Rare antelope in the Kruger National Park: Trends, current status, and options for future management, report 03/2007, South African National Parks, Skukuza. [ Links ]
Whyte, I.J. & Joubert, S.C.J., 1988, 'Blue wildebeest population trends in the Kruger National Park and the effect of fencing', South African Journal of Wildlife Research 18(3), 78-87. [ Links ]
Wilson, J.R., 1982, 'Environmental and nutritional factors affecting herbage quality', in J.B. Hacker (ed.), Nutritional limits to animal production from pastures, pp. 111-131, Commonwealth Agricultural Bureaux, Farnham Royal. [ Links ]
Wilson, J.R. & Ford, C.W., 1971, 'Temperature influences on the growth, digestibility, and carbohydrate composition of two tropical grasses, Panicum maximum var. trichoglume and Setaria sphacelata, and two cultivars of the temperate grass Lolium perenne', Australian Journal of Agricultural Research 22, 563-571. http://dx.doi.org/10.1071/AR9710563 [ Links ]
Wilson, J.R. & Ford, C.W., 1973, 'Temperature influences on the in vitro digestibility and soluble carbohydrate accumulation of tropical and temperate grasses', Australian Journal of Agricultural Research 24, 187-198. http://dx.doi.org/10.1071/AR9730187 [ Links ]
 Correspondence:
Armin Seydack
PO Box 3542
Knysna 6570, South Africa
Armin.Seydack@SANParks.org
Received: 08 Mar. 2011
Accepted: 05 Oct. 2011
Published: 08 Feb. 2012
1 For ease of reading, abbreviations and symbols are used to describe factors as follows: Np, nitrogen productivity; Nq, nitrogen quality, CNq, carbon-nutrient quality; ↑, increasing; ↓, decreasing.


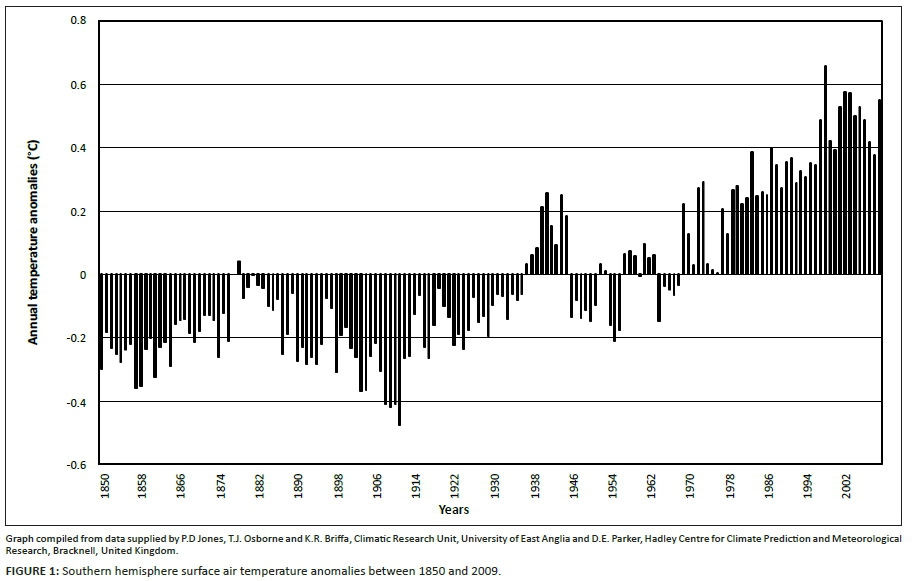
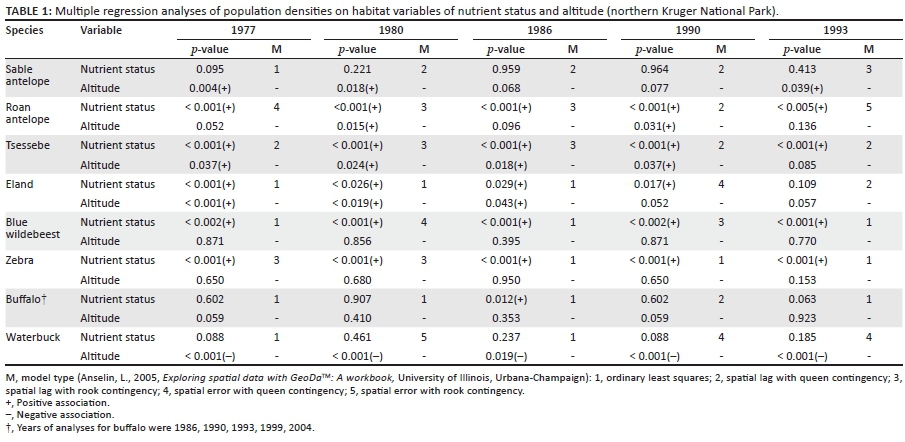
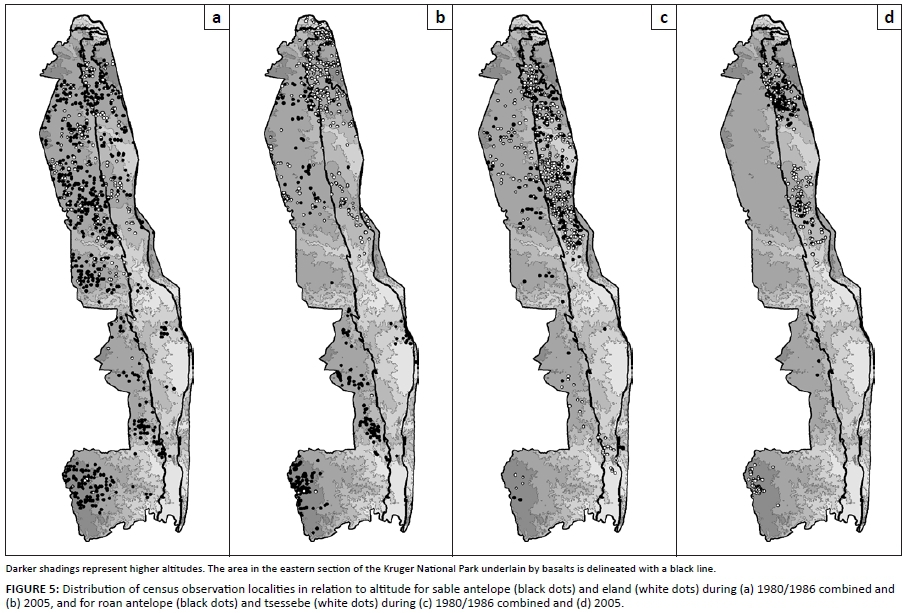
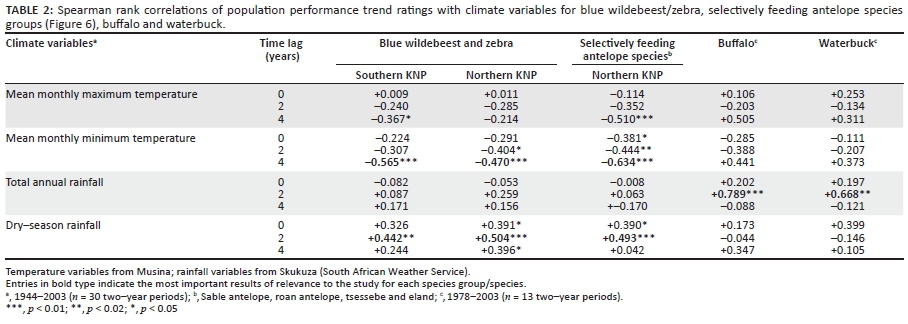
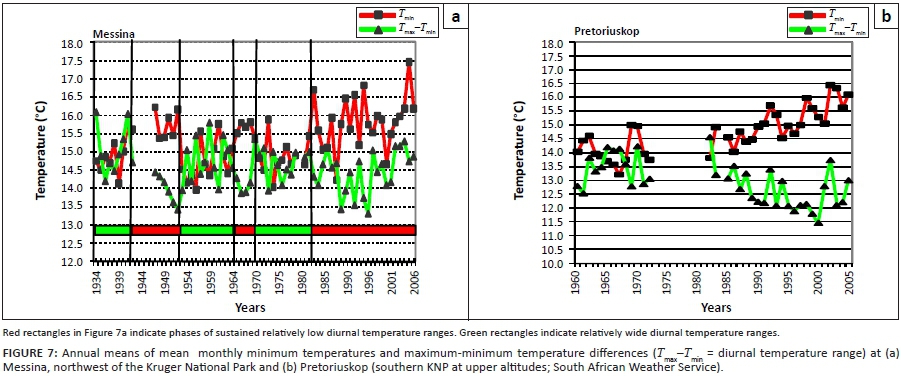
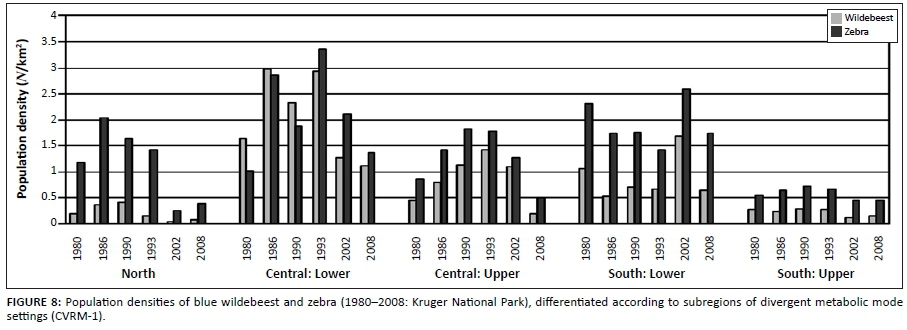
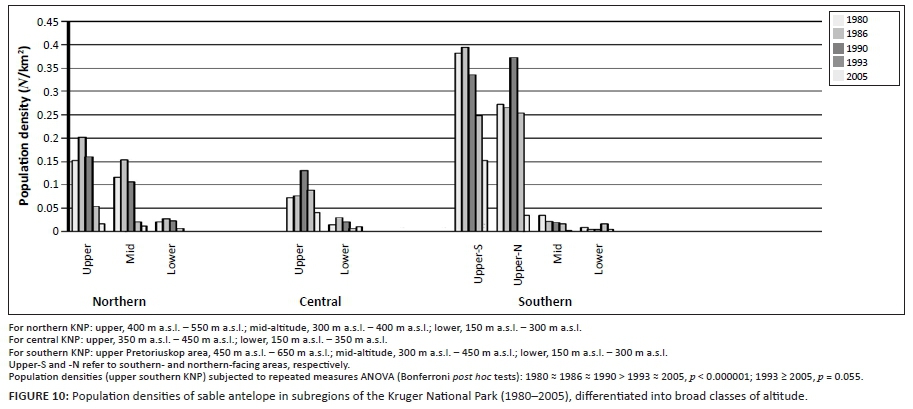