


Services on Demand
Article
 English (pdf)
 Article in xml format
 Article references
Indicators

Related links
-
 Cited by Google
 -
 Similars in Google
Share

 Permalink
Koedoe
On-line version ISSN 2071-0771
Print version ISSN 0075-6458
Koedoe vol.52 n.1 Pretoria Jan. 2010
ORIGINAL RESEARCH
A floristic description and utilisation of two home ranges by vervet monkeys in Loskop Dam Nature Reserve, South Africa
Alan S. BarrettI; Leslie R. BrownI; Louise BarrettI,II; Peter HenziI,II
IApplied Behavioural Ecology and Ecosystem Research Unit, Department of Environmental Sciences, University of South Africa, South Africa
IIDepartment of Psychology, University of Lethbridge, Canada
ABSTRACT
The plant communities occurring in the home ranges of two vervet monkey (Chlorocebus aethiops) troops (referred to as the Donga and Picnic troops) were investigated as part of a comprehensive research project on the spatial and temporal patterns in resource dispersion or distribution and range use. From two-way indicator species analysis (TWINSPAN) multivariate classifications refined by Braun-Blanquet procedures, seven plant communities that can be placed into three major groups were identified in the home range of the Donga troop, and eight plant communities that can be placed into four major groups were identified in the home range of the Picnic troop. Classifications and descriptions of the major groups, including vegetation maps, are presented. Diagnostic as well as prominent species of tree, shrub, forb and grass strata are outlined. Ordinations and floristic analyses were undertaken for the two home ranges to highlight vegetative differences between the areas. The phenology of vervet resources and the available resource energy were determined as a basis for the comprehensive study.
Conservation implications: This vegetation description and phenology provide valuable information on the utilisation of home ranges by vervets and demonstrate how various management applications can affect the home range dependence of troops.
Keywords: Braun-Blanquet; phenology; plant communities; resource energy; TWINSPAN
INTRODUCTION
The Loskop Irrigation Dam was completed in 1938 to provide water for the irrigation needs of agriculture downstream. To ensure that the water users received good-quality water, it was critical for the area surrounding the dam to be managed appropriately for water quality conservation. This led to the establishment of the Loskop Dam Nature Reserve (LDNR) in 1942, with subsequent proclamation in 1954 (Barrett 2009). Currently, the Mpumalanga Tourism and Parks Agency (MTPA), whose mandate is the conservation of natural biodiversity for current and future generations through the sustainable use of natural resources, manages the reserve.
The reserve falls within the savanna biome of South Africa and, because of climate and topography, there are a variety of habitats on the reserve, making it possible to stock a large variety of game species. To ensure efficient management and to assist the managers in making evidence-based decisions, various research projects on different animals and vegetation are undertaken and encouraged in the reserve.
No ecologically based studies on vervet monkeys have been undertaken in the LDNR to date, and only a few vegetation studies have been conducted in the reserve. Theron (1973) conducted the first detailed vegetation study of the reserve and did a broad-scale analysis of the overall vegetation, using what appears to be a scale of 1:50 000 for his delineation of the plant communities. The vegetation of areas that have been added to the north-eastern section of the reserve (two farms called Rietfontein and Parys) have been classified and mapped by Götze et al. (1998) using 1:30 000 aerial photographs.
Vervets are extremely adaptable, opportunistic generalists that have a wide distribution in sub-Saharan Africa (Barrett et al. 2006). Not many detailed ecological studies of vervets have been undertaken in temperate areas (Isbell, Pruetz & Young 1998; Pruetz & Isbell 2000). At low latitudes, overall habitat productivity is high and seasonal variability is relatively limited (Caughley & Sinclair 1994). A fuller understanding of the flexibility of vervet ecology and the factors that influence their utilisation of their habitat will benefit the overall management of the species. No related vervet studies have been conducted locally.
According to Singh and Kushwaha (2006), seasonal duration of leafing or flushing, flowering and fruiting determine phenological behaviour in tropical and subtropical trees. Major phenological events may occur at various times during both the wet and the dry season (Fensham & Bowman 1992). Sarmiento and Monasterio (1983) and Van Schaik et al. (1993) observe that there may be considerable variation between years, species and life forms in the timing of such events. Van Schaik et al. (1993) state that most savanna woody plants produce new leaves and flowers in bursts rather than continuously, displaying seasonal variations in the presence of new leaves, flowers and fruits.
Since leaves, fruits and flowers comprise the bulk of primate diets, investigating the dynamics of these resources is valuable when attempting to understand the spatial and temporal habitat utilisation and ranging patterns of vervet monkeys. For many primates, and particularly for the vervet monkeys living in the LDNR, activity budgets, ranging patterns, timing of births and weaning are influenced by the spatial and temporal availability of food resources (Barrett 2000). To date, no phenological data has been collected or reported for the LDNR.
This study provides the basic framework for a comprehensive research project on how two troops of vervet monkeys (the Donga troop (n = 14) and the Picnic troop (n = 15)) use their home ranges to obtain temporally and spatially distributed resources through their ranging patterns. Of interest is how the two home ranges vary floristically and in terms of available resources. In this article, the various plant communities occurring in the two troops's home ranges are identified, described and mapped, and the general vegetation structure of the areas is determined. Environmental factors influencing the plant communities are explored to determine whether there are specific associations between these factors and the respective plant communities. A floristic analysis of both the home ranges is undertaken and the results compared. The phenology of resource tree species used by the two troops is also determined and presented.
The home ranges of the two troops that were studied are geographically separated and approximately 4.5 km apart. The Donga home range is 224 ha in size and the Picnic home range is 138 ha. The underlying geology of the Donga home range comprises the sedimentary Loskop formation and the Selonsrivier formation, while the Picnic home range consists only of the Loskop formation.
There are conspicuous topographical differences between the two home ranges, with the Donga area being more rugged and hilly than the Picnic area, which is more level and uniform in appearance. The average slope for the Donga area is 13.6º compared to 10º for the Picnic area. The Donga plant communities occur at a wider range of altitudes than those of the Picnic home range, with the Donga altitudes ranging from 1005 m to 1105 m and the Picnic altitudes ranging from 1031 m to 1097 m.
According to Mucina and Rutherford (2006), the vegetation occurring on the mountains of the LDNR and surrounding areas belongs to the Loskop Mountain Bushveld Vegetation Unit (SVcb 13), whereas the vegetation occurring in the valley of the Olifants River to the Loskop Dam and surrounding areas belongs to the Loskop Thornveld Vegetation Unit (SVcb 14). The Loskop Mountain Bushveld consists of open, broad-leaved woodland and the Loskop Thornveld of deciduous, open woodland (Mucina & Rutherford 2006).
Climate
The LDNR is located in a summer rainfall area with moderate to very hot summers and mild to cold winters, and with frost occurring on the mountain tops and in the low-lying valley bottoms (Theron 1973). Temperatures range from a minimum of -8 ºC to a maximum of 40 ºC, with an average of 21 ºC (Low & Rebelo 1998). Rainfall occurs mainly in the form of short-lived, high-intensity thunderstorms associated with strong, south-westerly winds. The majority of the rainfall occurs in the summer (November-April).
The average monthly rainfall for the wet season (November 2006-April 2007) during the study period was 55 mm, compared to 87 mm for the period November 2002-April 2007 (Figure 1). During the study period, the mean temperature for the dry season was 18.5 ºC, compared to 24 ºC for the wet season. A mean minimum temperature of 8.5 ºC (July 2006) and a mean maximum of 32 ºC (February 2007) were recorded for the study period. The average annual rainfall for the study area, as measured by weather stations located at various monitoring points on the reserve, was 654 mm for the period May 2002 to April 2007. The study period was drier for both the dry and the wet seasons compared to the average for the previous 5 years. Average monthly rainfall for the dry season (May 2006-October 2006) during the study period was 6 mm, compared to 11 mm for May 2002-October 2006.
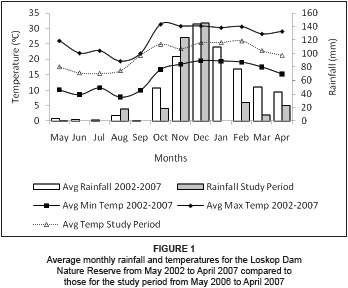
The average climate of the two home ranges is similar due to their close proximity, yet the effects of climate and particularly of rainfall on the areas are not the same, due to topographical distinctions between the areas, such as slope and altitudinal differences. The Picnic home range is less steep than the Donga home range, resulting in surface water being stored for longer periods in a series of natural pools and small, man-made dams.
There are no impoundments in the Donga home range and the run-off rate into the Loskop Dam is rapid after rain has fallen.
METHODS
Study area
The LDNR is located 52 km north of Middelburg on the N11 national road to Groblersdal in Mpumalanga province (Figure 2). According to Emery, Lotter and Williamson (2004) and Ferrar and Lotter (2007), the reserve is currently 23 175 ha in size, of which 2350 ha is water surface. It is located between longitude 29º15'00" and 29º40'00" East and latitude 25º34'00" and 25º56'00" South. At the heart of the reserve is the Loskop Irrigation Dam (approximately 24 km long), situated in the Olifants River Valley. The dam is fed predominantly by the perennial Olifants River and the Krantz Spruit, and their respective tributaries (Theron 1973). A network of small mountain streams and drainage channels originating from both inside and outside the boundaries of the reserve also drain into the dam.
Vegetation classification
A series of 1:10 000 digitised orthophotos of the LDNR was used to stratify the study area into physiognomic-physiographic units, as described by Barbour, Burk and Pitts (1987) and Kent and Coker (1997). To ensure that all variations in the vegetation were captured during the sampling, 69 sample plots (43 in the Donga home range and 26 in the Picnic home range) were placed in a random manner within the stratified units. Plot sizes were fixed at 400 m2 (Barbour et al. 1987; Brown 1997, Brown & Bredenkamp 1994).
Vegetation-related fieldwork was undertaken during November and December 2005, January 2006 and December 2006. The two troops's home range boundaries were determined from all GPS co-ordinates collected for the troops over the entire study period (June 2005-June 2007). Taxon names conform to those of Germishuizen and Meyer (2003).
Environmental data collected included altitude, latitude and longitude, aspect, slope, percentage surface rock cover, percentage erosion, basic soil type, evidence of animal activity and the effects of fire. All plant species growing in the sample plots were recorded, and cover abundance was assessed using a modified Braun-Blanquet cover abundance scale (Barbour et al. 1987, Mueller-Dombois & Ellenberg 1974). Erosion was estimated using erosion classes from Matthee and Van Schalkwyk (1984), and slope was estimated using the categories specified by Barrett et al. (2006).
Floristic data were recorded according to Braun-Blanquet techniques and analysed using the TURBOVEG suite (Hennekens 1998), which includes the two-way indicator species analysis multivariate classification technique (TWINSPAN) for deriving an initial approximation of the main plant communities (Hill 1979). This technique is regarded as a successful approach to vegetation classification by a number of phytosociologists (Bredenkamp & Bezuidenhout 1995; Brown, Bredenkamp & Van Rooyen 1996; Brown & Bredenkamp 1994; Cilliers 1998). The visual editor MEGATAB (Hennekens 1996) was used to generate phytosociological tables and further refinement of the classification was undertaken through the application of Braun-Blanquet procedures (Barbour et al. 1987; Kent & Coker 1997; Werger 1974). Using the final phytosociological tables and habitat information collected during sampling in the field, different plant communities were described and ecologically interpreted.
Plant communities were identified using 'diagnostic species' as defined by Westhoff & Van der Maarel (1978), who define species as diagnostic if they are present in at least 20% of the relevés of a particular plant community, whilst simultaneously being absent or less frequent in other communities. An adaptation of this definition was used in this study, where a species was considered diagnostic for a particular community if it was present within the following constancy parameters (Grobler, Bredenkamp & Brown 2006):
• > 70% and with a constancy of < 35% in all other communities
• > 50% and with a constancy of < 25% in all other communities
• > 20% and with a constancy of < 13% in all other communities.
'Dominant species' are defined as all species that have cover values exceeding a predetermined cover threshold value in any relevé in a selected vegetation unit (Westhoff & Van der Maarel 1978). The vegetation of the study area is relatively heterogeneous, with dominant species not restricted to specific threshold values, but rather to the species with the highest overall cover abundance in a community.
Phenology
Resource trees (utilised for food by the vervets) were identified by following the two troops during habituation and during data collection for this comprehensive study (Barrett 2009). To determine the number of vervet resource trees required for phenological monitoring, density figures for the tree species were used. Ten per cent of the total density figure for each tree species was calculated and used as the number of trees to tag for that species. Representative samples of each species for tagging were selected from plant communities that occurred in both the troops's home ranges. In the field, these species were randomly selected and identified, locations were recorded with a GPS device and individual trees were tagged with a numbered aluminium disc for data-collection purposes. Initial phenology data were collected from all tagged trees; thereafter data were collected on a monthly basis for the duration of the study period.
The quantification of available resources has been undertaken in tropical forests, where the focus was on the ecology of fruiting trees and the behaviour of frugivorous consumers (Chapman 1990; Chapman et al. 1992; Clutton-Brock 1977; Leighton & Leighton 1982; Raemakers 1980; Terborgh 1983). A combination of quantification methods used in the forest environments of Uganda (Chapman et al. 1992) and in the savanna environments of South Africa (Smit 1989a, 1989b) were used for this study.
Direct measurement techniques were not an option for collecting reliable tree dimension estimates quickly and accurately because of the dense nature of the vegetation and the inaccessibility of many trees sampled in the areas frequented by the troops. The inexpensive, relatively quick 'one-man' method employed by Smit (1996) was modified and linear tree dimension data were collected using improvised equipment. Instead of using a calibrated 35-mm photographic slide, as suggested by Smit (1996), a clear fibreglass reader with markings matching the markings on a 3-m measuring stick was used. Within the 3-m markings, the reader was subdivided into 0.25-m segments for refined measurements. Luminous yellow tape was used to mark the bottom and the 3-m point on the measuring stick. To measure a particular tree, the measuring stick was placed vertically adjacent to the trunk of the tree at ground level. The observer then paced away from the stick until the stick's markings lined up to the 3-m markings on the reader when held at arm's length from the observer. At this point, the reader was used to measure all linear tree dimensions in 3-m and/or 0.25-m intervals, whichever was required. If a tree was on a slope, its height was calculated on the uphill side. Initially, a clinometer was used for calibration testing of the modified 'one-man' method, particularly for tree heights. The measurements corresponded well and the results obtained from the fibreglass reader were constantly within 0.5 cm of the clinometer readings (Barrett 2009).
According to Chapman et al. (1992), the various methods of estimating resource abundance (particularly fruit) for biological studies are all susceptible to potential errors and no particular method is more suitable than any other. Various authors have a predisposition towards specific methods based on personal preference, the objectives of the research being undertaken or the repeatability of the method(s) being employed. As the LDNR falls within the savanna biome, and because the nature of savanna trees differs significantly from those occurring in forest environments (Hoffman & Franco 2003; Hoffman et al. 2005), a combination of visual estimates, actual fruit counts and canopy volume extrapolation was used in this study. Only one observer collected all the phenological data over the study period, hence there was no need to do any inter-observer variability calculations or adjustments.
RESULTS
Vegetation classification
For the purposes of this paper, only the major plant communities of the home ranges of the study troops are described. More detailed classification and descriptions of the sub-communities and their associated habitats can be found in Barrett (2009). All references to species groups refer to Tables 1 and 2 (see online supplement).
Donga home range
The Donga home range could typically be classified as Acacia caffra-Rhus leptodictya woodland; however, for the purposes of the comprehensive vervet study, it was necessary to do a more detailed vegetative analysis of the area. Noteworthy species occurring within the home range include the small, erect, deciduous tree Dombeya rotundifolia, the tree Faurea saligna, the deciduous shrub Dichrostachys cinerea, the erect shrub Lippia javanica, the spiny, multi-stemmed shrub Rhus pyroides, the multi-stemmed Grewia spp. shrubs, the shrub Euclea crispa, and the tufted, perennial grasses Setaria sphacelata var. sphacelata and Panicum maximum.
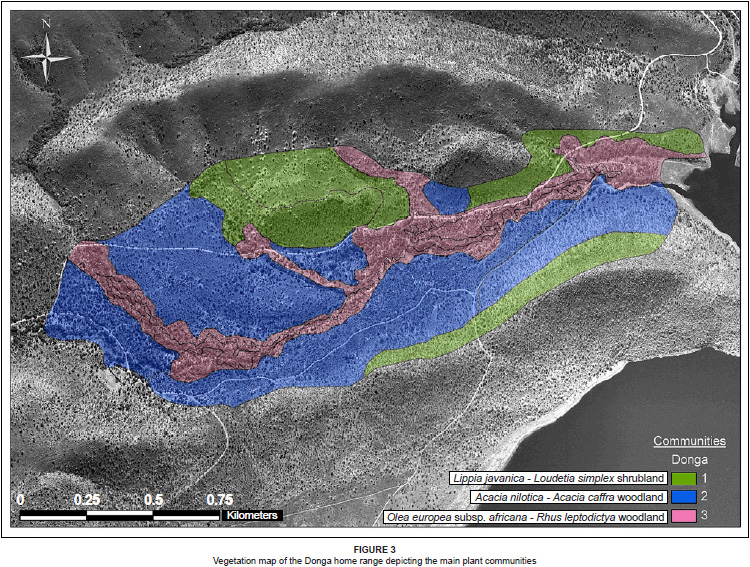
Seven plant communities that can be grouped into the following three major communities were identified in the Donga troop's home range, which are shown in Figure 3 (Figure 3 and Table 1, see online supplement):
1. Lippia javanica-Loudetia simplex shrubland
2. Acacia nilotica-Acacia caffra woodland
3. Olea europea subsp. africana-Rhus leptodictya woodland
Description of the Donga home range plant communities
The Donga home range is characterised by a large donga (gully) cutting through its centre. The large donga has several, smaller, subsidiary dongas that merge into it at various locations along its course as it winds down towards the Loskop Dam. Vegetation in and adjacent to the donga was characterised by large riverine trees and shrubs with a sparse to non-existent grass and forb layer. Areas between the dongas were covered by open woodland.
1. Lippia javanica-Loudetia simplex shrubland: This shrubland community covers approximately 25% (55 ha) of the Donga home range and consists of relatively rocky terrain that varies from gentle, low-lying valley bottoms to steeper midslopes. There were signs of trampling, and several animal tracks were observed throughout this community. Evidence of fire damage could be seen in places, but this was not recent and was likely due to the burning programme that is in place in the reserve. Soils were sandy and well drained. Rock cover ranged from 10% to 90%, with an average of 59%, and erosion was estimated at 22% (slight). Altitude ranged from 1018 m to 1105 m, with the average slope being 16º.
Species belonging to species group A were diagnostic for this community (Table 1, see online supplement). The woody vegetation is dominated by the large shrub Ximenia caffra (species group A). The tree F. saligna and the erect shrub L. javanica (species group J) are prominent. The grass layer is dominated by the tufted perennial grasses S. sphacelata var. sphacelata (species group J), Loudetia simplex (species group A) and Hyparrhenia hirta (species group E).
The average number of plant species recorded in this community was 24 per 400 m2. The tree layer has a canopy cover ranging between 2% and 50%, the shrub layer 4% and 15%, the grass layer between 21% and 70%, and the forb layer, between 1% and 2%.
The tree F. saligna had the highest density of 472 individuals per ha, followed by the shrub D. cinerea with 405 individuals per ha and the tree A. caffra with 215 individuals per ha.
Two sub-communities were distinguished, namely the Lippia javanica-Loudetia simplex-Sclerocarya birrea woodland and Lippia javanica-Loudetia simplex-Acacia caffra woodland.
2. Acacia nilotica-Acacia caffra woodland: This woodland community covers approximately 52% (117 ha) of the Donga home range and had relatively little rock cover, although there were sections that had a high cover. Rock cover ranged from 1% to 90%, with an average of 17%. The erosion was estimated at 15% (slight), and altitude ranged from 1015 m to 1090 m, with an average slope of 8º.
Species belonging to species group F are diagnostic for this community (Table 1, see online supplement). The woody vegetation is dominated by the small- to medium-sized deciduous tree A. caffra and the shrub E. crispa (species group M). The medium-sized tree R. leptodictya (species group M), the small, erect, deciduous tree D. rotundifolia (species group J), the shrub Acacia nilotica (species group F), and the deciduous shrub D. cinerea (species group J) are all prominent. In the grass layer, the tufted perennial grass P. maximum (species group L) is locally prominent.
The average number of plant species was 27 per 400 m2 in this community. The canopy cover for the tree layer ranged between 17% and 60%, the shrub layer between 17% and 57%, with the grass layer relatively high, ranging between 25% and 77%. The forb layer is not well developed and covers between 1% and 5% of the area.
The tree A. caffra had the highest density of 1358 individuals per ha, followed by the shrub E. crispa with 1251 individuals per ha, and the shrub A. nilotica with 1205 individuals per ha.
Three sub-communities were distinguished, namely the Acacia nilotica-Acacia caffra-Cymbopogon pospischilii shrubland, the Acacia nilotica-Acacia caffra-Tragus berteronianus woodland and the Acacia nilotica-Acacia caffra-Elionurus muticus woodland.
3. Olea europea subsp. africana-Rhus leptodictya woodland: This woodland community covers approximately 23% (52 ha) of the Donga home range, with little rock cover and erosion. There are large trees throughout the area, with not much forb cover. Rock cover ranged from 1% to 70%, with an average of 9%, and erosion was estimated at 22% (slight). Altitude ranged from 1005 m to 1093 m, with the average slope being 20º. Species belonging to species group K were diagnostic for this community (Table 1, see online supplement). The woody vegetation is dominated by the small- to medium-sized evergreen tree Olea europea subsp. africana, the deciduous, round-crowned, small to large tree Celtis africana (species group K), the tree A. caffra, the medium-sized tree R. leptodictya and the large- to medium-sized tree Berchemia zeyheri (species group M). The small- to medium-sized trees Pappea capensis and Ziziphus mucronata (species group M), and the spiny, multi-stemmed shrub R. pyroides (species group L) are prominent. The grass layer is dominated by the tufted perennial grass, P. maximum, with the perennial herb Gerbera jamesonii (species group L) locally prominent. The average number of plant species was 18 per 400 m2 in this community. The tree and shrub layers covered between 5% to 95% and 1% to 12% respectively, compared to the 1% to 42% and 1% to 7% cover of the grass and forbs layers. The tree A. caffra had the highest density, with 236 individuals per ha, followed by the shrub E. crispa with 186 individuals per ha and the tree O. europaea subsp. africana with 136 individuals per ha.
Two sub-communities were distinguished, namely the Olea europea subsp. africana-Rhus leptodictya-Carissa bispinosa woodland and the Olea europea subsp. africana-Celtis africana-Mimusops zeyheri woodland.
Picnic home range
The Picnic home range could typically be classified as an Acacia karroo-Dichrostachys cinerea shrubland. In the same way that a detailed vegetative analysis was undertaken for the Donga home range, the Picnic home range was also analysed. Noteworthy species occurring within the Picnic home range include the small- to medium-sized deciduous tree A. caffra, the medium-sized tree R. leptodictya, the shrub Solanum panduriforme, the erect shrub L. javanica and the tufted, perennial grasses P. maximum and Heteropogon contortus.
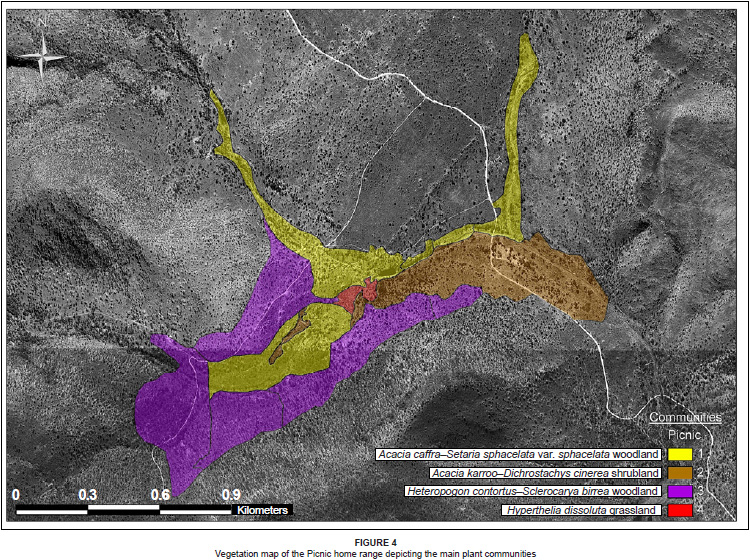
The Picnic home range comprises eight plant communities (shown in Figure 4), which can be grouped into the following four major community types (Table 2, see online supplement):
1. Acacia caffra-Setaria sphacelata var. sphacelata woodland
2. Acacia karroo-Dichrostachys cinerea shrubland
3. Heteropogon contortus-Sclerocarya birrea woodland
4. Hyperthelia dissoluta grassland
Description of the Picnic home range plant communities
The Picnic home range is characterised by a series of dry streambeds cutting through it. There are two small, man-made dams, previously used for livestock and agricultural purposes. The vegetation structure is mostly open shrubland and woodland, with a herbaceous layer generally depleted due to overgrazing with cattle and irregular agricultural practices that took place prior to the establishment of the LDNR. The grass layer is represented by P. maximum, which occurs throughout the home range, while H. contortus is prominent. Forbs are locally abundant throughout the home range, with several annual and geophytic species recorded seasonally.
1. Acacia caffra-Setaria sphacelata var. sphacelata woodland: This woodland community covers approximately 31% (42 ha) of the Picnic home range, with rock cover and erosion being relatively low. Rock cover ranges from 1% to 20% with an average of 8%, and erosion was estimated at 15% (slight). Altitude ranged from 1032 m to 1064 m, with the average slope being 12º.
Species belonging to species group A are diagnostic for this community (Table 2, see online supplement). The woody vegetation is dominated by the small- to medium-sized deciduous tree A. caffra (species group G), the evergreen shrub A. karroo and the deciduous shrub D. cinerea (species group N). The small, erect, deciduous tree D. rotundifolia, the spiny, multi-stemmed shrub R. pyroides, the shrub E. crispa (species group G), the erect shrub L. javanica (species group N) and the multi-stemmed shrub Grewia flava (species group F) are prominent. The tufted, perennial grasses P. maximum and H. contortus (species group N) dominate the grass layer.
The average number of plant species recorded for this community was 26 per 400 m2. The tree layer had a 13% - 60% cover, the shrub layer 5% - 60%, the grass layer 50% - 75%, and the forb layer had a 1% - 3% cover.
The shrub A. karroo had the highest density of 806 individuals per ha, followed by the shrub Gymnosporia buxifolia with 750 individuals per ha and the tree A. caffra with 625 individuals per ha.
Two sub-communities were distinguished, namely the Acacia caffra-Setaria sphacelata var. sphacelata-Ziziphus mucronata woodland and the Acacia caffra-Setaria sphacelata var. sphacelata-Dombeya rotundifolia woodland.
2. Acacia karroo-Dichrostachys cinerea shrubland: This shrubland community occurs in two stands, one forming the eastern boundary and the other, smaller section located in the central part of the home range. This shrubland covers approximately 22% (31 ha) of the Picnic home range (see Figure 4). Rock cover ranged from 1% to 5% with an average of 3%, and erosion was estimated at 38% (slight to moderate). Altitude ranged from 1031 m to 1052 m, with an average slope of 8º.
Species belonging to species group D are diagnostic for this community (Table 2, see online supplement). The woody vegetation is dominated by the evergreen shrub A. karroo and the deciduous shrub D. cinerea (species group N). The medium-sized tree R. leptodictya and the shrub S. panduriforme (species group G) are prominent. The grass layer is dominated by the tufted, perennial grasses Aristida stipitata and Eragrostis lehmanniana (species group G), with the tufted, perennial grasses H. contortus and P. maximum (species group N) being locally prominent.
The average number of plant species was 20 per 400 m2, while the tree layer covers between 10% and 80% and the shrub layer 10% - 80% of the area. As expected, the grass layer has a relatively low cover ranging between 5% and 40%, while the forb layer has a 1% cover.
The shrub A. karroo had the highest density of 558 individuals per ha, followed by the shrub D. cinerea with 483 individuals per ha and the shrub G. buxifolia with 408 individuals per ha.
3. Heteropogon contortus-Sclerocarya birrea woodland: This woodland community covers 46% (63 ha) of the Picnic home range and has relatively high rock cover and soil erosion. Rock cover ranged from 2% to 50%, with an average of 22%, and erosion was estimated at 21% (slight to moderate). Altitude ranged from 1045 m to 1097 m, with the average slope being 12º.
Species belonging to species group H are diagnostic for this community (Table 2, see online supplement). The woody vegetation is dominated by the evergreen shrub A. karroo and the deciduous shrub D. cinerea (species group N), with the erect shrub L. javanica (species group N) being locally prominent. The tufted, perennial grass H. contortus (species group N) dominates the herbaceous layer, with P. maximum (species group N) prominent locally.
The average number of plant species was 24 per 400 m2 in this sub-community. The tree layer had 28% - 36% cover, the shrub layer 11% - 26%, the grass layer 39% - 58% and the forb layer 1%.
The shrub D. cinerea had the highest density of 1133 individuals per ha, followed by the tree Combretum apiculatum with 1075 individuals per ha and the shrub A. karroo with 783 individuals per ha.
Four sub-communities were distinguished for this community, namely the Heteropogon contortus-Sclerocarya birrea-Urochloa oligotricha shrubland, the Heteropogon contortus-Sclerocarya birrea-Ledebouria apertiflora shrubland, the Heteropogon contortus-Sclerocarya birrea-Cenchrus ciliaris shrubland and the Heteropogon contortus-Sclerocarya birrea-Faurea saligna woodland.
4. Hyperthelia dissoluta grassland: This small grassland community covers 1% (2 ha) of the Picnic home range (see Figure 4). There were no surface rocks present and erosion was estimated at 45% (moderate). Altitude was 1052 m, with the average slope being 2º.
This community is characterised by the absence of diagnostic species and is distinguished by presence of species from species group M and the absence of species from species group L (Table 2, see online supplement). The small, round-crowned tree Ozoroa sphaerocarpa (species group H), the evergreen shrub A. karroo (species group N) and the tufted, perennial grass P. maximum (species group N) are prominent. The grass layer is dominated by the tufted, perennial grass Hyperthelia dissoluta (species group M).
The average number of plant species recorded in this community was 4 per 400 m2. The shrub layer had a 5% cover, while the grass layer covered 90% of the area. The shrub A. karroo had the highest density of 100 individuals per ha, followed by the shrub O. sphaerocarpa, with 50 individuals per ha.
Ordination
For both the Donga home range (see Figure 5a) and the Picnic home range (see Figure 5b) there was an overall positive association between rock cover and altitude (with the exception of community four in the Picnic troop), with higher lying (high altitude) areas being rockier than lower lying (low altitude) areas. Erosion was more evident in the lower lying areas, varying at intermediate altitudes, with the exception of Picnic community four, which occurred in a dry riverbed forming the confluence of two non-perennial streams. Erosion in the Picnic home range can largely be attributed to historical overgrazing by livestock and mismanagement of the natural vegetation.
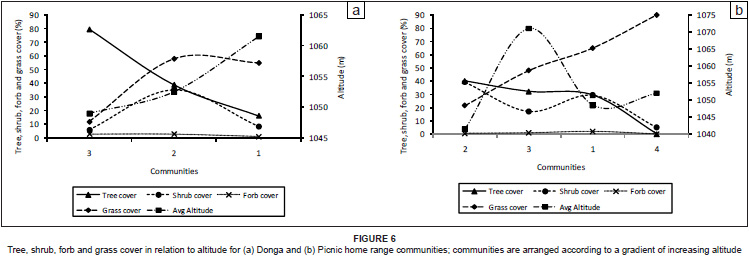
For the Donga home range there was an inverse relationship between tree cover and altitude, resulting in higher tree cover in lower lying areas than in higher lying areas (see Figure 6a). For the Picnic home range, tree cover was highest at intermediate altitudes, with lower tree cover recorded in high- and low-lying areas (see Figure 6b).
In the Donga home range, the shrub layer was predominantly represented in community two. Community two occurred at an intermediate altitude between communities one and three (see Figure 6a). The recorded canopy cover for the shrub layer in Donga community two was high in both the high-lying and low-lying areas, despite high tree-cover values and high exposure to wind, respectively. Shrub cover in the Picnic home range was highest at lower altitudes (see Figure 6b).
Floristic analysis
Donga home range
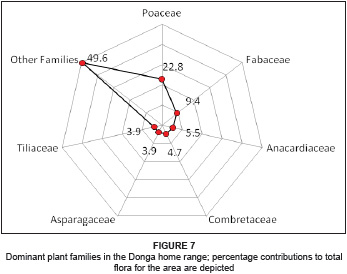
The flora in the Donga home range is represented by 43 families, constituting 94 genera with 127 species. The dominant plant family is Poaceae, constituting 22.8% (29 species) of the total flora, followed by Fabaceae, with 9.4% (12 species). Subsidiary families include the Anacardiaceae, with seven species representing 5.5% of the total flora, Combretaceae, with six species representing 4.7%, and Asparagaceae and Tiliaceae, both with five species each representing 3.9%. Combined, these families represent 50.4% of the flora in the Donga home range, while the remaining 36 families constitute 49.6%, comprising 63 different species (see Figure 7).
Picnic home range
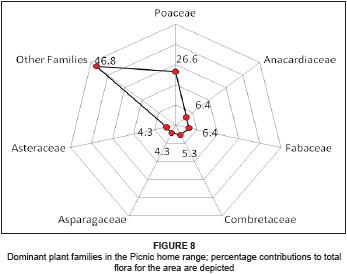
The flora of the Picnic home range is represented by 34 families, constituting 72 genera with 94 species. The dominant plant families are Poaceae, constituting 26.6% of the total flora, followed by the Fabaceae (6.4%) and Anacardiaceae (6.4%). The Poaceae comprise 25 species, with the Fabaceae and Anacardiaceae comprising six species each. Other families include Combretaceae, with five species representing 5.3% of the total flora, and Asparagaceae and Asteraceae, both with four species each representing 4.3%. Combined, these families represent 53.2% of the flora in the Picnic home range, while the remaining 28 families constitute 46.8%, comprising 44 different plant species (see Figure 8).
Differences between the Donga and Picnic home range plant family representation were not significant (t46 = 0.037, P = 0.97).
Resource items
The phenology of vervet resource items on resource tree species for the study period is shown in Figure 9.
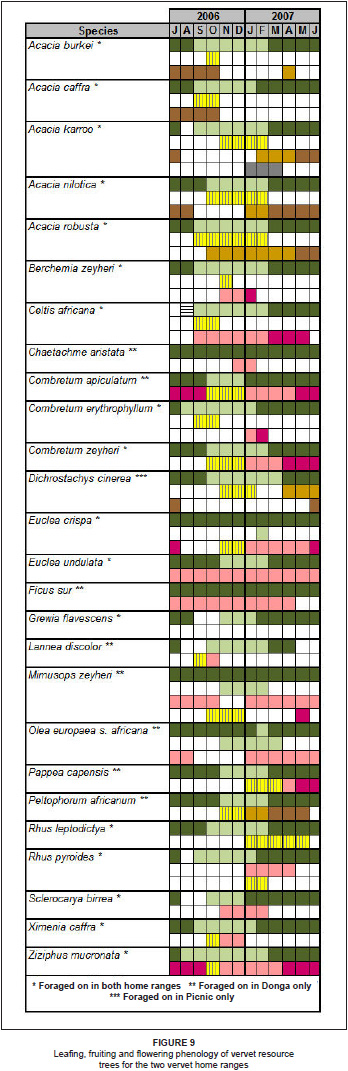
Vervet foods in the LDNR fell into two main seasonality categories. Some showed year-round availability, such as Euclea undulata, Mimusops zeyheri and Z. mucronata, which are keystone or mainstay species, while others are highly seasonal. These latter species are available only at certain times of the year, such as the various Acacia sp. pods, B. zeyheri fruits, C africana fruits, O. europaea subsp. africana fruits, Lannea discolor fruits and Sclerocarya birrea fruits (see Figure 9).
Resource availability
Although vervets have eclectic diets and generally eat whatever is available to them (Lee & Hauser 1998), predicting what they will consume at different times of the year is difficult because of the considerable seasonality of plant productivity in savannas, driven by variable rainfall and temperature (Solbrig 1996). Some trees require specific environmental conditions to synchronise before they produce fruit or resources (Chapman et al. 2005), resulting in the vervets not being able to achieve complete dietary stability and their diets thus varying based on current availability. The main forage species showed heterogeneity across months in their contribution to the vervets's diets. As a result, while the vervets consumed different plant specie resource items in different months, there was a constant supply of resource items throughout the year on resource tree species, especially leaves and fruit or pods (Figure 10). Fruits, however, showed a more complex pattern of availability across species, but fruits of some sort were also available and consumed in every month.
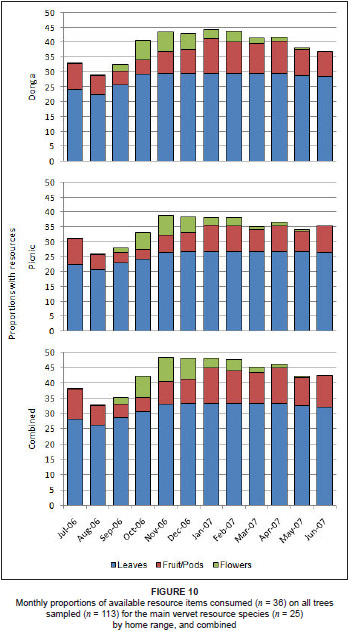
Comparisons of the available tree resources used by the two troops over the study period showed that there was a significant difference between the two home ranges for leaves (U = 27, P = 0.01), with trees in the Donga home range bearing more leaves than those in the Picnic home range. There were no significant differences for fruits or pods (U = 46, P = 0.13) and flowers (U = 65, P = 0.69).
DISCUSSION
In terms of plant species composition, the Donga home range shows similarity to the Faurea saligna-Setaria perennis, Acacia caffra-Setaria sphacelata and Combretum apiculatum-Heteropogon contortus tree savannas described by Theron (1973). There is also a similarity to the Acacia caffra-Setaria sphacelata community described for the two newly proclaimed areas (Rietfontein and Parys) by Götze et al. (1998). The Picnic home range has broad floristic similarity to the Acacia caffra-Combretum apiculatum-Themeda triandra and Combretum apiculatum-Heteropogon contortus tree savannas described by Theron (1973). There also are similarities to the Combretum apiculatum-Themeda triandra community described by Götze et al. (1998). Dominant Picnic home range tree species found in the Combretum apiculatum-Themeda triandra community include A. caffra, A. karroo and D. cinerea.
The vegetation of the two home ranges has general similarities and could be combined into a single, large Acacia caffra-Dichrostachys cinerea-Panicum maximum shrubland community. Prominent species include R. leptodictya, D. rotundifolia, B. zeyheri and Eragrostis chloromelas.
Ordination results for the home ranges show that tree and grass cover are negatively correlated, with increasing tree cover leading to decreased grass cover. Traditionally it was thought that trees in temperate savannas reduced understory plant productivity through competition for light, water and nutrients (McMurtrie & Wolf 1983; Walker & Noy-Meir 1982). Recent studies, however, suggest that the relationship between trees and understory plants is more intricate, and that isolated trees occurring in communities with low tree densities may in fact improve understory productivity (Belsky et al. 1993; Knoop & Walker 1985; Stuart-Hill, Tainton & Barnard 1987; Weltzin & Coughenour 1990). Thus the relationship between trees and understory plants is dynamic and various site-specific factors can influence interactions among them.
From the ordination, Donga community one has noticeably lower tree cover values than communities two and three, which are located at higher altitudes. This most probably could be explained by the lower temperatures at higher altitudes, while the effect of soil type and depth cannot be excluded. In the Picnic home range, community three occurs on foot- and midslopes and is signified by large S. birrea specimens. These foot- and midslopes provide a highly suitable habitat for large marula trees.
For both home ranges, the higher lying areas had higher grass cover than the lower lying areas, with the exception of community three in the Picnic home range. As mentioned above, community three had large S. birrea trees, providing too much shade for the grass layer to establish a dense sward; however, the shade-loving grass P. maximum occurs in dense patches in some localities.
The forb layer is not well developed in either of the two home ranges. Herbaceous plants that do occur are restricted to the shaded and sheltered areas under trees and shrubs, where soil moisture conditions are favourable. Forbs flourished after short periods (4-5 days) of abundant rainfall, but their tenure was transient, as the soils dried out rapidly when sunny conditions returned.
The results indicate higher numbers of large trees in the Donga home range than in the Picnic home range. Historically, farmers removed many large trees from the Picnic area for crop planting. It is speculated that the number of mature, seed-producing trees found in the Donga home range are a reason for the large quantity of young trees found in the area, because of the sheltered environment they provide for seedlings, and the seeds they produce. However, in most instances these saplings did not survive to become adults due to competition for light and resources, particularly in the densely shaded areas that comprise extensive portions of the Donga home range. The Picnic area had more medium-sized trees than the Donga area. This could be attributed to previous human interference that resulted in large, homogeneous stands of trees that were similar in size and age, including A. karroo and Terminalia brachystemma. The invasive, weedy annual herbs Bidens pilosa and Tagetes minuta occurred in both home ranges, but densities in the Picnic area exceeded those in the Donga area.
Floristic analyses showed that the Donga and Picnic home ranges have 30 plant families in common. The Donga home range has 13 families not represented in the Picnic home range, with the Picnic home range containing four families not represented in the Donga home range. Overall, the two home ranges show no significant differences when comparing results for plant family representation. The largest plant family represented in both home ranges is the Poaceae, which is the most dominant and economically important family of flowering plants worldwide (Walter 1979). The effects of seasonality on this family suggest that many species provide only temporary food supplies, especially during the dry period when grasses die back and store resources underground until favourable conditions return (Gibbs Russel et al. 1990). Fabaceae is the second largest plant family represented in the two home ranges. This family shows high nitrogen metabolism capabilities, often with root nodules containing nitrogen-fixing bacteria. This suggests resources with high protein and high energy content, which are sought after by foraging animals, including vervets (Grobbelaar & Rosch 1981). The plant families Anacardiaceae (the mango family), which contain mostly trees and shrubs, and Asteraceae (the daisy family), which occur mostly as herbs and sometimes as shrubs, are well represented in the Picnic home range.
From a structural perspective, both home ranges had similar tree cover values, with the Donga area containing more trees in the > 3 m class than the Picnic area, which had more trees in the > 1 m - 3 m class. In the Donga home range, tree cover was 46.7%, shrub 16.4%, forb 3.5% and grass 41.2%. Picnic area tree cover was 31%, shrub 25.7%, forb 1% and grass 51%. Overall vegetation cover in the Donga home range was 75.6%, compared to 70.6% in the Picnic home range.
The Donga home range was more heterogeneous compared to the Picnic area and provided a larger number of plant species for the vervets to feed on. The Donga troop exploited 36 different woody plant species, six of which constituted 50% of the total used. The Picnic troop used 21 different species, of which only two species were responsible for 50% of the total usage.
The Loskop vervet troops preferred riparian areas with large trees, venturing into less-preferred areas only when there was sufficient incentive to do so, such as the availability of various fruits. Highly used areas had relatively dense canopy cover, with trees that were sufficiently high to provide protection, resources and sleeping sites for the troops. For the Donga troop, community three, the Acacia nilotica-Acacia caffra woodland provided all of their requirements and the troop spent the majority of their time in this community during both the wet and the dry season (Barrett 2009). Community three contained the bulk of resource trees that the Donga troop utilised. For the Picnic troop, community one, the Acacia caffra-Setaria sphacelata var. sphacelata woodland, and community two, the Acacia karroo-Dichrostachys cinerea shrubland, were used most. Both these communities were adjacent to a non-perennial stream that had two man-made farm dams built in it. Trees growing along the edges of the stream provided food, safety and sleeping sites for the troop and they spent most of their time in these trees. Community two also contained a picnic site that was only frequented during school holidays or weekends, when visitor numbers increased. The troop generally spent less time in the area and preferred the natural food resources of communities one and two.
CONCLUSION
It is important that the different plant communities of the home range of animals are studied when conducting research on behavioural patterns. The Braun-Blanquet approach to classifying and identifying plant communities in the field provided an accurate and appropriate description of the vegetation for the purposes of this study. The results showed variations in the vegetation occurring in the two home ranges, with topographical differences and the effects of environmental factors influencing plant species availability. The Acacia nilotica-Acacia caffra woodland provided most of the food sources for the Donga troop, while the Acacia caffra-Setaria sphacelata var. sphacelata woodland and the Acacia karroo-Dichrostachys cinerea shrubland were utilised most for food by the Picnic group, suggesting that Acacia woodlands play an important role in providing habitat for vervets at Loskop Dam Nature Reserve. Similar communities have been described in other parts of the reserve (Götze et al. 1998; Theron 1973) and could be studied as possible habitats for vervet monkeys.
Overall resource plant availability and utilisation suggests that there is a large base of resources for both vervet troops to use in their respective home ranges. The effects of seasonality, with accompanying shifts in spatial and temporal resource abundance, could affect troop ranging patterns, particularly during the dry season when resources are less available.
The phenology of resources used by the two troops showed that both the Donga and Picnic home ranges had sufficient plant resources to meet the minimum habitat and energy requirements of vervet monkeys. There are sufficient food species in the home ranges to sustain viable troops, even during the drier periods when resources are less abundant, hence vervet presence in the area. The larger tree species provide protection from predators while the vervets feed and sleep. Both areas have access to drinking water.
Fire in the two troops's home ranges will have less of an impact on the Donga troop, as their resource trees occur mostly in or adjacent to the donga areas in their home range. These areas are relatively shady and there is not much fuel to sustain a fire under the trees. In addition, the large resource trees are sufficiently high to prevent excessive resource loss in the event of a fire going through the area. However, the grassy areas between the dongas will be affected by fire, although the Donga troop is not dependent on the resources found in these areas. The Picnic troop is more prone to resource loss from fire due to the homogenous nature of their home range and the general structure of the area. A large proportion of resource trees occurs interspersed throughout the area, with high fuel loads adjacent to and under them, making them susceptible to fire damage. A fire during the dry season could have a severe impact on vervet resources, and this would be exacerbated during a drought period. In the event of a fire occurring during such conditions, the resources that the vervets depend on might be insufficient to sustain the troop under natural conditions.
Editor: Llewellyn C. Foxcroft
ACKNOWLEDGEMENTS
We thank the staff and management of Loskop Dam Nature Reserve for allowing and encouraging the research. This research received financial support from the National Research Foundation.
REFERENCES
Barbour, M.G., Burk, J.H. & Pitts, W.D., 1987, Terrestrial plant ecology, 2nd edn., Benjamin Cummings, Massachusetts. [ Links ]
Barrett, A.S., 2009, 'Spatial and temporal patterns in resource dispersion and the structure of range use and co-existence in a social omnivore Chlorocebus aethiops', PhD dissertation, Department of Environmental Sciences, University of South Africa. [ Links ]
Barrett, A.S., Brown, L.R., Barrett, L. & Henzi, S.P., 2006, 'Phytosociology and plant community utilisation by vervet monkeys of the Blydeberg Conservancy, Limpopo Province', Koedoe 49(1), 49-68. [ Links ]
Barrett, L., 2000, Baboons: survivors of the African continent, London, Toucan Books. [ Links ]
Belsky, A.J., Mwonga, S.M., Amundson, R.G., Duxbury, J.M. & Ali, A.R., 1993, 'Comparative effects of isolated trees on their undercanopy environments in high- and low-rainfall savannas', Journal of Applied Ecology 30, 143-155. [ Links ]
Bredenkamp, G.J. & Bezuidenhout, H., 1995, 'A proposed 6variation in feeding and ranging behavior in primates', in T.H. Clutton-Brock (ed.), Primate ecology, pp. 539-556, Academic Press, London. [ Links ]
Emery, A.J., Lotter, M. & Williamson, S.D., 2004, Determining the conservation value of land in Mpumalanga, Mpumalanga Parks Board, Nelspruit. [ Links ]
Fensham, R.J. & Bowman, D.M.J.S., 1992, 'Stand structure and the influence of overwood on regeneration in tropical eucalypt forest on Melville Island', Australian Journal of Botany 40, 335-352. [ Links ]
Ferrar, T.A. & Lotter, M.C., 2007, Mpumalanga biodiversity conservation plan handbook, Mpumalanga Parks Board, Nelspruit. [ Links ]
Germishuizen, G. & Meyer, N.L. (eds.), 2003, 'Plants of Southern Africa: an annotated checklist', Strelitzia 14, National Botanical Institute, Pretoria. [ Links ]
Gibbs Russell, G.E., Watson, L., Koekemoer, M., Smook, L., Barker, N.P., Anderson, H.M. & Dallwitz, M.J., 1990, 'Grasses of Southern Africa', Memoirs of the Botanical Survey of South Africa, No. 58, Botanical Research Institute, South Africa. [ Links ]
Götze, A.R., Meyer, S., Cilliers, S.S. & Kellner, K., 1998, 'The classification of plant communities and range condition assessment of two new parts of Loskop Dam Nature Reserve, Mpumalanga', Honours study, School of Environmental Sciences and Development, Potchefstroom University for Christian Higher Education. [ Links ]
Grobbelaar, N. & Rosch, M.W., 1981, 'Biological nitrogen fixation in a Northern Transvaal savanna', Journal of South African Botany 47, 493-506. [ Links ]
Grobler, C.H., Bredenkamp, G.J. & Brown, L.R., 2006, 'Primary grassland communities of urban open spaces in Gauteng, South Africa', South African Journal of Botany 72, 367-377. [ Links ]
Hennekens, S.M., 1996, MEGATAB: a visual editor for phytosociological tables, Giesen, Ulft. [ Links ]
Hennekens S.M., 1996, TURBOVEG: Software package for input, processing and presentation of phytosociological data, Version 1.9, Lancaster University, Lancaster. [ Links ]
Hill, M.O., 1979, TWINSPAN: a Fortran program for arranging multivariate data in an ordered two-way table by classification of individuals and attributes, Cornell University, New York. [ Links ]
Hoffmann, W.A. & Franco, A.C., 2003, 'Comparative growth analysis of tropical savanna and forest trees using phylogenetically-independent contrasts', Journal of Ecology 91, 475-484. [ Links ]
Hoffmann, W.A., Franco, A.C., Moreira, M.Z. & Haridasan, M., 2005, 'Specific leaf area explains differences in leaf traits between congeneric savanna and forest trees', Functional Ecology 19, 932-940. [ Links ]
Isbell, L.A., Pruetz, J.D. & Young, T.P., 1998, 'Movements of vervets (Cercopithecus aethiops) and patas monkeys (Erythrocebus patas) as estimators of food resource size, density and distribution', Behavioral Ecology and Sociobiology 42, 123-133. [ Links ]
Kent, M. & Coker, P., 1997, Vegetation description and analysis - a practical approach, John Wiley & Sons, New York. [ Links ]
Knoop, W.T. & Walker, B.H., 1985, 'Interactions of woody and herbaceous vegetation in a southern African savanna', Journal of Ecology 73, 235-254. [ Links ]
Lee, P.C. & Hauser, M.D., 1998, 'Long-term consequences of changes in territory quality on feeding and reproductive strategies of vervet monkeys', Journal of Animal Ecology 67, 347-358. [ Links ]
Leighton, M. & Leighton, D.R., 1982, 'The relationship of size and feeding aggregate to size of food patch: howler monkey Alouatta palliate feeding in Trichilia cipo trees on Baro Colorado Island', Biotropica 14, 81-90. [ Links ]
Low, A.B. & Rebelo, A.G. (eds.), 1996, Vegetation of South Africa, Lesotho and Swaziland, A companion to the vegetation map of South Africa, Lesotho and Swaziland, Department of Environmental Affairs and Tourism, Pretoria. [ Links ]
Matthee, J.F. & Van Schalkwyk, C.J., 1984, A primer on soil conservation, Bulletin No. 399, Department of Agriculture, Government Printer, Pretoria. [ Links ]
McMurtrie, R. & Wolf, L., 1983, 'A model of competition between trees and grass for radiation, water and nutrients', Annals of Botany 52, 449-458. [ Links ]
Mucina, L. & Rutherford, M.C. (eds.), 2006, The vegetation of South Africa, Lesotho and Swaziland, Strelitzia, 19, South African National Biodiversity Institute, Pretoria. [ Links ]
Mueller-Dombois, D. & Ellenberg, H., 1974, Aims and methods of vegetation ecology, Wiley & Sons, New York. [ Links ]
Pruetz, J.L. & Isbell, L.A., 2000, 'Correlations of food distribution and patch size with agonistic interactions in female vervets (Cercopithecus aethiops pygerythrus senso lato) and patas monkeys (Erythrocebus patas) living in simple habitats', Behavioral Ecology and Sociobiology 49, 38-47. [ Links ]
Raemakers, J., 1980, 'Causes of variation between months in the distance travelled daily by gibbons', Folia Primatologica 34, 46-60. [ Links ]
Sarmiento, G. & Monasterio, M., 1983, 'Life-forms and phenology' in F. Brouliere (ed.), Ecosystems of the world, Tropical savannas 13, pp. 79-108, Elsevier, Amsterdam. [ Links ]
Singh, K.P., & Kushwaha, C.P., 2006, 'Diversity of flowering and fruiting phenology of trees in a tropical deciduous forest in India', Annals of Botany 97, 265-276. [ Links ]
Smit, G.N., 1989a, 'Quantitative description of woody plant communities: Part I. An approach', Journal of the Grassland Society of Southern Africa 6, 186-191. [ Links ]
Smit, G.N., 1989b, 'Quantitative description of woody plant communities: Part II. Computerized calculation procedures', Journal of the Grassland Society of Southern Africa 6, 192-194. [ Links ]
Smit, G.N., 1996, 'BECVOL: biomass estimates from canopy volume (version 2) - users guide', University of the Free State, Bloemfontein. [ Links ]
Solbrig, O.T., 1996, 'The diversity of the savanna ecosystem', in O.T. Solbrig, E. Medina & J.F. Silva (eds.), Biodiversity and savanna ecosystem processes: a global perspective, Ecological Studies, vol. 21, pp. 1-27, Springer Verlag, Berlin. [ Links ]
Stuart-Hill, G.C., Tainton, N.M. & Barnard, H.J., 1987, 'The influence of an Acacia karoo tree on grass production in its vicinity', Journal of the Grassland Society of South Africa 4, 83-88. [ Links ]
Terborgh, J., 1983, Five new world primates: a study in comparative ecology, Princeton University Press, Princeton. [ Links ]
Theron, G.K., 1973, 'n Ekologiese studie van die plantegroei van die Loskopdam Natuurreservaat [An ecological study of the vegetation of the Loskop Dam Nature Reserve]', PhD dissertation, Department of General Botany, University of Pretoria. [ Links ]
Van Schaik, C.P., Terborgh, J.W. & Wright, S.J., 1993, 'The phenology of tropical forests: adaptive significance and consequences for primary consumers', Annual Review of Ecology and Systematics 24, 353-377. [ Links ]
Walker, B.H. & Noy-Meir, I., 1982, 'Aspects of the stability and resilience of savanna ecosystem', in B.J. Huntley & B.H. Walker (eds.), Ecology of tropical savannas, pp. 556-590, Springer Verlag, New York. [ Links ]
Walter, H., 1979, Vegetation of the earth, Springer, New York. [ Links ]
Weltzin, J.R. & Coughenour, M.B., 1990, 'Savanna tree influence on understory vegetation and soil nutrients in northwestern Kenya', Journal of Vegetation Science 1, 325-332. [ Links ]
Werger, M.J.A., 1974, 'On concepts and techniques applied in the Zurich-Montpellier method of vegetation survey', Bothalia 11, 309-323. [ Links ]
Westhoff, V. & Van Der Maarel, E., 1978, 'The Braun-Blanquet approach', in R.H. Whittaker (ed.), Classification of plant communities, pp. 289-399, Dr W Junk, The Hague. [ Links ]
 Correspondence to:
Leslie Brown
Applied Behavioural Ecology and Ecosystem Research Unit, Department of Environmental Sciences, Unisa
Florida campus, Private Bag X6
Florida 1710, South Africa
email: lrbrown@unisa.ac.za
Received: 24 Feb. 2010
Accepted: 14 Aug. 2010
Published: 26 Oct. 2010
This article is available at: http://www.koedoe.co.za

