


Services on Demand
Article
 English (pdf)
 Article in xml format
 Article references
Indicators

Related links
-
 Cited by Google
 -
 Similars in Google
Share

 Permalink
Koedoe
On-line version ISSN 2071-0771
Print version ISSN 0075-6458
Koedoe vol.50 n.1 Pretoria Jan. 2008
ORIGINAL RESEARCH
The plant communities of the Andover Game Reserve, South Africa
Heath P. CronjeI; Mike D. PanagosII; Brian K. ReillyII
IDoornkloof Nature Reserve - South Africa
IIDepartment of Nature Conservation - Tshwane University of Technology - South Africa
ABSTRACT
Floristic characteristics of the Andover Game Reserve (AGR) were surveyed using an area-based survey technique and classified according to the data recorded from 88 relevés, using the PHYTOTAB-PC software package. Three plant communities, of which two each contain two variants, were described and mapped. The plant communities and their causative environmental factors were validated through detrended- and canonical correspondence multivariate analyses. The plant communities of the AGR were found to typify the floristics associated with the catenal sequences located in undulating areas on granite. Broad-leaved savanna is located at the crest and upper mid-slopes while fine-leaved savanna occurs along the footslopes of the AGR. Seeplines, a characteristic occurrence along catenas, are found at the transitional zone between the upper broad- and lower fine-leaved savanna plant communities. This study forms the basis for the compilation of a revised ecological management plan for the Andover Game Reserve.
Keywords: Plant communities, PHYTOTAB-PC, catena, savanna, granitic soils
Protected areas have been set aside for the protection of natural resources and to perpetuate the natural conditions (Visser et al. 1996) that are necessary for the continued existence of these systems. Management, in this context, is the practice by which that purpose is realised (Pyle 1980). For the effective management of any natural area a comprehensive description or base line study is of paramount importance (Barrett et al. 2006; Brown & Bezuidenhout 2000; Brown et al. 2005; Coombes & Mentis 1992; Reilly & MacFadyen 1992) as management decisions are based on a comprehensive understanding of the potential of an area. Management of a conservation area starts once the area has been defined on a map (Spinage 1979). Bredenkamp and Brown (2001) emphasised the use of plant communities as a reliable basis for ecological planning and management. This paper aims to describe the plant communities of the Andover Game Reserve (AGR), South Africa, and forms a critical part in the compilation of a revised ecological management plan for the reserve.
STUDY AREA
The AGR is situated between the southern latitudes 24º 33' and 24º 38' and eastern longitudes 31º 10' and 31º 17', and encompasses an area of 7 100 ha. The AGR is approximately 20 km southwest of the Orpen gate of the Kruger National Park. The physiography is characterised by an undulating landscape with interspersed drainages and upper landscapes arranged predominantly from a westerly to an easterly direction. The AGR is located within the Bushveld Lowveld region of the revised Köppen climate classification (Kruger 2004; Schulze 1994) and receives a mean annual precipitation of 782.9 mm (AGROMET 1996). Mean daily maximum temperatures in January and July are 31.7 ºC and 24 ºC, with the mean daily minimum being 20.1 ºC and 9.2 ºC for the same periods, respectively (AGROMET 1996). The geology of the Pilgrim's Rest area, which includes the Lowveld, has been described by Walraven (1989). The AGR is situated on the Swazian basement complex, which consists predominantly of gneisses and granites. The north-western section of the AGR comprises grey to pale-brown, medium- to course-grained quartz-feldsparbiotite gneiss with subordinate mafic to ultramafic xenoliths. The south-eastern section of the AGR consists of Makhutswi gneiss, which is light-grey, medium-grained biotite gneiss with course-grained quartz-feldspar leucosomes (Walraven 1986). The reserve incorporates a combination of two Veld Types, namely Veld Type 10 or Lowveld and Veld Type 11, also known as Arid Lowveld (Acocks 1988), and collectively described by Driver et al. (2005) as Granite Lowveld Bushveld. Recently this area has been described as the Granite Lowveld by Mucina and Rutherford (2006).
METHODS
The level of detail required from a particular study, determines the working scale or associated sampling scale, which in turn determines the smallest mappable unit area both in terms of field procedures and cartography (Rutherford & Westfall 1986). Pressey and Bedward (1991) and Panagos (1995) illustrated the effect of different scales on the same data set, where at socalled coarse scales the data set showed fewer groups than when classified for finer scales. Panagos (1995) and Westfall et al. (1996) recommend a sampling scale of 1:12 000 for areas less than 10 000 ha in extent. A recent (1996) monochrome 1:60 000 aerial photograph was used to construct a photographic mosaic that was then enlarged to a scale of approximately 1:13 000. The photographic mosaic was stratified into eight relatively homogeneous areas using a method that involved the recognition of pattern based on texture and grey values (Cronje 2004; Panagos et al. 1998). The number of sampling quadrats positioned in each homogeneous unit depended on the size of the area: the larger the area the higher the number of sampling quadrats allocated to the unit. A minimum of four sampling quadrats was allocated to the smaller homogeneous units to maximise detection of variability. The sampling quadrat area was set at 200 m2 (10 m x 20 m), relative to the sampling scale (Westfall et al. 1997). This quadrat size has become established as an optimised area for savanna (Boucher & Jarman 1977; Bredenkamp 1975; Panagos et al. 1998; Panagos & Reilly 2006; Theron 1973; van Rooyen 1983; Werger 1974). A total of 88 quadrats were subjectively placed throughout the homogeneous strata as identified on the aerial photographic mosaic. Relevés were located in the field using a Global Positioning System (GPS), the aerial photographic mosaic and a topographic map (Cronje 2004).
Each relevé was geo-referenced using a GPS and the environmental factors recorded at each quadrat included: topographic unit (i.e. crest, mid-slope, footslope, riverine); slope in degrees (estimated); aspect in degrees, with the aid of a compass; soil form, with diagnostic horizons identified up to a depth of 1.2 m according to MacVicar et al. (1991); soil characteristics were classified (sandy, loam or clay) based on a texture analysis using the 'sausage test' (Brady 1984); and the visual occurrence of fire and any other noticeable disturbances.
The floristic parameters recorded at each quadrat were species composition, growth forms (tree, shrub, dwarf shrub, grass, and forb) according to Edwards (1983) and Westfall (1992), and canopy cover determined with the use of the Plant Number Scale (Westfall & Panagos 1988; Westfall et al. 1996.) A community composition analysis (Panagos et al. 1998; Westfall et al. 1996) was carried out for each community and variant. It entailed calculating the projected canopy cover-to-frequency ratios of species in five growth form classes (tree, shrub, dwarf shrub, grass, and forb) using PHYTOTAB-PC (Westfall 1992). A linear relation between cover and frequency is assumed and the expected cover for the actual frequency of each species in a community is calculated according to the linear regressions. Three distinct groups are formed i.e. those with a higher cover and those with a lower cover than the standard error of the mean. The third group of species falls between the first two groups. The first group is referred to as strong competitor species because of the high individual resource-space requirements and the second group is called weak competitor species because of the low individual resource-space requirements. The third group is termed normal competitor species. Plant species nomenclature followed that of the National Herbarium, Pretoria (Germishuizen & Meyer 2003).
The floristic data were classified using the PHYTOTAB-PC program package (Westfall 1992, Westfall et al. 1997) and the resultant plant communities were validated using a Detrended Correspondence Analysis (DCA) using the CANOCO software package (ter Braak & milauer 1998). A Canonical Correspondence Analysis (CCA) (ter Braak & milauer 1998) was used to validate floristic and environmental relations.
RESULTS
Classification
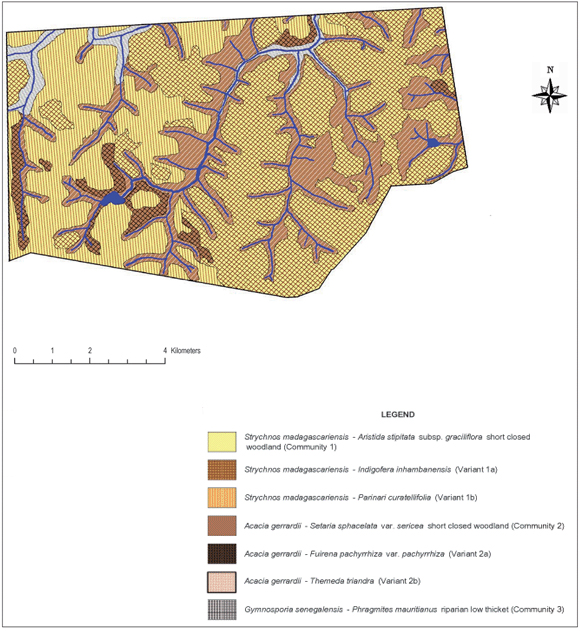
A total of 333 plant taxa were recorded in three main plant communities, with the first two plant communities each having two variants (Table 1). The identified plant communities were as follows:
1. The Strychnos madagascariensis -Aristida stipitata var. graciliflora short closed woodland
1a The Strychnos madagascariensis -Indigofera inhambanensis variant
1b The Strychnos madagascariensis -Parinari curatellifolia variant
2. The Acacia gerrardii -Setaria sphacelata var. sphacelata short closed woodland
2a The Acacia gerrardii -Fuirena pachyrrhiza var. pachyrrhiza variant
2b The Acacia gerrardii -Themeda triandra variant
3. The Gymnosporia senegalensis -Phragmites mauritianus riparian low thicket
The species groups were arranged to highlight the environmental gradients associated with savanna sandveld ecosystems. The phytosociological classification consists of 12 species groups (A–L) of which 205 (61.7%) and 128 (38.4%) species constitute the diagnostic and non-diagnostic portions, respectively (Table 1). A vegetation map of the AGR providing the spatial occurrence of the plant communities is presented in Fig. 1.
Description of plant communities
The Strychnos madagascariensis - Aristida stipitata var. graciliflora short closed woodland (Community 1)
Community 1 (Fig. 1; Table 1, Species Group A) occurs throughout the reserve, predominating on the crests and upper mid-slopes of the landscape with a slope ranging between 2º and 5º. The soils found in these physiographic units are deep sandy soils (mean clay > 5%), with a mean depth of 1 m. Soil forms associated with this plant community are Hutton, Clovelly and Cartref (MacVicar et al. 1991). This community contributes the most to the overall species richness of the AGR, with a total of 258 plant species (Table 2), of which the majority, 15.7% and 45.4%, of the species richness is within the grass and forb growth forms, respectively (Table 3). The woody component of the community is dominated (in terms of cover) primarily by Terminalia sericea and Dichrostachys cinerea with 12.2% and 8.2% cover, respectively (Table 4). Terminalia sericea forms dense fringes of varying degrees toward the lower portions of the mid-slopes. Strychnos madagascariensis is a weak competitor with a density of three trees per hectare (Table 4). Digitaria eriantha, Hyperthelia dissoluta, Panicum maximum (mainly under tree canopies) and Perotis patens are dominant (in terms of cover) in the herbaceous layer (Table 4). Aristida stipitata subsp. graciflora occurs as a normal competitor (Table 4). The forbs, Agathisanthemum bojeri subsp. bojeri, Chamaecrista absus, Vernonia steetziana, Tagetes minuta and Wahlenbergia banksiana occur as strong competitors (Table 4). The actual cover contribution of each growth form in this community is shown in Fig. 2, with a high total percentage cover of 67.8%.
The Strychnos madagascariensis - Indigofera inhambanensis variant 1a
Variant 1a occurs mainly in the eastern half of the reserve (Fig. 1; Table 1, Species Group B), where the predominant underlying geology is grey to pale brown, medium- to course-grained quartz-feldspar-biotite gneiss with subordinate mafic to ultramafic xenoliths (Walraven 1986). The species richness consists of 197 plant species (Table 2), with the dwarf shrub (14.5%), grass (14.9%) and forb (49%) growth forms contributing the most to the species richness of this variant (Table 3). Dominant species (in terms of cover) include the trees Dichrostachys cinerea, Terminalia sericea, the grasses Perotis patens, Digitaria eriantha, Bulbostylis contexta, Hyperthelia dissoluta, Panicum maximum, and the forbs Tagetes minuta, Chamaecrista absus, Vernonia steetziana and Agathisanthemum bojeri subsp. bojeri (Table 5). Indigofera inhambanensis is within a normal competition range (Table 5). The vegetation structure in terms of the actual percentage cover relative to each growth form is illustrated in Fig. 2, with a total cover of 64.9%
The Strychnos madagascariensis -Parinari curatellifolia variant 1b
This variant (1b) of Community 1 occurs within the western portion of the reserve (Fig. 1; Table 1, Species Group C). The underlying geology consists of Makhutswi gneiss, which is light-grey, medium-grained biotite gneiss with course-grained quartz-feldspar leucosomes (Walraven 1986). The occurrences of frequent fires (annually) from the bordering rural communities may be an additional causative factor of this variant. The species richness of this variant is slightly higher (207 species) than that of Variant 1a (Table 2), with the grass (17.8%) and forb growth forms (43.9%) contributing the most to the variant's species richness (Table 3). Dichrostachys cinerea and Terminalia sericea remain strong competitors in the tree growth form (Table 6). Euclea divinorum and Phyllanthus reticulatus are strong competitors in the shrub and dwarf shrub growth forms, respectively (Table 6). Fuirena pachyrrhiza var. pachyrrhiza, Perotis patens, Cynodon dactylon, Hyperthelia dissoluta and Panicum maximum are dominant grasses in terms of cover, of which the latter two are also strong competitors (Table 6). Strong forb competitors include Bidens bipinnata, Wahlenbergia banksiana and Agathisanthemum bojeri subsp. bojeri (Table 6). The growth forms depicting community structure relative to their actual percentage canopy cover are shown in Fig. 2, with a high community cover of 72.8%.
The Acacia gerrardii - Setaria sphacelata var. sphacelata short closed woodland (Community 2)
Community 2 (Fig. 1; Table 1, Species Group D) occurs on the lower mid-slopes and footslopes of the AGR, with a slope ranging between 5º and 10º. The soils are sandy-loam (mean clay 5–10%) towards the lower mid-slopes, becoming more clayey (mean clay > 50%) on the footslopes. Soils occurring in the plant community are: Cartref, Fernwood, Katspruit, Kroonstad, Sepane, Valsrivier and Sterkspruit (MacVicar et al. 1991). The mean soil depth is 1 m along the lower mid-slopes, decreasing to 0.5 m along the footslopes. A total of 222 plant species (Table 2) occur in the community, with the highest species richness being in the forb (39.7%) growth form (Table 3). The dominant trees (in terms of cover) are Aristida stipitata subsp. graciliflora, Acacia nilotica, Combretum hereroense, Dichrostachys cinerea and the shrub Euclea divinorum, of which the latter three species are also strong competitors (Table 7). Dominant grasses (in terms of cover) include Eragrostis gummiflua, Eragrostis curvula, Digitaria eriantha, Setaria sphacelata var. sphacelata, Bulbostylis contexta, Hyperthelia dissoluta and Panicum maximum, with the four latter species also being strong competitors (Table 7). Although Hyperthelia dissoluta occurs as a strong competitor, its dominance in terms of cover (3.9%) is substantially lower in contrast to its dominance in Community 1 and its Variants 1a and 1b (Table 4, Table 5 and Table 6). Noticeably strong forb competitors are Chaetacanthus setiger and Epaltes gariepina (Table 7). The actual canopy cover contribution of each growth form within the plant community is shown in Fig. 2, with the total percentage cover for the community being 65.6%.
The Acacia gerrardii - Fuirena pachyrrhiza var. pachyrrhiza variant 2a
This variant (Fig. 1 Table 1, Species Group E) is indicative of the seeplines and the transition areas between the broad- and fineleaved savanna. Soils occurring in this vegetation unit have a characteristic G-Horizon, namely Katspruit and Kroonstad (MacVicar et al. 1991). As a result of the G-Horizon, seasonal water emerges to the surface forming wet-spots or seeplines, with characteristic hydromorphic species (i.e. within the grass and forb growth forms) dominating these areas. The floristic richness consists of 147 individual species (Table 2) with the grass and forb layers contributing 19.4% and 42.9% (Table 3), respectively, to the species richness of this variant. Diagnostic species are Fuirena pachyrrhiza var. pachyrrhiza and Vahlia capensis subsp. vulgaris var. vulgaris (Table 1, Species Group E), with Eragrostis inamoena, Eragrostis gummiflua, Eragrostis curvula, Cyperus denudatus and Cyperus sphaerospermus occurring as normal competitors in this hydromorphic vegetation unit (Table 8). Species growth relations within this variant are presented in Table 8. Hyperthelia dissoluta remains a strong grass competitor (Table 8), primarily occurring towards the upper regions of this lower mid-slope vegetation unit. Epaltes gariepina is a strong forb competitor indicative of wet or seepline areas (Table 8). Dichrostachys cinerea remains a strong competitor within the woody component of this vegetation unit (Table 8). The total percentage cover for the variant is 71.1%, with proportions within the woody, herbaceous and forb components being 15%, 39.6% and 15.7% (Fig. 2), respectively, clearly demonstrating the hydromorphic characteristic of the seepline with a clear reduction in the occurrence of the woody components in these areas.
The Acacia gerrardii - Themeda triandra variant 2b
This variant (Fig. 1; Table 1, Species Group F) is restricted to the footslopes of the study area and follows the drainage lines originating in the south and flowing in a northerly direction. The variant is also located along the drainage lines in the eastern parts of the reserve. Soil forms in this vegetation unit are predominantly Sterkspruit, Sepane and Valsrivier, which are duplex soils (MacVicar et al. 1991). Duplex soils are characterised by an abrupt textural or structural transition between the surface horizon and the subsoil (Matthee 1996). The Glenrosa soil form (MacVicar et al. 1991) also occurs where the parent granite rock lies shallow below the surface. The species richness in this variant amounts to 193 individual species (Table 2), with the forbs contributing the most (39.2%) to this vegetation unit (Table 3). Dominant species (in terms of cover) include the trees Dichrostachys cinerea, Combretum hereroense, Acacia nilotica, Acacia gerrardii, the shrub Euclea divinorum, the grasses Panicum maximum, Setaria sphacelata var. sphacelata, Digitaria eriantha, and the forbs Chaetacanthus setiger and Epaltes gariepina (Table 9). The total canopy cover for this variant is 62.1% (Fig. 2).
The Gymnosporia senegalensis - Phragmites mauritianus riparian low thicket (Community 3)
This plant community (Fig. 1; Table 1, Species Group J) is found along the seasonal rivers occurring in the northern and north-western corner of the reserve. Alluvial soils are the predominant soils in the community. This community has the lowest species richness with a total of 118 species (Table 2), with the shrub (17.7%), grass (17.7%) and forb (44.6%) growth forms contributing the most to the species richness of this vegetation unit (Table 3). Combretum imberbe and Gymnosporia senegalensis are strong woody competitors (Table 10). Dominant herbaceous species (in terms of cover) include Eriochloa meyeriana subsp. meyeriana, Eustachys paspaloides, Phragmites mauritianus and Panicum maximum, of which Phragmites mauritianus is a strong competitor (Table 10). Hypoestes forskaolii 'form B' is a strong forb competitor (Table 10). The community structure expressed as a percentage actual cover contributed by each growth form is illustrated in Figure 2. The total class cover is 99.4% and is indicative of dense river vegetation, particularly within the grass (48.9%) and forb (21%) growth forms (Fig. 2). The woody proportion constitutes 18.4% of the total class cover (Fig. 2) and the high percentage grass cover found in this riparian community is due to the inclusion of the reed Phragmites mauritianus in the grass growth form, contributing 22.2% cover on its own (Table 10).
Verification of the plant communities
A DCA of the AGR data set using CANOCO (ter Braak & milauer 1998) provided a significant standard deviation gradient of 4.7 on the first axis with further significant and modest gradients on axes 2, 3, and 4 (Table 11). The cluster diagrams generated by CANOCO (Fig. 3 & Fig. 4) reflect similar groupings to the relevé groupings generated by the PHYTOTAB-PC (Westfall 1992) classification programme (Table 1). A separation is evident between Community 3 (relevés highlighted in blue) and the terrestrial communities (1 & 2 plus their variants) (relevés highlighted in red) (Fig. 3). Excluding the riparian community (3) from the data set and performing another secondary ordination expands the terrestrial communities with relevés highlighted in blue, black and red, representing Community 1, Variant 2a and Community 2, respectively (Fig. 4). Outliers in terms of seepline (Variant 2a) relevés are highlighted in green. The lack of clustering of the seepline relevés (Fig. 4) can be attributed to the catenal phenomenon in terms of the variable width of the seeplines and their similarities to the adjacent plant communities with regard to being transitional between the upper and lower plant communities.
Of the environmental factors recorded, the factor most likely to have had the greatest influence computed by a CCA (Table 12) on the distribution of plant communities within the AGR was soil in terms of moisture and clay content.
DISCUSSION
The AGR's undulating granitic physiography resulted in the identification of a catenal sequence similar to that described by Scholes (1986, 1997). The plant communities of the AGR are thus a function of the catenal sequence in the Granite Lowevld Bushveld (Cronje 2004; Driver et al. 2005), reflecting a mosaic of units having a 'tortoise shell' appearance. Although plant species composition is influenced by such soil properties as nutrient status, pH, salinity and texture, the overwhelming factor determining the spatial distribution and productivity of forest, savanna and grassland is soil moisture balance (Tinley 1982; Walker 1985). At a scale of hundreds of meters to kilometres, the migration of fine soil particles and ions from ridge crests to valley floors, under the influence of water movement and gravity, establishes a topo-sequence of soils and associated vegetation known as a catena (Scholes 1997). The availability of this soil moisture to plants is dictated by the soil type, in terms of clay content. Fine-textured soils along the foot-slopes (high clay) are more xeric and thus water in these soils is limiting for much of the year. Under the same climatic conditions in sandy soils (i.e. along the crests and upper mid- slopes), moisture is much less of a limiting factor (Knoop & Walker 1985) although it is quickly lost to the bottomlands. The sandy soils generally have an acidic pH, with alkaline soils on the footslopes (Bredenkamp 1982; Scholes 1986). Therefore the differences in soil constituency reflect plant productivity, vegetation structure and species composition (O' Connor 1985). Floristic richness is also influenced by climate and management factors such as grazing and fire (O'Connor 1991; O'Connor 1995; Scholes 1997; Teague & Smit 1992).
The vegetation of the AGR relative to the catenal sequence described by Scholes (1997) has the broad-leaved savanna (Community 1) occurring on the crests and upper mid-slopes with sandy soils and the fine-leaved savanna (Community 2) on lower mid-slopes and footslopes with clay soils. Another characteristic feature of the catenal sequence is the formation of seeplines (i.e. an intermittent perched water table) that have characteristic hydromorphic or dambo grassland species (Scholes 1986; 1997) and is represented on the AGR by the community Variant 2a. The formation of this hydromorphic grassland is as a result of the interface between the sandy upland and the clayey bottomland (Scholes 1997).
The influence of the interface of the sand and clay is not necessarily limited to a specific area but can expand from the moist seepline areas into the broad-leaved savanna particularly with regard to hydromorphic sedges and forbs, which are clearly noticeable in the phytosociological table (Table 1), as indicated by the bold broken line between Variants 2a and 1b (Species Group E). A possible reason for this could be a damming-up effect causing moisture to move upwards from the seepline, resulting in a higher moisture content in the lower section of Variant 1b and thus creating hydromorphic conditions similar to that of a seepline. Water moving downslope towards the evident interface would then result in a higher soil moisture content up to the seepline, where the water emerges, creating a hydromorphic grassland. Variant 2a (Acacia gerrardii -Fuirena pachyrrhiza var. pachyrrhiza) is clearly recognisable by the predominance of sedges and hydromorphic grasses and the sparseness of trees, as reflected by the proportional cover values of the woody, grass and forb growth forms being 15%, 39.6% and 15.7%, respectively (Fig. 2). This hydromorphic community is more moist than the areas above and below it and therefore remains green and palatable for longer periods of time, thus making it a valuable habitat for wildlife, especially during the dry winter season (Scholes 1986).
Floristic and habitat correlation
Floristic and habitat correlations not only aid in the verification of the vegetation classification but also provide an understanding of the causes of community differentiation (Westfall 1992).
Finding a correlation between habitat and plant communities does not necessarily validate a classification, because with all the habitat factors available it should be possible to find some or other correlation with a specific group of plants. What is important however is that habitat factors shown to correlate with the plant communities should form some sort of environmental gradient (Panagos et al. 1998). The initial CANOCO DCA (ter Braak & milauer 1998) ordination of all relevés provided a significant gradient (> 4 SD, Table 11). Scatter diagrams (Fig. 3 & Fig. 4) reflect relevé groupings similar to that produced by PHYTOTAB-PC (Westfall 1992). A CCA (ter Braak & milauer 1998) conducted on the environmental factors (Table 12) recorded in this study indicated soil texture (i.e. sandy, sandy loam, loam and clay), and hence soil moisture, to be the environmental factor that had the greatest influence on the plant community differentiation. The relevé grouping produced both by PHYTOTAB-PC (Westfall 1992) and CANOCO (ter Braak & milauer 1998) reflects a gradient relating to soil fertility and moisture clearly evident on catenas of granitic origin. Thus the DCA and the CCA supported and confirmed the vegetation classification of the AGR obtained in this study as analysed by PHYTOTAB-PC (Westfall 1992).
Conclusions
With the exception of the riverine work of Myburgh (1999), this is the first non-riverine application of a scale-related vegetation technique (Westfall et al. 1996) used in conjunction with PHYTOTAB-PC (Westfall 1992) in the Arid or Granitic Lowveld (Acocks 1988; Mucina & Rutherford 2006). The stratification and classification of the vegetation of the AGR at a scale of 1:13 000 has provided a map of the reserve with three main plant communities, two of which have two variants. The plant communities of the AGR are indicative of vegetation on deep sandy soils of the Granite Lowveld Bushveld Veld Type (Driver et al. 2005) with affinity to the catenal phenomenon. The
use of a multivariate data analysis technique on the AGR data set confirmed the phytosociological classification of AGR. The use of the scale-related vegetation survey technique (Westfall et al. 1996; Westfall & Panagos 1988) has provided quantitative data together with a vegetation map of the AGR, which can be used to formulate a management plan for the Andover Game Reserve.
An integral component of reserve management is the implementation of a vegetation monitoring programme for the Andover Game Reserve. The data collected in this study was objective with regard to the systematic manner (Cronje 2004) in which it was collected with the use of the Plant Number Scale (Westfall & Panagos 1988). It is recommended that an area-based monitoring technique that incorporates the data collected in this survey be used so that this baseline data can be expanded upon to benefit management decision support of the Andover Game Reserve.
ACKNOWLEDGEMENTS
The authors thank Mr A.J. Botha and Mr I.C. Sharp for logistical support and valued comments; the Tshwane University of Technology for funding; Dr W.J. Myburgh, Mr J.J. Kotze and Dr R.H. Westfall for assistance with data analysis; and Mrs I. Cronje for dedicated assistance and motivation.
REFERENCES
Acocks, J.P.H. 1988. Veld Types of South Africa. Memoirs of the Botanical Survey of South Africa, 57: 1-146 [ Links ]
AGROMET DATABASE. 1996. Pretoria: Agricultural Research Council, Institute for Soil, Climate and Water. [ Links ]
Barrett, A.S., Brown, L.R., Barrett, L. &. Henzi, S.P. 2006. Phytosociology and the plant community utilization by vervet monkeys of the Blydeberg Conservancy, Limpopo Province. Koedoe, 49(1): 49–68. [ Links ]
Boucher, C. & Jarman, M.L. 1977. The vegetation of the Langebaan area, South Africa. Transactions of the Royal Society of South Africa, 42: 241–272. [ Links ]
Brady, N.C. 1984. The nature and properties of soils (9th ed.). London: Collins Macmillan Publishers. [ Links ]
Bredenkamp, G.J. 1975. Plantsosiologiese studie van die Suikerbosrand Natuurreservaaat. MSc thesis, Pretoria: University of Pretoria. [ Links ]
Bredenkamp, G.J. 1982. 'n Plantekologiese studie van die Manyeletiwildtuin. DSc thesis, Pretoria: University of Pretoria. [ Links ]
Bredenkamp, G.J. & Brown, L.R. 2001. A reliable ecological basis for environmental planning. Urban Green File, November/ December 2001: 38–39. [ Links ]
Brown, L.R. & H. Bezuidenhout, H.B. 2000. The phytosociology of the De Rust section of the Mountain Zebra National Park, Eastern Cape. Koedoe, 43(1): 1–18. [ Links ]
Brown, L. R., Marais, H. , Henzi, S.P. & Barrett, L. 2005. Vegetation classification as the basis for baboon management in the Bourke's Luck Section of the Blyde Canyon Nature Reserve, Mpumalanga. Koedoe, 48(2): 71–92. [ Links ]
Coombes, P.J. & Mentis, M.T. 1992. A procedure for defining conservation management objectives and goals. In: Ebedes, H (ed.). Proceedings of the 3rd International Wildlife Ranching Symposium. Pretoria. [ Links ]
Cronje, H.P. 2004. Rangeland management implications of a scale-related vegetation survey in the Arid Lowveld, South Africa. MTech thesis. Pretoria: Tshwane University of Technology. [ Links ]
Driver, A., Maze, K., Rouget, M., Lombard, A.T., Nel, J., Turpie, J.K., Cowling, R.M., Desmet, P., Goodman, P., Harris, J., Jonas, Z. Reyers, B. Sink, K. & Strauss, T. 2005. National Spatial Biodiversity Assessment 2004: Priorities for biodiversity conservation in South Africa. Strelitzia, 17. Pretoria: South African National Biodiversity Institute. [ Links ]
Edwards, D. 1983. A broad-scale structural classification of vegetation for practical purposes. Bothalia, 14: 705–712. [ Links ]
Germishuizen, G. & Meyer, N.L. (eds.). 2003. The plants of southern Africa: an annotated checklist. Strelitzia, 14. Pretoria: South African National Biodiversity Institute. [ Links ]
Knoop, W.T. & B.H. Walker, B.H. 1985. Interactions of woody and herbaceous vegetation in a southern African savanna. Journal of Ecology, 73: 235–253. [ Links ]
Kruger, A.C. 2004. Climate of South Africa. Climate Region. WS45. Pretoria: South African Weather Service. [ Links ]
Macvicar, C.N., Bennie, A.T.P., Villiers, J.M., Ellis, J., Fey, M.V., Harmse, H.J., Von, M., Hensley, M., Lambrechts, J.J.N., Bruce, R.W., Dohse, T.E., Eloff, J.F., Grey, D.C., Hartmann, M.O., Idema, S.W.J., Laker, M.C., Merryweather, F.R., Michael, D., Schloms, B.H.A., Schönau, A.P.G., Snyman, K., Van Niekerk, B.J., Verster, E., Loxon, R.F., Meyer, J.H., Paterson, D.G., Schoeman, J.L., Scotney, D.M., Turner, D.P., Van Rooyen, T.H. & Yager. T.U. 1991. Soil classification: a taxonomic system for South Africa. Memoirs on the Agricultural Natural Resources of South Africa, No.15: 1–257. [ Links ]
Matthee, J.F.G. 1996. A primer on soil conservation. Pretoria: Government Printer. pp. 1–124. [ Links ]
Mucina, L. & Rutherford, M.C. (eds.). 2006. The vegetation of South Africa, Lesotho and Swaziland. Strelitzia, 19. Pretoria: South African National Biodiversity Institute. [ Links ]
Myburgh, W.J. 1999. Oewerplantegroei van die Olifantsriviersisteem – 'n ekologiese perspektief. Pretoria: Water Research Commission, Report No. 663/1/99. ISBN 1868455688. [ Links ]
O' Connor, T.G. 1985. A synthesis of field experiments concerning the grass layer in the savanna regions of southern Africa. South African National Scientific Programmes Report, 114: 1–26. [ Links ]
O'Connor, T.G. 1991. Influence of rainfall and grazing on the compositional change of herbaceous layer of a sandveld savanna. Journal of the Grassland Society of Southern Africa, 8(3): 103–109. [ Links ]
O'Connor, T.G. 1995. Transformation of savanna grassland by drought and grazing. African Journal of Range and Forage Science, 12(2): 53–60. [ Links ]
Panagos, M.D. 1995. A comparative classification of the Sourish- Mixed Bushveld on the farm Roodeplaat (293) using quadrat and point methods. MSc thesis. Petermaritzburg: University of Natal. [ Links ]
Panagos, M.D. & Reilly, B.K. 2006. Use of an area-based survey technique to detect vegetation changes in Sour Bushveld. Koedoe, 49(1): 69–77. [ Links ]
Panagos, M.D., Westfall, R.H., Van Staden, J.M. & Zacharias, P.J.K. 1998. The plant communities of the Roodelpaat Experimental Farm, Gauteng, South Africa and the importance of classification verification. South African Journal of Botany, 64(1): 44–46. [ Links ]
Pressey, R.L. & Bedward, M. 1991. Mapping the environment at different scales: benefits and costs for nature conservation. In: Margules, C.R. & Austin, M.P. (eds.) Nature conservation: cost effective biological surveys and data analysis. Canberra: CSIRO. [ Links ]
Pyle, R.M. 1980. Management in nature reserves. In: Soulé, M.E. & Wilcox, B.A. (eds.). Conservation Biology, an evolutionary ecological perspective. Sunderland: Massachusett: Sinauer. pp. 319–328. [ Links ]
Reilly, B.K. & Macfadyen, I.D. 1992. An eco-systematic procedural model for the ecological management of Letaba Ranch Game Reserve, Gazankulu. In: Ebedes, H (ed). Proceedings of the 3rd International Wildlife Ranching Symposium. Pretoria. [ Links ]
Rutherford, M.C. & Westfall, R.H. 1986. Biomes of southern Africa: An objective categorisation. Memoirs of the Botanical Survey of South Africa, 54: 1–98. [ Links ]
Scholes, R.J. 1986. A guide to bush clearing in the Eastern Transvaal Lowveld, 2nd ed. Johannesburg: University of the Witwatersrand. [ Links ]
Scholes, R.J. 1997. Savanna. In: Cowling, R.M., Richardsom, D. M. & Pierce, S.M. eds. Vegetation of Southern Africa. Cambridge: Cambridge University Press. pp. 258–277. [ Links ]
Schulze, B.R. 1994. Climate of South Africa (WB 28). Part 8. General Survey. Pretoria: Weather Bureau; Department of Environmental Affairs and Tourism. [ Links ]
Spinage, C.A.. 1979. What is wildlife management? In: Ajaya, S.S. & Halstead, L.B. (eds.). Wildlife management in Savanna woodland. London: Taylor & Francis, pp. 186–193. [ Links ]
Teague, W.R. & Smit, G.N. 1992. Relations between woody and herbaceous components and the effects of bush-clearing in southern African savannas. Journal of the Grassland Society of Southern Africa, 9(2): 60–71. [ Links ]
Ter Braak, C.J.F. & P. milauer, P. 1998. CANOCO Reference Manual and User's Guide to Canoco for Windows: Software for Canonical Community Ordination (Version 4). Ithaca: New York. Microcomputer Power. [ Links ]
Theron, G.K. 1973. 'n Ekologiese studie van die plantegroei van die Loskopdamnatuurreservaat. DSc thesis. Pretoria: University of Pretoria. [ Links ]
Tinley, K.L. 1982. The influence of soil moisture balance on the ecosystem patterns on southern Africa. In: Huntley, B.J. & Walker, B.H. (eds). Ecology of tropical savannas. Berlin: Springer-Verlag. [ Links ]
Van Rooyen, N. 1983. Die plantegroei van die Roodeplaatdamnatuurreservaat II. Die plantgemeenskappe. South African Journal of Botany, 2: 115–125. [ Links ]
Visser, N., Van Hoven, W. & Theron, G.K. 1996. The vegetation and identification of management units of the Honnet Nature Reserve, Northern Province, South Africa. Koedoe, 39(1): 25–42. [ Links ]
Walker, B.H. 1985. Structure and function of savannas: an overview. In: Tothill, J.H. & Mott, T.T. (eds). Ecology and management of the worlds savannas. Canberra: Australian Academy of Science, pp. 350–353. [ Links ]
Walraven, F. 1986. 2430 Pilgrim's Rest 1: 250 000 Geological Series. Pretoria: Government Printer. [ Links ]
Walraven, F. 1989. The geology of the Pilgrim's Rest area. Pretoria: Government Printer. [ Links ]
Werger, M.J.A. 1974. On concepts and techniques applied in the Zürich-Montpellier method of vegetation survey. Bothalia, 11: 309–323. [ Links ]
Westfall, R.H. 1992. Objectivity in stratification, sampling and classification of vegetation. PhD thesis. Pretoria: University of Pretoria. [ Links ]
Westfall, R.H. & Panagos, M. D. 1988. The plant number scale – an improved method of cover estimation using variable-sized belt transects. Bothalia, 18(2): 289–291. [ Links ]
Westfall, R.H., Theron, G.K. & Van Rooyen, N. 1997. Objective classification and analysis of vegetation data. Plant Ecology, 132: 137–154. [ Links ]
Westfall, R.H., Van Staden, J.M., Panagos, M.D., Breytenbach, P.J.J. & Greef, A. 1996. Scale-related vegetation sampling. ARC – Range and Forage Institute. Private Bag X05, Lynn East 0039. [ Links ]
 Correspondence to:
Heath P. Cronje
e-mail: cronjehp@lantic.net
Postal Address: Doornkloof Nature Reserve, PO Box 94, Colesberg, 9795, South Africa

