


Services on Demand
Article
 English (pdf)
 Article in xml format
 Article references
Indicators

Related links
-
 Cited by Google
 -
 Similars in Google
Share

 Permalink
South African Journal of Surgery
On-line version ISSN 2078-5151
Print version ISSN 0038-2361
S. Afr. j. surg. vol.56 n.2 Cape Town Jun. 2018
http://dx.doi.org/10.17159/2078-5151/2018/v56n2a2397
GENERAL SURGERY
Surgical resources in South Africa: an analysis of the inequalities between the public and private sector
AJ Dell; D Kahn; J Klopper
Department of Surgery, University of Cape Town Health Sciences Faculty, Groote Schuur Hospital, Observatory, Cape Town, South Africa
ABSTRACT
BACKGROUND: The full extent of the global burden of surgical disease is largely unknown, however, the scope of the problem is thought to be large. Despite the substantial burden of surgical disease, surgical services are inaccessible to many of those who need them most. There are disparities between public and private sectors in South Africa, which compound inequitable access to surgical care. This study forms part of a series analysing surgical resources in South Africa.
METHODS: This study involved a descriptive analysis of surgical resources and included the total number of hospitals, of hospital beds, the number of surgical beds, the number of general surgeons (specialist and non-specialist), and the number of functional operating theatres in South Africa. A comparison was performed between the public and private sectors. Hospitals were contacted during the period from 1 October 2014 until 31 December 2014.
RESULTS: Surgical resources were concentrated in metropolitan areas of urban provinces. There were striking differences between the public and private sectors, where private resources were comparable to those available in high income countries (HICs).
CONCLUSION: Improving access to surgical services in lower middle income countries (LMICs) requires addressing gaps between the public and private sector regarding infrastructure, personnel, as well as equipment. These data identified disparities between geographic regions which may be contributing to ongoing inequity in South Africa, and by doing so allows for evidence-based planning towards improving surgical infrastructure and workforce.
Key words: Global surgery, Surgical Resources
Introduction
The full extent of the global burden of surgical disease, although largely unknown, is thought to be large. Furthermore, surgical services are inaccessible to many of those who need them most and an estimated 2 billion people lack access to the most basic surgical care.1,2 Compounding the problem in developing countries, is the lack of appropriate surgical workforce. Lower middle income countries (LMICs) are disproportionately affected by low surgical workforce density, and in particular, people living in rural areas, those with a low income, and those who are marginalised are the most affected by these shortages.2,3 Defining the need for surgical services in the developing world is the first step toward addressing the problem.
Private hospitals play a significant role in the South African Health system. However, private hospitals are available to only a limited few, with roughly 16% of South Africans having private health insurance.4 An assessment of surgical resources per population would therefore need to be adjusted for those who have access to private healthcare. Private hospitals are classified as for profit or not-for profit private hospitals, with the majority being managed as for profit hospitals and being accessible to those who are able to afford health insurance or make out-of-pocket payments. Public hospitals are classified as district, regional, provincial tertiary, national central and specialised according to the National Health Act of 2003.5 Establishing differences in surgical resources between the two sectors will provide insight into suspected disparities in access to surgical care. This will allow policymakers and those involved in healthcare structuring to rationalise resource allocation.
Materials and methods
Study design and data collection
This study involved a descriptive analysis of surgical resources and included the total number of hospitals, number of hospital beds, number of surgical beds, number of general surgeons (specialist and non-specialist), and the number of functional operating theatres in public and private hospitals in South Africa. The public hospitals included all district, regional and tertiary hospitals in all nine provinces.
A list of all hospitals in South Africa was obtained from the provincial health departments and cross-referenced with electronic databases of hospitals in South Africa (Medpages and hospital websites). These were cross-referenced with the National Health Department's hospital list from the Minister of Health. The Health System Trust (HST) provides estimates of total hospital number and hospital bed number for each province and was used as a comparative. The Chief Executive Officer (CEO), superintendent or matron (in the case of district level facility) in each hospital were emailed and/or contacted telephonically in order to obtain the relevant data. Hospitals were contacted during the period from 1 October 2014 until 31 December 2014. Private hospital data were readily available from the Hospital Association of South Africa (HASA) and included extensive data on the number of hospitals, total hospital bed number and the type of beds, as well as the number of operating theatres. The number of specialists working at the private facilities were not provided. Private hospitals were contacted telephonically in order to verify these data.
In order to determine the number of specialist surgeons, the Health Profession's Council of South Africa (HPCSA) was contacted and the national and provincial databases accessed. This was cross-referenced with the College of Medicine of South Africa (CMSA) database, as well as the National census data from the most recent National Population census in 2011. Professor Martin Veller provided unpublished data from a study which investigated the number of general surgeons. Private specialist (SP) surgeon number was not requested as surgeons often work at several private facilities in a region, which would have resulted in duplication of surgeon numbers. An estimate of the number of surgeons in the private sector was based on the difference between the total number of registered in each province and the number of surgeons working in the public hospitals. This would be an under-estimate as many of the latter undertake limited private practice. The private hospital data obtained from the databases was similar to the data provided by the hospitals, providing testament to the accurate manner in which private facilities manage their data. The non-specialist (NSP) general surgeon number was defined as any medical officer, registrar or postintern level doctor performing general surgical procedures (major or minor cases). These doctors were responsible for a significant portion of the surgical service which included performing common general surgical procedures such as laparotomy, amputations and hernia repair.
The number of functional operating theatres were also documented. Operating theatres which were not were excluded. These were reported to be non-functional for mostly equipment and staffing reasons. Few of the rural district level hospitals had operating theatres which were not being utilised due to the lack of surgeons and anaesthetists. None of the hospitals reported lack of use due to the lack of infrastructure such as water or oxygen.
Data Analysis
The captured variables were entered into a Microsoft Excel (2013) spreadsheet. Population data were obtained from the Statistics South Africa (Stats SA) website.6
Ethics
Permission to conduct research was obtained from the Department of Health in each province as well as from individual hospitals. This research was approved by the Human Research and Ethics Committee at the University of Cape Town, (HREC 515/2013, 515/2014, 515/2015) as well as the Departmental Research Council for the Department of Surgery.
Results
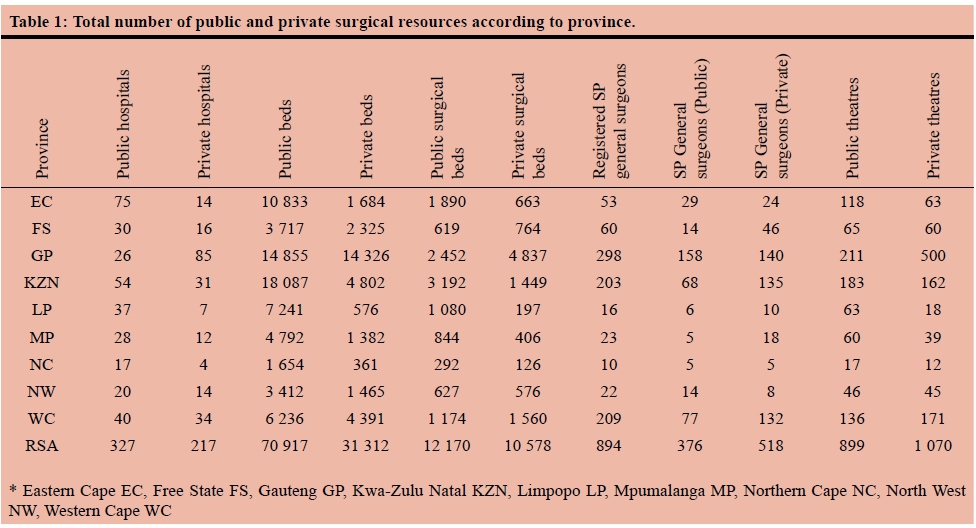
Absolute surgical resource numbers for each sector are shown in Table 1.
Public versus private hospital number
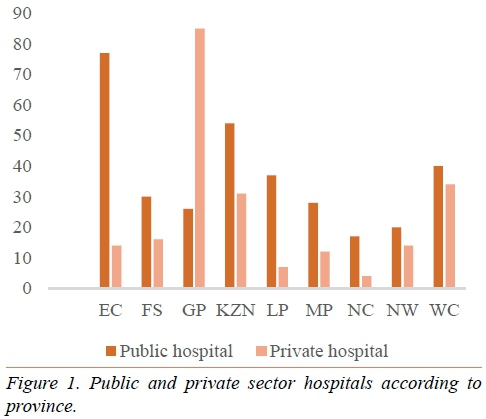
A total of 327 public hospitals and 217 private hospitals were included in the study. The rural provinces (Eastern Cape, Limpopo, Mpumalanga and Northern Cape) had far fewer private hospitals than public hospitals as shown in Figure 1. In contrast, Gauteng province had three times as many private as public ho spitals.
Public versus private hospital bed number
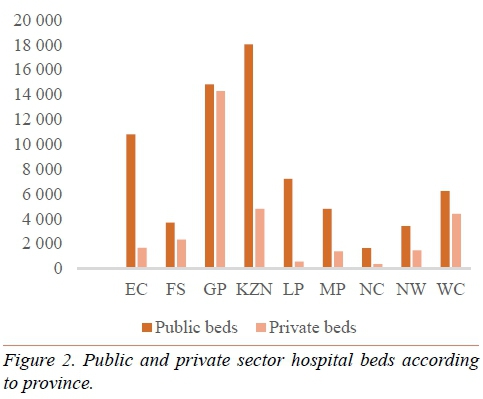
There were a total of 31 312 private hospital beds and more than twice as many (n = 70 917) public hospital beds. Most of the provinces (Eastern Cape, KwaZulu-Natal, Limpopo, Mpumalanga, North West and Northern Cape) had far more public sector beds. In contrast, Gauteng had almost an even number of public and private beds (Figure 2).
Public versus private surgical bed number
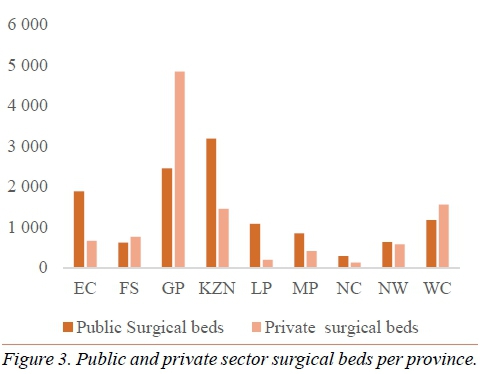
There were 12 170 public hospital surgical beds and 10 578 private hospital surgical beds. The surgical beds mirrored the total hospital bed distribution with the exception of Gauteng, where private surgical beds were almost twice the number of public surgical beds (Figure 3). The Western Cape and Free State also had more surgical beds in the private sector compared to public hospitals.
Public versus private operating theatre number
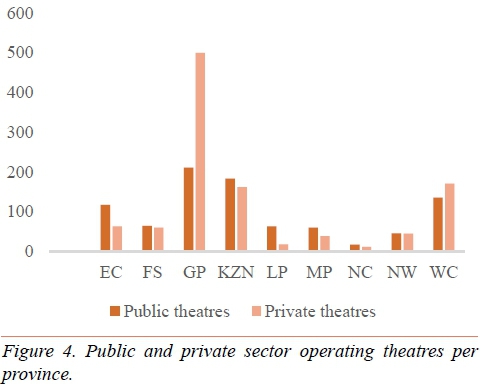
There were 899 functional operating theatres in the public sector compared to 1 070 theatres in the private sector. Gauteng had the largest overall number with 711 theatres, with the majority being in the private sector (n = 500). The Eastern Cape had approximately half the number of private theatres than public theatres, and Limpopo had less than a third of those found in The public sector. The remaining provinces had a reasonably even distribution of functions operating theatres between the public and private sectors (Figure 4).
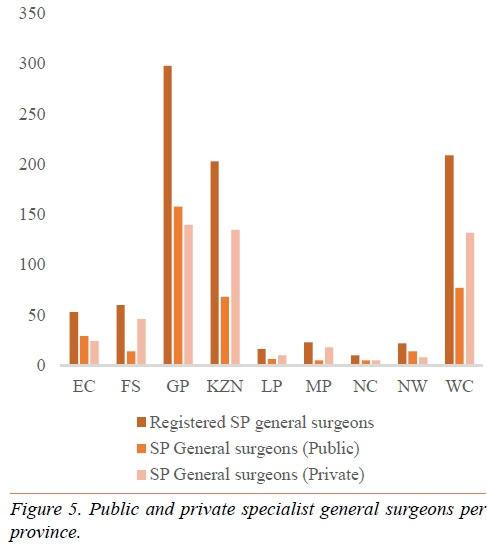
Specialist general surgeons in the public and private sectors
There were a total of 894 registered specialist general surgeons in South Africa in 2014. Of those, 376 (42%) were found to be working in public hospitals. This meant that an estimated 518 (58%) were thought to be working in the private sector. Provinces such as Gauteng, the Northern Cape, the Eastern Cape and the North West Province had more than 50% of registered specialist general surgeons working in public hospitals. Mpumalanga and the Free State had the lowest proportion of registered general surge ons working in public practice with 21.7% and 23% respectively (Figure 5).
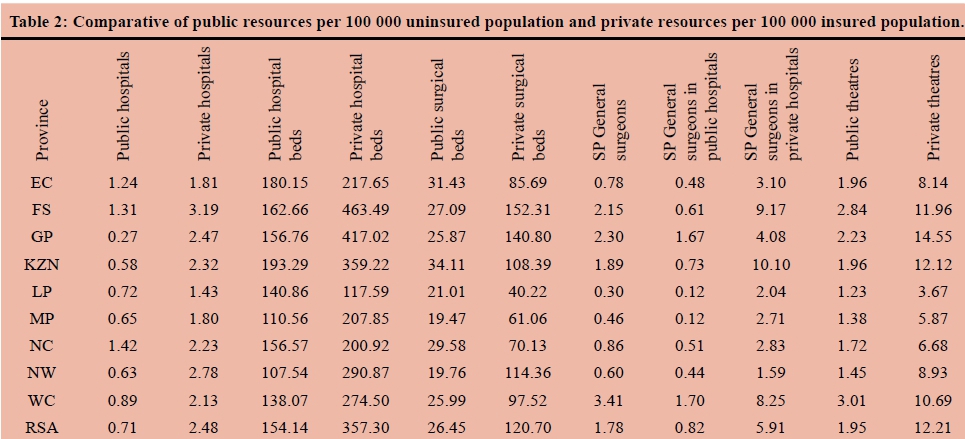
Public and private surgical resources per population
Table 2 demonstrates the differences between public and private sector resources per population. In order for an accurate comparison to be made, public sector resources were calculated per uninsured population and private sector resources were calculated per insured population. Although it is understood private access was not strictly confined to insured patients as out-of-pocket payments from uninsured patients were common.
There were fewer public hospitals (0.71 per 100 000) than private hospitals per population (2.48 per 100 000), a trend which was seen in all provinces. The difference was smallest in the Eastern Cape and greatest in the Free State. Nearly all provinces had more private hospital beds per population than public hospital beds, apart from Limpopo which had fewer private beds (117.59 private beds compared with 140.86 public beds). This province also had the lowest medical aid coverage of 8.7%.7 Private sector surgical beds per population were more numerous in all provinces. There were 1.78 registered specialist general surgeons per 100 000 population. Of these, 0.82 per 100 000 (uninsured) worked in the public sector and 5.91 per 100 000 (insured) worked in the private sector. Notable differences were seen in the Western Cape, Free State and Kwa-Zulu Natal, which had far more private sector surgeons. There were 1.95 operating theatres per 100 000 in the public sector compared with 12.21 operating theatres per 100 000 in the private sector. The Western Cape, Free State, Kwa-Zulu Natal and Gauteng had more than 10 private operating theatres per population.
Discussion
There were more public hospitals (n = 327) compared with private hospitals (n = 217), however a more accurate analysis demonstrated fewer public hospitals per uninsured population than private hospitals per insured population. Striking maldistribution of hospitals was seen in all provinces, but was more pronounced in the Free State.
There were a total of 31 312 private hospital beds and more than twice as many (n = 70 917) public hospital beds. Many provinces (Eastern Cape, KwaZulu-Natal, Limpopo, Mpumalanga, North West and Northern Cape) had far more public sector beds. Most of these provinces were largely rural, with fewer medical aid beneficiaries. In contrast, Gauteng had almost an even number of public and private beds. This, however, does not measure equitable access to surgical services and remains a limitation of using bed number as a health metric. Although public sector beds were more numerous, almost all provinces had more private hospital beds per population than public hospital beds, apart from Limpopo (117.59 private beds compared with 140.86 public beds). This province also had the lowest medical aid coverage.7 This could indicate that medical aid coverage intuitively predicts where private sector resources are located.
The surgical beds reflected the total hospital bed distribution with the exception of Gauteng where private surgical beds were almost twice as numerous as public surgical beds. The Western Cape and Free State also had more surgical beds in the private sector compared to public hospitals. Private sector surgical beds per insured population were far more numerous in all provinces. Surgical beds are known to generate greater revenue which could explain why the private sector had a greater proportion of hospital beds allocated to surgical patients. The inability to allocate district level beds to a medical or surgical discipline meant that these beds were not included in public sector surgical beds, which could have misrepresented the true surgical bed number. Therefore, using surgical bed numbers as a metric of surgical output is inaccurate as far more resources are required to provide surgical care. Preoperative and postoperative care encompass a broad range of diagnostic and therapeutic modalities which have been laid out in the Global Surgery National Surgical Plan.2 There were 899 functional operating theatres in the public sector (1.95 per 100 000) compared to 1 070 theatres in the private sector (12.21 per 100 000). Gauteng had the largest overall number with 711 theatres, with the majority being in the private sector (n = 500). The Eastern Cape had approximately half the number of private theatres than public theatres, and Limpopo had less than a third of those found in the private sector. The Western Cape, Free State, Kwa-Zulu Natal and Gauteng had more than 10 private operating theatres per population, which was comparable with high income countries (HICs) such as the United States (US) and United Kingdom (UK).8 Public sector theatre density fell short of the worldwide average of 6.2 theatres per 100 000 in all provinces.8 Interestingly, the private sector theatre density in Limpopo (a rural province), was similar to public sector theatre density in the Western Cape. These findings highlighted the inequitable access to surgical resources between the two sectors. Analysis of theatre infrastructure alone is not sufficient to make inferences about theatre functionality. Running water, the continuous supply of oxygen as well as pulse oximetry and theatre staff are all essential components which need to be assessed in order to determine theatre function.
There were a total of 894 registered specialist general surgeons in South Africa (1.78 per 100 000) in 2014. Of those, 376 (42%) were found to be working in public hospitals. This meant that an estimated 58% were thought to be working in the private sector. Provinces such as Gauteng, the Northern Cape, the Eastern Cape and the North West Province had more than 50% of registered specialist general surgeons working in public hospitals. Mpumalanga and the Free State had the lowest proportion of registered general surgeons working in public practice. An assessment of general surgeon density according to sector found that there were 0.82 per 100 000 (uninsured) in the public sector and 5.91 per 100 000 (insured) in the private sector. Notable differences were seen in the urban provinces of the Western Cape, Free State and Kwa-Zulu Natal, which had far more private sector surgeons and were comparable to those of HICs.
Conclusion
Although this analysis provided a limited examination of surgical resources, it highlighted differences and revealed interprovincial disparities. South Africa is unique in that although it is classified as an upper middle income country (UMIC), is comprises of two sectors; a public sector which has resources similar to other LMICs, and a private sector which has resources similar to HICs. Although not all of the recommended surgical indicators have been captured and assessed, the database is in place to allow future data collection efforts. Improving access to surgical services in LMICs requires addressing gaps between the public and private sector regarding infrastructure, personnel, as well as equipment. These data may be used to shape global health policies, aimed at providing safe and equitable surgery to those in need. It identifies disparities between geographic regions which may be contributing to ongoing inequity in South Africa, and by doing so allows for evidence-based planning towards improving surgical infrastructure and workforce.
REFERENCES
1. Weiser TG, Regenbogen S, Thompson K, Haynes AB, Lipsitz S, Berry W, Gawande A. An estimation of the global volume of surgery: A modelling strategy based on available data. Lancet. 12 July 2008;372(9633):139-144. Available from: doi: 10.1016/ S0140-6736(08)60878-8. Epub 2008. [ Links ]
2. Meara JG, Leather AJM, Hagander L, et al. Global surgery 2030: evidence and solutions for achieving health, welfare, and economic development. Lancet. 8 August 2015;386 (9993):569-624. Available from: doi: http://dx.doi.org/10.1016/S0140-6736(15)60160-X [ Links ]
3. Ozgediz D, Riviello R. The "other" neglected diseases in global public health: surgical conditions in sub-Saharan Africa. PLoS Med.;5(6):e121. Available from: http://dx.doi.org/10.1371/journal.pmed.0050121 [ Links ]
4. Matsebula T, Willie M. Private hospitals. In: Harrison S, Bhana R, Ntuli A, editors. South African Health Review 2007. Durban: Health Systems Trust; 2007. Chapter 11, pp. 159-64. [ Links ]
5. National Health Act, No 61 of 2003. Government Gazette. 655(34521). 12 August 2011. Government Notice no. 655. Cape Town. Government Printer. [ Links ]
6. Statistics SA Annual 2013/2014 report. Available from: www.statssa.gov.za [ Links ]
7. Massyn N, Day C, Peer N, Padarath A, Barron P, English R, editors. District Health Barometer. 2013/2014. Health Systems Trust. Available from: www.hst.org.za/publications/district-health-barometer-201314 [ Links ]
8. Funk L, Weiser T, Berry W, et al. Global operating theatre distribution and pulse oximetry supply: an estimation from reported data. Lancet. 2010;376:1055-61. Available from: doi: 10.1016/S0140-6736(10)60392-3 [ Links ]
 Correspondence:
Dr A J Dell
angelajdell@gmail.com

