


Serviços Personalizados
Artigo
 Inglês (pdf)
 Artigo em XML
 Referências do artigo
Indicadores

Links relacionados
-
 Citado por Google
 -
 Similares em Google
Compartilhar

 Permalink
South African Journal of Science
versão On-line ISSN 1996-7489
versão impressa ISSN 0038-2353
S. Afr. j. sci. vol.119 no.9-10 Pretoria Set./Out. 2023
http://dx.doi.org/10.17159/sajs.2023/15008
RESEARCH ARTICLE
Quantification of toxic metals in cropland soil using X-ray fluorescence
Mashinga J. Mvelase; Paulus L. Masiteng
Department of Physics, University of Johannesburg, Johannesburg, South Africa
ABSTRACT
We aimed to assess toxic heavy metals in soil samples from cropland in Weenen (KwaZulu-Natal, South Africa) using X-ray fluorescence (XRF) spectroscopy. The metal contents in the soil samples were detected and quantified by wavelength dispersive XRF (WD-XRF) spectroscopy. On average, the values of all elements (mg/kg) were: Al (91.4 ± 6.9), Ba (0.488), Ca (16.8 ± 5), Fe (39.3 ± 0.8), K (15.7 ± 0.04), Mg (10.1 ± 0.3), Mn (0.6), Na (8.0 ± 1), P (1.3 ± 0.4), Si (458 ± 8) and Ti (5.6 ± 0.3). Toxic metals such as Hg, Cd, As, Pb, and Cr were not detected in the soil samples. The macronutrient P which is capable of causing eutrophication in water bodies, was present at a low level in soil samples. The metal contents in both control and field samples were comparable, suggesting that the metals were mostly of lithogenic origin and not entirely influenced by anthropogenic activities. The metal levels we detected were within the limits reported to be safe by other studies.
SIGNIFICANCE:
Although they are within the detection range, the toxic heavy metals mercury, cadmium, arsenic, lead and chromium, which enter the environment through the use of fertilisers on agricultural land, were not detected in this WDXRF spectrometry analysis. The remaining elements detected are lithogenic and non-anthropogenic, as the field and control samples had comparable concentrations. Nitrogen was not quantified, but phosphorus was present in a low concentration, so the field water run-off into the water bodies need not directly lead to water pollution in the area studied.
Keywords: XRF spectroscopy, heavy metal toxicity, eutrophication, soil pollution
Introduction
Soil is a product of weathering and decomposition of organic matter. The weathering process involves the interaction of the lithosphere, atmosphere, and hydrosphere, and is driven by solar energy.1 Weathering and volcanic eruptions contribute to heavy metals in the environment.2-5 Pollution contributes to health risks, as many diseases are airborne or waterborne, and spread from soil to humans through food.6 Worldwide, air pollution causes about 3.1 million premature deaths.7-9 These pollutants enter the soil through atmospheric deposition10 and are subsequently absorbed by plants that are consumed by humans and other animals. Environmental impact assessments and pollution controls should be routinely carried out to protect new developments from pollution. The soil ecosystem can be damaged by high concentrations of toxic metals, so it is important to assess the ecological and environmental risks from heavy metals.11
Extensive use of fertilisers spreads heavy metals in the environment, as phosphate rock is heavily contaminated with heavy metals10,12-14, especially with the radioactive decay series 238U, 232Th and 40K. 238U, 232Th and 40K are ubiquitous in the earth's crust10,15 and are used by organisms in small amounts; they are considered essential metals that can be naturally present in plants or can enter the soil through high concentrations. The distribution of these metals in the soil depends on the region and the type of parent rock from which the soil originates.16 An assessment of heavy metal contamination of soil is very important, as this contamination can enter the food chain, causing toxicity in plants and animals. Soil contamination can spoil land for agricultural use17,18, exacerbating poverty worldwide. Food grown on contaminated soil can be toxic for human and animal consumption.
Micronutrients such as iron (Fe), manganese (Mn), zinc (Zn) and copper (Cu)19 are essential for plant growth, but their high content in plant tissues20, coupled with the presence of mercury (Hg), cadmium (Cd), arsenic (As), lead (Pb) and chromium (Cr), have a toxic effect.21-25 The heavy metals Cu, Zn, Pb, As and Cd6,10,18-20,24 are termed toxic metals because gastrointestinal cancer and diseases of the skeletal, cardiovascular and nervous systems have been linked with their excessive intake6,25. Exposure to excessive Cu is linked with cell damage in humans.26,27 Pb is not only toxic to the health of the soil ecosystem11 but also poses a health risk to humans, causing brain damage and mental illness as well as kidney damage in children.18,23,24 Cd and As enter agricultural soils through the main pathways, i.e. volcanic eruptions, soil erosion10 and fertiliser application. Plants take up Cd through their roots, and this is a pathway through which non-smokers are exposed to this metal.28 Phosphate deposits are divided into sedimentary and magmatic deposits. A total of 80% of phosphate rock comes from sedimentary deposits29, from which phosphate fertilisers are produced. They contribute the most Cd30 to the environment, and waste disposal also contributes significantly.
The anthropogenic increase of nitrogen in water bodies directly threatens human and aquatic ecosystems. Water bodies include streams, rivers, lakes, aquifers, and coastal waters, as well as groundwater. The accumulation of some nitrates from the soil in water bodies can lead to water pollution known as eutrophication.22,31 Eutrophication is a global problem32 in which water bodies receive excess nutrients from wastewater and agricultural sources based on, for example, nitrogen and phosphorus.33 Eutrophication can have economic consequences as well as effects on tourism, human health, and water quality.34 Eutrophication leads to hypoxia in water bodies, resulting in the death of plants and fish in the water and toxic algal blooms.22,31 Eutrophication can occur in oligotrophic (low nutrient levels), mesotrophic (moderate nutrient levels), eutrophic (good nutrient levels), and hypertrophic (very good nutrient levels) water bodies. The South African Department of Water and Sanitation's Eutrophication National
Monitoring Programme (NEMP) has published data showing that about 28% of surface water samples are hypertrophic, 33% eutrophic, 37% mesotrophic and only 3% oligotrophia33
Cyanobacteria (blue-green algae) thrive in eutrophic water33, which can pose a health risk in underdeveloped areas because people still use water directly from the source for activities such as washing, drinking and food preparation33,35 and cyanobacteria produce cyanotoxins36. Aquatic ecosystems can remove a significant amount of nitrogen enrichment, but this capacity has limits and depends on the characteristics of the ecosystem.37 Fresh water is a limited resource that needs to be protected everywhere33,38 and South Africa is no exception. In southern African regions, water is collected from springs in 20- to 25-litre plastic containers, which can lead to disease-causing bacteria being transported with the water or developing in the containers.35
Soil samples are analysed for the presence of toxic metals using X-ray fluorescence (XRF) spectroscopy. This technique has the advantage of being multi-elemental, non-destructive, fast, accurate and precise.39,40 XRF can determine the chemical composition of all types of materials and determine the thickness and composition of layers and coatings.41 These X-rays have characteristic energies related to the atomic number of an element, and each element, therefore, has a characteristic X-ray spectrum. Similar methods include atomic absorption spectroscopy (AAS), inductively coupled plasma atomic emission spectroscopy (ICP-AES), particle-induced X-ray emission (PIXE), inductively coupled plasma mass spectroscopy (ICP-MS) and inductively coupled plasma optical emission spectroscopy (ICP-OES).1,42 XRF is capable of determining the broad content of elements in soil samples. The limitations are that XRF is not able to quantify light elements smaller than sodium but it is indeed fast and can process 1 million counts per second. Wavelength dispersive X-ray fluorescence (WD-XRF) spectrometry is preferred for its high-resolution applications (15-150eV)
ICP-MS is a highly sensitive method that gives quantitative results of elements and various isotopes in samples at milligram to nanogram levels per litreat a small per litre, but it is so expensive that many environmental laboratories cannot afford it, and daily operation is also costly.40 ICP-OES quantification is based on the measurement of excited atoms and ions at the wavelength characteristics of the specific elements being measured, whereas ICP-MS measures the mass of an atom by mass spectrometry (MS). Both ICP-MS and ICP-OES are suitable for determining element concentrations in water, for testing water purity, and for use in materials science.43 The problem again is affordability. The applications of all the techniques mentioned above overlap, therefore, any technique that is accessible to the researcher can be used for analysis.
PIXE, on the other hand, which measures elements from magnesium onwards, is generally better suited for determining the content of toxic metals and the portable unit costs about USD200. The cost of WD-XRF instruments is high, depending on which instrument you prefer. ICP-MS is a highly sensitive technique that provides quantitative results for various elements and isotopes in samples ranging from milligrams to nanograms per litre. On average, the initial cost of ICP-MS makes it the most expensive system to purchase. SPECTRAU is Spectrum's (The Central Analytical Facility of the Faculty of Science, University of Johannesburg) mission to provide state-of-the-art equipment and expertise to solve analytical challenges in academic research. As these methods work on the same bases, the availability and easy accessibility of WD-XRF at SPECTRAU made it the choice for this study.
In this study, we aimed to assess toxic heavy metals in soil samples from cropland using XRF spectroscopy. The lack of a similar study in this area was the reason for this work. Our results can serve as a basis for future anthropogenic environmental impact assessments on agricultural fields in Weenen and elsewhere in KwaZulu-Natal, South Africa.
Materials and methods
Study area and soil sampling
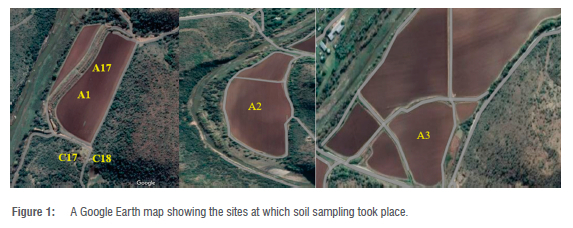
Batches of representative soil samples were collected randomly in Weenen, KwaZulu-Natal, South Africa, in January 2017. These batches consisted of a control sample spot (C17) and a field sample spot (A17). Figure 1 below shows a Google Earth view of the site at which samples were collected. Sample codes A1, A2, A3 and C18 (Control) represent spots or crop fields where additional sampling took place in August 2018. It is important to note that sample codes A17 and A1 represent the same sampling site, but the sampling took place in different years and seasons. Control samples were collected about 200-250 m from the crop field. Samples were collected at a depth of 15-20 cm and placed in 2-litre plastic containers. The study area was located on a farm about 17 km northeast of Weenen. The small town of Estcourt, with factories, a mine and businesses, is 57 km upstream.
Climate
The climate in the study area is semi-arid with an average maximum temperature of about 27 °C and a wind direction from west to east. January, like December, is a moderately hot summer month in Weenen, with average temperatures ranging from a maximum of 27 °C to a minimum of 14.7 °C. The last month of winter, August, is pleasant in Weenen with an average temperature of 20.9 °C. There are about 128 days of rainfall and 409 mm of rainfall during the year.
Potatoes (Solanum tuberosum), harvested in November and December, and butternuts (Cucurbita moschata), harvested in April, are grown on the farm. Sometimes maize is also grown on the farm as part of crop rotation. The farm is not dependent on rain but it relies on an irrigation system that diverts water from the nearby river to the cultivated areas. Upstream, the river flows through the small town of Estcourt, which has some factories, a quarry mine and businesses. The farm is far from the mining and industrial areas. Most of the land is used for growing agricultural produce.
Sample preparation
After collection, soil samples were oven dried at 105 °C at the SPECTRAU facility at the main campus of the University of Johannesburg, where the analysis of the samples took place. The dried samples were then crushed and pulverised at the University of Johannesburg's Mill Laboratory at the Doornfontein Campus to obtain a uniform powder. XRF was used to measure several elements that have a detection limit of about 0.05 mass per cent. The XRF technique scans for most elements from sodium (Na) tothose with higher atomic numbers. The scans are semi-quantitative. An amount of 1 g of the dried sample was then burnt or ignited in the air at 930 °C for 30 min and then the loss on ignition (LOI) was measured. LOI refers to the volatile content of the sample, such as organic compounds, H2O from hydrated phases and CO2 from carbonates. The analysis was performed on the remaining 0.700 g after ignition removed 0.300 g of the 1.00 g soil sample.
Measurement technique and equations
When an atom is irradiated with the appropriate amount of energy, an electron is ejected from the K shell. To fill the space, an electron falls out of the outermost shell into a quantum empty state. This descent is accompanied by the emission of an X-ray photon, which is determined by its destination and origin. That is, the K and L lines are formed when a hole is formed in the K and L layers. The electron jump leads to an X-ray absorption jump. The wavelength corresponding to this transition is called the absorption edge (band) of the respective element. An absorption edge is a feature of each chemical element that is used to uniquely identify the element based on its edge position.43 When a vacancy in the K shell is filled with an electron in the L or M shell, Ka or Kp rays are emitted.
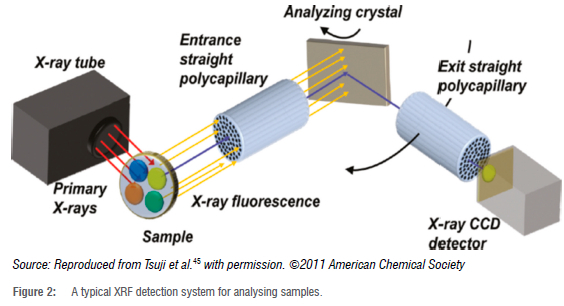
In this study, the wavelength dispersive XRF technique is used to determine the elements in soil samples. X-rays are diffracted through single crystal or multilayer optics to select specific narrow wavelengths or energy ranges that often correspond to the characteristic X-rays of the element of interest. This allows for high specificity and sensitivity of the elements due to a high signal-to-background ratio.41,44 The WD-XRF system physically separates the rays according to their wavelengths. The WD-XRF system is suitable for both major and trace elements.44 Figure 2 shows the XRF system used for analysing samples.45
WD-XRF spectroscopy measures X-ray intensity as a function of wavelength. This is done by passing the radiation emitted by the sample through an analysing diffraction crystal mounted on a 2e-goniometer. According to Bragg's law, the angle between the sample and the detector gives the wavelength of the radiation46:

where d is the d-spacing of the analysis crystal, e is the half-angle between the detector and the sample, and n is the diffraction order. The elements in an unknown sample are identified by the energy they release when their atoms make a transition from a high-energy to a low-energy state. According to Bohr, the emission of radiation from the atom is due to the transition of the atom from a higher energy state to a lower energy state. In the simplest model of electronic transitions in hydrogenlike atoms, an electron gives off energy in moving between states with principal quantum numbers ni and nf, and a photon with energy is emitted. The energy of the emitted photon is given by Equation 2:
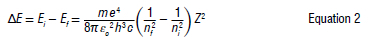
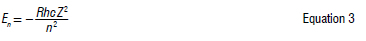
The integers ni and nf represent the angular momentum (units of h) of the initial and final states of the electron, and Z is an integer, called the atomic number, which represents the charge units of the nucleus. The coefficient of Z2 is simplified to Roo, the Rydberg constant, and Roo has the value 1.097 x 10⁷ m-1. According to Moseley, the electrons in the inner shells47 repel those in the outer orbits. He showed that the frequencies of the characteristic X-rays emitted by chemical elements are proportional to the square of the atomic number of the element. According to Bohr's theory of atomic structure48, the energy of an electron in its orbit n is given by:
The Ka X-ray emission is due to the transfer of an electron from the L-shell (n = 2) to the K-shell (n = 1), in which a vacancy has been created by the irradiation of the atom with X-rays before the transition. The energy of the K photon is therefore47-50:
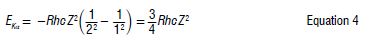
Moseley studied X-ray spectra at the same time as Bohr. He noticed that not all lines pass through the origin when the square root of the energy is plotted against Z, and to account for this fact he made E depend on (Z-σ)2 instead of Z alone.47,49 This leads Equation 4 to become Equation 5:
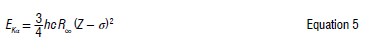
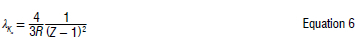
When E is small and Z is greater than 10, the typical photon energy is of the order of 1 keV, and this photon represents an X-ray. In Equation 5, hcRoo amounts to 13.605 eV.50 Dividing Equation 5 by h on both sides, we obtain an equation that establishes the relationship between the frequency v and the atomic number Z. The wavelength of the Ka X-rays can be derived from Equation 5 and the result is given in Equation 6:
The following equation shows the relationship between energy, E and proton number, Z. Equation 7 represents the relationship between the square energy of a photon and the atomic number. Moseley's law says49,50:
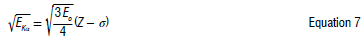
where Eo = hcRoo = 13.6 eV. In measurements of Ka-X-rays for a range of elements, a curve of the square root of energy versus Z should be a straight line, where a slope gives the ionisation energy of hydrogen and an intercept gives the screening factor σ for 2->1 transition. With a screening factor known, the Ka X-ray can be used to calculate the Z of an unknown sample. This is the principle that the XRF technique uses to distinguish different elements in the unknown sample.
The essential nutrients in columns 2 and 3 of Table 1 are required for various biochemical and physiological processes51 in plants. The roots of plants often take up the macronutrients nitrogen (N), phosphorus (P), and potassium (K) in large quantities, so applying NPK fertilisers improves nutrient-poor soils and crop yields.16 N is essential for stem growth and provides the rich green colour of plants. P is essential for root and flower growth, and the natural P derives from organic phosphates released when organic material in the soil decomposes. K derives from potash and contributes to the building of plant tissues, supports the production of chlorophyll and controls the opening and closing of stomata. After N, K is the element that plants take up in higher quantities.52 Plants remove N from the soil in the form of nitrates. Some N degrades microbially through the denitrification process, in which N reduces to a gaseous form that diffuses out of the soil into the atmosphere.22 K, P, calcium (Ca), magnesium (Mg), sulfur (S), Na and chlorine (Cl) occur in living organisms in trace and varying amounts53 and are listed in Table 1 in their categories.19,52
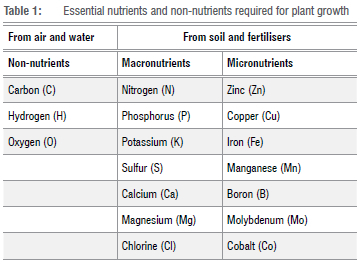
Mineral plant nutrients are divided into two broad groups. Macronutrients are the ones needed in relatively large quantities by plants, while micronutrients are the nutrients needed in relatively small quantities by plants.
Results and discussion
The results of the 11 elements quantified in all soil samples are shown in Table 2. The system could not measure the elements below neon (Ne) as it measures from Na upwards. On average, the concentrations (mg/kg) of the elements found in the field samples are: Al (91.4 ± 7), barium (Ba; 0.488 ± 0.03), Ca (16.8 ± 5), Fe (39.3 ± 0.8), K (15.7 ± 0.04), Mg (10.1 ± 0.3), Mn (0.64 ± 0.04), Na (8.0 ± 1), P (1.3 ± 0.4), silicon (Si; 458 ± 8), and titanium (Ti; 5.6 ± 0.3).
In all soils, the elements are usually present in the form of compounds or other complex forms formed by previous oxidation or chemical reactions or formations.16 Felsic rocks are usually supersaturated and contain free quartz (SiO2). On average, felsic rocks contain high concentrations of Si, K, Ba, Pb and U.54 These rocks contain minerals such as K-feldspar (KAlSi3O8) and mica (KAl2Si3AlO11 (OH)2) which contain more than one element in a complex compound.55
When these compounds decompose, their elements become available in the soil and they are then detected in large quantities because of their availability in the soil. It is important to note that the availability of a mineral in large quantities in the soil does not mean that it is readily available for plant uptake. A good example of this is iron oxides, which are present in the soil as Fe3+, which is not readily available for plant uptake like Fe2+; the solubility of Fe3+ in soil depends on pH. A high pH impedes the availability of Fe to plants.
Comparability of potash (K2O) in control and field samples shows that most of the K2O is predominantly lithogenic. The small difference, especially in field samples, could be because the roots of the crops absorbed K2O in soil water. On the other hand, rutile (TiO2), which is very common in soil in KwaZulu-Natal, is harmful to the environment only at a very high content in the soil. There is a similarity between Ti control and field sample values. Based on this similarity of values, Ti is of natural origin. South Africa and Australia produced about 50% of the world's production in 2007.56 Figure 3 shows the comparison of elements per sample in mg/kg.
In Figure 3, the samples include a high concentration of SiO2, which is found in enormous quantities in the earth's crust but is not readily available for plant absorption. Figure 3 shows the elemental composition of the subsurface and nearby rocks from which the soils derive, i.e. Al, Fe and Si oxides, and their complex compounds. Studies have shown that the presence of Si in the soil increases the availability of nutrients (N, P and K), but the extent of this increase is not precisely known.53 Therefore, it is not surprising that the P content in the samples is low and the N content is not present at all. In the geological sense, Si, Mn, and K are not trace elements, but major elements.
The oxides Al2O3, Na2O, K2O, P2O5 and SiO2 are associated with feldspathic clays and mafic volcanic rocks55, revealing the underlying rocks' mineral composition. Other metals present in large quantities are Ca, K, and Mg. For the significant concentrations, the concentrations of the metals in the soils ranged from low to high in the order Mg > K > Ca > Fe > Al >Si. The metal concentrations, in this study, compared with those reported in the literature are shown in Table 3.
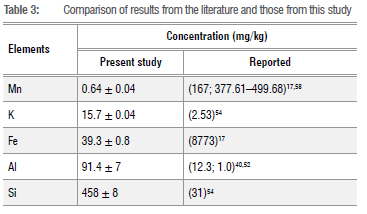
As shown in Table 3, the Fe content found in this study is lower than that in a previous study,17 which is not a negative finding as Fe2O3 cannot have toxic levels in soil17 as it is not readily available for plant uptake in this insoluble form. The content of SiO2, which is essential for certain plants, was higher than that reported previously.54 The high content of Si also helps with the uptake of minerals like CaO and MnO in soil. The interaction of Si and essential nutrients is plant-specific. The application of Si releases the following elements for plant uptake: N, P, K, Ca, Mg, S, Zn, and Mn. Plants take up these nutrients well due to their availability resulting from the presence of Si in the soil.53 Soils with neutral pH typically have a high K content. The K content is greater than that reported previously.54
Although the Al2O3 content in the samples is high, it is below the certified value of 116 mg/kg (16.62 wt.%). To counteract this, the availability of Al2O3 is reduced to a tolerable level by increasing the pH of the soil. K2O is higher than the certified value of 4.90 mg/kg (0.70 wt.%). SiO2 is higher than the certified value of 318 mg/kg (45.42 wt.%). Na2O is lower than the certified value of 25.55 mg/kg (3.65 wt.%). P2O5 is very low compared to the certified value of 18.2 mg/kg (0.26 wt.%). The CaO content is also lower than the certified value of 76.51 mg/kg (10.93 wt.%). CaO is a macronutrient and is taken up by crops in large quantities; the field samples have a lower CaO content compared to the control samples, which could also indicate a low pH in the field samples. On the other hand, a high CaO content in the soil is often associated with a high pH value. The certified values, used for comparisons, were found in a study conducted at the University of Limpopo Experimental Farm.55
Both Mn and Fe contents were low compared to values reported in other studies.17,54 The Mn content was similar in the field and control samples, but lower than the FAO/WHO recommended value of 437 mg/kg57 and lower than the range of 377.61-499.68 mg/kg reported in a study conducted in Alice, in the Eastern Cape, South Africa58. The Al content is higher than that reported previously40,52, but lower than the certified value of 116 mg/kg.55 At a lower pH in the soil, Al becomes soluble and the amount of Al in the soil solution increases. Al is abundant in the earth's crust and tends to be toxic to some plants at concentrations of 2-3 mg/kg, especially when the soil pH is lower than 5.5.59 The BaO content is similar in all samples but may be higher in the field samples than in the control samples due to the moderate pH and the application of fertilisers in the field soil samples. However, the BaO content is lower than the FAO/ WHO recommended value of 100 mg/kg.
With the present technique, the toxic substances Hg, Cd, Pb, Cr, Sn and As were not detected in the samples. It is possible that their concentrations were below the limit of detection (LOD) and the limit of quantitation (LOQ). Of the toxic metals, the system only detected and quantified Fe and Mn.
Future prospects and conclusion
The results of this study indicate that toxic metal contamination of the soils in the croplands investigated may not pose a significant risk. Al, Ba, Ca, Fe, K, Mn, Mg, Na, P, Si, and Ti were detected and quantified in the soil samples and they are largely related to the parent material of the soils in the area, so their uptake by plants is unavoidable as they are essential micronutrients for plants. However, some elements are not readily available for plants' uptake, regardless of how abundant they are in the soil, while some may also inhibit other elements' uptake.
Of the toxic elements Cd, Cu, Fe, Mn, Ni, Pb and Zn, only Fe and Mn were detected. The other elements were not detected, although they were within the detection range of the measuring system used. This study provides geological information on the origin of the soil on the croplands. The predominant elements such as Al2O3, Fe2O3, and SiO2 are of lithogenic and non-anthropogenic origin, as the field and control samples have comparable contents for these elements. The advantage is that their availability to plants is pH-dependent. The high Si content usually favours the availability of other nutrients such as N, P, and K to plants, which can lead to lower levels of these macronutrients in the soil. The low P2O5 content in the soil in all samples could mean that the element was taken up by plants, run-off and erosion and leached into the subsoil. At this low concentration of P2O5, eutrophication is unlikely, especially in moving water streams. The study shows that neither the small towns upstream through industrial waste nor the fertilisers contribute to metal pollution in the soil and water.
The WD-XRF measurement technique could not detect most of the toxic metals. This work should serve as a baseline for future studies on toxic metals in this region. For future studies, using a different technique to compare and confirm the results might be useful. The use of a different technique could also help to verify whether the measurement system failed to detect and quantify toxic metals because they are not present in the soil or because their content is below the LOD or LOQ.
Acknowledgements
We thank the SPECTRAU Lab, University of Johannesburg, for undertaking the analyses and Dr Christian Reinke for assistance with the analysis.
Competing interests
We have no competing interests to declare.
Authors' contributions
M.J.M: Conceptualisation, methodology, data collection, sample analysis, data analysis, validation, data curation, writing - the initial draft, writing - revisions. PL.M.: Validation, data curation, student supervision, project leadership, funding acquisition.
References
1. Kabata-Pendias A. Trace elements in soils and plants. 4th ed. Boca Raton, FL: CRC Taylor and Francis Group; 2011. p. 505. https://doi.org/10.1201/b10158 [ Links ]
2. Bradl H, editor. Heavy metals in the environment: Origin, interaction and remediation. Amsterdam: Elsevier; 2005. [ Links ]
3. He ZL, Yang XE, Stoffella PJ. Trace elements in agroecosystems and impacts on the environment. J Trace Elem Med Biol. 2005;19(2-3):125-140. https://doi.org/10.1016/j.jtemb.2005.02.010 [ Links ]
4. Nriagu JO. A global assessment of natural sources of atmospheric trace metals. Nature. 1989;338(6210):47-49. https://doi.org/10.1038/338047a0 [ Links ]
5. Arruti A, Fernández-Olmo I, Irabien Á. Evaluation of the contribution of local sources to trace metals levels in urban PM25 and PM10 in the Cantabria region (Northern Spain). J Environ Monit. 2010;12(7):1451-1458. https://doi.org/10.1039/b926740a [ Links ]
6. Ding Z, Li Y Sun Q, Zhang H. Trace elements in soils and selected agricultural plants in the Tongling mining area of China. Int J Environ Res Public Health. 2018;15(2):202. https://doi.org/10.3390/ijerph15020202 [ Links ]
7. Cohen AJ, Brauer M, Burnett R, Anderson HR, Frostad J, Estep K, et al. Estimates and 25-year trends of the global burden of disease attributable to ambient air pollution: An analysis of data from the Global Burden of Diseases Study 2015. Lancet. 2017;389(10082):1907-1918. https://doi.org/10.1016/S0140-6736(17)30505-6 [ Links ]
8. Franchini M, Mannucci PM. Air pollution and cardiovascular disease. Thromb Res. 2012;129(3):230-234. https://doi.org/10.1016/j.thromres.2011.10.030 [ Links ]
9. World Health Organization. Ambient air pollution: A global assessment of exposure and burden of disease. Geneva: World Health Organization; 2016. https://apps.who.int/iris/handle/10665/250141 [ Links ]
10. Tchounwou PB, Yedjou CG, Patlolla AK, Sutton DJ. Heavy metal toxicity and the environment. In: Luch A, editor. Molecular, clinical and environmental toxicology. Basel: Springer; 2012. p.133-164. https://doi.org/10.1007/978-3-7643-8340-4_6 [ Links ]
11. Xian Y, Wang M, Chen W. Quantitative assessment on soil enzyme activities of heavy metal contaminated soils with various soil properties. Chemosphere. 2015;139:604-608. https://doi.org/10.1016/j.chemosphere.2014.12.060 [ Links ]
12. Fávaro DI. Natural radioactivity in phosphate rock, phosphogypsum and phosphate fertilizers in Brazil. J Radioanal Nucl Chem. 2005;264(2):445-458. https://doi.org/10.1007/s10967-005-0735-4 [ Links ]
13. Hamamo H, Landsberger S, Harbottle G, Panno S. Studies of radioactivity and heavy metals in phosphate fertilizer. J Radioanal Nucl Chem. 1995;194(2):331-336. https://doi.org/10.1007/BF02038431 [ Links ]
14. Hameed PS, Pillai GS, Mathiyarasu R. A study on the impact of phosphate fertilizers on the radioactivity profile of cultivated soils in Srirangam (Tamil Nadu, India). J Radiat Res Appl Sci. 2014;7(4):463-471. https://doi.org/10.1016/j.jrras.2014.08.011 [ Links ]
15. Rout G, Samantaray S, Das P. Aluminium toxicity in plants: A review. Agronomie. 2001;21(1):3-21. https://doi.org/10.1051/agro:2001105 [ Links ]
16. Hamidalddin SH. Determination of agriculture soil primordial radionuclide concentrations in Um Hablayn, north Jeddah west of Saudi Arabia. Int J Curr Microbiol Appl Sci. 2014;3(6):623-633. [ Links ]
17. Liphadzi MS, Kirkham MB. Partitioning and accumulation of heavy metals in sunflower grown at biosolids farm in EDTA-facilitated phytoremediation. Biorem Biodiv Bioavail. 2009;3:36-42. [ Links ]
18. Sabudak T, Seren G, Kaykioglu G, Dincer AR. Determination of trace elements in soil and sunflower (Helianthus annuus L.) plant parts. Fresenius Environ Bull. 2007;16(10):1274. [ Links ]
19. Hooda PS, editor. Trace elements in soils. Chichester: Wiley; 2010. https://doi.org/10.1002/9781444319477 [ Links ]
20. Madejón P Murillo JM, Maranón T, Cabrera F, Soriano MA. Trace element and nutrient accumulation in sunflower plants two years after the Aznalcóllar mine spill. Sci Total Environ. 2003;307(1-3):239-257. https://doi.org/10.1016/S0048-9697(02)00609-5 [ Links ]
21. Alzahrani HR, Kumakli H, Ampiah E, Mehari T, Thornton AJ, Babyak CM, et al. Determination of macro, essential trace elements, toxic heavy metal concentrations, crude oil extracts and ash composition from Saudi Arabian fruits and vegetables having medicinal values. Arab J Chem. 2017;10(7):906-913. https://doi.org/10.1016/j.arabjc.2016.09.012 [ Links ]
22. Hillel D. Introduction to environmental soil physics. London: Elsevier Academic Press; 2003. [ Links ]
23. Oluwole SO, Olubunmi MS, Kafeelah AY, Olusegun OF, Ayobami OO. Determination of heavy metal contaminants in leafy vegetables cultivated by the roadside. Int J Eng Res Dev. 2013;7(3):1-5. [ Links ]
24. Okeyode IC, Rufai AA. Determination of elemental composition of soil samples from some selected dumpsites in Abeokuta, Ogun State, Nigeria, using Atomic Absorption Spectrophotometer. Int J Basic Appl Sci. 2011;11:55-70. [ Links ]
25. Khan K, Lu Y, Khan H, Ishtiaq M, Khan S, Waqas M, et al. Heavy metals in agricultural soils and crops and their health risks in Swat District, northern Pakistan. Food Chem Toxicol. 2013;58:449-158. https://doi.org/10.1016/j.fct.2013.05.014 [ Links ]
26. Faroon O, Ashizawa A, Wright S, Tucker P, Jenkins K, Ingerman L, et al. Toxicological profile for cadmium. Atlanta, GA: US Agency for Toxic Substances and Disease Registry; 2012. Available from: https://www.ncbi.nlm.nih.gov/books/NBK158838/ [ Links ]
27. Tchounwou PB, Newsome C, Williams J, Glass K. Copper-induced cytotoxicity and transcriptional activation of stress genes in human liver carcinoma (HepG(2)) cells. Met Ions Biol Med. 2008;10:285-290. [ Links ]
28. Sharma H, Rawal N, Mathew BB. The characteristics, toxicity and effects of cadmium. Int J Nanotechnol Nanosci. 2015;3(10):1-9. [ Links ]
29. Stewart WM, Hammond LL, Van Kauwenbergh SJ. Phosphorus as a natural resource. In: Sims JT, Sharpley AN, Pierzynski GM, editors. Phosphorus: Agriculture and the environment. American Society of Agronomy, Crop Science Society of America, and Soil Science Society of America; 2005. p. 1-22. https://doi.org/10.2134/agronmonogr46.c1 [ Links ]
30. Louekari K, Mãkela-Kurtto R, Pasanen J, Virtanen V Sippola J, Malm J. Cadmium in fertilizers: Risk to human health and the environment webpage on the Internet]. c2000 [cited 2023 Aug]. Available from: https://julkaisut.valtioneuvosto.fi/bitstream/handle/10024/160651/2000_4_Cadmium%20in%20fertilizers%20-%20Risks%20to%20human%20health%20and%20the%20environment.pdf [ Links ]
31. Oertli B, Auderset Joye D, Castella E, Juge R, Lehmann A, Lachavanne JB. PLOCH: A standardized method for sampling and assessing the biodiversity in ponds. Aquat Conserv Mar Freshw Ecosyst. 2005;15(6):665-679. https://doi.org/10.1002/aqc.744 [ Links ]
32. Michalak AM, Anderson EJ, Beletsky D, Boland S, Bosch NS, Bridgeman TB, et al. Record-setting algal bloom in Lake Erie caused by agricultural and meteorological trends consistent with expected future conditions. Proc Natl Acad Sci USA. 2013;110(16):6448-6452. https://doi.org/10.1073/pnas.1216006110 [ Links ]
33. Matthews MW, Bernard S. Eutrophication and cyanobacteria in South Africa's standing water bodies: A view from space. S Afr J Sci. 2015;111(5):1-8. https://doi.org/10.17159/sajs.2015/2014019 [ Links ]
34. Wilson MA, Carpenter SR. Economic valuation of freshwater ecosystem services in the United States: 1971-1997. Ecol Appl. 1999;9(3):772-783. https://doi.org/10.1890/1051-0761(1999)009[0772:EVOFES]2.0.CO;2 [ Links ]
35. Fosso-Kankeu E, Jagals P Du Preez H. Exposure of rural households to toxic cyanobacteria in container-stored water. Water SA. 2008;34(5):631-636. https://doi.org/10.4314/wsa.v34i5.180660 [ Links ]
36. Du Preez H, Swanepoel A, Van Baalen L, Oldewage A. Cyanobacterial Incident Management Frameworks (CIMFs) for application by drinking water suppliers. Water SA. 2007;33(5):643-652. https://doi.org/10.4314/wsa.v33i5.184085 [ Links ]
37. Mulholland PJ, Helton AM, Poole GC, Hall RO, Hamilton SK, Peterson BJ, et al. Stream denitrification across biomes and its response to anthropogenic nitrate loading. Nature. 2008;452(7184):202-205. https://doi.org/10.1038/nature06686 [ Links ]
38. Smith VH. Cultural eutrophication of inland, estuarine, and coastal waters. Successes, limitations, and frontiers in ecosystem science. 1998:7-19. https://doi.org/10.1007/978-1-4612-1724-4_2 [ Links ]
39. Chauhan P Chauhan RP Gupta M. Estimation of naturally occurring radionuclides in fertilizers using gamma spectrometry and elemental analysis by XRF and XRD techniques. Microchem J. 2013;106:73-78. https://doi.org/10.1016/j.microc.2012.05.007 [ Links ]
40. Isinkaralar K. The large-scale period of atmospheric trace metal deposition to urban landscape trees as a biomonitor. Biomass Convers Biorefin. 2022. https://doi.org/10.1007/s13399-022-02796-4 [ Links ]
41. Brouwer P Theory of XRF [document on the Internet]. c2006 [cited 2023 Aug 15]. Available from: https://home.iiserb.ac.in/~ramyasr/files/Manuals/XRF.pdf [ Links ]
42. Kramer MJ. Fertilizer effects on soil pH, soil nutrients, and nutrient uptake in swamp white and pin oak seedlings on an alkaline Missouri River bottomland. Columbia, MO: University of Missouri-Columbia; 2008. [ Links ]
43. Lider W X-ray fluorescence imaging. Physics-Uspekhi. 2018;61(10):980. https://doi.org/10.3367/UFNe.2017.07.038174 [ Links ]
44. Chen ZW, Gibson WM, Huang H. High definition x-ray fluorescence: Principles and techniques. X-ray Optics Instrum. 2008;2008, Art. #318171. https://doi.org/10.1155/2008/318171 [ Links ]
45. Tsuji K, Ohmori T, Yamaguchi M. Wavelength dispersive X-ray fluorescence imaging. Anal Chem. 2011;83(16):6389-6394. https://doi.org/10.1021/ac201395u [ Links ]
46. Humphreys CJ. The significance of Bragg's law in electron diffraction and microscopy, and Bragg's second law. Acta Crystallogr A. 2013;69(1):45-50. https://doi.org/10.1107/S0108767312047587 [ Links ]
47. Conover CWS, Dudek J. An undergraduate experiment on x-ray spectra and Moseley's law using a scanning electron microscope. Am J Phys. 1996;64(3):335- 338. https://doi.org/10.1119/1.18244Tsuji [ Links ]
48. Khalid A, Khan AT, Anwar MS. X-ray fluorescence (XRF) spectrometry for materials analysis and "discovering" the atomic number. J Phys. 1996;64:335-338. [ Links ]
49. Berkowitz E. X-ray physics [document on the Internet]. c2006 [cited 2023 Aug 15]. Available from: http://www.phys.boun.edu.tr/~burcin/xray_physics.pdf [ Links ]
50. Soltis T, Folan LM, Eltareb W. One hundred years of Moseley's law: An undergraduate experiment with relativistic effects. Am J Phys. 2017; 85(5):352-358. https://doi.org/10.1119/L4977793 [ Links ]
51. World Health Organization. Trace elements in human nutrition and health. Geneva: World Health Organization; 1996. [ Links ]
52. Akpan IO, William ES. Assessment of elemental concentrations of roadside soils in relation to traffic density in Calabar, Nigeria. Int J Sci Technol Res. 2014;3:65-70. [ Links ]
53. Pavlovic J, Kostic L, Bosnic P Kirkby EA, Nikolic M. Interactions of silicon with essential and beneficial elements in plants. Front Plant Sci. 2021;12:697592. https://doi.org/10.3389/fpls.2021.697592 [ Links ]
54. Albright EI. Background concentrations of trace elements in soils and rocks of the Georgia piedmont [doctoral dissertation]. Athens, GA: University of Georgia; 2004. [ Links ]
55. Molepo KJ, Ekosse GE, Ngole VM. The role of potassium in the fertility status of soils: A case study of the University of Limpopo experimental Farm, South Africa. Res J Biotechnol. 2014;9(8):78-89. [ Links ]
56. Refiloe M. An overview of South Africa's titanium mineral concentrate industry. Report R71/2008. Pretoria: Department of Mineral Resources, Republic of South Africa; 2008. Available from: https://www.dmr.gov.za/LinkClick.aspx?fileticket=Yp939PhQ8lQ%3D&portalid=0 [ Links ]
57. Pâhlsson AM. Influence of aluminium on biomass, nutrients, soluble carbohydrates and phenols in beech (Fagus sylvatica). Physiol Plant. 1990;78(1):79-84. https://doi.org/10.1111/j.1399-3054.1990.tb08718.x [ Links ]
58. Bvenura C, Afolayan AJ. Heavy metal contamination of vegetables cultivated in home gardens in the Eastern Cape. S Afr J Sci. 2012;108(9/10), Art. #696. https://doi.org/10.4102/sajs.v108i9/10.696 [ Links ]
59. FAO/WHO. Joint FAO/WHO Food Standards Programme Codex Committee on Contaminants in Foods. Fifth Session. Rome: fAO; 2011. p. 21-25. [ Links ]
 Correspondence:
Mashinga Mvelase
Email:emjay.mvelase@gmail.com
Received: 17 Nov. 2022
Revised: 24 May 2023
Accepted: 25 May 2023
Published: 28 Sep. 2023
Editor: Michael Inggs
Funding: None

