


Services on Demand
Article
 English (pdf)
 Article in xml format
 Article references
Indicators

Related links
-
 Cited by Google
 -
 Similars in Google
Share

 Permalink
South African Journal of Science
On-line version ISSN 1996-7489
Print version ISSN 0038-2353
S. Afr. j. sci. vol.119 n.9-10 Pretoria Sep./Oct. 2023
http://dx.doi.org/10.17159/sajs.2023/15494
RESEARCH ARTICLE
Association of accelerometry-based and self-reported physical activity with cardiovascular risk in South African children
Patricia ArnaizI; Felix GuntlisbergenI; Denis InfangerI; Markus GerberI; Larissa AdamsII; Danielle DolleyII; Nandi JoubertI, III, IV; Madeleine NienaberII; Siphesihle NqwenisoII; Rosa du RandtII; Peter SteinmannIII, IV; Jürg UtzingerIII; Cheryl WalterII; Uwe PühseI; Ivan MüllerI
IDepartment of Sport, Exercise and Health, University of Basel, Basel, Switzerland
IIDepartment of Human Movement Science, Nelson Mandela University, Gqeberha, South Africa
IIISwiss Tropical and Public Health Institute, Allschwil, Switzerland
IVUniversity of Basel, Basel, Switzerland
ABSTRACT
The burden of non-communicable diseases is increasing, with risk factors emerging early in life. Physical activity reduces cardiovascular risk, but limited evidence exists for children from lower-income countries and mostly relies on self-reported methods that might be inaccurate and biased. We aimed to compare self-reported and accelerometer-measured physical activity in relation to cardiovascular risk markers in children from underserved communities in South Africa. We analysed cross-sectional data from 594 children aged 8 to 13. Physical activity was measured via accelerometry and the Physical Activity Questionnaire for Older Children (PAQ-C). Correlation analyses and linear regression models examined the relationship between accelerometer-measured and self-reported physical activity and their association with cardiovascular risk markers (body mass index, blood pressure, blood lipid profile and glycated haemoglobin). Results show a positive but weak correlation between PAQ-C scores and accelerometer-measured moderate-to-vigorous physical activity (MVPA). MVPA was inversely associated with body mass index, whilst sedentary behaviour correlated positively with lipid levels. PAQ-C scores were inversely associated with systolic blood pressure. The comparison of self-reported and accelerometer-measured physical activity in children from Gqeberha, South Africa, revealed inconsistencies in their correlation and association with cardiovascular risk markers. Accelerometry provided a more accurate cardiovascular risk estimation than PAQ-C, although associations were weak. Further, longitudinal studies should investigate the predictive power of both methodologies. These findings inform researchers and public health practitioners in the choice of method for physical activity appraisal beyond practical considerations, especially when combined with cardiovascular risk and in lower-income settings.
SIGNIFICANCE:
We explore two widely used methods to assess physical activity levels in children. By comparing both methods, we expose inconsistencies in their correlation and association with cardiovascular risk markers. These data can guide researchers and public health practitioners in the use of one method beyond practical considerations. Whilst this work focuses on children from marginalised areas of South Africa, the issues explored are of relevance to other lower-income settings.
Keywords: physical activity, accelerometry, self-report, cardiovascular health, children, South Africa
Introduction
Cardiovascular diseases (CVD) are the leading cause of death worldwide,1 and their burden is increasing in low-and middle-income countries (LMICs).2 Meanwhile, physical activity (PA) has substantial positive effects on CVD mortality. In fact, beneficial health outcomes begin with very modest amounts of moderate-to-vigorous physical activity (MVPA).3 Although the positive effects of PA on cardiovascular health have already been observed in childhood, the relationship between PA and cardiovascular risk markers (CRMs) has predominantly been studied in adults.4 Furthermore, most studies examining PA behaviour have originated from high-income countries (HICs).
Behaviours associated with PA are complex constructs that differ according to socioeconomic status, region and cultural context.5 Yet, PA health benefits observed in HICs have been broadly extrapolated to LMICs due to the scarcity of evidence from these regions. An umbrella systematic review found that 3.1% of studies concerned with promoting PA in children and adolescents were from LMICs.6 Of those, only one originated from Africa. This observation was corroborated by Guthold et al., who reported that sub-Saharan Africa had the least available data on PA amongst adolescents worldwide.7 Moreover, estimates of PA levels in LMICs are heterogeneous, partly due to an unstandardised use of different measurement methods.
With current physical inactivity estimates arising from self-reported methods, a device-based PA data gap exists, especially in LMICs.7 A systematic review of PA trends in sub-Saharan Africa found that 72.2% of studies relied on self-report methods to assess PA.8 Self-reporting provides a convenient way to assess activity patterns across large populations in a short time.9,10 However, self-reports are prone to inaccuracy and bias originating from recall errors, the social desirability effect and difficulties understanding the questions.11 Wearable devices such as accelerometry are seen as a more accurate alternative,12 as they can quantify energy expenditure and estimate the intensity, duration and frequency of PA.13 Nevertheless, accelerometry technology is costly and time consuming, especially on a large scale, whilst it also involves a range of subjective decisions.14 As a consequence, the lack of consensus on PA assessment instruments and data management limits the comparability of studies.
Multiple studies have exposed differences and paucity of agreement between self-report methods and device-based assessments. For example, the Scottish Health Survey 2003 found that more than 75% of children reported meeting the recommended 60 minutes of moderate-to-vigorous physical activity (MVPA) per day,15 whilst other studies from the United Kingdom using accelerometry reported a prevalence of less than 5%.1618 In South Africa, estimates for meeting PA recommendations range between 35.8%8 and 77%19 and vary both between and within instruments.20 22 It is therefore not surprising that previous studies have shown a weak-to-moderate correlation between self-reported and device-based PA assessments.13,23 Filling the PA data gap with more harmonised, device-based and larger sample studies is necessary to promote best PA practices in LMICs.7
Given the scarcity of data on PA behaviour from LMICs and the differences in the use and scope of self-report questionnaires versus accelerometry-based PA measurements, the aim of this study was twofold. First, we compared self-reported and accelerometer-measured PA amongst a large sample of school children from South Africa. Secondly, we examined their association with different CRMs. Based on the existing evidence, we hypothesised that self-reporting and accelerometry would vary in their PA estimates and association with CRMs.
Materials and methods
Study design and setting
This study was part of the KaziBantu project, a school-based intervention programme that attempts to promote sustainable lifestyle changes to achieve better health within disadvantaged communities in Gqeberha, South Africa. The KaziBantu programme was designed as a cluster-randomised controlled trial (RCT) and included eight schools that were randomly allocated to an intervention group (four schools) and a control group (four schools).24 The study was structured such that after the completion of a baseline assessment in January 2019, children from the four intervention schools participated in the KaziKidz health promotion intervention for 32 weeks. The trial was registered at ISRCTN on 11 July 2018 under the registration number 18485542.
Participants
Data from 981 children were initially collected during a baseline assessment in early 2019. The children were aged between 8 and 16 years and were attending grades 4-6. Only children between the ages of 8 and 13 were retained in the final study sample, as there was only one child at age 14 and 16, respectively. After excluding children due to lack of consent or dropping out (n = 14), reporting an impairment during data collection (n = 238), not answering all questions from the PAQ-C (n = 39), having no or invalid ActiGraph measurements (n = 75), missing information on height and weight (n = 27), or being outside the age range (n = 2), the final study sample consisted of 586 children (301 boys and 285 girls). The minimal sample size was originally calculated for the cluster RCT, as described in the study protocol.24 A posteriori power analysis conducted with G*Power 3.1 Software (Heinrich Heine Universitãt Düsseldorf, Germany) revealed that the sample of 586 participants was sufficiently powered to demonstrate a weak correlation (r = 0.102) between self-reported and accelerometry-based PA (assuming an alpha error of 0.05 and a power of 0.80).25
Data collection
Accelerometry-based assessment of physical activity
The ActiGraph accelerometry device (ActiGraph wGT3X-BT, Pensacola, Florida, USA) was used to measure PA. Participants were directed to wear the device for seven consecutive days around the hip. They were allowed to remove the ActiGraph for activities that involved water contact (e.g. swimming or showering). Accelerometers were set up at a sampling rate of 30 Hz and ran on the latest firmware version (version 1.9.2). Analysis was carried out with the ActiLife software (version 6.13.4), using data set up at epochs of 10 s.
To be eligible for the data evaluation, the ActiGraph had to be worn for at least four valid weekdays and at least one weekend day. A day was considered valid if the ActiGraph had been worn for at least eight hours during that day.26 Sleep time was removed and during waking time, non-wear periods, defined and identified based on the Troiano 2007 algorithm, were excluded from the analysis. The different PA intensities were categorised according to the cut-off points from Evenson 2008 for children.27
Self-reported physical activity
A simplified version of the Physical Activity Questionnaire for Older Children (PAQ-C) was used to assess children's PA behaviour over the previous week.28 Specifically, children ranked their personal PA level by answering questions 2-8, whereas question 10 inquired whether children were fit to perform PA. Later, a summary activity score between 1 and 5 (1 = lowest PA level, 5 = highest PA level) was calculated for questions 2-8. Children who reported sickness in question 10 or failed to answer one or more questions were excluded from the study sample (n = 277).
Blood pressure
Resting BP was measured after the children were directed to be seated for 5 min. BP was measured three times with a pause of 1 min between each measurement. A calibrated Omron digital blood pressure monitor (Omron M6 AC model; Hoofddorp, The Netherlands) was used by nurses or biokineticists for the measurements. Only the second and third measurements were used to calculate an average for systolic (SBP) and diastolic BP (DBP). Elevated blood pressure in children was defined as above 120/80 mmHg or the 90th percentile according to sex, age and height reference values.29
Blood lipid profiles and glycated haemoglobin
A point-of-care instrument (Alere Afinion AS 100 Analyzer, Abbott Technologies; Abbott Park, United States of America) was used to determine the blood lipid profiles (BLP) and glycated haemoglobin (HbA1c) concentrations. A healthcare worker first cleaned the fingertips with an alcohol swab and then pricked it with a safety lancet. Two drops of blood were carefully squeezed out of the finger, but only the second drop was collected for analysis. The device delivered the results within 8 min. All devices used were tested and calibrated before the procedure.24
The BLP included total cholesterol (TC), low-density lipoprotein (LDL), high-density lipoprotein (HDL), triglycerides (TG), non-high-density lipoprotein (non-HDL) and the ratio between TC and HDL (TC/HDL). Acceptable serum lipid and lipoprotein concentrations for children are <4.4 mmol/L for TC, <2.8 mmol/L for LDL, >1.2 mmol/L for HDL, <1 mmol/L for TG, <3.1 mmol/L for non-HDL and <3.7 for TC/HDL.30 Levels of HbA1c revealed participants' average plasma glucose level over the past 8-12 weeks and were reported as a percentage of the total haemoglobin (%). Individuals with an HbA1c of 6.5% or higher are diagnosed with diabetes.31
Body mass index
The body height of the children was measured by a stadiometer with an accuracy of 0.1 cm. Participants were instructed to keep their backs erect, and their shoulders relaxed. The body weight was measured by standing on a digital weighing scale (Tanita MC-580; Tanita, Tokyo, Japan) with an accuracy of 0.1 kg. For each participant, the BMI was calculated by dividing body weight (kg) by the square of body height (m2). Based on sex and age references specified by the World Health Organization (WHO), BMI for age was calculated and subsequently classified as "Thin" if it was below -2 standard deviation (SD), "Normal weight" if between -2 and 1 SD, "Overweight" if above 1 SD, or "Obese" if above 2 SD.32
Statistical analyses
Statistical analyses were conducted with the SPSS Statistics program (IBM SPSS Statistics for Mac, Version 27). Descriptive statistics were calculated as frequencies (%) for categorical variables and as medians (with interquartile range) for relatively symmetric, as well as skewed continuous variables. To identify differences between boys and girls, Mann-Whitney ü-tests were conducted for continuous data, and Pearson's chi-squared tests were used for categorical data. Significance was set at p < 0.05 for all statistical analyses, and all tests were two-sided.
The relationship between PAQ-C scores and accelerometry-derived PA metrics was assessed using Spearman's rank correlation coefficients (p). Accelerometer wear time, age and sex were included as control variables. Cohen's correlation guidelines were used to evaluate the effect sizes as follows: |p|=0.1 small effect size, |p| =0.3 medium effect size, H =0.5 large effect size.33 Linear regression models were used to analyse the associations between PA and sedentary behaviour (SB) with CRMs. All models were adjusted for the influence of height, weight, sex, age and accelerometer wear time except BMI which was controlled only for sex, age and wear time. Unstandardised regression coefficients were used to assess effect size and discuss clinical relevance.
Ethics approval and consent to participate
The procedures of the KaziBantu study comply with the Declaration of Helsinki and have received ethical approval from the Nelson Mandela University Ethics Committee (reference #H18-HEA-HMS-001; dated 26 March 2018), Eastern Cape Department of Health (reference #EC_201804_007; dated 5 June 2018), and Eastern Cape Department of Education (dated 9 May 2018). The study was also cleared by the ethical review board of the Ethics Committee Northwest and Central Switzerland (reference #R-2018-00047; dated 1 March 2018). Each possible participant was informed about the study's objectives, procedures, risks and benefits. Participation in this study was voluntary and withdrawing was possible at any time with no further consequences. Oral approval (assent) had to be given by the participating children, whilst written informed consent was given by the corresponding parent or guardian.
Results
Descriptive characteristics
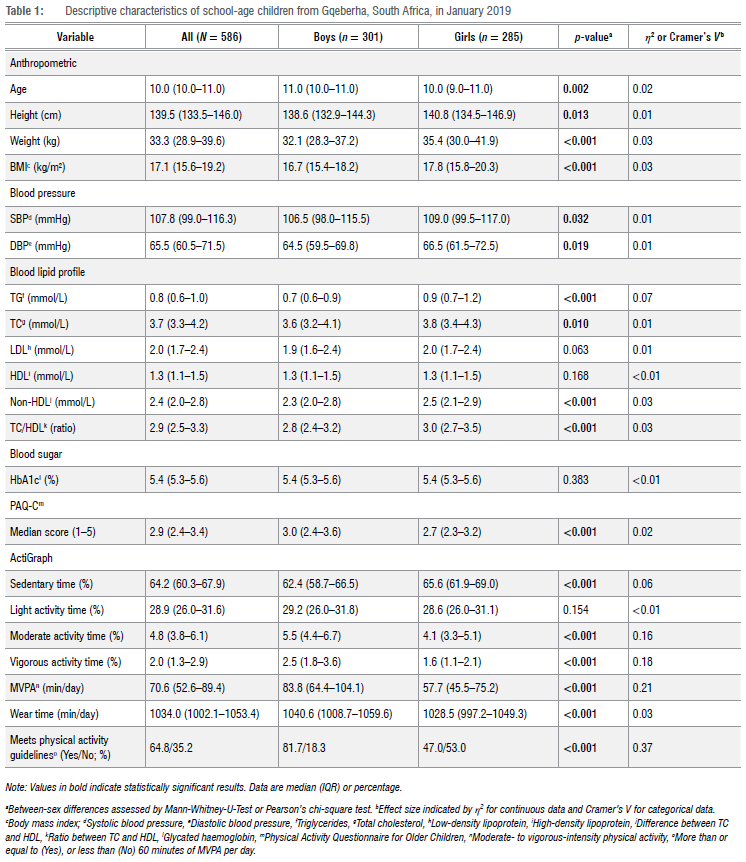
Characteristics of the study participants are presented in Table 1. With a median of 70.6 min of MVPA per day, 64.8% of the children achieved the recommended minimum of 60 min of MVPA per day. Overall, study participants spent 64.2% of their daily time in SB, 28.9% in light PA, 4.8% in moderate PA, and 2.0% in vigorous PA. The median wear time of the ActiGraph accelerometer was 17.2 h per day. The median PAQ-C score was 2.9, which lies slightly above half the possible value between 1 (lowest) and 5 (highest).
Significant differences were found between girls and boys. BMI, SBP, DBP, TG, TC, non-HDL, and TC/HDL were higher in girls than in boys (BMI: 17.8 vs. 16.7, p < 0.001; SBP: 109.0 mmHg vs. 106.5 mmHg, p = 0.032; DBP: 66.5 mmHg vs. 64.5 mmHg, p = 0.019; TG: 0.9 mmol/L vs. 0.7 mmol/L, p < 0.001; TC: 3.8 mmol/L vs. 3.6 mmol/L, p = 0.010; non-HDL: 2.5 mmol/L vs. 2.3 mmol/L, p < 0.001; TC/HDL: 3.0 vs. 2.8, p < 0.001). Boys were significantly more active than girls, as indicated by both the questionnaire (3.0 vs. 2.7, p < 0.001) and accelerometry (MVPA min/day 83.8 vs. 57.7, p < 0.001), and spent less time engaging in SB than girls (62.4% vs. 65.6%, p < 0.001, respectively). The WHO recommendations for PA were achieved by 81.7% of boys compared with only 47.0% of girls.
Correlation analysis between PAQ-C and wGT3X-BT ActiGraphy
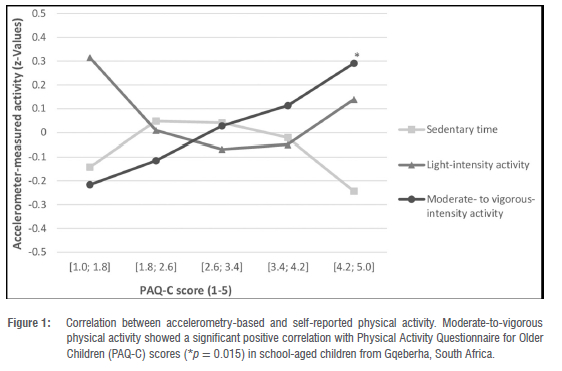
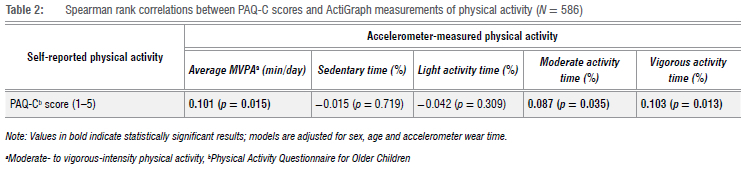
We found significant but weak associations between PAQ-C scores and PA metrics measured by the ActiGraph accelerometry (Table 2). The PAQ-C scores were positively associated with average MVPA minutes per day (p=0.10, p = 0.015). The PAQ-C scores also correlated with the percentage of time spent engaging in moderate- or vigorous-intensity activities (p=0.09, p = 0.035; p=0.10, p = 0.013, respectively). However, we found little evidence for an association between PAQ-C scores and the time spent in SB (p = 0.72) or light PA (p = 0.31). Association patterns are depicted in Figure 1.
Associations between physical activity and sedentary behaviour with cardiovascular risk markers
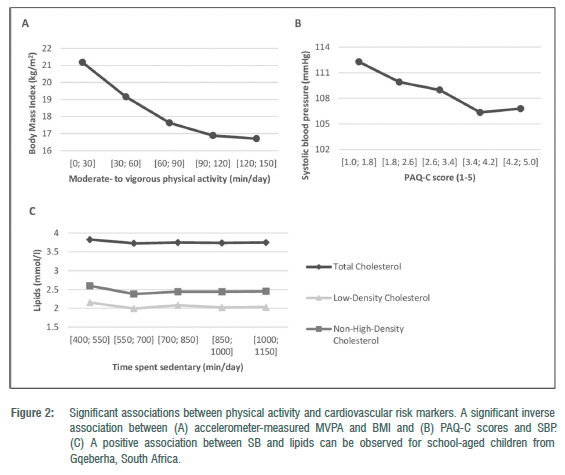
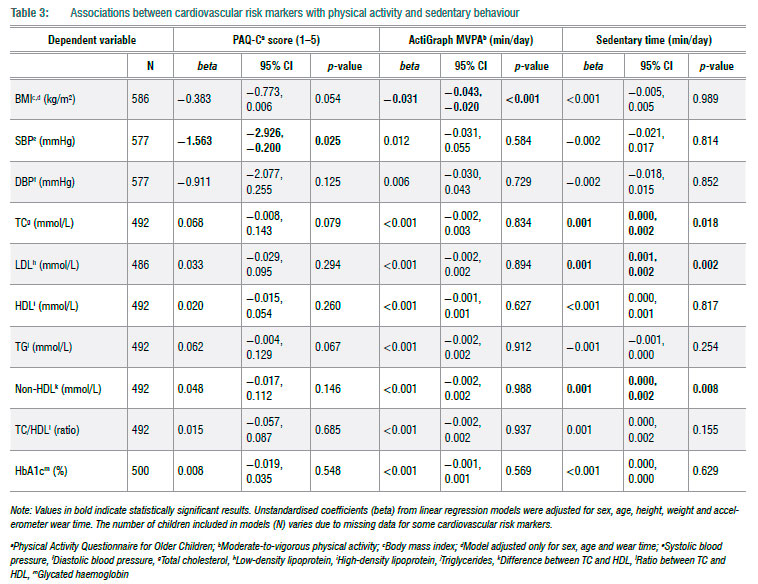
Significant associations were observed between selected CRMs and PA metrics measured by PAQ-C and ActiGraph (Table 3). The ActiGraph MVPA was significantly and inversely associated with BMI (MVPA: beta=-0.031; CI = -0.043, -0.020; p < 0.001). The PAQ-C scores were inversely associated with SBP (beta=-1.563; CI = -2.926, -0.200; p = 0.025). Time spent in SB was positively associated with TC, LDL and non-HDL (TC: beta=0.001, CI = 0.000, 0.002, p = 0.018; LDL: beta=0.001, CI = 0.001, 0.002, p = 0.002; non-HDL: beta=0.001, CI = 0.000, 0.002, p = 0.008). Figure 2 provides a graphical representation of significant association patterns. We found little evidence for an association of DBP HDL, TG, TC/HDL and HbA1c with self-reported PA levels or with accelerometer-measured MVPA and SB.
Discussion
This study compared self-reported (PAQ-C) and accelerometry-based (ActiGraphy) PA and their association with selected CRMs in a population of school-aged children from underserved communities in South Africa. It was found that PAQ-C scores were weakly associated with ActiGraph-measured MVPA and that the two PA assessment methods were inconsistent in detecting relationships with CRMs.
PAQ-C scores correlated positively with ActiGraph-measured MVPA levels. Thus, children who rated themselves as being more physically active according to their PAQ-C scores achieved higher levels of MVPA as measured via accelerometry. However, the strength of the relationship between the two methods was weak. These findings agree with the results from other studies questioning the convergent validity of the PAQ-C.34-36 A recent meta-analysis by Marasso and colleagues identified a moderate pooled correlation coefficient between the PAQ-C and accelerometry measurements, whilst also reporting wide correlation variability in the studies included. The low correlation coefficient and the weak explanatory power observed in this study contribute to the notion that PAQ-C and accelerometry have an inconsistent agreement for measuring MVPA. Furthermore, the PAQ-C would not fulfil the standards of a PA questionnaire proposed by Terwee et al., whereby correlation coefficients with accelerometer-measured MVPA must be at least moderate.37 Because we only included valid accelerometry data in our analyses to ensure a representative mean wear time (17.23 out of a maximum of 18 h), we deem the presented accelerometry-based assessments as accurate. Therefore, we argue that attempting to derive children's objective MVPA levels from their PAQ-C scores, and vice versa, is linked to a high level of uncertainty.
Differences between self-reported and accelerometer-measured PA can be interpreted as children's difficulties in assessing their own PA habits. It has been observed that memory errors play an important role, particularly when dealing with children.38 Another factor potentially contributing to discrepancies is the social desirability bias, where study participants report higher PA levels to be viewed favourably by others. Moreover, differences might stem from the ActiGraph not being able to accurately measure activities with little upper body movement such as cycling. During cycling, the upper body is not accelerated in any direction as happens when, for example playing soccer, a popular activity amongst children in South Africa.39 Previous studies have also pointed out that the PAQ-C and accelerometry do not actually measure the same construct.40 Accelerometry measures the exact duration, frequency and intensity of body movement, whilst the PAQ-C provides information about self-reported PA behaviour, activity types and settings in which PA is performed. Hence, the simultaneous use of PAQ-C and accelerometry could allow for a more comprehensive study of the relationship between self-perceived and actual PA and customised PA recommendations.
Regarding cardiometabolic risk, ActiGraph-measured MVPA was inversely related to BMI. Increasing MVPA by 15 min per day was associated with a BMI reduction of approximately -0.47 points. The significant association between accelerometer-measured MVPA and BMI demonstrates that PA, particularly MVPA, can be a crucial contributor to weight control at a young age.41 Especially girls should be encouraged to increase their time spent in MVPA, as they spent substantially less time in MVPA and showed higher BMI values compared to boys (57.7 vs. 83.8 min/day and 17.8 vs. 16.7 kg/m2, respectively). In contrast, children's self-reported PA levels were not significantly associated with BMI. Thus, children who considered themselves as more physically active did not exhibit lower BMI values. More consistent associations with BMI for device-based PA than for self-reported PA have previously been reported and were attributed to self-report bias.42
Diverging results were also obtained for the association between PA and SBP. In this study, SBP was weakly and inversely associated with self-reported PA but not with ActiGraph MVPA levels. Research has not shown that self-reported PA estimates are more likely to identify a significant association with BP compared with device-based PA measurements. In contrast, some studies have observed a significant inverse association between PA and BP using device-based methods,43-45 although this relationship has not always been established.46-48 The inconsistency of findings on the relationship between PA and BP amongst children and adolescents may be explained by varying durations of PA measurement, a lack of consistency in methodology, the influence of childhood adiposity, and wide ranges of age groups included in the studies.49
The activity assessment by accelerometry also provides estimates of the time children spend in SB, which allowed for the analysis of the association between CRMs and physical inactivity. Higher levels of SB were related to small increases in TC, LDL and non-HDL concentrations, whilst neither self-reported nor accelerometer-measured PA was associated with any BLP parameter. Increasing daily SB by 15 min was associated with a predicted increase of +0.015 mmol/L in TC, LDL and non-HDL. Because girls showed higher levels of SB compared to boys (65.6 vs. 62.4% per day, respectively) and higher concentrations in TC (3.8 vs. 3.6 mmol/L, respectively) and non-HDL (2.5 vs. 2.3 mmol/L, respectively), they should particularly be encouraged to reduce time spent in SB. It has been hypothesised that PA and SB have independent effects on lipoprotein metabolism, with PA more strongly affecting HDL and TG, and SB being rather related to the 'bad' cholesterol (LDL and non-HDL).50 Consistent with the findings of this study, it has been claimed that PA does not lower LDL and TC.51 However, the significant effect of MVPA on HDL and TG that has been previously observed was not found in this study.52 Our results conform to those of the European Youth Heart Study that revealed nonsignificant relationships between MVPA and BLP.53
The results of this work must be interpreted considering the following limitations. First, this study has a cross-sectional design, which means that causality cannot be inferred because temporality is not known. Second, 8.0% of children with ActiGraph data were excluded from the analyses due to not meeting our wear time requirements. Third, PA was assessed over the period of 1 week, but since PA is highly variable in children, the measure comprised 1 week may not fully reflect children's true PA levels. Fourth, the limitations of the assessment methods must be considered. PAQ-C is prone to recall errors, social desirability effect and difficulties understanding the questions. Also, more than 25% of study participants reported that an impairment had prevented them from engaging in their usual PA and were therefore not included in the analysis. Limitations of the ActiGraph accelerometry include its inability to accurately measure activities with little upper body movement such as cycling or weight training when worn around the hip. Lastly, the impact of children's dietary habits was not accounted for in the associations between PA and SB with CRMs.
Conclusion
We found a weak relationship between self-reported (PAQ-C) and accelerometer-measured (ActiGraph) MVPA levels in a paediatric population from low-income areas in South Africa. Thus, we advise caution when comparing studies that are based on diverse methodologies for assessing PA. As PA measured via accelerometry and SB showed stronger associations with CRMs, the wearable device ActiGraph allowed for a more accurate CVD risk estimation compared to the PAQ-C questionnaire. However, our results point towards a weak association between PA and CRMs. Therefore, it is of interest to further investigate the association between different PA measurement methods in longitudinal studies, especially under researched paediatric populations from LMICs.
Acknowledgements
We thank all members of the KaziBantu team who contributed to the realisation of the project and who were involved in data collection in Gqeberha, South Africa. We also appreciate all learners of the KaziBantu schools in Gqeberha for their participation in the project and the teachers and principals for ensuring smooth collaboration. We thank the reviewers for their inputs and acknowledge the Novartis Foundation (Basel, Switzerland) and the Swiss National Science Foundation (Bern, Switzerland) for funding the research.
Competing interests
We have no competing interest to declare.
Authors' contributions
PA.: Conceptualisation, writing - the initial draft, data compilation, data curation, interpretation of results, student supervision. F.G.: Conceptualisation, writing - the initial draft, data compilation, statistical analyses, interpretation of results. D.I.: Statistical input, writing - revisions. M.G.: Writing - revisions. L.A.: Data collection, writing - revisions. D.D.: Data collection, writing - revisions. N.J.: Data collection, writing - revisions. M.N.: Data collection, writing - revisions. S.N.: Data collection, writing -revisions. R.d.R.: Writing - revisions. P.S.: Writing - revisions. J.U.: Writing - revisions. C.W.: Writing - revisions. U.P: Writing - revisions. I.M.: Conceptualisation, data collection, writing - revisions.
References
1. WHO. The top 10 causes of death [webpage on the Internet]. c2020 [cited 2021 Jul 05]. Available from: https://www.who.int/news-room/fact-sheets/detail/the-top-10-causes-of-death [ Links ]
2. Roth GA, Abate D, Abate KH, Abay SM, Abbafati C, Abbasi N, et al. Global, regional, and national age-sex-specific mortality for 282 causes of death in 195 countries and territories, 1980-2017: A systematic analysis for the Global Burden of Disease Study 2017. The Lancet. 2018;392(10159):1736-1788. [ Links ]
3. Kraus WE, Powell KE, Haskell WL, Janz KF, Campbell WW, Jakicic JM, et al. Physical activity, all-cause and cardiovascular mortality, and cardiovascular disease. Med Sci Sports Exerc. 2019;51(6):1270-1281. https://doi.org/10.1249/MSS.0000000000001939 [ Links ]
4. Ruiz JR, Ortega FB. Physical activity and cardiovascular disease risk factors in children and adolescents. Curr Cardiovasc Risk Rep. 2009;3(4):281-287. https://doi.org/10.1007/s12170-009-0043-6 [ Links ]
5. Siefken K, Varela AR, Waqanivalu T, Schulenkorf N. Physical activity in low-and middle-income countries. 1st ed. London: Routledge; 2022. Available from: https://www.taylorfrancis.com/books/9780429344732 [ Links ]
6. Barbosa Filho VC, Minatto G, Mota J, Silva KS, de Campos W, Lopes A da S. Promoting physical activity for children and adolescents in low- and middle-income countries: An umbrella systematic review. Prev Med. 2016;88:115-126. https://doi.org/10.1016/j.ypmed.2016.03.025 [ Links ]
7. Guthold R, Stevens GA, Riley LM, Bull FC. Global trends in insufficient physical activity among adolescents: A pooled analysis of 298 population-based surveys with 1-6 million participants. Lancet Child Adolesc Health. 2020;4(1):23-35. https://doi.org/10.1016/S2352-4642(19)30323-2 [ Links ]
8. Muthuri SK, Onywera VO, Tremblay MS, Broyles ST, Chaput JP Fogelholm M, et al. Relationships between parental education and overweight with childhood overweight and physical activity in 9-11 year old children: Results from a 12-country study. PLoS ONE. 2016;11(8), e0147746. https://doi.org/10.1371/journal.pone.0147746 [ Links ]
9. Nigg CR, Fuchs R, Gerber M, Jekauc D, Koch T, Krell-Roesch J, et al. Assessing physical activity through questionnaires - A consensus of best practices and future directions. Psychol Sport Exerc. 2020;50:101715. https://doi.org/10.1016/j.psychsport.2020.101715 [ Links ]
10. Benítez-Porres J. Cut-off values for classifying active children and adolescentes using the Physical Activity Questionnaire: PAQ-C and PAQ-A. Nutr Hosp. 2016;33(5). Available from: http://revista.nutricionhospitalaria.net/index.php/nh/article/view/564 [ Links ]
11. Sallis JF. Self-report measures of children's physical activity. J Sch Health. 1991;61(5):215-219. https://doi.org/10.1111/j.1746-1561.1991.tb06017.x [ Links ]
12. Burchartz A, Anedda B, Auerswald T, Giurgiu M, Hill H, Ketelhut S, et al. Assessing physical behavior through accelerometry - State of the science, best practices and future directions. Psychol Sport Exerc. 2020;49:101703. https://doi.org/10.1016/j.psychsport.2020.101703 [ Links ]
13. Marasso D, Lupo C, Collura S, Rainoldi A, Brustio PR. Subjective versus objective measure of physical activity: A systematic review and meta-analysis of the convergent validity of the physical activity questionnaire for children (PAQ-C). Int J Environ Res Public Health. 2021;18(7):3413. https://doi.org/10.3390/ijerph18073413 [ Links ]
14. Prince SA, Adamo KB, Hamel M, Hardt J, Connor Gorber S, Tremblay M. A comparison of direct versus self-report measures for assessing physical activity in adults: A systematic review. Int J Behav Nutr Phys Act. 2008;5(1):56. https://doi.org/10.1186/1479-5868-5-56 [ Links ]
15. Scottish Executive. Scottish health survey 2003: Summary of key findings. Edinburgh: Scottish Executive The Stationery Office; 2005. [ Links ]
16. Ness AR, Leary SD, Mattocks C, Blair SN, Reilly JJ, Wells J, et al. Objectively measured physical activity and fat mass in a large cohort of children. PLoS Med. 2007 March 20;4(3), e97. https://doi.org/10.1371/journal.pmed.0040097 [ Links ]
17. Reilly J, Jackson D, Montgomery C, Kelly L, Slater C, Grant S, et al. Total energy expenditure and physical activity in young Scottish children: Mixed longitudinal study. The Lancet. 2004;363(9404):211-212. https://doi.org/10.1016/S0140-6736(03)15331-7 [ Links ]
18. Riddoch CJ, Mattocks C, Deere K, Saunders J, Kirkby J, Tilling K, et al. Objective measurement of levels and patterns of physical activity. Arch Dis Child. 2007;92(11):963-969. https://doi.org/10.1136/adc.2006.112136 [ Links ]
19. Sedumedi CM, Janssen X, Reilly JJ, Kruger HS, Monyeki MA. Association between objectively determined physical activity levels and body composition in 6-8-year-old children from a black South African population: BC-IT study. Int J Environ Res Public Health. 2021;18(12):6453. https://doi.org/10.3390/ijerph18126453 [ Links ]
20. Nqweniso S, Walter C, du Randt R, Aerts A, Adams L, Degen J, et al. Prevention of overweight and hypertension through cardiorespiratory fitness and extracurricular sport participation among South African schoolchildren. Sustainability. 2020;12(16):6581. https://doi.org/10.3390/su12166581 [ Links ]
21. Salvini M, Gall S, Müller I, Walter C, du Randt R, Steinmann P et al. Physical activity and health-related quality of life among schoolchildren from disadvantaged neighbourhoods in Port Elizabeth, South Africa. Qual Life Res. 2018;27(1):205-216. https://doi.org/10.1007/s11136-017-1707-1 [ Links ]
22. Van Biljon A, McKune AJ, DuBose KD, Kolanisi U, Semple SJ. Physical activity levels in urban-based South African learners: A cross-sectional study of 7 348 participants. S Afr Med J. 2018;108(2):126. https://doi.org/10.7196/SAMJ.2017.v108i2.12766 [ Links ]
23. Koolhaas C, Van Rooij F, Cepeda M, Tiemeier H, Franco O, Schoufour J. Physical activity derived from questionnaires and wrist-worn accelerometers: Comparability and the role of demographic, lifestyle, and health factors among a population-based sample of older adults. Clin Epidemiol. 2017;10:1-16. https://doi.org/10.2147/CLEPS147613 [ Links ]
24. Müller I, Smith D, Adams L, Aerts A, Damons BP, Degen J, et al. Effects of a school-based health intervention program in marginalized communities of Port Elizabeth, South Africa (the Kazibantu study): Protocol for a randomized controlled trial. JMIR Res Protoc. 2019;8(7), e14097. https://doi.org/10.2196/14097 [ Links ]
25. Faul F, Erdfelder E, Buchner A, Lang AG. Statistical power analyses using G*Power 3.1: Tests for correlation and regression analyses. Behav Res Methods. 2009;41(4):1149-1160. https://doi.org/10.3758/BRM.4L4.1149 [ Links ]
26. Janz KF, Medema-Johnson HC, Letuchy EM, Burns TL, Gilmore JME, Torner JC, et al. Subjective and objective measures of physical activity in relationship to bone mineral content during late childhood: The Iowa Bone Development Study. Br J Sports Med. 2008;42(8):658-663. https://doi.org/10.1136/bjsm.2008.047779 [ Links ]
27. Evenson KR, Catellier DJ, Gill K, Ondrak KS, McMurray RG. Calibration of two objective measures of physical activity for children. J Sports Sci. 2008;26(14):1557-1565. https://doi.org/10.1080/02640410802334196 [ Links ]
28. Kowalski KC, Crocker PRE, Donen RM. The physical activity questionnaire for older children (PAQ-C) and adolescents (PAQ-A) manual. Saskatoon: University of Saskatchewan; 2004. Available from: https://www.prismsports.org/UserFiles/file/PAQ_manual_ScoringandPDF.pdf [ Links ]
29. Flynn JT, Kaelber DC, Baker-Smith CM, Blowey D, Carroll AE, Daniels SR, et al. Clinical practice guideline for screening and management of high blood pressure in children and adolescents. Pediatrics. 2017;140(3), e20171904. https://doi.org/10.1542/peds.2017-3035 [ Links ]
30. Orimadegun BE. Dyslipidaemia in African children and adolescents. In: Management of Dyslipidemia [Internet]. IntechOpen; 2021 [cited 2022 Jan 16]. Available from: https://doi.org/10.5772/intechopen.96804 [ Links ]
31. The International Expert Committee. International expert committee report on the role of the A1C assay in the diagnosis of diabetes. Diabetes Care. 2009;32(7):1327-1334. https://doi.org/10.2337/dc09-9033 [ Links ]
32. WHO. BMI-for-age (5-19 years) [webpage on the Internet]. c2007 [cited 2021 Nov 9]. Available from: https://www.who.int/tools/growth-reference-data-for-5to19-years/indicators/bmi-for-age [ Links ]
33. Cohen J. Statistical power analysis for the Behavioral Sciences. 2nd ed. New York: Routledge; 1988. [ Links ]
34. Benítez-Porres J, López-Fernández I, Raya JF, Alvarez Carnero S, Alvero-Cruz JR, Alvarez Carnero E. Reliability and validity of the PAQ-C questionnaire to assess physical activity in children. J Sch Health. 2016;86(9):677-685. https://doi.org/10.1111/josh.12418 [ Links ]
35. Ben Jemaa H, Mankaï A, Mahjoub F, Kortobi B, Khlifi S, Draoui J, et al. Physical activity level assessed by accelerometer and PAQ-C in Tunisian children. Ann Nutr Metab. 2018;73(3):234-240. https://doi.org/10.1159/000492673 [ Links ]
36. Chan CHS, Ha ASC, Ng JYY Lubans DR. Associations between fundamental movement skill competence, physical activity and psycho-social determinants in Hong Kong Chinese children. J Sports Sci. 2019;37(2):229-236. https://doi.org/10.1080/02640414.2018.1490055 [ Links ]
37. Terwee CB, Mokkink LB, Van Poppel MNM, Chinapaw MJM, Van Mechelen W, De Vet HCW. Qualitative attributes and measurement properties of physical activity questionnaires: A checklist. Sports Med. 2010;40(7):525-537. https://doi.org/10.2165/11531370-000000000-00000 [ Links ]
38. Sirard JR, Pate RR. Physical activity assessment in children and adolescents. Sports Med. 2001;31(6):439-454. https://doi.org/10.2165/00007256-200131060-00004 [ Links ]
39. Alegi P Bolsmann C. South Africa and the global game: Football, apartheid and beyond. London: Routledge; 2010. [ Links ]
40. Ham SA, Reis JP Strath SJ, Dubose KD, Ainsworth BE. Discrepancies between methods of identifying objectively determined physical activity. Med Sci Sports Exerc. 2007;39(1):52-58. https://doi.org/10.1249/01.mss.0000235886.17229.42 [ Links ]
41. Janssen I, LeBlanc AG. Systematic review of the health benefits of physical activity and fitness in school-aged children and youth. Int J Behav Nutr Phys Act. 2010;7(40):16. https://doi.org/10.1186/1479-5868-7-40 [ Links ]
42. Wanner M, Richard A, Martin B, Faeh D, Rohrmann S. Associations between self-reported and objectively measured physical activity, sedentary behavior and overweight/obesity in NHANES 2003-2006. Int J Obes. 2017;41(1):186-193. https://doi.org/10.1038/ijo.2016.168 [ Links ]
43. Owen CG, Nightingale CM, Rudnicka AR, Sattar N, Cook DG, Ekelund U, et al. Physical activity, obesity and cardiometabolic risk factors in 9- to 10-year-old UK children of white European, South Asian and black African-Caribbean origin: The Child Heart And health Study in England (CHASE). Diabetologia. 2010;53(8):1620-1630. https://doi.org/10.1007/s00125-010-1781-1 [ Links ]
44. Leary SD, Ness AR, Smith GD, Mattocks C, Deere K, Blair SN, et al. Physical activity and blood pressure in childhood: Findings from a population-based study. Hypertension. 2008;51(1):92-98. https://doi.org/10.1161/HYPERTENSIONAHA.107.099051 [ Links ]
45. Andersen LB, Riddoch C, Kriemler S, Hills A. Physical activity and cardiovascular risk factors in children. Br J Sports Med. 2011;45(11):871-876. https://doi.org/10.1136/bjsports-2011-090333 [ Links ]
46. Brage S, Wedderkopp N, Ekelund U, Franks PW, Wareham NJ, Andersen LB, et al. Features of the metabolic syndrome are associated with objectively measured physical activity and fitness in Danish children. Diabetes Care. 2004;27(9):2141-2148. https://doi.org/10.2337/diacare.27.9.2141 [ Links ]
47. Craig SB, Bandini LG, Lichtenstein AH, Schaefer EJ, Dietz WH. The impact of physical activity on lipids, lipoproteins, and blood pressure in preadolescent girls. Pediatrics. 1996;98(3):389-395. https://doi.org/10.1542/peds.98.3.389 [ Links ]
48. Klesges RC, Keith Haddock C, Eck LH. A multimethod approach to the measurement of childhood physical activity and its relationship to blood pressure and body weight. J Pediatr. 1990;116(6):888-893. https://doi.org/10.1016/S0022-3476(05)80645-6 [ Links ]
49. Knowles G, Pallan M, Thomas GN, Ekelund U, Cheng KK, Barrett T, et al. Physical activity and blood pressure in primary school children: A longitudinal study. Hypertension. 2013;61(1):70-75. https://doi.org/10.1161/HYPERTENSIONAHA.112.201277 [ Links ]
50. Celis-Morales CA, Perez-Bravo F, Ibanez L, Salas C, Bailey MES, Gill JMR. Objective vs. self-reported physical activity and sedentary time: effects of measurement method on relationships with risk biomarkers. PLoS ONE. 2012;7(5), e36345. https://doi.org/10.1371/journal.pone.0036345 [ Links ]
51. Ahmed HM, Blaha MJ, Nasir K, Rivera JJ, Blumenthal RS. Effects of physical activity on cardiovascular disease. Am J Cardiol. 2012;109(2):288-295. https://doi.org/10.1016/j.amjcard.2011.08.042 [ Links ]
52. Carroll S, Dudfield M. What is the relationship between exercise and metabolic abnormalities?: A review of the metabolic syndrome. Sports Med. 2004;34(6):371-418. https://doi.org/10.2165/00007256-200434060-00004 [ Links ]
53. Ekelund U, Anderssen SA, Froberg K, Sardinha LB, Andersen LB, Brage S, et al. Independent associations of physical activity and cardiorespiratory fitness with metabolic risk factors in children: The European youth heart study. Diabetologia. 2007;50(9):1832-1840. https://doi.org/10.1007/s00125-007-0762-5 [ Links ]
 Correspondence:
Patricia Arnaiz
Email: patricia.arnaiz@unibas.ch
Received: 24 Jan. 2023
Revised: 02 July 2023
Accepted: 03 July 2023
Published: 28 Sep. 2023
Editor: Pascal Bessong
Funding: Novartis Foundation, Swiss National Science Foundation (grant no. 192651)

