


Services on Demand
Article
 English (pdf)
 Article in xml format
 Article references
Indicators

Related links
-
 Cited by Google
 -
 Similars in Google
Share

 Permalink
South African Journal of Science
On-line version ISSN 1996-7489
Print version ISSN 0038-2353
S. Afr. j. sci. vol.119 n.9-10 Pretoria Sep./Oct. 2023
http://dx.doi.org/10.17159/sajs.2023/16602
COMMENTARY
The impact of the increasing residential battery backup systems on load shedding
Michael J. RitchieI; Jacobus A.A. EngelbrechtI; Marthinus J. BooysenI, II
IDepartment of Electrical and Electronic Engineering, Stellenbosch University, Stellenbosch, South Africa
IIDepartment of Industrial Engineering, Stellenbosch University, Stellenbosch, South Africa
ABSTRACT
SIGNIFICANCE:
Load shedding has become the norm in South Africa. These rolling blackouts currently range from Stage 1 to Stage 6. Households are disempowered for 2-4 hours and for an average of 1.5-9 hours per day. In financially unequal South Africa, heavy users can afford battery backup solutions to keep the lights on. However, installing these at scale, without solar generation, eventually neuters the utility's ability to stabilise the grid and avert a blackout with shedding. Here we assess and quantify the impact of these interventions using an electricity data set of 12 000 households.
Keywords: load shedding, battery backups, charging rate, inverter penetration level
Background
The lack of energy security in South Africa has resulted in the occurrence of rolling blackouts for, as of 2023, 15 years. This is due to the unreliability of Eskom, the country's main supplier of electricity to the grid, to prevent the energy crisis caused by a lack of supply from its fleet of coal-fuelled power stations. Some of the most fundamental factors that have led to the current state of electricity generation are the lack of investment in new generation capacity since 1998, a revenue shortfall from not having permittance for cost-reflective tariffs, a backlog of older Eskom plants, mismanagement, and operating at a higher-than-benchmarked energy utilisation factor.1,2 More information regarding the rolling blackout and Eskom's energy crisis can be found in Styan3.
If the power demand exceeds supply, the generators struggle to keep up and may be required to be disconnected, resulting in a further deficit of supply and increasing the risk of grid collapse and a total blackout for an extended period of potentially 2 weeks.
There are two solutions to the problem: demand management and increased supply. While the latter is time-consuming and capital-intensive, planned power cuts, termed load shedding, are the preferred option to reduce demand. Each stage of load shedding reduces the total energy demand by 1 Gigawatt (GW).2
The installation of home power backup systems, i.e. inverters and batteries or generators, is an increasingly popular solution to reduce the impact of power cuts for South African users. Domestic users tend to install hybrid inverters with batteries to keep the lights on during load shedding. Although a lithium battery with a capacity of 5 kWh can theoretically supply 5 kW for an hour, reducing the state of charge below 20% diminishes its capacity and causes it to age faster. Solar panels can augment the electricity supply by generating electricity directly to the household and storing excess energy in batteries, while exporting excess electricity to the grid, if the installation allows it.
Because of the additional cost of solar supply and getting approval for it, many users may opt to install only battery backups and inverters. However, installing inverters without solar panels increases the load on Eskom, outside of loadshedding periods, as the batteries charge when power from the grid is restored. This counteracts the utility's (Eskom's) attempt to manage the grid's stability through the demand management technique of load shedding.4
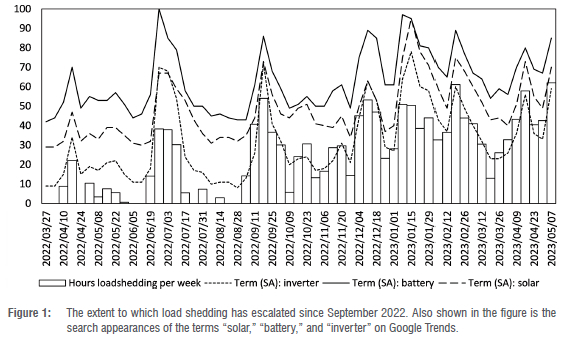
Increasingly, those who can afford to do so will revert to power backup solutions. Figure 1 shows the extent to which load shedding has escalated since September 2022. Also shown in the figure is the search appearances of the terms "solar," "battery," and "inverter" on Google Trends. Moreover, searching the term "solar" occurred significantly less than that for "battery" and "inverter," suggesting that a large portion of users consider inverter installations without solar panels.
Inverter prices are decreasing as the market grows, and can predominantly be purchased with a 3 kW, 5 kW or 10 kW power rating. Using a 5 kW inverter as an example, the inverter cost is typically ZAR35 000 and the lithium battery cost is approximately ZAR25 000. Solar panels tend to range from ZAR8000 to ZAR10 000 per kWp (which also pays for the system over time). A certified electrician is required to install the inverter, with installation costs of between ZAR10 000 and ZAR20 000.4 This amounts to an estimated total of ZAR120 000. The consequence is that many people may opt to install a backup solution without installing a solar power supplement.
In this Commentary, we explore the extent to which penetration of such solar-free backup solutions restricts Eskom's ability to use load shedding to manage grid stability.
Experimental setup
To answer this question, we present a simulation of a large group of residential households in South Africa to determine the aggregated electricity usage. We evaluate the impact of load shedding on the grid and the effect of users installing inverters.
Source data
The household electricity usage data consists of hourly measured time-series data with a resolution of 0.5 A for 12 000 households measured between 1994 and 2014 and spanning at least one year.5 Each sample is calculated as the average current used during that hour, measured in amps, for the given household. We determine the electricity used for each hour, measured in kilowatt-hours, by assuming a constant operating voltage. The data set may include small businesses, but the proportion of small businesses is estimated to be less than 6% of the data set6, and small businesses are also likely to install inverters to keep the lights on.
The databases, the model and the simulator code are available at https://bit.ly/loadsheddingmodel.
System design and limitations
Here we discuss how load shedding can be mitigated by inverters and batteries, followed by the limitations of the aforementioned components.
Emulating load shedding
We used two 1-week electricity usage profiles (1 week for summer and 1 week for winter) for 12 000 residential households to obtain the results. The data are presented with hourly time steps but are simulated by the minute to accurately capture loads and battery charging behaviour. The households are separated into 20 groups, each with its own unique load shedding schedule. After each load shedding period, the inverters begin to charge for households belonging to the group whose power has just returned. The duration of load shedding is 2 hours and load shedding begins for each consecutive group in 1-hour periods, resulting in an overlap of load shedding across two groups. An example of the load shedding schedule is represented as follows:
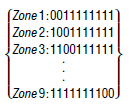
where 1 and 0 refer to an hour slot where power is available and unavailable, respectively.
Emulating inverters and batteries
Inverters with various battery sizes and charging rates are distributed to users whose level of usage is above the penetration threshold, i.e. a penetration level of 15% indicates that inverters are assigned to users within the top 15% usage levels. The inverters are assigned to these users based on their usage intensity, as follows:
1. The top 25% of these users are assigned 10 kWh batteries with a 5 kW charge rate.
2. The middle 50% of these users are assigned 5 kWh batteries with a 2.5 kW charge rate.
3. The bottom 25% of these users are assigned 3 kWh batteries with a 1.5 kW charge rate.
Inverter and battery limitations
The following limitations are applied during load shedding:
1. If the household is drawing more than the inverter capacity, we ignore the household's load that exceeds the inverter rate (the household can use only as much as the inverter allows). We, therefore, assume that a household would adapt its usage to utilise the inverter capability to close its capacity. Admittedly, this is a crude assumption, which could be refined in future work.
2. If the battery's state of charge is reduced to or below 20%, the battery will stop providing power and the household load is zero.
The following limitations are applied after load shedding:
1. The battery's charge rate exponentially decreases when its state of charge is above 85%.
Simulation setup
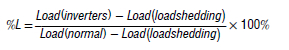
We simulate the electricity usage for all of the households and determine the aggregated load across all 7 days of the week. The data are separated into seasons to compare the effect of seasonality. We determine a measure of how much of the intended load shedding stage the inverters and batteries have curtailed, which is calculated as follows:
Results
Figure 2 shows the normalised (per household) grid daily energy usage for 12 000 households for (a) summer and (b) winter. The total mean usage for summer and winter is 11.2 kWh and 13.9 kWh, respectively. The upper extremity (dashed line) profile is significantly higher than the interquartile range and indicates that the top 25% of households, which will also be the ones that opt to install the battery backup solutions, have a substantially larger level of usage.
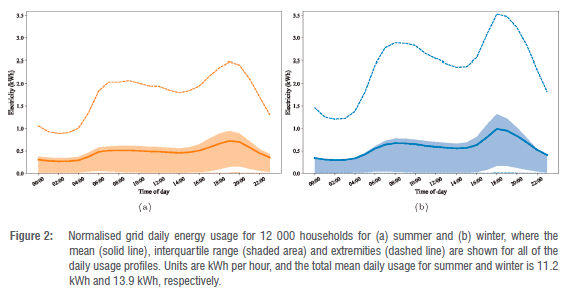
Figure 3a shows a box plot of the overall usage for the summer and winter weeks per household. As seen from the previous figure, there is a large usage bias that is observed in the top 25% of households. Figure 3b shows a bar graph of the distribution of 3 kWh, 5 kWh and 10 kWh inverters to households with a usage level above a penetration level of 25%.
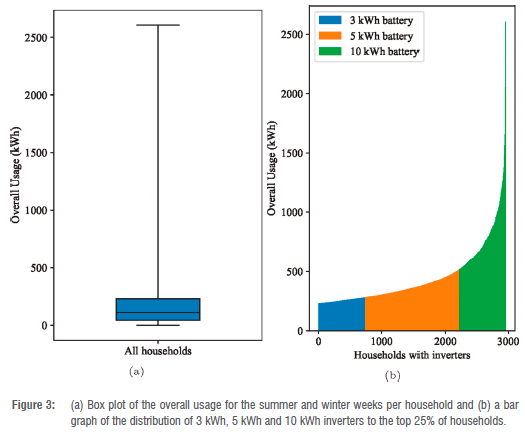
Figure 4 shows a plot of Loadnormal in blue, Loadloadshedding in orange, and Loadinverters in green of all of the 20 zones for a Monday in (a) summer and (b) winter. The results are shown for a penetration level of 15%.

As expected, the impact of implementing a notional two stages (10%) of load shedding decreases the overall electricity usage by 10% of the normal load, as shown by the orange usage profile. However, the installation of inverters increases the amount of energy demand on the grid and negates the impact of load shedding, as shown by the green usage profile. This is caused by the fact that when the power is returned for a zone that just experienced load shedding, all the inverters will begin to charge at the same time, which, consequently, pulls additional electricity from the grid. Most importantly, a peak is formed at the start of the charging period. With a 15% penetration level, the load peak is closely matched to the normal load, meaning that load shedding is negated. This peak can range from matching the load shedding load to surpassing the normal load by adjusting the inverter penetration level and varying the charging rate.
Figure 5 shows a bar graph of %L for a penetration level of 2.5%, 5%, 10%, 15%, 20% and 25% for (a,b) summer and (c,d) winter. Moreover, the contribution of the results for the three battery sizes is indicated. Figure 5a and Figure 5c show the results for the overall daily usage profile, and Figure 5b and Figure 5d show the results obtained during only the peak hours of the day, i.e. between 18:00 and 20:00.
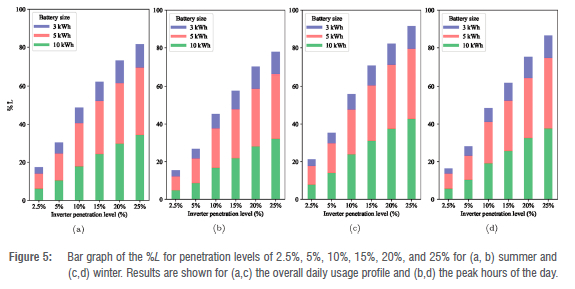
By comparing the results of Loadinverters for the various penetration levels, we see that battery charging can undo approximately 85% and 90% of load shedding in summer and winter, respectively, at a PV-free inverter penetration level of 25%. Even with a penetration level of 15%, these values are still as high as approximately 70%.
Conclusion and recommendations
Electricity has become an essential component of modern society, and load shedding, which causes interruptions in power supply, has a significant impact on individuals and communities. The electricity grid connects people across multiple divides and affects all members of society to varying degrees.
Given the impact of load shedding on everyday life, many of those who can afford it, are opting to install battery backup solutions with inverters. Those who can afford to do so also happen to be the more affluent, who also tend to be the heaviest electricity users. However, given the additional cost and effort of augmenting a battery backup solution with solar power, many may be opting to not install additional generation capacity. The tax refunds announced in the 2023/2024 financial year may not mitigate this effect.
We assessed the impact of domestic users installing battery backup solutions without solar and evaluated the impact of doing so for different penetration levels of such systems into the domestic market. The results show that with a mere 15% penetration, the intended effect of load shedding will be curtailed by just over 60% in summer and just over 70% in winter when considering the whole day's curtailment.
We conclude that the impact of allowing users to charge at 0.5 C (half the battery capacity equivalent), without solar augmentation, will have a dramatic impact on the domestic load, even with only 15% penetration. It is therefore imperative that charging batteries from the grid is restricted to protect the potency of load shedding as a grid-balancing tool. The default charge rate on inverters can be as high as 1 C (e.g. 5 kW for a 5 kWh battery). We recommend that the charging rate of battery backup solutions is restricted to 0.15 C (for example 0.75 kW for a 5 kWh battery) to prevent the high curtailment after a zone is switched on. This lower charge rate should be ample to recharge the battery between bouts of load shedding.
Data availability
The model and synthesiser source code and data are available at: https://bit.ly/loadsheddingmodel.
Competing interests
We have no competing interests to declare.
Acknowledgements
We thank MTN South Africa for their financial support, and EskomSePush for making the load shedding data publicly available.
References
1. Van Diemen E. Eskom in the dock: 25 years in the making - the real reasons we have rolling blackouts according to de Ruyter. Daily Maverick. 2023 February 26. Available from: https://www.dailymaverick.co.za/article/2023-02-26-25-years-in-the-making-the-real-reasons-we-have-rolling-blackouts-according-to-de-ruyter/ [ Links ]
2. Booysen MJ, Rix AJ. South Africa's power grid is under pressure: The how and the why. The Conversation. 2021 November 02. Available from: https://theconversation.com/south-africas-power-grid-is-under-pressure-the-how-and-the-why-170897 [ Links ]
3. Styan JB. Blackout: The Eskom crisis. Johannesburg: Jonathan Ball; 2015. [ Links ]
4. Booysen MJ, Rix AJ. Home power backup systems - electrical engineers answer your questions. The Conversation. 2023 February 17. Available from: https://theconversation.com/home-power-backup-systems-electrical-engineers-answer-your-questions-199808 [ Links ]
5. Toussaint W. Domestic electrical load metering, hourly data 1994-2014. [data set on the Internet]. c2019 [updated 2020 Apr 15; cited 2023 Apr 24]. Available from: https://www.datafirst.uct.ac.za/dataportal/index.php/catalog/759 [ Links ]
6. Avenant J. Residential load modelling to predict household consumption for design of photovoltaic systems [Meng thesis]. Stellenbosch: Stellenbosch University; 2022. http://hdl.handle.ne1/10019.1/126052 [ Links ]
 Correspondence:
MJ Booysen
Email: mjbooysen@sun.ac.za
Published: 31 August 2023

