


Serviços Personalizados
Artigo
 Inglês (pdf)
 Artigo em XML
 Referências do artigo
Indicadores

Links relacionados
-
 Citado por Google
 -
 Similares em Google
Compartilhar

 Permalink
South African Journal of Science
versão On-line ISSN 1996-7489
versão impressa ISSN 0038-2353
S. Afr. j. sci. vol.119 no.7-8 Pretoria Jul./Ago. 2023
http://dx.doi.org/10.17159/sajs.2023/13733
RESEARCH ARTICLE
Future climate change in the Agulhas system and its associated impact on South African rainfall
Houraa Daher; Ben P. Kirtman
Rosenstiel School of Marine and Atmospheric Science, University of Miami, Miami, Florida, USA
ABSTRACT
South African climate variability has been linked to changes in both the Agulhas system and external forcing (i.e. CO2 and ozone). We analysed future climate change in the Agulhas system volume transport and its associated impacts on South Africa's precipitation using the Community Climate System Model version 4 as part of the Coupled Model Intercomparison Project, phase 5. Output from one historical and three future greenhouse gas emission scenarios were examined to project various climate storylines. We found that the Agulhas Current volume transport decreases across all three scenarios and that the current displays a strong baroclinic component with an increase in transport at the surface and decrease at intermediate depths. Agulhas leakage was found to increase with historical emissions. Additionally, an east-west dipole pattern for convective precipitation was found over South Africa, with an increase over the eastern region related to an increase in greenhouse gas emissions and a decrease in the western region linked to the location of Hadley cell edge latitude. Moving into the 21st century, future predictions in regional climate variability are shown to be dependent on the intensity of greenhouse gas emissions and are extremely important for South Africa, a region prone to drought and flooding and home to a large population dependent on rain-fed agriculture.
SIGNIFICANCE:
• Future climate variability in the Agulhas system and South African region is heavily dependent on changes in external forcing.
• The Agulhas Current volume transport decreases as the greenhouse gas emissions continue to increase and a strong baroclinic component is found with an increase in transport at the surface and a decrease at the intermediate depths.
• A strong east-west dipole precipitation pattern is found over South Africa with the increase in the eastern region related to the increase in greenhouse gas emissions and the decrease in the western region related to the location of the Hadley cell edge latitude.
Keywords: Agulhas system, South African rainfall, climate change, CCSM4, CMIP5
Introduction
South Africa is a region prone to precipitation changes with drought and flooding events being a common occurrence.1,2 Understanding the rainfall variability over South Africa is of great interest as Cape Town was one of the first major cities in the world to nearly run out of water in 2018 and because it is home to a significant population that is dependent on rain-fed agriculture. Studies have identified two regions of rainfall over South Africa: eastern and northern South Africa and southwest South Africa. Precipitation over eastern and northern South Africa primarily occurs in summer and precipitation over southwest South Africa occurs in winter.2
The precipitation pattern over eastern and northern South Africa can be explained by tropical cloud bands and associated convection in the region as a result of sea surface temperature (SST) anomalies.3 These warm SST anomalies come from the Agulhas Current which leads to the advection of moist marine air over the region.4-9 The Agulhas Current, located off the eastern coast of South Africa, is the largest western boundary current in the southern hemisphere and provides moisture to the atmospheric boundary layer via latent heat fluxes which are projected to increase significantly over western boundary systems10-14 as the climate system warms. The SST of the Agulhas Current is linked to the El Nino-Southern Oscillation (ENSO), originating in the equatorial eastern Pacific, with El Nino correlated with drier conditions and La Nina with wetter conditions in the eastern and northern region.3,8,15-22
Undergoing a mechanism different from that of the precipitation in the eastern and northern region, the precipitation found over southwestern South Africa is driven by cold fronts associated with mid-latitude cyclones formed in the South Atlantic.2,20,23-26 The precipitation associated with these fronts was found to be linked to the expansion of the Hadley cell edge resulting in a poleward shift of these mid-latitude cyclones and low-pressure systems such that a post-frontal high-pressure system is located above South Africa suppressing the precipitation typically seen over the southwestern region.27 With the poleward shift of the low-pressure belts, the easterly winds increase and the precipitation is expected to decrease as the rain-bearing storms weaken and deflect poleward.28 This behaviour, representative of the ozone depletion period, explains the drought experienced in Cape Town in 2018 and suggests that as ozone recovers, wetter conditions and fewer droughts in the region can be expected.29,30 In addition to the mid-latitude cold fronts, it has been shown that ENSO, sSt anomalies, and Agulhas leakage, the inflow of warm and salty water from the Indian Ocean to the Atlantic Ocean, also have an impact on the local precipitation in this region.2,23,26,31,32
Using the Community Climate System Model version 4 (CCSM4) simulations from the Coupled Model Intercomparison Project phase 5 (CMIP5) experiments33, we investigated future climate change projections in the Agulhas system and regional precipitation variability in South Africa. Agulhas Current and Agulhas leakage transports were calculated and precipitation over South Africa analysed. We compared different emissions scenarios and three different time periods to determine the significance of greenhouse gas and ozone forcing in the region.
Methods
Model and climate scenarios
In this study, we analysed model output from NCAR's CCSM4 coupled climate model.34 The ocean model used was Parallel Ocean Program, version 2 (POP2) at a 1° horizontal resolution with 60 vertical layers. The atmosphere model in CCSM4 is Community Atmosphere Model, version 4 (CAM4) at a 1° horizontal resolution with 26 vertical layers. The monthly mean outputs were considered in this analysis.
The CCSM4 output used are from the CMIP5 archive as CCSM4 was not included in the more recent CMIP6 data. Data from four different forcing scenarios were considered: historical (pre-2006), representative concentration pathway 2.6 (RCP2.6), RCP4.5, and RCP8.5 (20062100). The historical forcing is the 20th-century simulation using a combined anthropogenic and natural forcing.34 RCP2.6 is the extreme mitigation scenario in which emissions peak at 3.0 W/m2 in year 2050 and then decrease to 2.6 W/m2, hence the name RCP2.6. RCP4.5 is the stabilisation scenario in which emissions peak at year 2075 and then remain constant until the end of the century where they are at 4.5 W/m2. And lastly, RCP8.5 is the scenario with the largest emissions, where the forcing increases over time and is still increasing as it reaches 8.5 W/m2 by 2100. Following Barnes et al.35, three different RCP scenarios were considered to allow future climate predictions across a range of possible emission scenarios.
Continuing to follow Barnes et al.35, the data were split into three time periods: ozone depletion (OD), ozone recovery (OR), and post-ozone recovery (POR). The OD period (1970-2005) is mainly driven by the depletion of the ozone and the increase in greenhouse gas (GHG) emissions. The results from this period will be the same across all three RCPs as data from the historical run are used (i.e. observed estimates of atmospheric gas concentrations). In the OR period (2006-2045), the ozone begins to recover and the GHGs continue to increase, therefore the ozone and GHG forces will start to oppose each other. The changes that are seen during the OD period can be expected to weaken or reverse in the OR period. Lastly, the POR period (2046-2100) will have a recovered ozone, and varying GHG emissions and results from this period are largely driven by GHG emissions. For the RCP2.6 scenario, the ozone recovery is expected to continue to dominate as the GHG emissions decrease resulting in trends similar to those of the OR period. As the emissions increase slightly in RCP4.5, however, the ozone and GHG emissions will offset and trends similar to those of both the OD and OR periods can be expected. For RCP8.5, the final scenario, the emissions are highest and the increase in GHGs will dominate the ozone recovery and trends can be expected to return to those observed during the OD period.
Lagrangian particle tracking
An offline Lagrangian particle tracking tool called Parcels was used to calculate Agulhas leakage in this study. Lagrangian particle tracking is used to ensure that all Agulhas leakage (filaments and Agulhas Rings) is considered and that water crossing into the Atlantic Ocean originated in the Agulhas Current.36-39 Parcels (Probably a Really Computationally Efficient Lagrangian Simulator), is a Python Lagrangian tracking tool created to track passive and active tracers.40 Parcels uses linear and nearest-neighbour interpolation in time and space and particles are advected using the Runge-Kutta 4 scheme.
A cross-section of particles is released along 34°S, the latitude of the maximum wind stress curl over the South Indian Ocean and therefore the location of maximum Agulhas Current transport. Each particle is assigned a volume transport equal to the initial release velocity multiplied by the grid-cell size. This cross-section of particles is released every month from 1960 to 2100, allowing 10 years of particle circulation before transport estimates are calculated. Although previous studies tend to release more frequently than monthly, Cheng et al.39 found that the temporal resolution of the velocity fields does not have much of an impact on the estimate of Agulhas leakage in CCSM4, with a difference of approximately 1 Sv (1 Sv = 1 χ 106 m3/s) when comparing the daily fields to the monthly mean fields. A particle is considered Agulhas leakage so long as its initial transport is southward, and it has crossed the GoodHope line an odd number of times. Following previous studies36,37,39,41,42, the GoodHope line, a hydrographic section separating the Indian Ocean from the Atlantic Ocean43, is used as the boundary to determine Agulhas leakage. The 130-year Agulhas leakage time series is calculated by summing the volume transport of the leakage particles at their time of final crossing of the GoodHope line.
In order to build on the South African precipitation analysis and Lagrangian experiments found in Cheng et al.32,39, in this study we also used CCSM4 for consistency despite it underperforming compared to some of the other CMIP5 models. Cheng et al.32,39, however, used data from the 20th century only, and did not run any future climate analysis. Additionally, the emissions in Cheng et al.32 were kept constant, and in Cheng et al.39, only the historical forcing scenario was used. Cheng et al.39 validated CCSM with satellite and in situ data and found that their results of the Agulhas Current, retroflection, and Agulhas Return Current agreed with what was seen in the AVISO data.
Furthermore, SST and convective precipitation from the CCSM4 historical data used in this study were compared to reanalysis data from 1979 to 2005 (Figure 1). The ORAS5 SST (Figure 1a, 0.25° horizontal resolution re-gridded to 1°) and CCSM4 SST (Figure 1b, 1° resolution) agree with each other in that the strongest temperatures are found over the Agulhas Current as it brings warm water from the equator towards the poles and that there is cooler water found along the western coast of South Africa in the Benguela Current, a region of upwelling. The low resolution of CCSM4, however, does not capture the Agulhas retroflection and Agulhas Return Current that is seen clearly in the reanalysis data. For the convective precipitation, both the ERA5 (Figure 1c, 0.25° horizontal resolution re-gridded to 1°) and CCSM4 (Figure 1d, 1° resolution) data show the strongest precipitation in the eastern region of South Africa. But again, the low resolution of CCSM4 shows a broader, less accurate depiction of South African convective precipitation with the ERA5 data confined more to the east along the coast.
Result analysis
The five-member ensemble mean is shown for each of the CMIP5 forcing scenarios, removing some of the interannual variability. Results are shown for the austral summer, December-February (DJF), where the largest changes are seen due to the lagged response of the SON stratospheric ozone signal to reach the lower troposphere.29,44 All time series were smoothed using a 10-year moving average filter with a time step of one year as in Barnes et al.35 The difference in the trends of the unsmoothed and smoothed time series is insignificant. And lastly, all trends and linear regression maps were calculated using linear leastsquares regression with all significant results shown within the 95% confidence interval.
Results and discussion
Agulhas Current and Agulhas leakage
The Agulhas Current volume transport is calculated across 34°S and a mean volume transport of 65 Sv is found for the ozone depletion period compared to the observed transport of 77 Sv45, a reasonable transport estimate for a low-resolution model that does not capture the mesoscale features of the current. The Agulhas Current volume transport is found to be decreasing through time across all three RCPs (Figure 2a) with a 5 Sv decrease in RCP2.6 and 10 Sv decrease in RCP8.5. Although the transport saturates near 2050, right after the POR period begins, with all three RCPs converging on similar transport values, the downward trend continues to the end of the century in RCP8.5 (Figure 2a, red line). In RCP2.6, however, the transport begins to increase at the tail end of the century (Figure 2a, blue line), demonstrating a slight lag in the response of the ocean to the decrease in emissions in the atmosphere.
The vertical structure of the Agulhas Current is found to have a baroclinic component in the water column (Figure 3), with a speed up found at the surface in the upper layer (> 500 m) and a slowdown at intermediate depths (500-1500 m). For the ozone recovery minus ozone depletion (GR-OD) period, there is not much difference between the three RCPs (Figure 3a-c) with a slight intensification found in the core of the current in the upper 100 m and a weakening seen throughout the rest of the water column resulting in the overall decrease in volume transport. In POR-OR, however, the vertical structure is different across all RCPs with RCP2.6 showing an increase in transport in the upper 500 m (Figure 3d), likely leading to the increase in transport seen at the end of the century (Figure 2a, blue line), and RCP8.5 showing a strong decrease in poleward transport at the intermediate depths (Figure 3f), resulting in the decrease in transport observed (Figure 2a, red line). The baroclinicity found in the Agulhas Current is similar to that found in the Kuroshio Current by Chen et al.46, who used the historical and RCP4.5 simulations of CMIP5. Chen et al.46 discuss that the baroclinicity found may be a result of the stronger stratification and downward heat mixing47 within the vertical water column that leads to a weakening of the subtropical gyre in the lower thermocline47,48 and therefore a slowdown at greater depths.
The Agulhas leakage volume transport was calculated across all three RCPs (Figure 2b) following the method explained above. A mean transport of 36 Sv was found for the ozone depletion period - a better estimate than the 43 Sv calculated using the same low-resolution model with identical historical forcing38 and 15 Sv more than the observed transport of 21 Sv.49 During the ozone depletion period, there is a clear increase in Agulhas leakage transport over time (Figure 2b), in agreement with previous literature showing an increase in Agulhas leakage transport with anthropogenic climate change.36,50 After the ozone depletion period, however, there is a strong weakening of the trend seen across all three RCPs through the end of the century, with little overall change in transport and with only RCP8.5 showing significant changes in leakage as a result of the extreme increase in emissions. Similar to that seen in the Agulhas Current transports, there is a convergence in leakage transport found near 2050, just as the changes in emissions begin to vary the most across the three RCPs. The Agulhas leakage transport trends are noticeably noisier compared to the Agulhas Current transports (Figure 2a), which were found to be more robust according to the significance test.
Correlation coefficients between the Agulhas Current and Agulhas leakage transport were found to be significant, with values of -0.76, -0.78, and -0.75 for RCP2.6, RCP4.5, and RCP8.5, respectively. This relationship is compared to the results from Van Sebille et al.37, who used a high-resolution ocean model, and therefore found lower, more accurate values of Agulhas leakage and a correlation coefficient of -0.67. The Agulhas Current and Agulhas leakage are inversely related with a decrease (increase) in Agulhas Current associated with an increase (decrease) in Agulhas leakage. Looking at the volume transport from the ozone depletion period only, a correlation coefficient of -0.92 is found, showing a robust relationship for this period.
South Africa precipitation
A clear east-west dipole pattern of convective precipitation is found in both the OR-OD and POR-OR maps (Figure 4). Similar to the vertical structure of the Agulhas Current (Figure 3), there is not much difference across the three RCPs for convective precipitation in the OR-OD maps (Figure 4a-c) with an increase (decrease) of approximately a quarter of a millimetre per day over the eastern (western) region of South Africa. The results for POR-OR (Figure 4d-f), however, vary for each RCP scenario, highlighting the importance of the different emission levels. In RCP2.6 (Figure 4d), there is little change in convective precipitation seen in both the eastern and western regions of South Africa. RCP4.5 (Figure 4e) shows an increase of about half a millimetre per day in the eastern region and not much change in the western region. Lastly, RCP8.5 (Figure 4f) shows the most drastic change in convective precipitation in the two regions, with nearly an increase of one millimetre per day in the eastern region, roughly four times the rate seen in OR-OD (Figure 4c), and a decrease of almost half a millimetre per day in the western region, nearly double the amount of OR-OD (Figure 4c).
The total convective precipitation was calculated over the eastern (Figure 4a, blue-green box) and western (Figure 4a, brown box) regions and, overall, it is clear that there is more precipitation over eastern South Africa than western South Africa per day (Figure 5). The convective precipitation rates for the eastern box (EB) are seen to be increasing throughout all three periods (Figure 5; EB curves) with similar values of precipitation observed for all three RCPs until 2050. Then the largest and significant increase is seen during the POR period for RCP8.5 (Figure 5; red line), suggesting once more that the increased emissions in this RCP have a significant impact on regional precipitation in South Africa, whereas with the recovery of the ozone and the stabilisation of GHGs, trends in RCP2.6 and RCP4.5 weaken (Figure 5; blue and green lines). Opposite and weaker trends can be found in the western box (Figure 5; WB curves) with a decrease in convective precipitation seen throughout most of the century with the exception of RCP2.6 in the POR period (Figure 5; blue line) where an increase in precipitation can be found towards the tail end of the century, likely correlating with an equatorward shift of the Hadley cell and storm tracks. The largest decrease is seen in RCP8.5 (Figure 5; red line), especially in the last 20 years of the century as the emissions continue to increase and cause a poleward expansion of the Hadley cell and frontal systems. Additionally, RCP8.5 is the only one of the RCPs to show a significant trend after the historical period ends.
As discussed previously, the convective precipitation over eastern South Africa is known to exhibit a strong correlation with warm SSTs in the Agulhas Current. This relationship likely explains the increased precipitation found over eastern South Africa, especially during the POR period in RCP8.5 when emission levels are highest. The convective precipitation over western South Africa, however, is related to the location of the Hadley cell edge. Additionally, the east-west dipole precipitation pattern found over South Africa is associated with the increase in easterly winds linked to the poleward shift of the frontal systems.
SST and moisture flux
A clear relationship was found between SSTs in the Agulhas system and the moisture advected over eastern South Africa (Figure 6). Consistent with the previous maps, there is not much difference observed in SST and moisture flux (u*q and v*q) for the OR-OD period (Figure 6a-c) as there is very little change in emissions. Throughout the Agulhas system there is warming of 1 °C and moisture is advected downstream of the Agulhas Current and over the Agulhas bank and leakage corridor, forming a cyclonic low-pressure system over South Africa. This loss of heat from the ocean to the atmospheric boundary layer and cyclonic system results in the increase in convective precipitation observed in eastern South Africa (Figure 4a-c) and is consistent with findings in previous studies.4-9 For RCP2.6 (Figure 4d) in the POR-OR period, however, there is almost no change in sSt or moisture flux with there being very weak cyclonic motion as the emissions decrease. RCP4.5 (Figure 4e) shows a result similar to what was seen during the OR-OD period with the emissions stabilising and remaining constant. RCP8.5 (Figure 6f), with the greatest increase in emissions, shows the most extreme response in both SSTs and moisture flux. There is a continued increase in SSTs of nearly 2 °C everywhere and a significant increase in the moisture flux strength resulting in a large air-sea heat/moisture exchange. Therefore the formation of the intense cyclonic low-pressure system observed leads to a considerable increase in convective precipitation (Figure 4f).
Hadley cell
The latitude of the Hadley cell edge and storm tracks plays a large role in precipitation over western South Africa, with a poleward shift associated with a decrease in precipitation and an equatorward shift linked to an increased rate. The location of the Hadley cell is controlled by both the ozone and GHGs with ozone depletion and an increase in GHGs contributing to the poleward shift and ozone recovery and decrease of GHGs resulting in an equatorward shift. Following previous studies, the Hadley cell edge is defined as the latitude of the zonal mean of the meridional mass stream function where the stream function is equal to zero at 500 hPa.51-56 The meridional mass stream function, ψ, is calculated by:
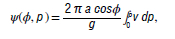
where φ is the latitude, p is pressure, a is the radius of the earth, g is the gravitational acceleration, and v is the meridional wind.
During the OD period, there is a significant poleward expansion of the Hadley cell edge of roughly 1° (Figure 7a, black line). This trend is weakened across all three RCP scenarios as the ozone recovers, with an equatorward shift shown in RCP2.6 that continues into the POR period (Figure 7a, blue line). Similar to previous results, after the mid-century, there is a sharp increase in the equatorward trend for RCP2.6 that is followed by a stabilisation over the last few decades of the century, resulting in little change in the position of the Hadley cell edge. This trend matches that seen for the convective precipitation in the western box for RCP2.6. With the equatorward shift of the Hadley cell edge and the return of mid-latitude cyclones and cold fronts, there is an increase in the associated precipitation in this region. RCP4.5 also shows very little change in the latitudinal position of the Hadley cell edge during this period, indicating once more that the ozone and GHG forcing cancel each other out in this scenario (Figure 7a, green line), in agreement with the western box precipitation for RCP4.5. Lastly, there is a poleward expansion of the Hadley cell edge for RCP8.5 that continues through the end of the century (Figure 7a, red line). Overall, a 2° poleward expansion of the Hadley cell edge is discovered in the RCP8.5 scenario with half of that expansion occurring in the first 35 years during the OD period.
The poleward shift of the Hadley cell edge and high-pressure systems is linked to a suppression of precipitation over western South Africa and the decrease in convective precipitation found. The different trends seen during the POR period across each RCP scenario for the Hadley cell edge latitude were found to be significant and continue to highlight the importance of the different emissions scenarios.
The overall strength and expansion of the Hadley cell varies with each emission scenario(Figure 7b,c). The difference between the late era (2080-2100) and early era (1970-1990) of the meridional mass stream function at all levels in the atmosphere is shown in Figure 7. These periods were selected to show the extreme changes found in the Hadley cell circulation. There is very little difference found in the Hadley cell strength in RCP2.6 (Figure 7b). RCP4.5 (Figure 7c) shows a slight increase and expansion in the overturning circulation, but the greatest change is seen in RCP8.5 once again. There is an increase in the Hadley cell strength in RCP8.5 (Figure 7d) of over three times the circulation seen in the other RCP scenarios, as well as an overall expansion of the cell observed. Previous studies have shown that these patterns typical accompany the poleward shift in Hadley cell edge as the climate warms51-56, with the expansion caused by an increase in the subtropical static stability which pushes the baroclinic instability zone and frontal systems poleward, therefore leading to the formation of high-pressure systems and less precipitation over western South Africa.27,52
Conclusions
Three different emission scenarios (RCP2.6, RCP4.5, and RCP8.5) were examined to understand the influence of varying GHG emissions in future climate prediction. The data were split into three different periods: ozone depletion (1970-2005), ozone recovery (2006-2045), and post-ozone recovery (2046-2100).
Both the Agulhas Current and Agulhas leakage volume transports were calculated as they have been shown to be linked to precipitation changes over South Africa. The Agulhas Current was found to decrease with time across all three RCPs, with the most change seen in RCP8.5. A baroclinic component was seen with a speed up in the upper layer and slowdown in the intermediate layer, resulting in an overall decrease in volume transport. The Agulhas leakage volume transport did not show a clear trend throughout time, but rather a strong increase in the ozone depletion period followed by a stabilisation of transport through the end of the century. The increase in the ozone depletion period is associated with anthropogenic climate change.
An increase in convective precipitation was found over the eastern region of South Africa across all RCPs with a significant increase during the post-ozone recovery period of RCP8.5. The precipitation in this region is linked to the warm SSTs in the Agulhas Current and the cyclonic motion found over South Africa, hence the strong trend found during the post-ozone recovery period for RCP8.5 when there is the greatest increase in temperature in the current and loss of heat to the atmosphere, leading to strong moist air being advected over land. The opposite pattern was seen over western South Africa with a decrease in convective precipitation. The precipitation in the western region is related to the position of the Hadley cell, indicating that the external forcing is the main driver behind this change. In RCP2.6, during the post-ozone recovery period, there was an increase in precipitation over the western region likely due to the ozone recovery causing an equatorward shift of the Hadley cell edge and a decrease seen during RCP8.5 due to the poleward shift and strengthening of meridional circulation caused by increased GHGs.
To summarise, when the GHG emissions are not increasing at an alarming rate (RCP2.6), it is found that the ozone recovery dictates the climate response in the Agulhas system and South Africa. But when the GHGs are increasing significantly throughout the 21st century (RCP8.5), the ozone recovery signal is overpowered by the GHG forcing and trends similar to those of the ozone depletion period are witnessed. Future climate change prediction in the Agulhas system and South Africa precipitation will be heavily dependent on the severity of the GHG emission levels moving forward.
Acknowledgements
All CCSM4 data from the CMIP5 archive can be accessed via the Climate Data Gateway at NCAR (https://www.earthsystemgrid.org/). We acknowledge the support from the National Oceanic and Atmospheric Administration (NA18OAR4310293, NA15OAR4320064), the National Science Foundation (OCE1419569, OCE1559151), and the Department of Energy (DE-SC0019433). B.PK. is the William R. Middelthon Chair of Earth Sciences and is grateful for the associated support.
Competing interests
We have no competing interests to declare.
Authors' contributions
H.D.: Conceptualisation, methodology, data collection, data analysis, validation, writing - the initial draft. B.pK.: Conceptualisation, methodology, writing - revisions, student supervision, funding acquisition.
References
1. Reason CJ, Allan RJ, Lindesay JA, Ansell TJ. ENSO and climatic signals across the Indian Ocean basin in the global context: Part I, Interannual composite patterns. Int J Climatol. 2000;20(11):1285-1327. https://doi.org/10.1002/1097-0088(200009)20:11<1285::AID-JOC536>3.0.CO;2-R [ Links ]
2. Reason CJ, Rouault M, Melice JL, Jagadheesha D. Interannual winter rainfall variability in SW South Africa and large scale ocean-atmosphere interactions. Meteorol Atmos Phys. 2002;80(1):19-29. https://doi.org/10.1007/s007030200011 [ Links ]
3. Reason CJ, Rouault M. ENSO-like decadal variability and South African rainfall. Geophys Res Lett. 2002;29(13):16-1-16-4. https://doi.org/10.1029/2002GL014663 [ Links ]
4. Reason CJ. Evidence for the influence of the Agulhas current on regional atmospheric circulation patterns. J Clim. 2001;14(12):2769-2778. https://doi.org/10.1175/1520-0442(2001)014<2769:EFTIOT>2.0.CO;2 [ Links ]
5. Reason CJ. Subtropical Indian Ocean SST dipole events and Southern African rainfall. Geophys Res Lett. 2001;28(11):2225-2227. https://doi.org/10.1029/2000GL012735 [ Links ]
6. Rouault M, White SA, Reason CJ, Lutjeharms JR, Jobard I. Ocean-atmosphere interaction in the Agulhas Current region and a South African extreme weather event. Weather Forecast. 2002;17(4):655-669. https://doi.org/10.1175/1520-0434(2002)017<0655:OAIITA>2.0.CO;2 [ Links ]
7. Blamey RC, Reason CJ. Numerical simulation of a mesoscale convective system over the east coast of South Africa. Tellus A: Dyn Meteorol Oceanogr. 2009;61(1):17-34. http://doi.org/10.3402/tellusa.v61i1.15529 [ Links ]
8. Jury MR. Passive suppression of South African rainfall by the Agulhas current. Earth Interact. 2015;19(13):1-4. http://doi.org/10.1175/ei-d-15-0017.1 [ Links ]
9. Nkwinkwa Njouodo AS, Koseki S, Keenlyside N, Rouault M. Atmospheric signature of the Agulhas current. Geophys Res Lett. 2018;45(10):5185-5193. https://doi.org/10.1029/2018GL077042 [ Links ]
10. Jury M, Walker N. Marine boundary layer modification across the edge of the Agulhas current. J Geophys Res Oceans. 1988; 93(C1):647-654. https://doi.org/10.1029/JC093iC01p00647 [ Links ]
11. Walker ND, Mey RD. Ocean/atmosphere heat fluxes within the Agulhas retroflection region. J Geophys Res Oceans. 1988; 93(C12):15473-15483. https://doi.org/10.1029/JC093iC12p15473 [ Links ]
12. Walker ND. Links between South African summer rainfall and temperature variability of the Agulhas and Benguela current systems. J Geophys Res Oceans. 1990; 95(C3):3297-3319. https://doi.org/10.1029/JC095iC03p03297 [ Links ]
13. Rouault M, Lee-Thorp AM, Lutjeharms JR. The atmospheric boundary layer above the Agulhas current during alongcurrent winds. J Phys Oceanogr. 2000;30(1):40-50. https://doi.org/10.1175/1520-0485(2000)030<0040:TABLAT>2.0.CO;2 [ Links ]
14. Rouault M, Reason CJ, Lutjeharms JR, Beljaars AC. Underestimation of latent and sensible heat fluxes above the Agulhas current in NCEP and ECMWF analyses. J Clim. 2003;16(4):776-782. https://doi.org/10.1175/1520-0442(2003)016<0776:UOLASH>2.0.CO;2 [ Links ]
15. Lindesay JA. South African rainfall, the Southern Oscillation and a Southern Hemisphere semi-annual cycle. J Climatol. 1988;8(1):17-30. https://doi.org/10.1002/joc.3370080103 [ Links ]
16. Rouault M, Richard Y Spatial extension and intensity of droughts since 1922 in South Africa. Water SA. 2003;29:489-500. http://doi.org/10.4314/wsa.v29i4.5057 [ Links ]
17. Rouault M, Richard Y Intensity and spatial extent of droughts in Southern Africa. Geophys Res Lett. 2005;32(15). https://doi.org/10.1029/2005GL022436 [ Links ]
18. Fauchereau N, Pohl B, Reason CJ, Rouault M, Richard Y Recurrent daily OLR patterns in the Southern Africa/Southwest Indian Ocean region, implications for South African rainfall and teleconnections. Clim Dyn. 2009;32(4):575-591. https://doi.org/10.1007/s00382-008-0426-2 [ Links ]
19. Rouault M, Penven P, Pohl B. Warming in the Agulhas current system since the 1980's. Geophys Res Lett. 2009;36(12). https://doi.org/10.1029/2009GL037987 [ Links ]
20. Rouault M, Pohl B, Penven P. Coastal oceanic climate change and variability from 1982 to 2009 around South Africa. Afr J Mar Sci. 2010;32(2):237-246. https://doi.org/10.2989/1814232X.2010.501563 [ Links ]
21. Hoell A, Funk C, Magadzire T, Zinke J, Husak G. El Nino-Southern Oscillation diversity and Southern Africa teleconnections during austral summer. Clim Dyn. 2015;45(5):1583-1599. https://doi.org/10.1007/s00382-014-2414-z [ Links ]
22. Putrasahan D, Kirtman BP, Beal LM. Modulation of SST interannual variability in the Agulhas leakage region associated with ENSO. J Clim. 2016;29(19):7089-7102. https://doi.org/10.1175/JCLI-D-15-0172.1 [ Links ]
23. Reason CJ, Jagadheesha D. Relationships between South Atlantic SST variability and atmospheric circulation over the South African region during austral winter. J Clim. 2005;18(16):3339-3355. https://doi.org/10.1175/JCLI3474.1 [ Links ]
24. Singleton AT, Reason CJ. Numerical simulations of a severe rainfall event over the Eastern Cape coast of South Africa: Sensitivity to sea surface temperature and topography. Tellus A: Dyn Meteorol Oceanogr. 2006;58(3):335-367. https://doi.org/10.1111/j.1600-0870.2006.00180.x [ Links ]
25. Singleton AT, Reason CJ. Variability in the characteristics of cut-off low pressure systems over subtropical southern Africa. Int J Climatol. 2007;27(3):295-310. https://doi.org/10.1002/joc.1399 [ Links ]
26. Philippon N, Rouault M, Richard Y, Favre A. The influence of ENSO on winter rainfall in South Africa. Int J Climatol. 2012;32(15):2333-2347. https://doi.org/10.1002/joc.3403 [ Links ]
27. Burls NJ, Blamey RC, Cash BA, Swenson ET, Fahad AA, Bopape MJ, et al. The Cape Town "Day Zero" drought and Hadley cell expansion. npj Clim Atmos Sci. 2019;2(1):1-8. https://doi.org/10.1038/s41612-019-0084-6 [ Links ]
28. Jury MR. Marine climate change over the eastern Agulhas Bank of South Africa. Ocean Sci. 2020;16(6):1529-1544. [ Links ]
29. Polvani LM, Waugh DW, Correa GJ, Son SW. Stratospheric ozone depletion: The main driver of twentieth-century atmospheric circulation changes in the Southern Hemisphere. J Clim. 2011;24(3):795-812. https://doi.org/10.1175/2010JCLI3772.1 [ Links ]
30. Thompson DW, Solomon S, Kushner PJ, England MH, Grise KM, Karoly DJ. Signatures of the Antarctic ozone hole in Southern Hemisphere surface climate change. Nat Geosci. 2011;4(11):741-749. https://doi.org/10.1038/ngeo1296 [ Links ]
31. Reason CJ, Rouault M. Links between the Antarctic oscillation and winter rainfall over western South Africa. Geophys Res Lett. 2005;32(7). https://doi.org/10.1029/2005GL022419 [ Links ]
32. Cheng Y Beal LM, Kirtman BP Putrasahan D. Interannual Agulhas leakage variability and its regional climate imprints. J Clim. 2018;31(24):10105-10121. https://doi.org/10.1175/JCLI-D-17-0647.1 [ Links ]
33. Taylor KE, Stouffer RJ, Meehl GA. An overview of CMIP5 and the experiment design. Bull Am Meteorol Soc. 2012;93(4):485-498. https://doi.org/10.1175/BAMS-D-11-00094.1 [ Links ]
34. Gent PR, Danabasoglu G, Donner LJ, Holland MM, Hunke EC, Jayne SR, et al. The community climate system model version 4. J Clim. 2011;24(19):4973-4991. https://doi.org/10.1175/2011JCLI4083.1 [ Links ]
35. Barnes EA, Barnes NW, Polvani LM. Delayed Southern Hemisphere climate change induced by stratospheric ozone recovery, as projected by the CMIP5 models. J Clim. 2014;27(2):852-867. https://doi.org/10.1175/JCLI-D-13-00246.1 [ Links ]
36. Biastoch A, Böning CW, Schwarzkopf FU, Lutjeharms JR. Increase in Agulhas leakage due to poleward shift of Southern Hemisphere westerlies. Nature. 2009;462(7272):495-498. https://doi.org/10.1038/nature08519 [ Links ]
37. Van Sebille E, Biastoch A, Van Leeuwen PJ, De Ruijter WP. A weaker Agulhas current leads to more Agulhas leakage. Geophys Res Lett. 2009;36(3). https://doi.org/10.1029/2008GL036614 [ Links ]
38. Weijer W, Sloyan BM, Maltrud ME, Jeffery N, Hecht MW, Hartin CA, et al. The Southern Ocean and its climate in CCSM4. J Clim. 2012;25(8):2652-2675. https://doi.org/10.1175/JCLI-D-11-00302.1 [ Links ]
39. Cheng Y Putrasahan D, Beal L, Kirtman B. Quantifying Agulhas leakage in a high-resolution climate model. J Clim. 2016;29(19):6881-6892. https://doi.org/10.1175/JCLI-D-15-0568.1 [ Links ]
40. Lange M, Van Sebille E. Parcels v0. 9: Prototyping a Lagrangian ocean analysis framework for the petascale age. Geosci Model Dev. 2017;10(11):4175-4186. https://doi.org/10.5194/gmd-10-4175-2017 [ Links ]
41. Van Sebille E, Barron CN, Biastoch A, Van Leeuwen PJ, Vossepoel FC, De Ruijter WPP Relating Agulhas leakage to the Agulhas current retroflection location. Ocean Sci. 2009;5(4):511-521. https://doi.org/10.5194/os-5-511-2009 [ Links ]
42. Ragoasha N, Herbette S, Cambon G, Veitch J, Reason C, Roy C. Lagrangian pathways in the Southern Benguela upwelling system. J Mar Syst. 2019;195:50-66. https://doi.org/10.1016/j.jmarsys.2019.03.008 [ Links ]
43. Ansorge IJ, Speich S, Lutjeharms JR, Goni GJ, Rautenbach CD, Froneman PW, et al. Monitoring the oceanic flow between Africa and Antarctica: Report of the first GoodHope cruise: Research in action. S Afr J Sci. 2005;101(1):29-35. [ Links ]
44. Thompson DW, Solomon S. Interpretation of recent Southern Hemisphere climate change. Science. 2002;296(5569):895-899. https://doi.org/10.1126/science.1069270 [ Links ]
45. Beal LM, Elipot S, Houk A, Leber GM. Capturing the transport variability of a western boundary jet: Results from the Agulhas current time-series experiment (ACT). J Phys Oceanogr. 2015;45(5):1302-1324. https://doi.org/10.1175/JPO-D-14-0119.1 [ Links ]
46. Chen C, Wang G, Xie SP Liu W. Why does global warming weaken the Gulf Stream but intensify the Kuroshio? J Clim. 2019;32(21):7437-7451. https://doi.org/10.1175/JCLI-D-18-0895.1 [ Links ]
47. Wang G, Xie SPP Huang RX, Chen C. Robust warming pattern of global subtropical oceans and its mechanism. J Clim. 2015;28(21):8574-8584. https://doi.org/10.1175/JCLI-D-14-00809.1 [ Links ]
48. Zhang X, Church JA, Platten SM, Monselesan D. Projection of subtropical gyre circulation and associated sea level changes in the Pacific based on CMIP3 climate models. Clim Dyn. 2014;43(1):131-144. https://doi.org/10.1007/s00382-013-1902-x [ Links ]
49. Daher H, Beal LM, Schwarzkopf FU. A new improved estimation of Agulhas leakage using observations and simulations of Lagrangian floats and drifters. J Geophys Res Oceans. 2020;125(4). https://doi.org/10.1029/2019JC015753 [ Links ]
50. Biastoch A, Böning CW. Anthropogenic impact on Agulhas leakage. Geophys Res Lett. 2013;40(6):1138-1143. https://doi.org/10.1002/grl.50243 [ Links ]
51. Hu Y Fu Q. Observed poleward expansion of the Hadley circulation since 1979. Atmos Chem Phys. 2007;7(19):5229-5236. https://doi.org/10.5194/acp-7-5229-2007 [ Links ]
52. Lu J, Vecchi GA, Reichler T. Expansion of the Hadley cell under global warming. Geophys Res Lett. 2007;34(6). https://doi.org/10.1029/2006GL028443 [ Links ]
53. Johanson CM, Fu Q. Hadley cell widening: Model simulations versus observations. J Clim. 2009;22(10):2713-2725. https://doi.org/10.1175/2008JCLI2620.1 [ Links ]
54. Polvani LM, Previdi M, Deser C. Large cancellation, due to ozone recovery, of future Southern Hemisphere atmospheric circulation trends. Geophys Res Lett. 2011;38(4). https://doi.org/10.1029/2011GL046712 [ Links ]
55. Min SK, Son SW. Multimodel attribution of the Southern Hemisphere Hadley cell widening: Major role of ozone depletion. J Geophys Res Atmos. 2013;118(7):3007-3015. https://doi.org/10.1002/jgrd.50232 [ Links ]
56. Choi J, Son SW, Lu J, Min SK. Further observational evidence of Hadley cell widening in the Southern Hemisphere. Geophys Res Lett. 2014;41(7):2590-2597. https://doi.org/10.1002/2014GL059426 [ Links ]
 Correspondence:
Houraa Daher
Email: Hdaher@rsmas.miami.edu
Received: 06 Apr. 2022
Revised: 10 Mar. 2023
Accepted: 13 Mar. 2023
Published: 08 Aug. 2023
Editors: Jennifer Fitchett, Adriaan van der Walt
Funding: US National Oceanic and Atmospheric Administration (NA18OAR4310293, NA15OAR4320064), US National Science Foundation (OCE1419569, OCE1559151), US Department of Energy (DE-SC0019433)

