


Serviços Personalizados
Artigo
 Inglês (pdf)
 Artigo em XML
 Referências do artigo
Indicadores

Links relacionados
-
 Citado por Google
 -
 Similares em Google
Compartilhar

 Permalink
South African Journal of Science
versão On-line ISSN 1996-7489
versão impressa ISSN 0038-2353
S. Afr. j. sci. vol.119 no.5-6 Pretoria Mai./Jun. 2023
http://dx.doi.org/10.17159/sajs.2023/14727
RESEARCH ARTICLE
Revealing human mobility trends during the SARS-CoV-2 pandemic in Nigeria via a data-driven approach
Weiyu LuoI; Chenfeng XiongI; Jiajun WanII; Ziteng FengI; Olawole AyorindeIII; Natalia BlancoIV, V; Man CharuratIV, V, VI; Vivek NaranbhaiVII, VIII; Christina RileyIX; Anna WintersIX; Fati Murtala-IbrahimIII; Alash'le AbimikuIII, IV, V
IDepartment of Civil and Environmental Engineering, College of Engineering, Villanova University, Philadelphia, Pennsylvania, USA
IICarnegie Mellon University, Pittsburgh, Pennsylvania, USA
IIIinstitute of Human Virology Nigeria (IHVN), Abuja, Nigeria
IVUniversity of Maryland School of Medicine Institute of Human Virology, Baltimore, Maryland, USA
VCenter for International Health Education and Biosecurity, University of Maryland School of Medicine, Baltimore, Maryland, USA
VIDepartment of Epidemiology and Public Health, University of Maryland School of Medicine, Baltimore, Maryland, USA
VIICentre for the AIDS Programme of Research in South Africa (CAPRISA), Nelson R. Mandela School of Medicine, Doris Duke Medical Research Institute, University of KwaZulu-Natal, Durban, South Africa
VIIIHIV Pathogenesis Programme, Nelson R. Mandela School of Medicine, Doris Duke Medical Research Institute, University of KwaZulu-Natal, Durban, South Africa
IXAkros, Lusaka, Zambia
ABSTRACT
We employed emerging smartphone-based location data and produced daily human mobility measurements using Nigeria as an application site. A data-driven analytical framework was developed for rigorously producing such measures using proven location intelligence and data-mining algorithms. Our study demonstrates the framework at the beginning of the SARS-CoV-2 pandemic and successfully quantifies human mobility patterns and trends in response to the unprecedented public health event. Another highlight of the paper is the assessment of the effectiveness of mobility-restricting policies as key lessons learned from the pandemic. We found that travel bans and federal lockdown policies failed to restrict trip-making behaviour, but had a significant impact on distance travelled. This paper contributes a first attempt to quantify daily human travel behaviour, such as trip-making behaviour and travelling distances, and how mobility-restricting policies took effect in sub-Saharan Africa during the pandemic. This study has the potential to enable a wide spectrum of quantitative studies on human mobility and health in sub-Saharan Africa using well-controlled, publicly available large data sets.
SIGNIFICANCE:
• The mobility measurements in this study are new and have filled a major data gap in understanding the change in travel behaviour during the SARS-CoV-2 pandemic in Nigeria. These measurements are derived from high-quality data samples by state-of-the-art data-driven methodologies and could be further adopted by other quantitative research related to human mobility.
• Additionally, this study evaluates the impact of mobility-restricting policies and the heterogeneous effects of socio-economic and socio-demographic factors by a time-dependent random effect model on human mobility. The quantitative model provides a decision-making basis for the Nigerian government to provide travel-related guidance and make decisions in future public health events.
Keywords: SARS-CoV-2, human mobility, trips, policy, Nigeria
Background
The spread of the coronavirus (SARS-CoV-2) in 2020 became an enduring war of global public health. Up until 23 May 2023, over 760 million confirmed cases had accumulated worldwide, claiming almost 6.9 million lives.1,2 Despite the many effective vaccines rolled out to fight such an unprecedented war, more transmissible variants still emerged. A spike of deaths and new infections was still observed in January 2023 in the Western Pacific region.2 For us to better learn from past experiences and recommend the path forward, it is imperative to look back and learn from the ways in which human beings fought this battle, so that we can rethink our strategy for future pandemics.
One key lesson worth evaluating is the effectiveness of non-pharmaceutical interventions (NPIs) such as stay-at-home orders and travel regulations. At the early stage of the pandemic, governments and their citizens adopted such NPIs at different levels globally to contain the spread of the SARS-CoV-2 virus.3-7
Perra8 conducted a thorough review of NPIs during the pandemic and summarised data sets, modelling methods and findings. Researchers have looked into NPIs implemented by several nations, such as the USA, South Korea, China and countries of the European Union, and found them to be quite effective in delaying and containing the spread of disease.9-11
With respect to the travel restriction policy as an NPI, researchers have found it to be particularly useful in the early stages of an outbreak, and specifically when the policy is confined to an area that is considered to be the major source of the virus. Previous studies have proven a positive relationship between human mobility and SARS-CoV-2 cases.12-14 Mobility restrictions may become less effective once the outbreak is more widespread at a later stage.15,16 In terms of data sources, dedicated surveys and passively collected smartphone location data were the most used data sets in NPI-related studies. Different surveys have been conducted to quantify the impacts of NPIs on human activities17,18, social distancing and close contacts19,20, as well as well-being indicators on, for instance, mental health21,22 and health behaviour23,24. These dedicated surveys covered a variety of sample sizes, ranging from 500 to greater than 100 000. Compared with survey data, an emerging data source for estimating the human behavioural response to mobility restrictions and how that was associated with the onset of SARS-CoV-2 was smartphone location data collected passively via mobile devices by location intelligence and measurement platforms.13,14,25-27 Technology advances have led to an increasingly higher penetration of smartphones and the vital roles they play in people's daily lives, making such data a unique, high-resolution and cost-effective source of information on human movement and possible changes in movement without compromising the confidentiality of these data.
Research gaps and motivation
From reports in the literature, it is important to note that most studies have focused on data-rich societies such as the USA, China and European countries.8 Very little research attention has been paid to the rest of the world, and there are limited data sets on this topic. Only two studies on NPIs were found in sub-Saharan Africa.28,29 Evans et al.28 developed a prediction model of SARS-CoV-2 cases in Madagascar. Zandvoort et al.29 studied Nigeria's NPIs with a modified SEIR (Susceptible, Exposed, Infective, and Recovered) model and concluded that physical distancing alone might not have been enough to contain the virus without lockdown. Their paper highlighted the need for reliable data sources on mobility and social distancing. Because of the lack of such data, they could only adopt synthetic contact matrices to model the effect of lockdown and behaviour.
Considering that little scientific evidence is available, sub-Saharan Africa is in need of proper data and research on human activities, mobility and the association of mobility with disease transmission due to the high disease burden that exists in sub-Saharan Africa. Tuberculosis is among the leading causes of death of African citizens.30 Several SARS-CoV-2 variants and the new outbreak of monkeypox were first reported in sub-Saharan Africa.16 An appropriate human mobility measurement process can best supplement studies of the transmission of these diseases and other emerging and re-emerging infections. Crucial research questions need to be answered, such as the speed of the outbreaks, how human movements and gatherings contribute to them, and how effective different lockdown policies were. While conducting dedicated travel surveys on individuals and/or households remains a high-cost approach to understanding people's travel and mobility changes, smartphone penetration rate, which has increased steadily in sub-Saharan countries, makes mobile phone-based data collection an attractive alternative. In 2021, the rate reached 20% in Nigeria and 25% in South Africa.31 These rates make using passively collected location information from smartphone platforms a feasible and promising option to study human mobility in sub-Saharan countries.
Motivated by the need to develop human mobility measurements and models for Africa, we studied mobile device location data and measured individual-level travels based on a data-driven approach. The methodology was adapted from a parallel research effort in the USA in developing US national travel patterns and origin-destination trip matrices.32,33 Two human mobility measurements, i.e. daily average number of trips per person and daily average distance travelled per person, were taken from a filtered high-quality sub-sample using Nigeria as the study area. The study covered the period of 01 January 2θ2θ to 25 April 2020, with the aim of depicting daily human mobility changes at the beginning of the SARS-CoV-2 pandemic. Then, a time-series model of human mobility was developed and estimated to quantify changes in people's travel patterns, and how the pandemic and its associated travel restriction policies affected these patterns. At the time of writing this paper, the team had also started working on mobility data production for South Africa. The study of a two-country statistical comparison is the immediate next step. To our best knowledge, this is the first attempt to use emerging passively collected mobile device location data to measure travel behaviour, such as trip-making behaviour and travelling distances in the sub-Saharan region. This study will fill a critical and long-lasting data gap in transportation and mobility studies. Based on such measurements, we also empirically tested the effectiveness of mobility restriction policies to reach a number of policy implications supported by emerging data evidence.
SARS-CoV-2 in Nigeria and associated human mobility policies
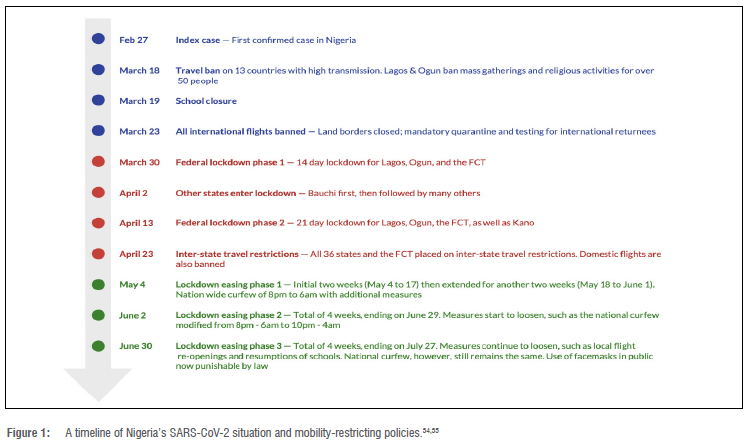
The development of SARS-CoV-2 in Nigeria and its associated public policy decisions in relation to human mobility are summarised in Figure 1.
This study focuses on the beginning of the SARS-CoV-2 pandemic in Nigeria. This initial period can be divided into three stages based on transitions of public policy on human mobility:
• Pre-lockdown Stage34 (indicated in blue in Figure 1): The first confirmed SARS-CoV-2 case was discovered in Ogun State, Nigeria, on 27 February 2020. Travel bans on countries with ongoing high transmissions such as China, Italy and Germany were issued on 18 March, and on the same day, Lagos and Ogun banned mass gatherings and religious activities for more than 50 people. Schools were closed on the subsequent day. On 23 March, in order to prevent disease importation, all international flights were banned and land borders were closed. Mandatory quarantine and testing were required for international returnees.
• Lockdown Stage34,35 (indicated in red in Figure 1): Phase 1 of federal lockdown was issued for Lagos, Ogun and the Federal Capital Territory (FCT) on 30 March 2020. The lockdown was in effect for 2 weeks and included several measures to slow virus transmission (such as workplace closure, the banning of social gatherings and public events, and curfews). These states were selected based on several risk factors, including large numbers of confirmed cases and their high population densities. Starting on 02 April, other states entered lockdown as well. The first was Bauchi, followed by many others. After the 14-day Phase 1 lockdown, another 21-day federal lockdown (Phase 2) was issued for Lagos, Ogun, the FCT and Kano (due to a rapid increase in cases). On 23 April, inter-state travel restrictions were imposed in all states, as well as the FCT , and domestic flights were grounded.
• Lockdown Easing Stage35 (indicated in green in Figure 1): After the two phases of federal lockdown, Nigeria started to loosen its restriction measures through gradual lockdown easing. Phase 1 of lockdown easing commenced on 04 May, which was initially planned for two weeks (until 17 May), but was extended for another two weeks (until 01 June). Lagos and the FCT were included in this first phase of lockdown easing. A national curfew of 20:00 to 06:00 was declared in accordance with the lockdown easing measures. Phase 2 of lockdown easing started on 02 June. It lasted for four weeks and ended on 29 June. Restriction measures loosened, including a shortened national curfew from 22:00 to 04:00, the reopening of banks, and the exemption from inter-state travel restrictions of providers of essential services and manufacturers of produce. Phase 3 of lockdown easing lasted for 4 weeks, commencing on 30 June and ending on 27 July. Restriction measures continued to loosen. These included the re-opening of local flights 'based on close monitoring' and the resumption of schools for certain grades. However, there was no change in the national curfew, and the failure to use face masks in public was still punishable by law until 23 June 2022.36
Data sources and methodology of mobility data analytics and modelling
Data sources
In this study, the primary data source used to measure human mobility was smartphone locations licensed from third-party data providers who supplied opted-in and anonymised mobile device location pins via Global Positioning System (GPS), wireless fidelity (Wi-Fi), Internet Protocol (IP), and Internet of Things (loT) signalling. The raw data panel contained about 62 500 opted-in samples on a daily basis for Nigeria, generating some 2 570 000 sightings (i.e. one location point with a time stamp) daily from 01 January to 25 April 2020. Devices of smartphone operating systems collected the data of anonymised samples of people who had opted in to share their locations. The data collection processes do not collect any personal-identifiable information and employ privacy protection techniques to substantially reduce the risk of reidentification, e.g. aggregate the home and work location to a coarser geographical level.
To facilitate understanding of mobility and changes in mobility before and during the pandemic, supplementary data was collected and digitised in parallel with the smartphone locations. First of all, events and government policies described in the previous section were digitised into dates and dummy variables that were later incorporated into the mobility model. These variables included the announcement of the first SARS-CoV-2 case in Nigeria, the ban on travel and mass gatherings, and the Phase 1 and Phase 2 federal lockdown levels. Also related to the SARS-CoV-2 situation, daily new number of confirmed cases of each state from the Humanitarian Emergency Response in Africa (HERA) was integrated into the model.37
The inherent discrepancy in mobility across different states within Nigeria should also be linked to time-invariant covariates such as population structure, economy and number of facilities. Population-specific information such as age and gender were extracted from United Nation Population Fund data (https://pdp.unfpa.org/). In particular, the percentage of members of the population below 14 years and above 65 years of age were entered into the mobility model. Then, to capture the impact of household and individual income levels on travel, an indicator of general economy was adopted as a proxy. This indicator, the Relative Wealth Index (RWI9), was recently developed to micro-estimate the relative wealth and poverty levels in low- and middle-income countries at a 2.4 km resolution. In this study, the RWI points were spatially joined at county level and the values were averaged. The county-level to statelevel values, weighted by county population, were then aggregated. The percentile of the RWI values of all states were then calculated and ranked. A value of 1 represents the highest-income state and a value of 0 represents the lowest-income state. Lastly, the availability of points of interest would play a crucial role in mobility. Due to a lack of sufficient point-of-interest data records, we were only able to incorporate the number of health facilities as covariates.38 Three levels of healthcare delivery in Nigeria were included in the data set. We aggregated the count of healthcare delivery to state level, including hospitals, pharmacies, clinics, health centres, medical centres, maternity homes, laboratories and other entities that provide medical and/or healthcare services. It was believed that the availability of healthcare facilities would play a special role in impacting people's travel decisions during the pandemic12,39, as providing quality health and medical services at the travel destination could reduce the fear of travel39.
Data analytical method of measuring human mobility
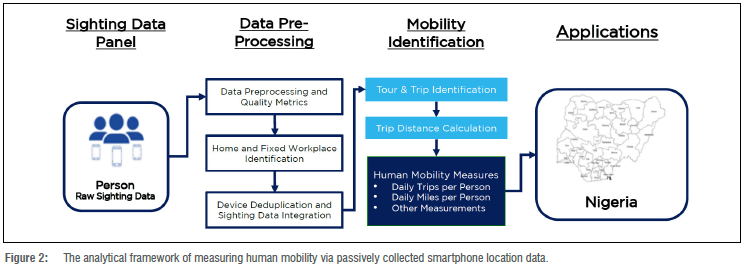
Figure 2 gives an overview of the analytical framework that was developed to measure human mobility. The framework is based on our existing research.33 Beginning from raw location data, a series of quality metrics was first developed to confirm data frequency, stability and data consistency. Partially for preserving data privacy, smartphone location data were not collected frequently. In an extreme case, one sample in the raw data was only observed in one sighting (i.e. a location point with a time stamp). To address this limitation, we filtered only the regular active users (RAU) as a sub-sample for subsequent mobility identification. An RAU must be observed at least eight times at different locations in a single day, and then has to be observed at eight different unique hours on that day. This is defined based on a trade-off between sample size and statistical biases of mobility measurements.33 With the implementation of this RAU quality filter, we assembled a sub-sample of 281 458 RAUs (from January 2020 to April 2020) in Nigeria for the subsequent data analytics steps.
A behaviour-based method was used to impute home and fixed workplaces based on the most frequently visited places at night and during the day. This step offered each sample an anchor for its daily life centres and for the subsequent identification of travels. Then, a deduplication step removed repetitive data from the observations as one individual could possess multiple mobile devices and share data with multiple data vendors. This process avoided the over-representation of individuals using multiple devices and sharing data with multiple data vendors, and consolidated unique device sightings. In the Nigeria study presented in this paper, about 0.04% of the devices were removed as duplicates.
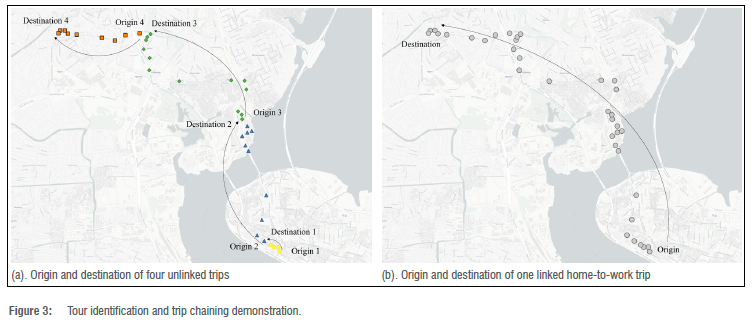
The most critical pillar of the framework is the mobility identification steps. We employed a tour-based approach to properly identify all tours and trips from the raw location data, including trip origin, destination, start time and end time. A tour means a sequence of linked trips that fulfil similar mobility needs for a person. The tour-based method enables one to consider trip chaining and differentiate between linked and unlinked trips. Many traditional methods can only identify unlinked trips, for instance, a single transit commute trip with a long time of waiting at the origin, and/or transfer transit stations would be identified as multiple unlinked trips. Figure 3 illustrates how the tour-based algorithm produced more accurate trip identification results than traditional methods. Figure 3a and 3b show how the tour-based method differentiates true activity clusters (e.g. a home cluster and a work cluster) from mid-trip transfer points (e.g. waiting at a transit station). More details about this algorithm can be found in Zhang et al.33
The tour and trip identification approach is then applied to all RAU subsamples in the study area and for the designated study period to yield a roster of trips. The location points of each trip are then used to estimate the great-circle distance. Because of the lack of appropriate multimodal transportation network data, especially for transit and rail modes, it is difficult to reconstruct accurate turn-by-turn movements of sub-samples and thereby estimate trip distance. As this research focused more on analysing the mobility and travel behaviour change along the timeline of COVID-19, an unbiased travel distance approximation40 was found to be acceptable and sufficient for this study, rather than elaborating efforts and computing powers to obtain network-based distance. Therefore, great-circle distance is employed to approximate the actual trip distance. This limitation will be addressed once a routable transportation network is developed for analysis. Finally, the trip roster, together with the approximated trip distance information, was employed to generate two aggregated human mobility measurements:
• Daily trips per person: The number of trips made by each person per day
• Daily distance per person: The total approximated distance travelled by each person per day
To date, there are limited data to validate the mobility findings generated from the passively collected smartphone location data. Because of the sparsity of such location data, it is possible that the proposed methodology under-estimates the number of trips and/or distance travelled per person per day. Without appropriate validation data and a calibration process, the possible measurement bias may not be properly identified and mitigated. This will remain a critical research topic yet to be completed. On the other hand, the consistency of the data in terms of number of devices and number of sightings per device on a daily basis has been thoroughly evaluated. The study also filtered high-quality RAUs as the sub-sample used in the analytical framework. We are confident that the development mobility measurements reasonably reflect the actual behaviour shifts in Nigeria.
With this overarching framework and its capability to analyse individual-level tours and trips, additional mobility measures can be derived with additional future research and development effort. This paper is focused on analysing and modelling these two measurements in Nigeria, which is one of two country-level study and application sites.
Modelling the time-dependent human mobility measures
Individual-level trip information was aggregated to state level for Nigeria. We employed a random-effect model of panel data to capture the relationship between human mobilities and government policies, SARS-CoV-2 cases and several time-invariant covariates. A one-day lag variable was embedded in the model to capture the first-order autocorrelation of the dependent variable. The formulation of the model is described in Equation 1:

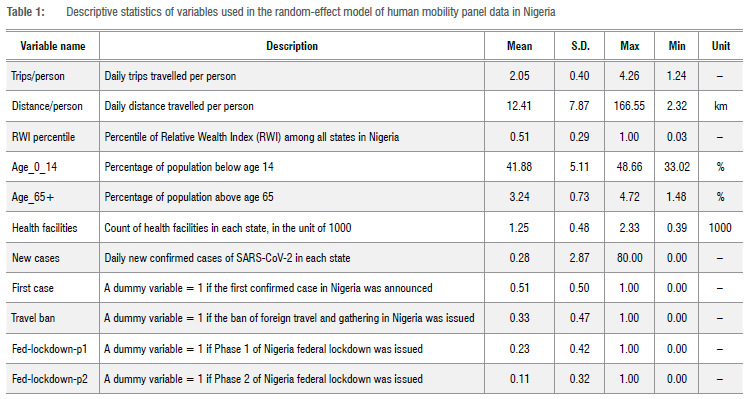
where Ykit represents the kth dependent variable of state i at time t; cit is the constant term serving as the intercept of the model for each state at each time; Xmi is the mth time-invariant variable of state i, and ßm is the corresponding coefficient; Xnit is the nth time-variant variable of state i, and ß'nit is the corresponding coefficient; Yk,i,t-1 stands for the kth time-series variable of state i at time t-1, which is lagged by one day; Y is the corresponding coefficient of Yk,i,t-1; ui is the random effect term, which is independent of all Xmi and Yk,i,t, but common to all states i; eit stands for the error term. In our experiment, there were M=5 time-invariant variables, N=4 time-variant no-lag variables and K=2 time-variant variables lagged by one day. The description and the type of variables are described in Table 1.
Data measurements and modelling results
Human mobility measurements
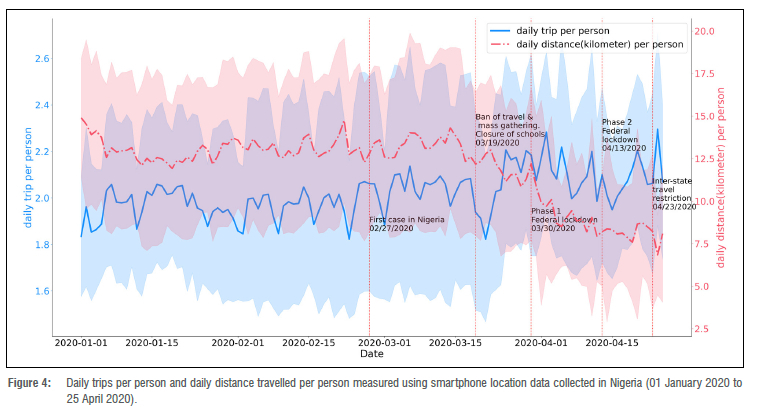
Based on the data sources and methodology elaborated on in the previous section, we derived daily trips and daily distances travelled per person as human mobility measurements for Nigeria. The results are illustrated in Figure 4. The measurements are averaged at the national level and cover the period 01 January to 25 April 2020, demonstrating the overall mobility changes in Nigeria at the beginning of the pandemic. The dates when different mobility-restricting policies were implemented are annotated in Figure 4.
Using the ban on travel and mass gatherings (19 March 2020) as the pandemic breakpoint, before that date, people made 2.0 trips and travelled 13.2 km per day. After the breakpoint, the daily distance travelled per person dropped steadily to an average of 9.66 km, which represented a decrease of over 25%. The number of trips per person displayed a more notable fluctuation and averaged 2.1 trips per person per day after 19 March 2020, i.e. a 5% increase compared with the pre-pandemic level. Overall, the results show that human mobility patterns displayed an unprecedented modification during the study period. The pandemic, along with the series of mobility restrictions, seemed to have had a significant effect in limiting the distance travelled, while people were still making a good number of daily travels, measured by trips. This indicated that, when adapting to the pandemic, people reduced the number of longer trips and replaced them with shorter trips.
Another robust way of measuring the mobility changes during the SARS-CoV-2 pandemic was to analyse the relative percentage change in these mobility measures.
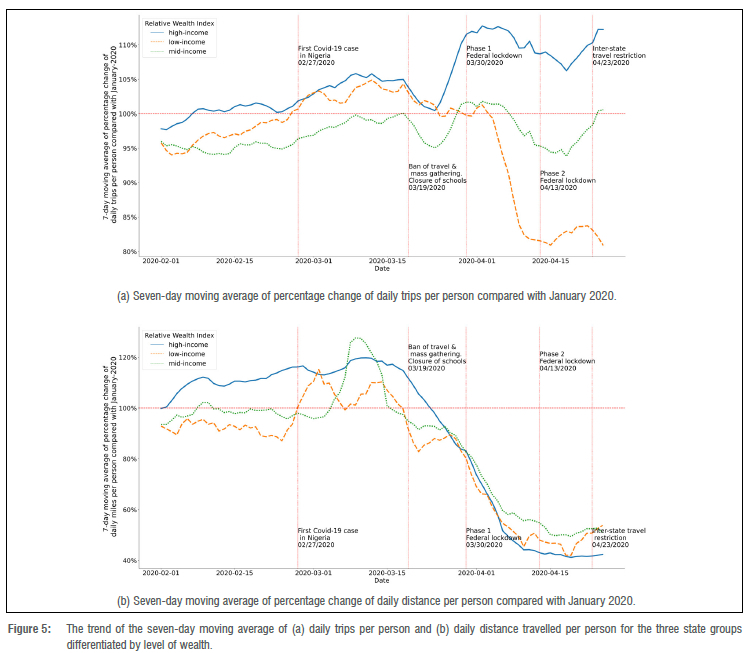
The average numbers measured for January 2020 were used as the benchmark to calculate the percentage change of the mobility measures for the following months of the study period. Figure 5a and 5b visualise the human mobility trends in percentage changes when compared with the January average. The statistics are reported for three different groups of states in Nigeria. The grouping was based on the groups' relative wealth according to RWI percentile rankings. Two thresholds for RWI (i.e. 0.33 and 0.66) were selected to divide the states into three groups of equal sample sizes. As shown in Figure 5a and 5b, the green curve with an RWI percentile ranking greater than 0.66 represents the situation for the high-income group of states, while the blue curve with an RWI percentile ranking lower than 0.33 represents the low-income states. The orange curve with an RWI percentile ranking between 0.33 and 0.66 represents the situation of the mid-income states. Both trips and distances showed some level of increase shortly after the announcement of the first SARS-CoV-2 case in Nigeria on 27 February 2020. This could be due to the panic facing the uncertainties of a new pandemic. People were travelling to get together or to get a part, stock up on goods or even relocate to another place with decent medical resources. On 19 March 2020, Nigeria banned entry for travellers from 13 countries with higher public health concerns, followed by the closure of schools. Around the same time, the World Health Organization (WHO) defined SARS-CoV-2 as a global pandemic. The trips and distances travelled per person in all state groups dropped in response to the announcement. Daily distances travelled in all groups continued to tumble, dropping to only 40-50% compared with the January average. However, the trends in the daily number of trips per person performed differently and showed discrepancies across state groups, especially after the announcement of the federal lockdown. The daily trips per person of richer states rebounded drastically and stayed at the level of 110% compared with January 2020. For the relatively lower-income states, the daily number of trips decreased to around 83% of the January average.
Model estimation of time-dependent human mobility measures
The results of the random-effect model for daily trips per person and daily trip distance per person are reported in Table 2 and Table 3, respectively. The variable with the prefix "Lag1_" represents one day lag of the data. Goodness-of-fit indices (R-squared) are 0.6622 for the model of daily trips per person, and 0.2142 for the model of daily distance travelled per person, respectively. The codes, spreadsheet data and results have been deposited in GitHub (https://github.com/villanova-transportation/Nigeria-mobility-COVID19-SAJS) and are publicly accessible.
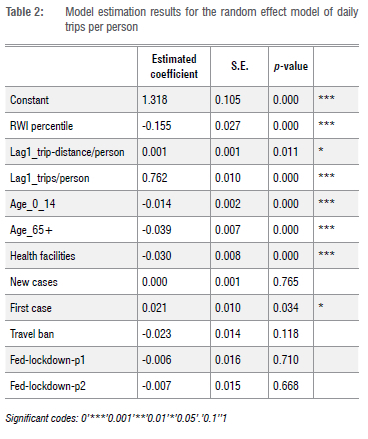
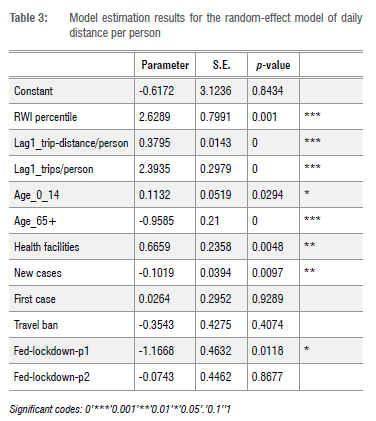
Regarding the lagged time-variant variable, as expected, one-step lagged daily trips per person and daily distance travelled per person both played a positive and statistically significant role in the two models. It also implies the existence of autocorrelation in the time-series data. For the trips per person, the magnitude of the effect of trip distance per person was limited. A trip distance of 1 km more per person on the previous date only increased to an additional trips per person at the current date. However, for the trip distance per person, the effect of trips per person was significant. One more trip per person on the previous date increased to an additional trip distance of per person at the current date.
As for the impact of new SARS-CoV-2 cases, it was estimated to be statistically insignificant in the trips-per-person model. On the other hand, the daily new COVID-19 case number37 was found to influence the daily distance travelled per person negatively. One more confirmed case led to a mild reduction in the daily trip distance per person. Again, the model corroborates what has been observed in the data. People may give up longer-distance travel, such as vacations and visiting family, amid public health concerns. This was as expected and verified by several previous research studies.12-14 The announcement of the first SARS-CoV-2 case in Nigeria had a slightly significantly positive effect on trips per person, while it did not have a significant effect on trip distance per person. The trips per person on the date on which the first case was announced were only more than they had been on the dates before the announcement was made, on average.
The model also tested the influence of mobility-restriction policies. The travel ban policy showed a negative, but limited effect on trips per person, as expected, and did not have a significant effect on trip distance per person. The impact of the Phase 1 and Phase 2 federal lockdown policy had an insignificant effect on trips per person, while the Phase 1 federal lockdown policy had a significantly negative effect on trip distance per person. The Phase 1 federal lockdown policy reduced to a noteworthy daily trip distance per person, which is about 9.47% of its mean value. This indicates that the Phase 1 lockdown policy was effective in restricting human mobilities and subsequently slowed down the propagation of the virus. The effectiveness of the Phase 2 federal lockdown, however, had a limited effect in further restricting human mobility. These findings are roughly in line with international studies on the effect of different Phase 1 policies in countries such as the USA14,41 and Japan42.
From the view of the socio-economic and sociodemographic factors, RWI percentile, Age_0_14 and Age_65+ had a significantly negative influence on trips per person. In other words, relatively wealthier states with a higher proportion of 0-14 or 65+ age groups were more likely to make fewer daily trips per person. On the other hand, Age_65+ had a significantly negative impact on trip distance per person, while, on the contrary, RWI percentile and Age_0_14 had a significantly positive impact on trip distance per person. That means the states with a higher proportion of older people were inclined to travel a shorter distance, while the relatively wealthier states with a higher proportion of younger people tended to travel longer distances. The number of health facilities had significant influences in both models, but the impact was in different directions. States with more health facilities tended to make fewer daily trips per person, but travelled longer daily distance per person. While this was significant, the impact of health facilities was limited due to the small coefficients compared with their scale.
Conclusion
This paper is one of the first attempts to quantify travel behaviour (i.e. trip-making behaviour and daily travelling distances) and its changes at the beginning of the SARS-CoV-2 pandemic in Nigeria. The study is part of a research consortium entitled 'Role of Data Streams in Informing Infection Dynamics in Africa' (INFORM-Africa, https://dsi-africa.org/project/7). Fully recognising the data gap in sub-Saharan Africa in understanding human mobility, the study employs a data-driven analytical framework that utilises passively collected smartphone location data and algorithms that have been previously developed and tested. The proposed approach enables the quantification of daily human mobility in terms of the number of trips and distances travelled by each person. The paper demonstrated this novel data-driven approach and how it can fill the critical data gap using Nigeria as the application. The measurements were produced for the period 01 January to 25 April 2020. A steady decrease in daily distances travelled per person during the pandemic was evident, while the daily number of trips travelled fluctuated and increased slightly. The mobility measurements were clustered into three groups based on level of wealth. Our study was able to highlight differences in mobility trends at the state level, revealing spatial and temporal differences in mobility patterns during a pandemic.
Another highlight of the paper is the assessment of the effectiveness of mobility-restricting policies as key lessons learned from the SARS-CoV-2 pandemic. We found that travel bans and federal lockdown policies failed to restrict trip-making behaviour, but had a significant impact on distance travelled. This led to a corollary in that people changed their mobility patterns by reducing their number of long-distance trips and replaced them with shorter trips. While this suggested some moderate policy effects of the government's orders, how it eventually benefitted (or deteriorated) the public health situation under the pandemic needs further evaluation. The fewer longer trips could mean fewer gatherings at long-distance bus stations and airports. But would the increased number of shorter local trips (and activities) lead to new public health hotspots and community transmissions? The proposed approach can be further developed to look at location-specific population density and assess how that influenced local outbreaks.
This paper contributes a first attempt to quantify human travel behaviour and how mobility-restricting policies took effect. Its innovations are three-fold:
• The mobility measurements are new to the field and have filled a major data gap in understanding how people travel and how travel behaviour changed during the SARS-CoV-2 pandemic. The mobility data could facilitate a variety of quantitative research studies related to transportation and health that could not have been done before.
• The study is driven entirely by high-quality data samples and a data-driven analytical framework. The framework can be directly applied to study other localities and periods of interest. The framework can also be adapted to develop additional measurements and quantitative models with regard to human mobility patterns and relevant policies and regulations.
• The study assesses the mobility-restricting policies via a time-dependent random effect modelling practice. It quantifies the effectiveness of those policies and derives policy implications that are critical to develop travel-related guidelines in response to future unprecedented epidemics and other infectious diseases.
Limitations of this study are acknowledged and will be the next research focus. Admittedly, the study did not assess human movement between areas, but focused primarily on understanding the magnitude of daily human travel behavioural patterns and changes under the influence of pandemic and mobility-restricting policies. As an immediate future research direction, information on trip origins and destinations will be incorporated to develop spatio-temporal models of human mobility. The data representativeness was also not studied in terms of how the quantified mobility resembles the actual mobility of an average Nigerian. A large-scale household travel survey is not yet available in Nigeria to be used as a benchmark for comparison. When developing human movement patterns between areas and spatio-temporal models, we will gather transportation network observations such as traffic data on highways and tollways, and air and rail ticket sales as possible ways to verify the data representativeness.
Secondly, the raw location data employed in this study was licensed from third-party smartphone location data providers. As it is strictly prohibited to make such highly sensitive data publicly available, part of the study involving raw location data processing cannot be replicated. We acknowledge this limitation. Such limitation will last long and hold true for any research employing location-based service data. Possible solutions may be developed using artificial intelligence generated contents and synthetic data-generation methods. This will be a promising research direction to enable a general understanding and a wider acceptance of using such location-based data.
The research team will also work on expanding the study to South Africa. As another important sub-Saharan African country with a significant population, South Africa's human mobility behaviour under different waves of SARS-CoV-2 variants would offer valuable empirical evidence for policymakers and health practitioners. The team plans to conduct a bi-country statistical comparison of Nigeria and South Africa to analyse the differences and similarities between the two countries when facing a pandemic.
Acknowledgements
The research approach adopted in the study, including data sources, data processing and modelling methodologies, was reviewed and approved by the Institutional Review Boards at the Villanova University and the University of Maryland Baltimore and the National Health Research Ethics Committee of Nigeria (NHREC). This work was financially supported by a US National Institutes of Health (NIH) award (grant number U54TW012041-02) entitled "Role of Data Streams in Informing Infection Dynamics in Africa - INFORM-Africa". The views and opinions stated in this paper are those of the authors and do not necessarily reflect the views or positions of the project sponsor.
Competing interests
We have no competing interests to declare.
Authors' contributions
W.L.: Methodology, data collection, sample analysis, data analysis, validation, data curation, writing - the initial draft, writing - revisions, project management. C.X.: Conceptualisation, methodology, data collection, sample analysis, data analysis, validation, data curation, writing - the initial draft, writing - revisions, project leadership, funding acquisition. J.W.: Methodology, data collection, data analysis, validation, data curation, writing - revisions. Z.F.: Writing - the initial draft, data analysis, writing - revisions. O.A.: Writing - the initial draft, writing -revisions, data analysis, project management. N.B.: Conceptualisation, writing - the initial draft, writing - revisions. M.C.: Conceptualisation, project leadership, writing - the initial draft, writing - revisions. V.N.: Conceptualisation, project leadership, writing - the initial draft, writing - revisions. C.R.: Conceptualisation, writing - the initial draft, writing - revisions. A.W.: Conceptualisation, writing - the initial draft, writing
- revisions, project leadership. F.M.-I.: Conceptualisation, writing
- revisions, project management. A.A.: Conceptualisation, writing -revisions, project leadership, funding acquisition.
References
1. Dong E, Du H, Gardner L. An interactive web-based dashboard to track COVID-19 in real time. Lancet Infect Dis. 2020;20(5):533-534. https://doi.org/10.1016/S1473-3099(20)30120-1 [ Links ]
2. World Health Organization (WHO). WHO Coronavirus (COVID-19) Dashboard [webpage on the Internet]. No date [cited 2023 May 26]. Available from: https://covid19.who.int [ Links ]
3. Chinazzi M, Davis JT, Ajelli M, Gioannini C, Litvinova M, Merler S, et al. The effect of travel restrictions on the spread of the 2019 novel coronavirus (COVID-19) outbreak. Science. 2020;368(6489):395-400. https://doi.org/10.1126/science.aba9757 [ Links ]
4. Courtemanche C, Garuccio J, Le A, Pinkston J, Yelowitz A. Strong social distancing measures in the United States reduced the COVID-19 growth rate. Health Affairs. 2020;39(7):1237-1246. https://doi.org/10.1377/hlthaff.2020.00608 [ Links ]
5. Cowling BJ, Ali ST, Ng TWY Tsang TK, Li JCM, Fong MW, et al. Impact assessment of non-pharmaceutical interventions against coronavirus disease 2019 and influenza in Hong Kong: An observational study. Lancet Public Health. 2020;5(5):e279-88. https://doi.org/10.1016/S2468-2667(20)30090-6 [ Links ]
6. Lee M, Zhao J, Sun Q, Pan Y Zhou W, Xiong C, et al. Human mobility trends during the early stage of the COVID-19 pandemic in the United States. PLoS ONE. 2020;15(11), e0241468. https://doi.org/10.1371/journal.pone.0241468 [ Links ]
7. White ER, Hébert-Dufresne L. State-level variation of initial COVID-19 dynamics in the United States. PLoS ONE. 2020;15(10), e0240648. https://doi.org/10.1371/journal.pone.0240648 [ Links ]
8. Perra N. Non-pharmaceutical interventions during the COVID-19 pandemic: A review. Phys Rep. 2021;913:1-52. https://doi.org/10.1016/j.physrep.2021.02.001 [ Links ]
9. Chi G, Fang H, Chatterjee S, Blumenstock JE. Microestimates of wealth for all low- and middle-income countries. Proc Natl Acad Sci USA. 2022;119(3), e2113658119. https://doi.org/10.1073/pnas.2113658119 [ Links ]
10. Luo W, Guo W, Hu S, Yang M, Hu X, Xiong C. Flatten the curve: Empirical evidence on how non-pharmaceutical interventions substituted pharmaceutical treatments during COVID-19 pandemic. PLoS ONE. 2021;16(10), e0258379. https://doi.org/10.1371/journal.pone.0258379 [ Links ]
11. Chinazzi M, Davis JT, Ajelli M, Gioannini C, Litvinova M, Merler S, et al. The effect of travel restrictions on the spread of the 2019 novel coronavirus (COVID-19) outbreak. Science. 2020;368(6489):395-400. https://doi.org/10.1126/science.aba9757 [ Links ]
12. Hu S, Xiong C, Yang M, Younes H, Luo W, Zhang L. A big-data driven approach to analyzing and modelling human mobility trend under non-pharmaceutical interventions during COVID-19 pandemic. Transp Res Part C Emerg Technol. 2021;124:102955. https://doi.org/10.1016/j.trc.2020.102955 [ Links ]
13. Xiong C, Hu S, Yang M, Luo W, Zhang L. Mobile device data reveal the dynamics in a positive relationship between human mobility and COVID-19 infections. Proc Natl Acad Sci USA. 2020;117(44):27087-27089. https://doi.org/10.1073/pnas.2010836117 [ Links ]
14. Xiong C, Hu S, Yang M, Younes H, Luo W, Ghader S, et al. Mobile device location data reveal human mobility response to state-level stay-at-home orders during the COVID-19 pandemic in the USA. J R Soc Interface. 2020;17(173), Art. #20200344. https://doi.org/10.1098/rsif.2020.0344 [ Links ]
15. Kraemer MUG, Tegally H, Pigott DM, Dasgupta A, Sheldon J, Wilkinson E, et al. Tracking the 2022 monkeypox outbreak with epidemiological data in real-time. Lancet Infect Dis. 2022;22(7):941 -942. https://doi.org/10.1016/S1473-3099(22)00359-0 [ Links ]
16. Kraemer MUG, Yang C-H, Gutierrez B, Wu C-H, Klein B, Pigott DM, et al. The effect of human mobility and control measures on the COVID-19 epidemic in China. Science. 2020;368(6490):493-497. https://doi.org/10.1126/science.abb4218 [ Links ]
17. Häkansson A. Changes in gambling behaviour during the COVID-19 pandemic-a web survey study in Sweden. Int J Environ Res Public Health. 2020;17(11):4013. https://doi.org/10.3390/ijerph17114013 [ Links ]
18. Ugolini F, Massetti L, Calaza-Martínez P Carinanos P Dobbs C, Ostoic SK, et al. Effects of the COVID-19 pandemic on the use and perceptions of urban green space: An international exploratory study. Urban For Urban Green. 2020;56:126888. https://doi.org/10.1016/j.ufug.2020.126888 [ Links ]
19. Jarvis CI, Van Zandvoort K, Gimma A, Prem K, CMMID COVID-19 working group, Klepac P et al. Quantifying the impact of physical distance measures on the transmission of COVID-19 in the UK. BMC Med. 2020;18(1):124. https://doi.org/10.1186/s12916-020-01597-8 [ Links ]
20. Zhang J, Litvinova M, Liang Y Zheng W, Shi H, Vespignani A, et al. The impact of relaxing interventions on human contact patterns and SARS-CoV-2 transmission in China. Sci Adv. 2021;7(19), eabe2584. https://doi.org/10.1126/sciadv.abe2584 [ Links ]
21. Tintori A, Cerbara L, Ciancimino G, Crescimbene M, La Longa F, Versari A. Adaptive behavioural coping strategies as reaction to COVID-19 social distancing in Italy. Eur Rev Med Pharmacol Sci. 2020;24(20):10860-10866. https://doi.org/10.26355/eurrev_202010_23449 [ Links ]
22. Alzueta E, Perrin P Baker FC, Caffarra S, Ramos-Usuga D, Yuksel D, et al. How the COVID-19 pandemic has changed our lives: A study of psychological correlates across 59 countries. J Clin Psychol. 2021;77(3):556-570. https://doi.org/10.1002/jclp.23082 [ Links ]
23. Balanzá-Martínez V Kapczinski F, De Azevedo Cardoso T, Atienza-Carbonell B, Rosa AR, Mota JC, et al. The assessment of lifestyle changes during the COVID-19 pandemic using a multidimensional scale. Rev Psiquiatr Salud Ment. 2021;14(1):16-26. https://doi.org/10.1016/j.rpsm.2020.07.003 [ Links ]
24. Rogers NT, Waterlow NR, Brindle H, Enria L, Eggo RM, Lees S, et al. Behavioural change towards reduced intensity physical activity is disproportionately prevalent among adults with serious health issues or self-perception of high risk during the UK COVID-19 lockdown. Front Public Health. 2020;8, Art. #575091. https://doi.org/10.3389/fpubh.2020.575091 [ Links ]
25. Badr HS, Du H, Marshall M, Dong E, Squire MM, Gardner LM. Association between mobility patterns and COVID-19 transmission in the USA: A mathematical modelling study. Lancet Infect Dis. 2020;20(11):1247-1254. https://doi.org/10.1016/S1473-3099(20)30553-3 [ Links ]
26. Hsiehchen D, Espinoza M, Slovic P Political partisanship and mobility restriction during the COVID-19 pandemic. Public Health. 2020;187:111-114. https://doi.org/10.1016/j.puhe.2020.08.009 [ Links ]
27. Weill JA, Stigler M, Deschenes O, Springborn MR. Social distancing responses to COVID-19 emergency declarations strongly differentiated by income. Proc Natl Acad Sci USA. 2020;117(33):19658-19660. https://doi.org/10.1073/pnas.2009412117 [ Links ]
28. Evans MV, Garchitorena A, Rakotonanahary RJL, Drake JM, Andriamihaja B, Rajaonarifara E, et al. Reconciling model predictions with low reported cases of COVID-19 in sub-Saharan Africa: Insights from Madagascar. Glob Health Action. 2020;13(1), Art. #1816044. https://doi.org/10.1080/16549716.2020.1816044 [ Links ]
29. Van Zandvoort K, Jarvis CI, Pearson CAB, Davies NG, Ratnayake R, Russell TW, et al. Response strategies for COVID-19 epidemics in African settings: A mathematical modelling study. BMC Med. 2020;18, Art. #324. https://doi.org/10.1186/s12916-020-01789-2 [ Links ]
30. WHO Regional Office for Africa. Tuberculosis (TB) [webpage on the Internet]. No date [cited 2022 Sep 01]. Available from: https://www.afro.who.int/health-topics/tuberculosis-tb [ Links ]
31. Statista. Penetration rate of smartphones in selected countries [webpage on the Internet]. c2021 [cited 2022 Sep 01]. Available from: https://www.statista.com/statistics/539395/smartphone-penetration-worldwide-by-country/ [ Links ]
32. Federal Highway Administration (FHWA). NHTS NextGen OD Data [webpage on the Internet]. No date [cited 2022 Sep 01]. Available from: https://nhts.ornl.gov/od/ [ Links ]
33. Zhang L, Darzi A, Pan Y, Yang M, Sun Q, Kabiri A, et al. Next generation National Household Travel Survey national origin destination data passenger origin-destination data methodology documentation. Washington DC: Federal Highway Administration, US Department of Transportation; 2021. Available from: https://nhts.ornl.gov/od/assets/doc/2020_NextGen_NHTS_Passenger_OD_Data_Methodology_v2.pdf [ Links ]
34. The Center for Policy Impact in Global Health. Nigeria's policy response to COVID-19 [webpage on the Internet]. No date [cited 2023 Apr 04]. Available from: https://centerforpolicyimpact.org/our-work/the-4ds/nigeria-policy-response-to-covid-19/ [ Links ]
35. Jacobs ED, Malachy IO. A critical evaluation of Nigeria's response to the first wave of COVID-19. Bulletin of the National Research Centre. 2022;46(1):44. https://doi.org/10.1186/s42269-022-00729-9 [ Links ]
36. South African Government. Minister Joe Phaahla: Repeal of regulations regarding Covid-19 pandemic and monkey-pox [media release on the Internet]. 23 June 2022 [cited 2023 May 02]. Available from: https://www.gov.za/speeches/statement-minister-health-dr-joe-phaahla-repeal-regulations-notifiable-medical-conditions [ Links ]
37. HERA. HERA - the Covid-19 data project [webpage on the Internet]. No date [cited 2023 Apr 05]. Available from: https://hera-ngo.org/projects/the-covid-19-data-project [ Links ]
38. openAFRICA. Nigerian health care facilities (primary, secondary and tertiary) [data set]. c2021 [updated 2021 Jun 29; cited 2022 Sep 01]. Available from: https://africaopendata.org/dataset/nigerian-health-care-facilities-primary-secondary-and-tertiary1 [ Links ]
39. Cezar M, Tiba A, Basarin B, Vujicic M, Valjarevic A, Niemets L, et al. Predictors of changes in travel behavior during the COVID-19 pandemic: The role of tourists' personalities. Int J Environ Res Public Health. 2021;18(21): Art. #11169. https://doi.org/10.3390/ijerph182111169 [ Links ]
40. Qureshi MA, Ho-Ling H, Shih-Miao C. Comparison of distance estimates for Commodity Flow Survey: Great circle distances versus network-based distances. Transp Res Rec. 2002;1804(1):212-216. https://doi.org/10.3141/1804-28 [ Links ]
41. Li Y Li M, Rice M, Zhang H, Sha D, Li M, et al. The impact of policy measures on human mobility, COVID-19 cases, and mortality in the US: A spatiotemporal perspective. Int J Environ Res Public Health. 2021;18(3), Art. #996. https://doi.org/10.3390/ijerph18030996 [ Links ]
42. Yabe T, Tsubouchi K, Fujiwara N, Wada T, Sekimoto Y Ukkusuri SV. Non-compulsory measures sufficiently reduced human mobility in Tokyo during the COVID-19 epidemic. Sci Rep. 2020;10(1), Art. #18053. https://doi.org/10.1038/s41598-020-75033-5 [ Links ]
 Correspondence:
Chenfeng Xiong
Email: chenfeng.xiong@villanova.edu
Received: 09 Sep. 2022
Revised: 06 May 2023
Accepted: 17 May 2023
Published: 30 May 2023
Editors: Jennifer Fitchett, Adriaan van der Walt
Funding: US National Institutes of Health (U54TW012041-02)

