


Servicios Personalizados
Articulo
 Inglés (pdf)
 Articulo en XML
 Referencias del artículo
Indicadores

Links relacionados
-
 Citado por Google
 -
 Similares en Google
Compartir

 Permalink
South African Journal of Science
versión On-line ISSN 1996-7489
versión impresa ISSN 0038-2353
S. Afr. j. sci. vol.119 no.3-4 Pretoria mar./abr. 2023
http://dx.doi.org/10.17159/sajs.2023/14303
RESEARCH ARTICLE
Advancing ecosystem accounting in estuaries: Swartkops Estuary case study
Susan TaljaardI, II; Lara van NiekerkI, II; Janine B. AdamsII, III; Taryn RiddinII, III
ICoastal Systems and Earth Observations Research Group, Council for Scientific and Industrial Research (CSIR), Stellenbosch, South Africa
IIInstitute for Coastal and Marine Research, Nelson Mandela University, Gqeberha, South Africa
IIIDSI/NRF Research Chair in Shallow Water Ecosystems, Nelson Mandela University, Gqeberha, South Africa
ABSTRACT
Rapid degradation of ecosystems and loss of ecosystem services have sparked interest in developing approaches to report and integrate such change with socio-economic information systems, such as the System of National Accounts. Here we describe an approach and application of ecosystem accounting for individual estuaries, building on approaches previously applied at national and bay levels. Using the Swartkops Estuary as a case study, the focus is on physical accounts for ecosystem extent and condition, as well as accounts for two important ecosystem services (carbon sequestration and recreational use). Pressure accounts are also introduced to demonstrate the value of identifying key areas for management and restoration interventions in response to changes in extent and/or condition accounts. Greater resolution in these account reports, achieved through zoning, provides spatially explicit information on ecosystem assets and their services within an estuary to also inform management decision-making at local level. Further, these accounts can also inform local restoration prioritisation, in support of the UN Decade on Ecosystem Restoration (2021-2030), for example offsetting irreversibly degraded areas in one zone with restoration or maintenance of similar habitats in another.
SIGNIFICANCE:
• This study is the first to apply the ecosystem accounting approach at the individual estuary level.
• We provide spatially explicit information on ecosystem assets and their services in support of resource management.
• Physical accounts include extent and condition, as well as ecosystem service and pressure accounts.
• These accounts inform estuary management and restoration at the local governance level.
Keywords: estuary-level, extent and condition accounts, pressure accounts, physical ecosystem service accounts, management
Introduction
Rapid degradation of ecosystems has sparked interest in developing information systems able to evaluate and report change, as well as the loss of valuable services they provide to people.1-3 From this stemmed the concept of ecosystem accounting (also referred to as natural capital accounting), a systematic approach by which to trace the contribution of natural capital to the productive system over time and space in an accounting structure.2,4 Hein et al.2 reflected on the diverse applications of these type of accounts, including the provision of a comprehensive overview of ecosystem assets and their use, measurement of sustainable use of ecosystems within the context of the sustainable development goals (SDGs), and provision of spatially explicit information in support of resource management.
There is no single, universal method for ecosystem or natural capital accounting, although at its core is the measurement of the extent, condition and value of natural capital assets, as well as the services and benefits derived from them.5,6 In turn, this information, provides the basis for the evaluation of environmental management and development options against pre-defined objectives.6 Internationally, emerging global ecosystem account approaches include the Global Ocean Accounts Partnership's framework for ocean accounting and the UN's System for Environmental-Economic Accounting (SEEA).7-9 The primary aim of the SEEA is to gather and organise environmental information consistently and enable its integration with socio-economic information, such as the System of National Accounts.10 The SEEA Ecosystem Accounting (SEEA-EA) poses five ecosystem accounts, including three physical accounts and two monetary accounts.11 The physical accounts comprise ecosystem extent, ecosystem condition, and ecosystem services supply and use, while the monetary accounts include ecosystem services supply and use (expressed in monetary terms) as well as ecosystem monetary asset accounts. How ecosystem accounts are presented mimics the internationally accepted accounting concepts of gathering and organising information consistent with the socioeconomic components of the System of National Accounts to ensure comparability. Wang et al.12 posed designs for marine ecosystem accounts, aligned with the SEEA-EA approach, while others demonstrated the application in marine and coastal ecosystems at national level and at bay level.13-15
Most ecosystem and natural capital accounting approaches have been designed for application at national level (e.g. SEEA-EA).4,11 However, application at the local scale is more challenging.2 For example, while ecosystem service and natural capital assessments are effective in facilitating collaboration among financiers, policymakers, conservationists and stakeholders to drive investment in natural assets16, this is still acknowledged as an obstacle at the local scale17. To this end, Burdon et al.18 demonstrated the use of participatory mapping to enable engagement among local stakeholders. Another common obstacle facing ecosystem accounting at the local scale is the lack of quality place-based natural capital data and environmental baselines, especially accurate ecological baselines of coastal and estuarine areas.17-19 In management interventions, reporting against baselines is especially pertinent for habitat restoration.17,20 In such instances, baselines can assist with the identification of scale and nature of investment required to restore or improve natural habitats.17 Thus the application of ecosystem accounting as a monitoring and reporting tool in restoration management is especially relevant in this UN Decade on Ecosystem Restoration (2021-2030).21,22
Estuarine ecosystems provide disproportionate value to society in comparison to most other habitats, and as a result, they are highly utilised.17 Poor management of anthropogenic impacts and ineffective conservation approaches, together with global economic changes, have resulted in many estuaries becoming both economically and environmentally degraded.17 The ecosystem services provided by estuaries often are essential to those relying on them, and with most reliant communities being under increasing economic stress, the pressures on these valuable systems are unlikely to decline.17 Estuaries, therefore, are viewed as ideal ecosystems for the implementation of natural capital approaches paving the way to green economic growth and improved well-being.17
Since 2014, South Africa has made significant progress in the development of ecosystem accounting as a subset of natural capital accounting. Formal structures and partnerships in government have been formed between Statistics South Africa (Stats SA), the South African National Biodiversity Institute (SANBI) and the Department of Forestry, Fisheries and the Environment (DFFE) to co-ordinate and lead the development of ecosystem accounts. In consultation with a range of national and sub-national stakeholders, they pilot tested SEEA Ecosystem Accounting in South Africa. Similar structures have yet to be formally proposed for ocean accounting, but it is envisaged to be the same partnerships with possible shifts in roles and responsibilities. In 2019, the Council for Scientific and Industrial Research (CSIR), in collaboration with DFFE and the Nelson Mandela University (NMU), in consultation with SANBI and Stats SA, undertook a project to develop ecosystem accounting methods for estuaries in South Africa, and prepared the first country-level physical accounts for estuaries.14 They largely used the country-level information generated as part of the National Biodiversity Assessment 2018 (NBA 2018) to populate accounts and to demonstrate the interlinkages between the NBA and Ecosystem Accounting.23
We investigate an approach and application of ecosystem accounting at the local estuary level using the Swartkops Estuary as a case study, focusing on physical accounts.8 Specifically, we demonstrate methods by which to collect and present place-based extent and condition data, identified as one of the obstacles facing ecosystem and natural capital approaches in local applications.17-19 Further, we build on the approach previously applied in the country-level accounting for South African estuaries14 primarily to enable seamless alignment between local to national assessments. As with the country-level accounting, we also introduce a local pressure account, and demonstrate the construct of two important local ecosystem services physical accounts. This is the first reported study for South Africa in which ecosystem accounting was investigated in detail at the local estuary level.
Approach and methods
Study approach
Ecosystem accounting relies on environmental monitoring data, often the same data that are applied in other environmental management domains, albeit presented in a different format. In this study, we use existing data on the Swartkops Estuary to construct the estuary-level ecosystem accounts, primarily derived from the NBA 201823, but refined with information from more recent high-resolution studies24,25.
To ensure comparability and integration across resource management initiatives2, it is important for ecosystem accounting approaches to align with other existing resource management tools. Therefore, in our approach and method for the estuary-level accounts developed in this study, we drew strongly on those applied in the country-level estuarine ecosystem accounts14, as well as key estuary-specific approaches adopted in South Africa's estuarine environmental flow requirement method26-29. Previous methods adopted the estuarine functional zone (EFZ) (demarcating the official spatial boundaries of estuaries) as the basic spatial unit (BSU). In the estuary-level accounts, the EFZ also demarcates the estuary boundaries, but further spatial resolution is introduced through the demarcation of estuary zones (i.e. smaller BSUs). As with the environmental flow requirement methods, the estuarine ecosystem is resolved into the key abiotic components (hydrology, hydrodynamics, salinity, water quality, and physical habitat) and biotic components (microalgae, macrophytes, invertebrates, fish and birds) for the estuary-scale extent and conditions accounts.
Extent accounting
Ecosystem extent accounts typically reflect change in the area cover of habitats, and abundance or biomass of associated biota. For the study, extent accounts distinguish between abiotic and biotic habitats within the EFZ, disaggregated into the smaller BSUs. Unfortunately, insufficient data were available to prepare extent accounts for other biotic components such as microalgae, invertebrates, fish, and birds. Based on the earliest available historical data on the extent of habitats in the Swartkops Estuary, the opening account dates from 1942.
Condition accounting
Condition accounts primarily reflect change in the health of ecosystems. In South Africa, the term 'estuary health' is used to describe an estuary's condition - measured as the degree to which the present condition deviates from its pristine condition.26,27,30 The Estuarine Health Index (EHI) of South Africa was developed and reflects change as a percentage similarity (0-100%) to a defined natural state (referred to as the 'Reference Condition'). Condition is estimated for both abiotic (hydrology, hydrodynamics, salinity, water quality and physical habitat) and biotic indicators (micro-algae, macrophytes, invertebrates, fish and birds) derived from various data and information sources. Ratings for indicators are weighted (25% for each abiotic and 20% for each biotic component) and aggregated (50:50) to provide an overall percentage deviation from natural.31 These percentage values are then translated into six ecological condition categories, ranging from natural (A) to critically modified (F). These categories also represent declining functionality in process and pattern, from natural to little remaining. To ensure alignment with existing health assessment processes for estuaries in South Africa, the construct of ecosystem condition accounts at the estuary level also adopted the EHI to express condition.26,30 In the case of the Swartkops Estuary, ecological condition data were not available for 1942. For this reason, the initial opening account assumes a pre-industrial natural, roughly estimated as 1750s in line with other national assessments.14
Pressure accounting
Pressure accounts are useful to understand the impacts that contribute to change in ecosystem extent and condition. They can also highlight where pressures have increased and where management intervention is needed, including more frequent monitoring and assessment. Six main pressure categories have been identified for South African estuaries, namely: flow modification, land use and development, exploitation of living resources (fishing), pollution (wastewater disposal), inlet manipulation, and biological invasion (plants and fish).32 To estimate the magnitude of pressure in these accounts, the method of Van Niekerk et al.32 was applied, using various indicators in the EHI as proxies (Table 1).
Ecosystem service accounting (physical)
In essence, ecosystem service accounts express the 'amount' of a service that can be delivered by specific environmental components, depending on both the extent and condition of the component. In this study, we investigated the construct of physical accounts for two important ecosystem services provided by estuaries, that is, carbon sequestration and recreational use.
In the case of carbon sequestration, the account requires information on ecosystem delivery capacity, e.g. carbon sequestration (C t/a) = Salt marsh extent (ha) * f (dependent on condition). Such information can then be used to translate the 'amount' of ecosystem service flows into a monetary value (if relevant), e.g. monetary value (R 000'K) = carbon sequestration (C t/a) * Unit market value. Carbon sequestration accounts distinguish between sediment and aboveground biomass.33 Matching the biotic extent account, the initial opening account for carbon sequestration dates from 1942.
For recreational use, the account evaluates suitability of use by comparing microbiological indicator data against water quality guidelines for recreation, as summarised in Table 2.34,35
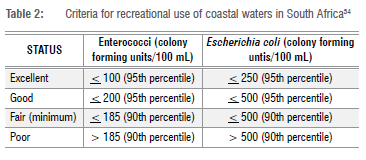
These are typically based on 95/90 percentile values calculated over a 12-month period (sampled twice monthly). The 'fair' category is accepted as the minimum requirement for contact recreational use in South Africa. For recreational use, the initial opening accounts assumes the pre-industrial natural conditions, roughly estimated as the 1750s.14
Study area
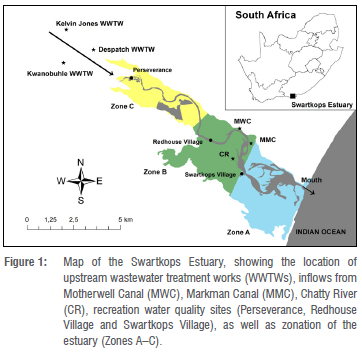
The Swartkops Estuary (Figure 1) was selected as a case study to demonstrate the application of ecosystem accounting at the individual estuary level based on the availability of extent (spatial) and condition data recently generated as part of a local flow requirement and restoration project24, thus providing a sound foundation for the development of a range of accounts. The estuary is a permanently open system located in the warm temperate region of the Eastern Cape on the outskirts of Gqeberha (previously called Port Elizabeth) with a catchment area of 1390 km2. The estuary's length spans approximately 16.4 km, with the upper reaches being about 90 m wide with steep banks and winding channels becoming shallower, wider, and straighter towards the mouth. The lower reaches have extensive intertidal mudflats, islands, salt marshes and sandbanks. The estuary is relatively shallow with water depth generally ranging between 1 m and 2 m.24 The boundaries of the EFZ of the Swartkops Estuary, comprising an area of 2 861 ha, are defined by23:
• Downstream boundary - 33°51'53.14"S, 25°37'57.41"E (estuary mouth)
• Upstream boundary - 33°48'45.20"S, 25°31'29.20"E (at Perseverance)
• Lateral boundaries - 5 m contour above mean sea level along each bank
The zonation of the estuary used in the flow requirement and restoration study24 was also adopted as the three BSUs for the Swartkops Estuary ecosystem accounts (Figure 1). The zones were based on general homogeneity in bathymetry, salinity patterns and water retention. Zone A comprises the larger and deeper lower reaches (1103 ha), Zone B is the middle reaches (1015 ha), and Zone C (743 ha) is the shallower upper reaches.
Swartkops is a highly urbanised estuary with large areas transformed by industrial and residential development. Effluent from three wastewater treatment works - namely Kelvin Jones (21 120 m3/day), KwaNobuhle (1980 m3/day) and Despatch (4410 m3/day) - enters just upstream of the estuary.24 The estuary also receives contaminated urban run-off through the Chatty River, draining highly populated townships, the Markman Canal, draining industrial areas, and the Motherwell Canal that drains the township of Motherwell.35 As a result of these effluent discharges and increased stormwater run-off from hardened urban areas, the present mean annual run-off is approximately 41% higher than the natural mean annual run-off. Construction of roads, bridges, railways, and saltpans in the floodplain also contributed to habitat loss.24,36 The system is also heavily utilised by local communities for fishing and bait collection.24
Four abiotic habitats were considered, namely: open water areas, mud and sand flats, beach and dunes, and floodplains (distinguishing between undeveloped and developed floodplains).14 Floodplain habitat included all dynamic areas influenced by long-term estuarine sedimentary processes, as captured within the EFZ. Open water areas are highly dynamic and ephemeral, changing in response to numerous factors such as mouth state, river inflow conditions and state of the tide.
To account for biotic habitat extent, we used the key estuarine vegetation types as defined in Adams et al.37 and updated in the NBA 201823 and Adams et al.24, that is: intertidal salt marsh, supratidal salt marsh, submerged macrophytes, and reeds and sedges. Unlike estuarine abiotic habitats, biotic habitats do not occur continuously within the EFZ. Rather they are a mosaic of biotic habitats 'superimposed' onto abiotic habitats, and as a result total biotic habitat area does not necessarily add up to 'total EFZ area'. For the Swartkops Estuary, aerial photographs of 50 cm resolution were used to manually digitise change in the extent of the key biotic habitats. This was done using ArcGIS 10.6.1 on an average scale of 1:2000. This fine-scale mapping is preferred over the supervised and unsupervised classification methods using satellite imagery because habitat in estuaries is often only a few square metres in extent. Present extent was verified with ground-truthing. Older aerial imagery and historical data were used to determine change in extent over time. Aerial photographs of 50 cm resolution were obtained from the Chief Directorate: National Geo-Spatial Information (http://www.cdngiportal.co.za/cdngiportal/; their images date back to the 1940s.
For the carbon sequestration accounts, available data were sourced from Van Niekerk et al.23, Adams et al.24 and Raw et al.25 The ecosystem account for recreation was constructed using available microbiological indicator data (Swartkops Conservancy, unpublished data) together with national water quality guidelines for recreation, evaluating suitability based on estimated gastrointestinal and febrile respiratory health risks.33
Results
Extent accounts
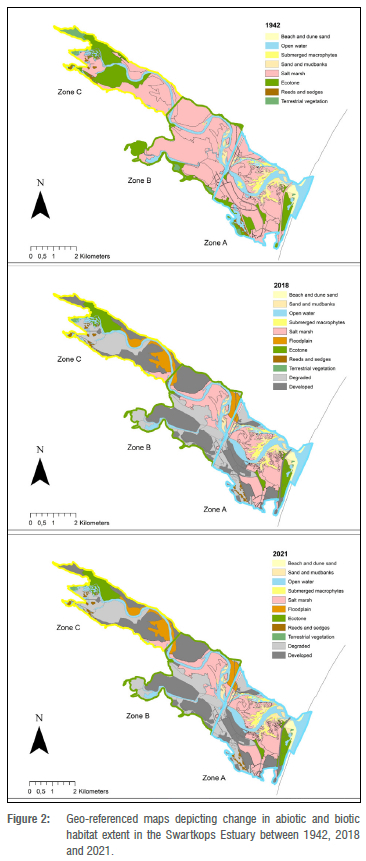
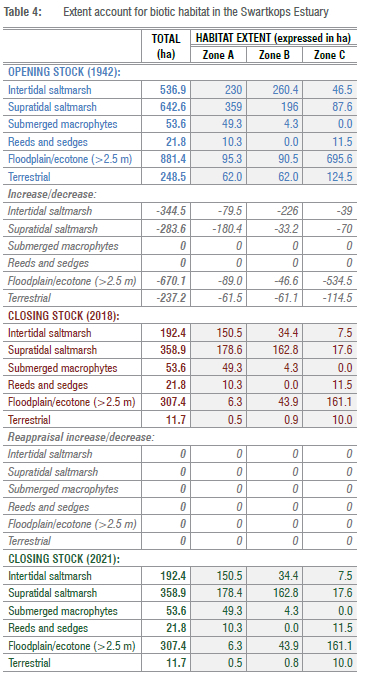
Table 3 presents the abiotic habitat extent account for the Swartkops Estuary, reflecting change from 1942 to 2018, and then 2021, while Figure 2 shows the geo-referenced maps from where data were derived.23,24
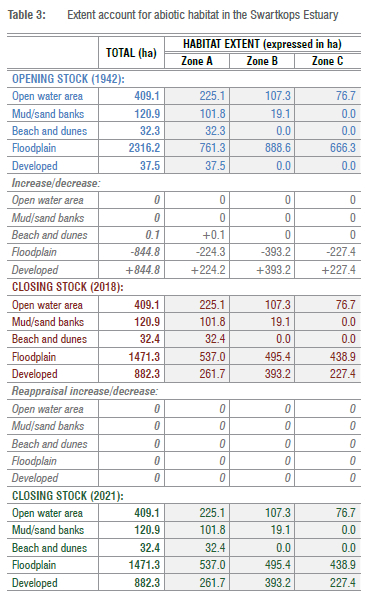
Floods play a key role in maintaining sediment processes and the longterm equilibrium of the sediment dynamics in the Swartkops system. Because floods have not been affected significantly by water resource developments in the catchments, the EFZ extent and associated abiotic habitats in the Swartkops Estuary did not change markedly between 1942 and 2018, except in the floodplains. By 1942, about 37.5 ha of the floodplain had already been developed, mostly in the lower reaches (Zone A). Between 1942 and 2018, another 844.8 ha of floodplain was lost due to development, with most of this occurring in Zone B (393.2 ha). This loss was mainly attributed to residential and industrial development, stemming from housing, bridges, roads, railways, mining, and saltpans.38,39 No additional losses were evident in the 2021 reappraisal, possibly owing to the relatively short time between 2018 and 2021.
Table 4 presents the biotic habitat extent account for the Swartkops Estuary, reflecting change from 1942 to 2018, and to 2021, while Figure 2 displays the spatial changes between the different periods.23,24 The estuary has extensive areas of supratidal and intertidal salt marsh and large stands of the endangered seagrass Zostera capensis. The latter occurs in the lower intertidal zone and is abundant in the middle and lower estuary reaches. An additional seagrass species Halophila ovalis is also present in subtidal areas, but its precise distribution is unknown.
The dominant species in the supratidal salt marsh include Salicornia pillansii, Suaeda fructicosa, Sporobolus virginicus and Disphyma crassifolium. Important intertidal species are Spartina marítima, Salicornia tegetaria, Triglochin spp. and Limonium spp. Cotula coronopifolia occurs amongst the salt marsh habitat in the middle reaches where the water is more brackish. Floodplain species such as Lycium cinereum and Suaeda fructicosa occur together with Stenotaphrum secundatum and S. pillansii in the upper reaches of the Swartkops Estuary.40 Supratidal salt marsh species such as Disphyma crassifolium grow best at a salinity of 1-19 under dry conditions.41 Reeds and sedges mainly occur in the upper reaches and at freshwater seepage sites but are not extensive due to the disturbance of the banks. The common reed Phragmites australis is dominant. Macroalgae (seaweeds) are common in the saline areas of the estuary and include Codium tenue (Kutzing) Kutzing, Ulva rigida C. Agardh, Gracillaria gracilis and Hypnea viridis Papenfuss.
The biotic extent account indicates that, overall, there has been a 344.5 ha decrease in intertidal salt marsh and a 283.6 ha decrease in supratidal salt marsh area, with most losses occurring in Zones A and B. There was also a 670.1 ha and 237.2 ha loss in floodplain/ecotone and terrestrial habitat, respectively, but mostly in Zone C. As with changes in abiotic floodplain area, land use development was largely responsible for losses in biotic habitats, with most of the development occurring in the floodplain/ecotone and terrestrial habitats.39
Condition account
The condition account for the Swartkops Estuary is provided in Table 5, with Figure 3 providing a graphic overview of the changes from ~1750 (natural), 2018 and 2021. At the estuary level, condition accounts should ideally also distinguish between different zones in a system. However, available data on estuary condition did not disaggregate ratings into the three zones, except for 'salinity', 'water quality' (including dissolved oxygen, turbidity, nutrients, and toxic substances) and 'microalgae' in the 2021 account. Notwithstanding, to demonstrate the construct of a condition account at the estuary level, the overall condition ratings for various indicators were used as proxies for condition in each zone, except for the above three indicators in the 2021 account. In the case of the Swartkops Estuary, data on the ecological condition of the system were not available for 1942. As a result, the opening account was equated to the pre-industrial natural, which has been assumed as ~1750. Comparing the opening account with the 2018 closing account, the condition of the Swartkops Estuary declined by 47%, with the deterioration in biotic condition (52%) being higher than the decline in abiotic condition (42%).
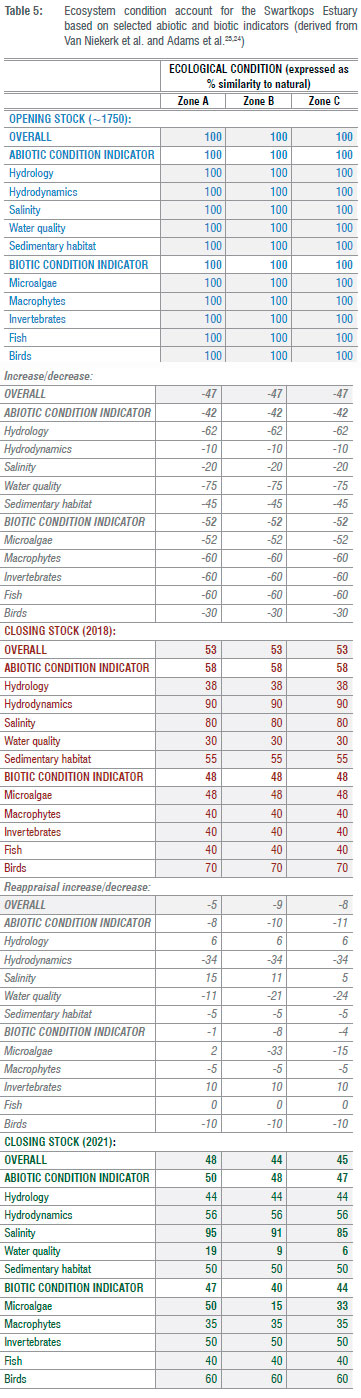
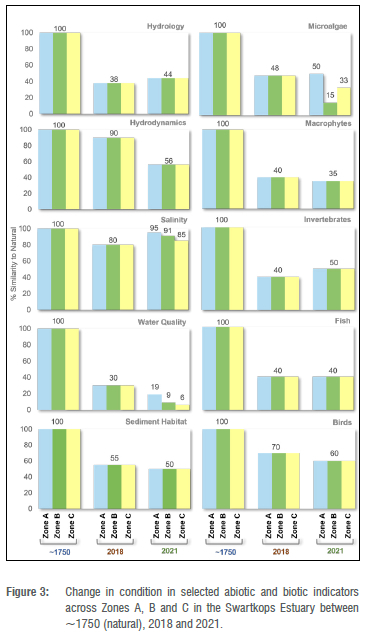
Following a reappraisal in 2021, the estuary's condition across Zones A, B and C deteriorated further by 5%, 9% and 8%, respectively. Here the additional deterioration was most evident in the abiotic components (8%, 10% and 11%, respectively), driven by shifts in hydrodynamics and water quality indicators (Table 5) due to an increase in input from wastewater treatment works. The biotic condition across Zones A, B and C also deteriorated by a further 1%, 8% and 4%, respectively. This was largely associated with a deterioration in microalgae condition, linked to the deterioration in water quality (increased nutrient enrichment) during this period.
Pressure account
The pressure account for the Swartkops Estuary is provided in Table 6 and depicts the change from natural to 2018, and then 2021. As available data on pressures were not disaggregated into the smaller BSUs (or zones), the pressure account reverts to the EFZ as its BSU, and therefore reflects an overall pressure rating for the Swartkops Estuary. We focused on five of the six key pressure categories identified for South African estuaries, and encountered in the Swartkops, that is: flow modification, land use and development, exploitation of living resources (fishing), pollution (wastewater disposal), and biological invasion (plants and fish).32 The Swartkops Estuary is a permanently open system and, as yet, mouth manipulation has not emerged as a key pressure and was therefore not included here.
Flow modification increased freshwater inputs to the system by 41%, mainly from wastewater treatment works and urban stormwater discharges, resulting in very high pressure on the system. Similarly, land use and development within the EFZ have resulted in a loss of 847.7 ha, emerging as a very high pressure. Fishing pressures are also very high in this system with up to 47 tons of fish harvested annually, mostly consisting of undersized juveniles and/or threatened species, and through the use of unsustainable practices such as gill netting. Approximately 27 510 m3 wastewater is discharged daily into the system, resulting in very high pollution pressures.
The Swartkops is also under high pressure from a combination of invasive aquatic and terrestrial plant species. Noteworthy is the high abundance of alien aquatic species such as Azolla filliculoides, Salvinia molesta and Eicchornia crassipes, especially in the upper reaches (Zone C). Two carnivorous invasive fish species - largemouth bass Micropterus salmoides and smallmouth bass Micropterus dolomieu -, recorded in the estuary contribute to the high pressure from such alien invasion, especially in the upper fresh and more brackish regions (Zones B and C), thereby also affecting connectivity between the estuary and river.
Ecosystem service accounts
Carbon sequestration
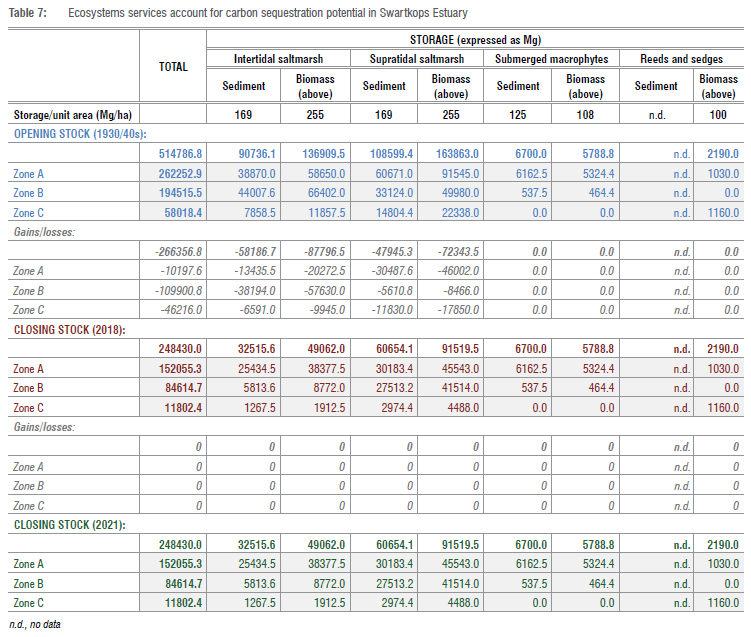
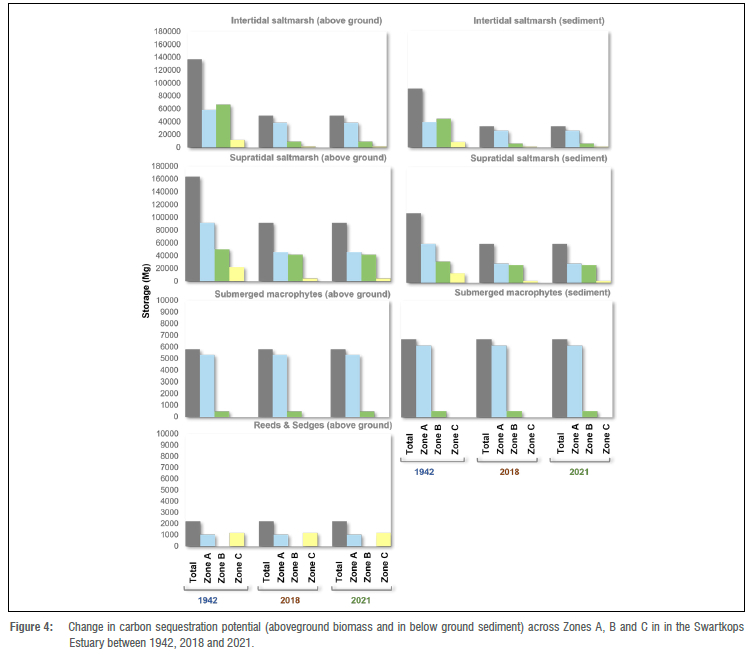
Table 7 presents the physical ecosystem service account for the carbon sequestration of the Swartkops Estuary, based on the extent of important blue and teal carbon vegetation types (see Table 4), with Figure 4 graphically showing change between 1942, 2018 and 2021. The data on storage per unit area were sourced from Raw et al.25 While results between 2018 and 2021 did not show any marked change in carbon sequestration potential, a nett loss of 266 356.8 Mg (sediment plus biomass [above]) occurred between 1942 and 2018, largely attributed to a loss in intertidal and supratidal salt marsh habitat (Table 4). The highest loss in carbon sequestration potential was encountered in Zone B (109 900.8 Mg), followed by Zone C (46 216.0 Mg) and then Zone A (10 197.6 Mg) (Table 4).
Recreational use
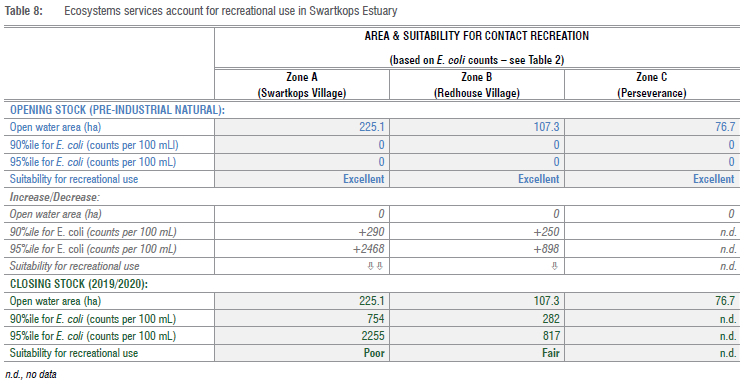
Table 8 demonstrates a physical ecosystem service account for recreational use in the Swartkops Estuary. Drawing on the extent account (Table 3), the open water area potentially available for water recreational activities may not have changed over time, although this does not mean that the entire area is suitable for recreational activities. To reflect change in condition, focusing on human health, Escherichia coli data - collected by the Swartkops Conservancy at popular recreation spots at Settlers Bridge and Swartkops Village (Zone A) and Perseverance (Zone C) (Swartkops Conservancy, unpublished data) - were consulted. However, only Swartkops Village (Zone A) and Redhouse Village (Zone B) had sufficient data over a one-year period (2019/2020) to demonstrate the application of the recreational guidelines to ecosystems accounting (using a percentile calculation approach developed globally - see Table 2) (Table 8).
Based on 2019/20 data, Swartkops Village (Zone A) was categorised as 'poor' (Table 2 - not suitable for recreational use), representing a marked deterioration from natural when it was assumed that conditions would have been representative of 'excellent' without any human bacterial contamination. Conditions at Redhouse Village (Zone B) also showed deterioration but are still categorised as 'fair' (Table 2), meeting the minimum requirements for recreational use.
Discussion
Globally, most natural capital or ecosystem accounts amalgamate estuaries either into wetland accounts or coastal accounts. However, estuaries offer disproportionally higher socio-economic benefits to society per unit area compared to other natural systems (e.g. nursery areas for important fisheries, carbon sequestration).17
Therefore, in South Africa, these important transitional water ecosystem types have been elevated through the provision of separate estuarine ecosystem accounts.14 This allows for reporting of change at meaningful scales, which is not possible if estuaries are combined in ecosystem accounting with freshwater wetlands or other marine habitats.
In this study, we built on the country-level ecosystem account previously developed for South African estuaries11 by developing an approach for physical ecosystem accounts at the local estuary level, addressing one of the key obstacles previously identified for application at this scale17-19. In so doing, we are introducing the advantages of ecosystem accounting for decision-making to local governance mechanisms.17 Further, we demonstrated alignment of this method with other existing resource management tools in South Africa, such as the ecological flow requirement methods for estuaries26-29, the national Estuarine Health Index26,30 and the National Biodiversity Assessment23.
The method was then applied to the Swartkops Estuary, depicting ecosystem changes, drawing on available data and information but using an accounting format comparable with socio-economic information systems, such as the System of National Accounts. The abiotic habitat extent account showed a significant additional loss in intact floodplain (844.9 ha) between 1942 and 2018, especially in Zone B (393.2 ha loss). Over the same period, 344.5 ha of intertidal salt marsh and 283.6 ha of supratidal salt marsh were lost, mainly from Zones A and B. The floodplain/ecotone and terrestrial habitats also decreased by 670.1 ha and 237.2 ha, respectively. No measurable habitat losses were evident between 2018 and the 2021 reappraisal. The condition account showed that the Swartkops Estuary declined about 47% in overall condition by 2018 compared with pre-industrial natural, with a further loss of 5%, 9% and 8% in Zones A, B and C, respectively, by 2021. The pressure account demonstrates a simple and practical manner to reflect possible causes of change in estuarine extent and condition, showing that, in the Swartkops flow modification, land use and development and pollution contribute most to the decline in ecosystem health. Because the pressure account largely categorises pressures on a sectoral basis it can easily inform sectoral management planning. For example, in South Africa, responsibility for flow modification management lies with the department responsible for water, while the department responsible for fisheries is mandated to address the exploitation of living resources (fisheries). Pollution (wastewater disposal) is a joint responsibility of the departments responsible for water and the environment. The ecosystem service account for carbon sequestration showed a nett loss of 266 356.8 Mg in carbon sequestration potential between 1942 and 2018, mostly driven by losses in intertidal and salt tidal saltmarsh.
The account for recreational use showed that, in 2019/2020, water quality in the estuary had deteriorated significantly from natural across most zones.
While this study successfully demonstrated the application of ecosystem accounting at the estuary level, it can certainly benefit from incremental improvement in future, following an adaptive management approach. Specifically, to better resolve spatial resolution in the condition accounting, future research should focus on the disaggregation of condition ratings of ecosystem components into the different zone within an estuary. Greater spatial resolution in condition accounting will assist in trade-off interventions across zones within an estuary. Also, future research should investigate approaches by which to disaggregate conditions of abiotic and biotic components, requiring refinement of the EHI method. For carbon sequestration accounting, further research is needed on the refinement of carbon storage values for South African estuaries. Preliminary data suggest that storage values may be lower than those reported globally due to the more arid nature of South Africa's estuaries. While the ecosystem service account for recreation does demonstrate the application of such an account, it is acknowledged that results are based on single data points within zones and may not represent conditions across the entire zones. Therefore, for future accounting, it is recommended that monitoring sites be extended to all important recreational sites within zones to better reflect broader zonal conditions. Also, it is recommended that microbiological data (E. coli, preferably also Enterococci) be collected routinely at biweekly intervals in alignment with the national guideline requirements.33
Another critically important ecosystem service of estuaries is nursery function; it is therefore recommended that future research also focuses on the development thereof. Such accounts should consider fish lifecycle requirements and the location and condition of key habitats that support these. Internationally, ecosystem service accounts for fishing reflect only stock abundance as a measure of extent. However, fish stocks have geographical ranges which can expand, shrink or split through direct pressures (e.g. over-exploitation of fishing resources) or indirect causes (climate change). Therefore, it is important that the spatial element of a stock extent also be captured in these ecosystem accounts to reflect underlying ecosystem shifts in resource abundance. Further, given the socio-economic value of estuaries, and to reflect the opportunity cost of declining extent and condition at the estuary level, future monetary accounts for key ecosystem services such as carbon sequestration, recreational use, and nursery function should build and align with the physical ecosystem accounts presented here.
Finally, reflecting on the three primary applications previously identified for ecosystem accounting2, these accounts also can play a key role in informing decision-making in restoration prioritisation within individual estuaries in support of the UN Decade on Ecosystem Restoration (2021- 2030)21,22, for example, by assisting in the identification of the scale and nature of investment required for restoration17, or informing options for offsetting irreversibly degraded areas in one zone with restoration or maintenance of similar habitats in another. Many large-scale donor-funded projects require strict project monitoring and reporting of both project efforts and project outcomes. Given that, for example, the restoration of blue carbon habitats may far exceed project lifespans, it is critically important that a standardised long-term reporting framework be introduced that can measure both short-term efforts (e.g. extent of restored land) and long-term benefits (e.g. increased carbon stock over time or contribution to climate mitigation). Ecosystems accounts applied at the local level provide such a standardised approach. The restoration of estuaries is urgent considering the increasing pressures and loss of ecosystem services such as nursery habitat provision, coastal protection, blue carbon storage and contributions towards climate change mitigation. Restoration of estuarine ecosystem services would contribute billions to the national economy.
Acknowledgements
The DSI/NRF Community of Practice in the Western Indian Ocean: Ocean Accounts Framework (CoP-OAF) and the Council for Scientific and Industrial Research (CSIR), through the Department of Science and Innovation's Parliamentary Grant, are thanked for funding S.T and L.v.N.
The National Research Foundation of South Africa through the support of the DSI/NRF Research Chair in Shallow Water Ecosystems supported J.B.A. and is thanked for funding (UID 84375). Dr Stephen Lamberth (DFFE) is thanked for his input on invasive alien fish, fishing pressure and nursery function in the Swartkops. Dr Monique Nunes (nMu) is thanked for preparing the study site map.
Competing interests
We have no competing interests to declare.
Authors' contributions
S.I: Formulation of overarching construction and content of manuscript, analysis of available data and information, preparation and creation of manuscript. L.v.N.: Formulation of overarching construction and content of manuscript, analysis of available data and information, significant contribution to preparation and creation of manuscript. J.B.A.: Analysis of available data and information, significant contribution to preparation and creation of manuscript. T.R.: Analysis of available data and information.
References
1. Eden B, Hein L. Towards a consistent approach for ecosystem accounting. Ecol Econ. 2013;90:41-52. https://doi.org/10.1016/j.ecolecon.2013.03.003 [ Links ]
2. Hein L, Obst C, Edens B, Remme RP Progress and challenges in the development of ecosystem accounting as a tool to analyse ecosystem capital. Curr Opin Environ Sustain. 2015;14:86-92. https://doi.org/10.1016/j.cosust.2015.04.002 [ Links ]
3. Farrell CA, Coleman L, Kelly-Quinn M, Obst CG, Eigenraam M, Norton D, et al. Applying the System of Environmental-Economic Accounting - Ecosystem Accounting (SEEA-EA) framework at catchment scale to develop ecosystem extent and condition accounts. One Ecosyst. 2021;6, e65582. https://doi.org/10.3897/oneeco.6.e65582 [ Links ]
4. Grilli G, Ferrini S, Luisetti T, Turner RK. The role of choice experiments in natural capital accounting approaches: Fast track versus simulated exchange value in the Deben Estuary saltmarshes. J Environ Plan Manag. 2022;65(7):1281-1300. https://doi.org/10.1080/09640568.2021.1957794 [ Links ]
5. Natural Capital Coalition. Natural Capital Protocol Principles and Framework [webpage on the Internet]. c2016 [cited 2022 Dec 01]. Available from: https://naturalcapitalcoalition.org/natural-capital-protocol/ [ Links ]
6. Hooper T, Börger T, Langmead O, Marcone O, Rees SE, Rendon O, et al. Applying the natural capital approach to decision making for the marine environment. Ecosyst Serv. 2019;38:100947. https://doi.org/10.1016/j.ecoser.2019.100947 [ Links ]
7. Global Ocean Accounts Partnership (GOAP). Technical guidance on ocean accounting for sustainable development. Sydney: GOAP; 2019. Available from: https://www.oceanaccounts.org/technical-guidance-on-ocean-accounting-2/ [ Links ]
8. United Nations (UN). System of Environmental-Economic Accounting 2012: Central framework. New York: UN; 2014. Available from: https://seea.un.org/content/seea-central-framework [ Links ]
9. United Nations (UN). System of Environmental-Economic Accounting 2012: Experimental ecosystem accounting. New York: UN; 2014. Available from: https://seea.un.org/ecosystem-accounting [ Links ]
10. Chenoweth JJ, Anderson AR, Kumar P, Hunt WF, Chimbwandira SJ, Moore TLC. The interrelationship of green infrastructure and natural capital. Land Use Policy. 2018;75:137-144. https://doi.org/10.1016/j.landusepol.2018.03.021 [ Links ]
11. United Nations (UN). Technical recommendations in support of the System of Environmental-Economic Accounting 2012: Experimental ecosystem accounting. New York: UN; 2019. Available from: https://seea.un.org/ecosystem-accounting [ Links ]
12. Wang T, He GS, Zhou QL, Gao JZ, Deng LJ. Designing a framework for marine ecosystem assets accounting. Ocean Coast Manag. 2018;163:92-100. https://doi.org/10.1016/j.ocecoaman.2018.05.019 [ Links ]
13. Schenau S, Rietveld H, Bosch D. Natural capital accounts for the Dutch North Sea 2019 [webpage on the Internet]. c2019 [cited 2022 Dec 05]. Available from: https://www.cbs.nl/en-gb/background/2019/51/natural-capital-accounts-for-the-dutch-north-sea-2019 [ Links ]
14. Van Niekerk L, Taljaard S, Adams JB, Lamberth SJ, Weerts SP Experimental ecosystem accounts for South Africa's estuaries: Extent, condition and ecosystem services accounts. Report no. CSIR/SPLA/SECO/IR/2020/0026/A. Stellenbosch: Council for Scientific and Industrial Research; 2020. Available from: https://seea.un.org/content/experimental-ecosystem-accounts-south-africas-estuaries-extent-condition-and-ecosystem [ Links ]
15. Eigenraam M, McCormick F, Contreras Z. Marine and coastal ecosystem accounting: Port Phillip Bay. Report to Commissioner for Environmental Sustainability, Department of Environment, Land, Water and Planning. Melbourne: State of Victoria; 2016. Available from: https://seea.un.org/content/marine-and-coastal-ecosystem-accounting-port-phillip-bay [ Links ]
16. Hinson C, O'Keeffe J, Mijic A, Bryden J, Van Grootveld J, Collins AM. Using natural capital and ecosystem services to facilitate participatory environmental decision making: Results from a systematic map. People Nat. 2022;4:652-668. https://doi.org/10.1002/pan3.10317 [ Links ]
17. Dowdall L, Bowe C, Kirby JR. The Natural Capital approach: A framework for the successful recovery of nature in estuaries. Ecol Solut Evid. 2022;3, e12161. https://doi.org/10.1002/2688-8319.12161 [ Links ]
18. Burdon D, Potts T, Barnard S, Boyes SJ, Lannin A. Linking natural capital, benefits and beneficiaries: The role of participatory mapping and logic chains for community engagement. Environ Sci Policy. 2022;134:85-99. https://doi.org/10.1016/j.envsci.2022.04.003 [ Links ]
19. Cosgrove P. Suffolk marine pioneer: Lessons and recommendations for applying the natural capital approach in England [document on the Internet]. c2020 [cited 2022 Dec 05]. Available from: https://www.suffolkcoastandheaths.org/wp-content/uploads/2021/01/2020-Suffolk-Marine-Pioneer-Applying-Natural-Capital-Approach-Gudiance.pdf [ Links ]
20. Barbier EB. The protective value of estuarine and coastal ecosystem services in a wealth accounting framework. Environ Resour Econ. 2016;64:37-58. https://doi.org/10.1007/s10640-015-9931-z [ Links ]
21. United Nations (UN). The UN Decade on Ecosystem Restoration 2021-2030. Prevent, halt and reverse the degradation of ecosystems worldwide. New York: UN; 2020. Available from: https://www.decadeonrestoration.org/ [ Links ]
22. Adams JB, Whitfield AK, Van Niekerk L. A socio-ecological systems approach towards future research for the restoration, conservation and management of southern African estuaries. Afr J Aquat Sci. 2020;45(1-2):231-241. https://doi.org/10.2989/16085914.2020.1751980 [ Links ]
23. Van Niekerk L, Adams JB, Lamberth S, MacKay F, Taljaard S, Turpie J, et al. South African National Biodiversity Assessment 2018: Technical report. Volume 3: Estuarine realm. Report number CSIR/SPLA/EM/EXP/2019/0062/A. Stellenbosch: Council for Scientific and Industrial Research; 2019. Available from: http://opus.sanbi.org/handle/20.500.12143/6373 [ Links ]
24. Adams JB, Hughes D, James N, Kibble R, Lemley D, Rishworth G, et al. Swartkops Estuary: Present ecological status and future restoration scenarios. Re-evaluating the present ecological status and recommended ecological category, as well as consequences of future climate change, urbanisation and restoration scenarios. Institute for Coastal and Marine Research report no. 48. Gqeberha: Nelson Mandela University; 2021. [ Links ]
25. Raw J, Tsipa V Banda S, Riddin T, Van Niekerk L, Adams JB. Scoping study: A blue carbon sinks assessment for South Africa. Project 83360258 funded by GIZ: Deutsche Gesellschaft für Internationale Zusammernarbeit GmbH for the Department of Environment Forestry and Fisheries, South Africa. Cape Town: South African Department of Environment Forestry and Fisheries; 2021. [ Links ]
26. South African Department of Water Affairs and Forestry (DWAF). Resource directed measures for protection of water resources: Methodology for the determination of the ecological water requirements for estuaries. Version 2.1. Pretoria: DWAF; 2008. [ Links ]
27. Van Niekerk L, Taljaard S, Adams JB, Lamberth SJ, Huizinga P Turpie JK, et al. An environmental flow determination method for integrating multiple scale ecohydrological and complex ecosystem processes in estuaries. Sci Total Environ. 2019;56(15):482-494. https://doi.org/10.1016/j.scitotenv.2018.11.276 [ Links ]
28. Van Niekerk L, Adams JB, Allen D, Taljaard S, Weerts S, Louw D, et al. Assessing and planning future estuarine resource use: A scenario-based regional scale freshwater allocation approach. Sci Total Environ. 2019:657(20):1000-1013. https://doi.org/10.1016/j.scitotenv.2018.12.033 [ Links ]
29. Taljaard S, Lemley DA, Van Niekerk L. A method to quantify water quality change in data limiting estuaries. Estuar Coast Shelf Sci. 2022;272, Art. #107888. https://doi.org/10.1016/j.ecss.2022.107888 [ Links ]
30. Turpie JK, Taljaard S, Van Niekerk L, Adams JB, Wooldridge T, Cyrus D, et al. The Estuary Health Index: A standardised metric for use in estuary management and the determination of ecological water requirements. WrC report no. 1930/1/12. Pretoria: Water Research Commission; 2012. [ Links ]
31. Van Niekerk L, Adams JB, Bate GC, Forbes N, Forbes A, Huizinga P et al. Country-wide assessment of estuary health: An approach for integrating pressures and ecosystem response in a data limited environment. Estuar Coast Shelf Sci. 2013;130:239-251. https://doi.org/10.1016/j.ecss.2013.05.006 [ Links ]
32. Van Niekerk L, Taljaard S, Lamberth SJ, Adams JB, Weerts SP MacKay FC. Disaggregation and assessment of estuarine pressures at a country-level to better inform management and resource protection. Afr J Aquat Sci. 2022;47(2):127-148. https://doi.org/10.2989/16085914.2022.2041388 [ Links ]
33. Adams JB, Pretorius L, Snow JC. Deterioration in the water quality of an urbanised estuary with recommendations for improvement. Water SA. 2019;45(1):86-96. https://doi.org/10.4314/wsa.v45i1.10 [ Links ]
34. South African Department of Environmental Affairs (DEA). South African water quality guidelines for coastal marine waters. Volume 2: Guidelines for recreational use. Cape Town: DEA; 2012. Available from: https://www.dffe.gov.za/sites/default/files/legislations/water_qualityguidelines_0.pdf [ Links ]
35. Council of European Community (CEC). Council Directive 2006/7/EC of the European Parliament and of the Council of 15 February 2006 concerning the management of bathing water quality and repealing Directive 76/160/ EEC. Published in Official Journal of the European Communities [webpage on the Internet]. c2006 [cited 2022 Dec 05]. Available from: http://europa.eu/legislation_summaries/consumers/consumer_safety/l28007_en.htm\ [ Links ]
36. Baird D, Hanekom NM, Grindley JR. Estuaries of the Cape: Part 2: Synopsis of available information on individual systems - Report no. 23 - Swartkops. CSIR report no. 422. Pretoria: Council for Scientific and Industrial Research; 1986. [ Links ]
37. Adams JB, Veldkornet D, Tabot P Distribution of macrophyte species and habitats in South African estuaries. S Afr J Bot. 2016;107:5-11. https://doi.org/10.1016/j.sajb.2016.08.001 [ Links ]
38. Adams JB, Riddin T. State of knowledge: Conservation and management of the Swartkops Estuary. Benguela Current Convention Report September 2020. Institute for Coastal and Marine Research. Gqeberha: Nelson Mandela University; 2020. [ Links ]
39. Bornman TG, Schmidt J, Adams JB, Mfikili AN, Farre RE, Smit AJ. Relative sea-level rise and the potential for subsidence of the Swartkops Estuary intertidal salt marshes, South Africa. S Afr J Bot. 2016;107:91-100. https://doi.org/10.1016/j.sajb.2016.05.003 [ Links ]
40. Schmidt J. Influence of predicted sea level rise on the salt marsh of the Swartkops, Kromme and Knysna estuaries [MSc thesis]. Gqeberha: Nelson Mandela University; 2013. [ Links ]
41. Matabane R. Tolerance of salt marsh ecotone species to salinity and inundation [MSc thesis]. Gqeberha: Nelson Mandela University; 2018. [ Links ]
 Correspondence:
Susan Taljaard
Email: staljaar@csir.co.za
Received: 06 July 2022
Revised: 14 Dec. 2022
Accepted: 05 Jan. 2023
Published: 29 Mar. 2023
Editor: Sydney Moyo
Funding: South African National Research Foundation, South African Department of Science and Innovation

