


Services on Demand
Article
 English (pdf)
 Article in xml format
 Article references
Indicators

Related links
-
 Cited by Google
 -
 Similars in Google
Share

 Permalink
South African Journal of Science
On-line version ISSN 1996-7489
Print version ISSN 0038-2353
S. Afr. j. sci. vol.119 n.1-2 Pretoria Jan./Feb. 2023
http://dx.doi.org/10.17159/sajs.2023/13842
RESEARCH ARTICLE
A lifecycle-based evaluation of greenhouse gas emissions from the plastics industry in South Africa
Taahira GogaI; Kevin HardingII; Valentina RussoIII; Harro von BlottnitzI
IEnvironmental and Process Systems Engineering Research Group, Department of Chemical Engineering, University of Cape Town, Cape Town, South Africa
IIIndustrial and Mining Water Research Unit (IMWaRU), School of Chemical and Metallurgical Engineering, University of the Witwatersrand, Johannesburg, South Africa
IIISustainability, Economics and Waste Research Group, Smart Cluster Council for Scientific and Industrial Research (CSIR), Stellenbosch, South Africa
ABSTRACT
Increased production rates of plastic and limited disposal methods have fed concerns regarding environmental degradation. Whilst most of the focus is on plastic litter and marine pollution, greenhouse gas emissions of plastic over its value chains are also of interest and non-trivial at the global scale. To quantify the global warming potential of the local plastics industry, a lifecycle-based carbon footprint is presented encompassing activities such as resource extraction, polymer production and conversion, recycling, and disposal stages. The South African plastics sector is estimated to have emitted 15.8 Mt CO2eq in 2015, with the granulate production stage bearing the highest environmental load. The consumption of fossil fuel based electricity and the burning of plastic waste also contribute notably to the overall emissions. Additionally, the recycling process in 2015 saved approximately 1.4 Mt of greenhouse gas emissions.
SIGNIFICANCE:
• Research has typically focused on the environmental impacts of the end-of-life stage of plastics, namely disposal and recycling. Despite growing concern, the global warming potential of the local plastics sector across its value chain has not been investigated.
• Greenhouse gas emissions arising from the South African plastic sector are non-trivial and are estimated to total 15.8 Mt CO2eq in 2015.
• Amongst the lifecycle stages, the resin production process had the highest contribution in South Africa due to the country's coal-based monomer production process.
Keywords: plastics, greenhouse gas, carbon footprint, life cycle, South Africa
Introduction
Plastics have become ubiquitous in modern-day existence due to their unique properties, lending themselves to a wide range of applications, with production having increased at an annual global growth rate of 8.4% from 2 Mt in 1950 to 380 Mt in 2015. At the current trajectory, plastic production would reach 1600 Mtpa in 2050.1 In 2015, Geyer et al.1 estimated that 60% of all plastics produced were discarded as waste and are accumulating either in landfills or in the environment with less than 10% having been recycled. The projected demand for plastics as well as the limitations of the current disposal methods raise questions regarding associated environmental impacts such as climate change and marine pollution.
Previously, research was centred around comparing the end-of-life options for plastic waste and analysing various disposal methods for specific plastic products.2,3 Although it was estimated that the chemical industry is responsible for approximately 15% of global greenhouse gas (GHG) emissions, the contribution of plastics to climate change from a lifecycle perspective was unknown.4 A recent study published by Zheng and Suh5 undertook to provide an initial estimate of a carbon footprint on a global scale. The results indicated that global plastics production in 2015 contributed approximately 1.7 Gt CO2eq, equivalent to 3.8% of the total GHG emissions for that year.
With South Africa's GHG emissions being 122% higher than the G20 average per capita6, carbon dioxide emissions need to be minimised in major industries. As the 32nd largest producer of plastics globally, and with one of the highest plastic consumption rates on the African continent with an average per capita consumption of 24.5 kg/year7, the South African plastics sector plays a significant role in the environmental and economic future of the country. To enable more informed debate, this paper presents an attempt to quantify GHG emissions of the South African plastics industry and value chain, using a lifecycle-based approach similar to Zheng and Suh5. As there is a single environmental impact being estimated, namely greenhouse gas emissions, the study is also referred to as a carbon footprint.
The plastics industry in South Africa
The South African plastics industry is well established with 1.8 million tons of polymer being converted into locally produced products in 2019.8 Just under half of this total was used in packaging (49% of the local market), becoming waste in less than a year, with longer-term applications used in the building and construction sector as well as agriculture. In terms of disposal, recent statistics indicate that one third of the population lack access to regular waste removal services.9 Consequently, an estimated 29% of domestic household waste is subject to what is termed 'self-help disposal'.10 Although the preferred current waste management method is recycling, the 'input recycling rate' is only 40.3% of short-lived plastics and only 17.7% of all converted plastic is recycled content.11 These waste collection gaps thus imply a few associated challenges.8 Among these is that the local waste recycling economy is largely driven by the informal waste sector.12 Furthermore, there is still a significant quantity of post-consumer material (599 kt/a according to the 2019 SA Plastics recycling survey) that is not or is unable to be recycled which is partially disposed of in compliant sanitary landfill sites but also leads to illegal dumping and littering.
The local chemical industry, which is responsible for half the polymers consumed in the country, has developed around the gasification of coal.13 Secunda Synfuel Operations produces synthetic liquid fuels via gasification followed by the proprietary Fischer-Tropsch synthesis process.14 Monomers are by-products of this coal-to-liquids fuel production process, which are then converted into polymers such as polypropylene and polyethylene. Therefore, Sasol's chemical production processes are highly integrated with their synfuels activities serving as a source of energy as well as chemical feedstock and intermediates. This unique situation highlights the intrinsic link between local coal supply, synfuel processing, and plastic production. In the context of a global lowering of CO2 emissions, the future of this coal-based emissions-intensive fuel and chemicals production activity is uncertain.
In Africa, life cycle assessment (LCA)-based research is limited, with few studies focusing on the quantification of plastic-related impacts. Sevitz et al.15 undertook a comparative environmental assessment study for paper and plastic carrier bags in South Africa. It was found that, amongst the dominant processes for the plastic bag life cycle, the electricity generation from coal as well as the coal gasification process had the highest contributions. In terms of end-of-life, Friedrich and Trois16 calculated and compared GHG emissions from waste management processes for municipalities in Africa, considering activities such as landfilling, recycling, and incineration. Results reveal that the greatest GHG savings are achieved through recycling with the potential for greater savings in countries where coal is the primary source of energy production. The Council for Scientific and Industrial Research (CSIR) recently conducted a life cycle sustainability assessment of various grocery carrier bags, of which the majority were plastic.17 For the global warming impact category, it was reported that the fossil-based plastic reusable bags performed better than the biodegradable alternatives, whereas higher recycled content improved the environmental performance of single-use plastic bags. Another recent study by Goga et al.11 showed that increasing mechanical rates to achieve targets set by the South African Plastics Pact would have a significant impact on future virgin polymer demand and waste disposal flows.
LCA is a well-established technique for identifying and quantifying potential environmental impacts of product systems, and the number of LCA-related research studies in South Africa has grown in the past 5 years.18 The recently gazetted regulations pertaining to the extended producer responsibility schemes mandate producers to conduct LCAs in relation to identified products.19 Plastic products identified within the scope include plastic packaging, single-use plastic products, and biodegradable and compostable alternatives.
Method
We aimed to estimate the annual carbon footprint of the South African plastics sector. The method, which entails using a combination of mass flow data and emission factors to estimate GHG emissions for the local plastics system, was loosely based on the approach employed by Zheng and Suh5. The system boundary was demarcated to incorporate three lifecycle stages namely:
1. granulate production, which covered the polymer production processes;
2. conversion, which included activities that transform polymers into plastic products; and
3. end-of-life, which encompassed the final disposal and treatment of plastic waste post-use.
The reference year was set as 2015 due to the availability of material flow data. Total GHG emissions were calculated as the product of plastic production/waste generation and the polymer-specific lifecycle GHG emissions as shown in the following equation:
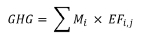
where Mi represents the annual South African production/waste generation of polymer type i in megatons, and EFi,j. represents the per-unit emissions factor for polymer type i at its lifecyde stage j in kg Co2/ megaton polymer.
The flow of plastics was modelled as a composite of six major polymer types consumed in South Africa - namely low-density polyethylene, high-density polyethylene, polypropylene, polyethylene terephthalate, polyvinyl chloride, and polystyrene (LDPE, HDPE, PP PET PVC, and PS) - as well as an additional polymer sub-group to represent 'other' plastics. Three lifecycle stages were considered, namely granulate production, conversion to products, and end-of-life, with the specific flows per polymer obtained from a detailed material flow analysis undertaken for the South African plastics industry in 2015.20 The GHG emission factors were derived mainly from the ecoinvent 3.6 Life Cycle Inventory database21 (using the cut-off allocation system model and the IPCC 2013 GWP 100a impact assessment method) and supplemented by literature sources. These international data sets were generally adapted by including South African energy and water data as well as incorporating the local plastic waste scenario. The terms GLO and RoW symbolise data sets that encompass 'global' and 'rest of world' data, respectively, while ZA is the country code for South African data. Once the material flows and emission factors per stage were obtained, total GHG emissions were calculated using spreadsheet-based modelling.
Granulate production
To accurately reflect the raw material extraction and monomer production activities that are specific to the South African context, certain factors were incorporated into the research methodology. These factors include the selection of locally produced ethylene and propylene, which are byproducts of the proprietary Fischer-Tropsch synthesis process employed by Sasol to produce synthetic fuels.14 Data for this coal-based pathway were obtained from the most recent version of the ecoinvent database. An average production mix was thereafter compiled with the feedstock consisting of 85% ethylene from the coal gasification process at Sasol with the balance coming from the local refining of imported crude oil.15
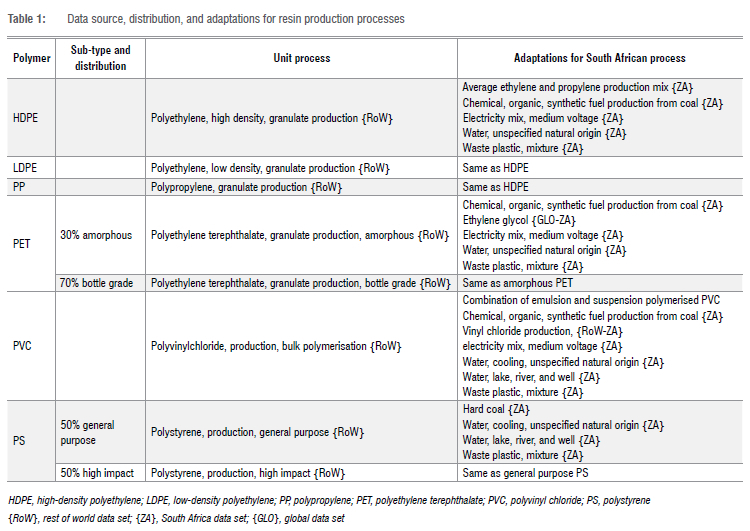
In terms of individual polymer flows, certain assumptions were made to obtain a realistic representation of the local industry. As the original source of material flow data presented a total flow of polyethylene, the proportion of low- to high-density polyethylene was ratioed according to domestic consumption statistics presented in the Plastics Industry Master Plan.22 Similarly, the ratio of bottle-grade to amorphous polyethylene terephthalate was modelled according to the percentage provided in the PET producer responsibility organisation guidelines.23 Other modelling characteristics include the division of polystyrene production to satisfy both general and high-impact applications. In addition to the local production of polymers, granulate from imported sources was also considered. Unit processes for the resin production process of the selected polymers obtained from the ecoinvent database21 as well as adaptations for the local process are presented in Table 1.
Conversion
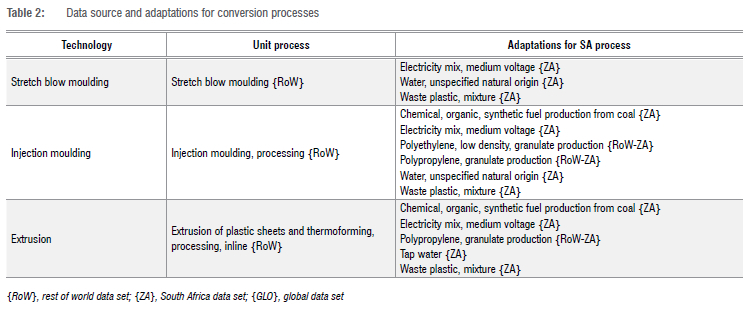
For the conversion stage, polymers are transformed into plastic products using technologies such as injection moulding, stretch blow moulding, and extrusion and thermoforming.24 In addition to incorporating local energy and water data, these data sets were adapted by including LDPE and PP granulate produced in South Africa to represent the bags used for collection and transport. Furthermore, the organic chemical data set that describes the detergents and solvents used was amended to the South African coal-based chemical production process. The selected data sets as well as the relevant adaptations are shown in Table 2.
End-of-life
The emission factor for recycling was obtained from Friedrich and Trois' development of GHG factors for recycling various materials in Africa25 and included the collection and transport of plastics as well as operations related to the direct recycling process (washing, drying, granulation, and palletisation). For the landfill process, 56.4% of landfill sites treating general waste are unlicensed and were thus considered unsanitary with the remainder of landfilled plastic waste assumed to be treated under sanitary landfill conditions.26 Unrecovered informal waste comprises plastic that is not collected by formal municipal management services. This is typically generated by informal settlements and rural communities that use other forms of disposal such as dumping, burning, and operation of unlicensed landfills. To characterise this flow, it was estimated that 60% of the waste was burnt with the remainder discarded in open dumps.27 The open dump data set was also used to describe the flow of litter. The corresponding ecoinvent unit processes for each end-of-life process along with the necessary adaptations are detailed in Table 3.
Results and discussion
Material flow data
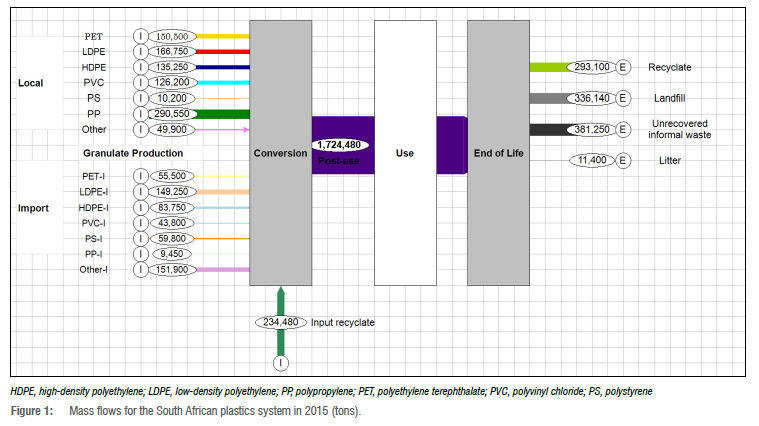
The disaggregation of total plastic flows to individual polymer streams per lifecycle stage is shown in the form of a Sankey diagram (Figure 1). The use stage (white process block) was excluded from the assessment as emissions can vary according to application and the source of the material flow analysis data20 did not include disaggregation per polymer. As the carbon footprint is based on the annual domestic consumption of plastics, the local production of polymers for the system was calculated as the total quantity of polymers produced in South Africa less exported polymers (primary form and intermediates). For the Group 7 plastics, i.e. other plastics, the re-export of the polymer was considered to maintain the integrity of the mass balance.
The material flows in Figure 1 show that polypropylene is the most highly produced local polymer. Polypropylene homopolymers are the only virgin raw material that are in abundance.22 In contrast, there is a shortage of ethylene monomer produced in South Africa. When disaggregating polyethylene, it is evident that this is mainly due to the demand for LDPE exceeding the supply. The Sankey diagram also indicates that polystyrene is mostly imported, which correlates with communication received by Polystyrene SA members stating that pellets are imported from countries such as Brazil, Singapore and Taiwan (Cloete V 2022, personal communication).
Post-use, the largest quantity of waste that is generated is classified as informal waste that remains uncollected and untreated. The output recycling rate (quantity of recyclate available as alternative raw material locally divided by the quantity of total waste) is 19.7%. As the amount of recyclate that feeds back into the system was unknown, a conservative virgin material substitution ration of 1:0.828 was applied. Although the quantity of litter at 11.4 kt is comparatively low, the lightweight nature of plastic implies that this amounts to a significant number of plastic items that end up residing in the natural environment.
Emission factors
The breakdown of the emission factors by lifecycle stage is shown in Table 4 where granulate production was further divided into local and imported production. In addition, the end-of-life stage consists of recycling, landfill, litter, and unrecovered informal waste.

For polymer production, the emission factor of the final polymer type, i.e. other plastics, was calculated as the average value of the other known plastic groups for both imported and local granulate production. For the conversion stage, the average value for the three most common technologies was used. In terms of end-of-life, the value used for recycling excluded any credits that may arise due to the substitution of virgin plastics.
Table 4 shows the significant difference in the granulate production from local and imported sources with the local emission factors of polyolefins such as polyethylene (both high and low density) and polypropylene calculated as five times greater than that of imported polymers. This is mainly attributed to their production as derivatives of the coal-based synthetic fuels manufacturing process. For the end-of-life stage, the emission factor for landfilling was low, as conventional plastics do not contain biodegradable carbon and thus do not generate methane. As unrecovered informal waste represents plastic waste that is not managed by formal waste services, the fraction of waste that was burnt was incorporated into the calculation of the emission factor.
Carbon footprint
The assessment revealed that in 2015, the South African plastic sector was responsible for 15.8 Mt CO2eq over its life cycle (Figure 2). This amount corresponded to 3% of the 527.3 Mt CO2eq emitted in South Africa that year.29 For the modelled polymer flow, the South African economy produced 1.49 Mt of plastics from virgin polymer for domestic consumption in 2015.20 Using the projected annual global demand growth rate of 4%/year, local plastics consumption is expected to grow to 2.68 Mt in 2030.

According to the contribution analysis, the resin production stage generated most of the emissions (71%) due to the production of polyolefins such as high- and low-density polyethylene, polypropylene, polyvinyl chloride, and polyethylene terephthalate. This finding can be directly attributed to the unique coal-to-liquid process used in the production of the ethylene and propylene monomers in South Africa, as highlighted by the high local emission factors calculated in Table 4. These results are supported by the findings of two other studies30,31 where it was concluded that coal-based pathways generated higher CO2 emissions than the traditional petroleum-based processes which utilise crude oil as a feedstock. Lifecycle-based studies for plastic products such as HDPE pipes and bottles have also confirmed that most impacts arise from the raw material stage.32,33
Emissions from the conversion process, which accounted for 24% of the total GHG emissions, are a consequence of the coal-fired power that dominates the country's electricity mix. The end-of-life stage, which contributed 5% to the total emissions, is eclipsed by the informal disposal process due to the incidence of plastic burning. Although landfilling handles most of the plastic waste, it is responsible for the lowest environmental impacts, as fossil fuel-based plastics experience minimal degradation in landfills, unless these experience landfill fires, which are not uncommon in South Africa, but have not been quantified in this study. The recycling process, which included indirect and direct activities, accounted for 0.18 Mt CO2eq.
An additional scenario was modelled to evaluate the impact which recycling is already making, by modelling a hypothetical case without recycling. In this case, the total demand for polymer would have to be fulfilled by virgin polymer from both local and imported sources. Using a virgin material substitution ratio of 1:0.828 means that an additional 234.5 kt of virgin polymer would have been required. This would have led to an increase in emissions of 1.4 Mt CO2eq from the granulate production stage. Thus, total lifecycle emissions would have been 17.2 Mt CO2eq. Put another way, plastics recycling in 2015 helped avoid 1.4 Mt of GHG emissions.
Conclusion and recommendations
On a life cycle basis, the plastic sector in South Africa emitted an estimated 15.3 Mt CO2eq in 2015. At 3% of total national GHG emissions, this is lower than the global average of 3.8% reported by Zheng and Suh5. The resin production stage was the dominant source of emissions due to the specific nature of ethylene and propylene monomer production in South Africa. Other significant contributions include the impact of coal-based energy in South Africa as well as the emissions from informal disposal methods, particularly the burning of plastic waste.
Recommendations emanating from this study include the extension of the impact assessment to incorporate other impact categories to develop a deeper picture of the environmental impacts of this industry, e.g. the human and ecotoxicity impacts of informal burning of plastic waste. Furthermore, to reduce the impact of the current fossil-based production process, several mitigation scenarios should be assessed. To counteract the high levels of emissions arising from the resin production stage, higher levels of mechanical recycling and the integration of biomass as an alternative to conventional petrochemical feedstock should be analysed. An additional scenario reflecting the incorporation of renewable energy into the country's energy mix should be investigated to enable a further reduction in environmental impacts.
Acknowledgements
We gratefully acknowledge financial support from the National Research Foundation of South Africa (grant no. 121668).
Competing interests
We have no competing interests to declare.
Authors' contributions
T.G.: Conceptualisation, methodology, data collection, data analysis, writing - the initial draft. K.H.: Conceptualisation, student supervision. V.R.: Data analysis, student supervision. H.v.B.: Conceptualisation, student supervision.
References
1. Geyer R, Jambeck JR, Law KL. Production, use, and fate of all plastics ever made. Sci Adv. 2017;3, e1700782. https://doi.org/10.1126/sciadv.1700782 [ Links ]
2. Dormer A, Finn DP Ward P Cullen J. Carbon footprint analysis in plastics manufacturing. J Clean Prod. 2013;51:133-141. https://doi.org/10.1016/j.jclepro.2013.01.014 [ Links ]
3. Pasqualino J, Meneses M, Castells F. The carbon footprint and energy consumption of beverage packaging selection and disposal. J Food Eng. 2011;103:357-365. https://doi.org/10.1016/j.jfoodeng.2010.11.005 [ Links ]
4. Intergovernmental Panel on Climate Change (IPCC). Edenhofer O, Pichs-Madruga R, Sokon Y Farahani E, Kadner S, Seyboth K, et al., editors. Climate change 2014: Mitigation of climate change. Contribution of Working Group III to the Fifth Assessment Report of the Intergovernmental Panel on Climate Change. New York: Cambridge University Press; 2014. [ Links ]
5. Zheng J, Suh S. Strategies to reduce the global carbon footprint of plastics. Nat Clim Chang. 2019;9:374-378. https://doi.org/10.1038/s41558-019-0459-z [ Links ]
6. Climate Transparency. Climate Transparency report: Comparing G20 climate action towards net zero. Climate Transparency; 2021. [ Links ]
7. Babayemi JO, Nnorom IC, Osibanjo O, Weber R. Ensuring sustainability in plastics use in Africa: consumption, waste generation, and projections. Environ Sci Eur. 2019;31, Art. #60. https://doi.org/10.1186/s12302-019-0254-5 [ Links ]
8. Plastics SA. South African Plastics Recycling Survey 2019. Johannesburg: Plastics SA; 2020. [ Links ]
9. Statistics South Africa (Stats SA). Community survey 2016. Statistical release P0301. Report no. 03-01-22. Pretoria: Stats SA; 2016. [ Links ]
10. Rodseth C, Notten P Von Blottnitz H. A revised approach for estimating informally disposed domestic waste in rural versus urban South Africa and implications for waste management. S Afr J Sci. 2020;116(1/2), Art. #5635. https://doi.org/10.17159/sajs.2020/5635 [ Links ]
11. Goga T, Harding K, Russo V Von Blottnitz H. What material flow analysis and life cycle assessment reveal about plastic polymer production and recycling in South Africa. S Afr J Sci. 2022;118(Special issue: Waste as a Resource), Art. #12522. https://doi.org/10.17159/SAJS.2022/12522 [ Links ]
12. Godfrey L, Oelofse S. Historical review of waste management and recycling in South Africa. Resources. 2017;6, Art. #57. https://doi.org/10.3390/resources6040057 [ Links ]
13. Majozi T, Veldhuizen P. The chemicals industry in South Africa. Am Inst Chem Eng. 2015:46-51. [ Links ]
14. Sasol. Secunda Synfuels Operations, Secunda Chemicals Operations and Sasol Oil. Secunda: Sasol; 2019. [ Links ]
15. Sevitz J, Brent AC, Fourie AB. An environmental comparison of plastic and paper consumer carrier bags in South Africa: Implications for the local manufacturing industry. S Afr J Ind Eng. 2003;14:67-82. [ Links ]
16. Friedrich E, Trois C. Quantification of greenhouse gas emissions from waste management processes for municipalities - A comparative review focusing on Africa. Waste Manag. 2011;31:1585-1596. https://doi.org/10.1016/j.wasman.2011.02.028 [ Links ]
17. Russo V, Stafford W, Nahman A. Comparing grocery carrier bags in South Africa from an environmental and socio-economic perspective: Evidence from a life cycle sustainability assessment. Waste Research Development and Innovation Roadmap research report. Pretoria: DST/CSIR; 2020. [ Links ]
18. Harding KG, Friedrich E, Jordaan H, Le Roux B, Notten P Russo V et al. Status and prospects of life cycle assessments and carbon and water footprinting studies in South Africa. Int J Life Cycle Assess. 2021;26:26-49. https://doi.org/10.1007/S11367-020-01839-0 [ Links ]
19. South African Department of Environment, Forestry and Fisheries (DEFF). Government Gazette 43879. Notice no. 1184. Pretoria: DEFF; 2020. [ Links ]
20. South African Department of Environmental Affairs (DEA). Plastic material flow and end of life management: Final report. Pretoria: DEA; 2017. [ Links ]
21. ecoinvent. ecoinvent v3.6 [webpage on the Internet]. c2022 [cited 2022 Mar 24]. Available from: https://ecoinvent.org/the-ecoinvent-database/data-releases/ecoinvent-3-6/ [ Links ]
22. South African Department of Trade and Industry (DTI). Plastics industry 2020 - Master plan for growth. Pretoria: DTI; 2020. [ Links ]
23. PET Recycling Company NPC. Designing for the environment. Cape Town: PET Recycling Company NPC; 2019. [ Links ]
24. Franklin Associates. Life cycle impacts of plastic packaging compared to substitutes in the United States and Canada. Theoretical substitution analysis prepared for The Plastics Division of the American Chemistry Council (ACC); 2018. [ Links ]
25. Friedrich E, Trois C. GHG emission factors developed for the recycling and composting of municipal waste in South African municipalities. Waste Manag. 2013;33:2520-2531. https://doi.org/10.1016/J.WASMAN.2013.05.010 [ Links ]
26. South African Department of Environmental Affairs (DEA). South Africa state of waste. A report on the state of the environment. Final draft report. Pretoria: DEA; 2018. [ Links ]
27. Intergovernmental Panel on Climate Change (IPCC). Guidelines for national greenhouse gas inventories. Hayama: Institute for Global Environmental Strategies (IGES); 2006. [ Links ]
28. Lazarevic D, Aoustin E, Buclet N, Brandt N. Plastic waste management in the context of a European recycling society: Comparing results and uncertainties in a life cycle perspective. Resour Conserv Recycl. 2010;55:246-259. https://doi.org/10.1016/j.resconrec.2010.09.014 [ Links ]
29. South African Department of Forestry, Fisheries and the Environment (DFFE). National GHG inventory report - South Africa 2017. Pretoria: DFFE; 2021. [ Links ]
30. Zhao Z, Liu Y Wang F, Li X, Deng S, Xu J, et al. Life cycle assessment of primary energy demand and greenhouse gas (GHG) emissions of four propylene production pathways in China. J Clean Prod. 2017;163:285-292. https://doi.org/10.1016/j.jclepro.2015.12.099 [ Links ]
31. Rodríguez-Vallejo DF, Guillén-Gosálbez G, Chachuat B. What is the true cost of producing propylene from methanol? The role of externalities. ACS Sustain Chem Eng. 2020;8:3072-3081. https://doi.org/10.1021/acssuschemeng.9b05516 [ Links ]
32. Sangwan KS, Bhakar V. Life cycle analysis of HDPE pipe manufacturing -A case study from an Indian industry. Procedia CIRP 2017;61:738-743. https://doi.org/10.1016/J.PROCIR.2016.11.193 [ Links ]
33. Treenate P Limphitakphong N, Chavalparit O. A complete life cycle assessment of high density polyethylene plastic bottle. IOP Conf Ser Mater Sci Eng. 2017;222, Art. #012010. https://doi.org/10.1088/1757-899X/222/1/012010 [ Links ]
 Correspondence:
Taahira Goga
Email: GGXTAA001@myuct.ac.za
Received: 25 Apr. 2022
Revised: 28 Oct. 2022
Accepted: 25 Nov. 2022
Published: 31 Jan. 2023
Editor: Michael Inggs
Funding: South African National Research Foundation (grant no. 121668)

