


Services on Demand
Article
 English (pdf)
 Article in xml format
 Article references
Indicators

Related links
-
 Cited by Google
 -
 Similars in Google
Share

 Permalink
South African Journal of Science
On-line version ISSN 1996-7489
Print version ISSN 0038-2353
S. Afr. j. sci. vol.119 n.1-2 Pretoria Jan./Feb. 2023
http://dx.doi.org/10.17159/sajs.2023/13117
RESEARCH ARTICLE
Deep learning for photovoltaic defect detection using variational autoencoders
Edward J. Westraadt; Warren J. Brettenny; Chantelle M. Clohessy
Department of Statistics, Nelson Mandela University, Gqeberha, South Africa
ABSTRACT
Faults arising in photovoltaic (PV) systems can result in major energy loss, system shutdowns, financial loss and safety breaches. It is thus crucial to detect and identify faults to improve the efficiency, reliability, and safety of PV systems. The detection of faults in large PV installations can be a tedious and time-consuming undertaking, particularly in large-scale installations. This detection and classification of faults can be achieved using thermal images; use of computer vision can simplify and speed up the fault detection and classification process. However, a challenge often faced in computer vision tasks is the lack of sufficient data to train these models effectively. We propose the use of variational autoencoders (VAEs) as a method to artificially expand the data set in order to improve the classification task in this context. Three convolutional neural network (CNN) architectures - InceptionV3, ResNet50 and Xception - were used for the classification of the images. Our results provide evidence that CNN models can effectively detect and classify PV faults from thermal images and that VAEs provide a viable option in this application, to improve model accuracy when training data are limited.
SIGNIFICANCE:
• Faults in PV systems can be labour and time consuming to detect and classify. This process can be automated by using computer vision and thermal images.
• CNN models (InceptionV3, ResNet50 and Xception) are effective in the detection and classification of PV faults from thermal images.
• Small data sets are a common barrier to entry for computer vision assessments. VAEs provide an effective method to artificially expand a limited data set to allow for the successful use of CNN models.
• The expansion of training data using VAEs for CNN models can improve the prediction accuracy in these models.
Keywords: photovoltaics, fault detection and classification, deep learning, CNN, convolutional neural networks, VAE, variational autoencoders
Introduction
The growing realisation that fossil fuels are not a long-term solution to the global energy demand has led to the exploration of alternative, environmentally sustainable, energy resources.1 In recent years, solar power has emerged as a leading renewable energy technology and is experiencing rapid adoption globally.2 South Africa is well placed to benefit from this drive towards renewable energy - particularly from photovoltaic (PV) systems - as the average annual 24-h global solar radiation for South Africa is 220 W/m2, which is higher than the 150 W/m2 observed for parts of the United States, and 100 W/m2 for Europe and the United Kingdom.3
The maintenance of such PV systems is often labour intensive and costly, particularly when there are undetected faults in the system. Such faults can result in major energy loss, system shutdowns, financial loss, and safety breaches. It is thus crucial to detect and identify such faults to improve the efficiency, reliability, and safety of such systems.4 Dunderdale et al.5 investigated the use of convolutional neural network (CNN) architectures on infrared (IR) thermal images to detect and classify module-level faults within PV systems in South Africa. The results of the study showed that this approach can provide a quick and effective solution to this problem. The challenge with many of these applications, however, is that CNN models typically require a considerably large data set to train effective models. In many smaller applications, and at the start of such an initiative, these data are not readily available. In the present study we propose the use of variational autoencoders (VAEs) to create synthetic training images based on a small sample of collected data. The CNN testing data were sampled prior to the VAE training, to ensure complete separation of the testing and training data. This approach can artificially increase the size of an image data set, thus overcoming this barrier to entry and opening up computer vision application to smaller PV operations. We also used the InceptionV36, ResNet507 and Xception8 CNN models to determine the effectiveness of this data augmentation approach and to expand upon the original study of Dunderdale et al.5
Literature review
Photovoltaic systems and fault detection
PV modules absorb energy from sunlight and convert this energy into electricity through a process called the 'photovoltaic effect'.9 These PV systems are typically composed of one or more modules, an inverter and other mechanical and electrical hardware, all of which are susceptible to faults. PV faults can lead to prolonged reduction in power output or the complete failure of a cell, module or system.10 The detection of faults is therefore critical to the optimal functioning of a PV system. However, in large-scale PV plants, the inspection of solar modules is typically a manual and time-consuming process. As such, recent studies have used various techniques to improve this process.
Faults can be classified as those originating on the direct current (DC) side or on the alternating current (AC) side of the module.11 Garoudja et al.4 proposed a model-based fault-detection approach for the early detection of faults on the DC side of PV systems and the identification of whether shading was present. This approach made use of extracted original design manufacturer model parameters and their associated residuals. Although this study provided useful results, noisy and correlated data degraded the fault detection quality.
Fault detection using electroluminescence and thermal imagery has gained interest over the last few years owing to the relative ease in which data can be collected. Electroluminescence imaging consists of applying a direct current to a PV module and measuring the resulting photoemissions using an IR-sensitive or charge-coupled device camera.12 This type of imaging is normally done in a dark room. Fioresi et al.13 made use of electroluminescence imagery to identify cracks and contact PV cell faults with promising results. However, this was done manually and proved time-consuming. Dos Reis Benatto et al.14 proposed the use of daylight electroluminescence images captured by a drone to detect faults in PV systems. This daylight-based electroluminescence system was able to capture electroluminescence images during high solar irradiance, but unfortunately resulted in lower-quality images when compared to indoor and stationary systems. More recent studies, such as those of Demirci et al.15 and Tang et al.16, have investigated the use of CNNs to automate this detection process using electroluminescence images. Maximum accuracies of 76% and 83% were obtained by these studies, respectively, but small data set sizes and significantly long training times were identified as limitations to the studies.
Unlike electroluminescence images, IR thermography images are created by IR radiation emitted from the object, whereby a thermal camera detects the temperature at the surface of an object and converts this temperature into colour-assigned electrical signals depending on the intensity reading.17 IR thermography has been applied as an effective tool for detecting faults in PV modules, and the recent development of unmanned aerial vehicles (UAV) has increased cost-effectiveness for large-scale PV plants to detect such faults.18 A UAV (e.g. a drone) equipped with a thermal camera can be flown over a PV system and images can be taken and analysed. Faults are identified as localised areas of higher heat, or 'hot spots', on the PV modules. These hot spots occur because the faults impede the flow of electricity, and the excess energy built up by this is dissipated as heat in these areas. These hot spots are evident in IR imaging as areas of discolouration, typically with darker colours indicating hotter regions. Using IR thermography in this manner has the potential for widespread adoption because the fault detection process, through statistical modelling, can be automated.19 Ancuta et al.20 investigated the use of IR thermography as well as solar module measurements, such as module surface temperature, for PV fault analysis, and showed that PV faults become evident as hot spots in IR images, with different fault types exhibiting different hot spot patterns. The identification of fault types in this study was done manually and without the aid of computer vision and classification techniques. Tsanakas et al.21 performed a study implementing wide area orthophoto IR thermography to detect and classify faults in large-scale PV plants. In addition to IR thermography, electrical performance characterisation using current-voltage characteristic (IV) curves, as well as electroluminescence images, were used to successfully validate results. According to the preliminary results, it was found that all detected faults were diagnosed, classified, and quantified in terms of fault type and electrical power loss per module. Jaffrey et al.22 produced a PV fault analysis algorithm for thermal images of PV modules using fuzzy logic and a six-class fuzzy logic categorical framework, which was implemented successfully to classify faults.
In a pioneering study in South Africa, Dunderdale et al.5 used thermal images for the detection and classification of faults in PV systems. In the first (detection) phase of the study each panel was classified as either faulty or non-faulty. Faulty panels were further classified according to the type of fault exhibited by the panel. The study made use of feature-based approaches with support vector machine and random forest classifiers as well as CNNs for the detection and classification. The study showed that the CNN approaches performed better for fault classification, obtaining an 89.5% average cross-validated accuracy, in comparison to a maximum accuracy of 82.9% obtained using the feature-based approach.
Photovoltaic fault types
The study of Dunderdale et al.5 proposed the classification of PV module faults as block faults, patchwork faults, single-cell faults, soiling faults, and string faults. These fault types were defined according to the shape of the hot spots present on thermal images. Depictions of these faults, as they would appear on thermal images, are provided in Figure 1.
A block fault is identified as a vertical band exhibiting temperatures significantly higher than those of the rest of the module. A single-cell fault can be identified as a small rectangular shape exhibiting higher temperatures than the rest of the module. Patchwork and string faults are considered extensions of single-cell faults, where multiple rectangular shapes exhibit temperatures higher than the rest of the module. Patchwork faults occur as single-cell faults in a random pattern across a module, while string faults consist of single-cell faults occurring in a straight vertical line on a module. Lastly, soiling faults are typically difficult to identify, mostly because they can differ in size, intensity, and shape. A lack of sufficient examples of the soiling fault class led to its omission in the classification study.5
Computer vision and image classification
Deep learning, a specialised form of machine learning, is fundamental in modern computer vision tasks. Computer vision refers to a computer's ability to perceive and understand three-dimensional (3D) shapes and objects from two-dimensional (2D) imagery, using mathematical techniques and algorithms.23 In many applications, the purpose of the computer vision task is for image classification. That is, for the purposes of identifying and classifying images according to their attributes or contents. In such applications, supervised CNNs are the most prevalently used technique.24
Basic neural networks are designed to mimic the workings of biological neurons, which receive an input (or stimulus), process it, and respond accordingly. In their simplest form, these artificial neural networks (ANNs) consist of exactly this - an input layer, hidden layer(s), and an output layer. Deep neural networks can be thought of as 'stacked' ANNs, or ANNs which have numerous hidden layers, with deep learning representing the process of training or building these networks. According to some recent studies, deep learning models achieve state-of-the-art accuracy in many application areas such as object recognition (computer vision)25 and natural language processing26.
In image classification tasks, the input layer of a neural network receives a digital image as a matrix of pixel values. The hidden layer(s) process the image in an effort to provide an accurate output - the label or classification of the image contents. CNNs are a class of artificial neural networks which use a convolution operation in at least one layer of the implemented neural network, although in most cases this operation is used in multiple layers.27 A convolution operation is a linear operation between matrices I and H, and can be defined as28:
where I(u,v) indicates the element located at row u and column v on the matrix (or digital image) I, and H(i,j) represents position of the element on the filter kernel matrix which specifies the weights assigned to each pixel in the convolution operation. The output matrix of the convolution operator is denoted I'.
In supervised computer vision tasks, CNNs are trained to detect and classify images based on a given set of input data (training images). This process is achieved through using the backpropagation algorithm - which is ubiquitous in the field of neural networks. CNNs have proven to be highly successful in the field of image classification where the networks typically learn elementary shapes in the initial layers, and more complex details in the deeper layers of the network.27 Typically, a large set of training data (images) is required, as it is important to ensure that the trained model can perform the classification task to a sufficient degree of accuracy on new and unseen data. In certain real-world applications, such as the one investigated in this study, there is a dearth of useable images for training, making the development of accurate classifications a challenge. To address this challenge, Dunderdale et al.5 used several data augmentation approaches including rotating, flipping, and inverting the training images to increase the sample size. This provided a moderate improvement to classification accuracy. The drawback to this approach is that the number of meaningful and possible augmentations is limited. Additionally, certain augmentations -rotation in this case - result in data augmentations that give misleading and unlikely scenarios. For example, a block fault indicates a vertical hot spot running the length of the panel. Under 90° and 270° rotation this would result in the hot spot running horizontally, which is at odds with the classification. A possible remedy for the data scarcity problem is to generate random synthetic images based on the identified fault classes. This can be achieved using deep generative modelling approaches such as generative adversarial networks and VAEs.29 VAEs are used in this study as generative adversarial networks, while known to provide higher-quality images, are difficult to train. VAEs are more stable when training and generate satisfactory images for the current application.
Variational autoencoders
VAEs are generative models that have the ability to synthesise numerous complex data points in a potentially high-dimensional space30 (e.g. digital images) using a given set of training data. Using a generative approach, VAEs can create non-identical images which are similar to the images on which they are trained. As a result, small data sets can be artificially inflated to include any number of synthetic or simulated observations (or images). As a large data set is a common requirement for CNN training in computer vision tasks, VAEs can be used to synthesise training images when inadequate training observations are available.
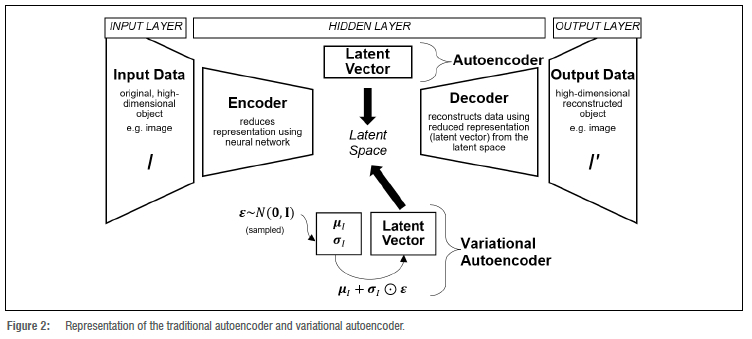
VAEs are a special case of a traditional autoencoder which is made up of two connected (and trained) neural networks: an encoder and a decoder. The encoder reduces or constricts the representation of the input data to a given set of dimensions or units, and the decoder attempts to re-create the original input from this reduced representation in the latent space. This is illustrated in Figure 2 where an image I is passed through the encoder and represented as a reduced vector in the latent space. The decoder then takes this encoded vector in the latent space and attempts to reconstruct the image (denoted I') from the reduced representation. The encoder and decoder are trained to minimise a loss function L(I,I'), which measures the differences between the original data (image) and the reconstructed data (image) - known as the reconstruction loss - ensuring that the input and output images are as similar as possible.
VAEs expand on this basic functioning by imposing a probabilistic structure on the latent variables and introducing a random sampling step in the latent space. For each input object I the VAE determines a k x 1 vector of means (µI) and of standard deviations (a,) creating a single mean-standard deviation pair for each of the k variables in the latent space. Instead of sending the encoded latent values directly to the decoder, as in the traditional autoencoder, VAEs sample individual values from N(µjl,σj2) for each latent variable j,j=1,...k. While this approach renders the network intractable to learning through backpropagation, this is overcome by constructing the latent variable realisations as µi+σµe where s(kx1) is a random observation vector from a multivariate standard normal distribution and o represents the elementwise vector product.27 This is known as the 'reparameterisation trick'.31
The loss function used for training the VAE consists of two competing terms, one which represents the reconstruction loss (L(I,I')) and another which represents the regularisation loss (R(I,I)). The regularisation loss uses the Kullback-Leibler divergence to measure the degree to which the distribution of the latent variables diverges from that of the multivariate standard normal distribution.27 The loss function is thus represented as
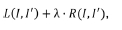
where A>0 is the regularisation parameter. By using this loss function, the decoder is able to generate images (or outputs) that are similar (but not identical) to the data on which it is trained within a reasonable range.27 This allows for the creation of distinct yet similar images which can be used as training data for a computer vision model.
Data and methodology
Original data
The thermal image data for this study were collected from three different PV plants in South Africa. Due to the privacy agreement with the data's supplier, the locations of these PV plants cannot be disclosed. All three sites under study make use of crystalline silicon PV modules. A total of 398 thermal images of singular defective PV modules were collected. The thermal images were captured using a UAV equipped with a FLIR Tau 2 640 thermal imaging camera. Once these thermal images were captured and stored, the images were then cropped to show individual PV modules.5 This resulted in a final data set of 376 thermal images indicating modules with hot spots or faults and an additional 400 images of non-faulty modules. The data supporting this study's results can be obtained on request from the authors.
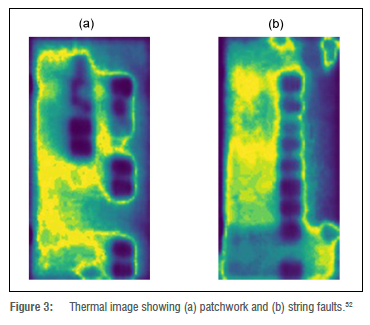
Dunderdale et al.5 used a four-class classification, namely: block faults, patchwork faults, string faults and single-cell faults. In the current study, it was decided to group string and patchwork fault data into a single class of 'patchwork' faults. The motivation behind this was that the string fault class can be considered a special case of the patchwork fault class, where all affected cells occur in a straight vertical line rather than in a random or scattered pattern.32 This is illustrated in Figure 3.
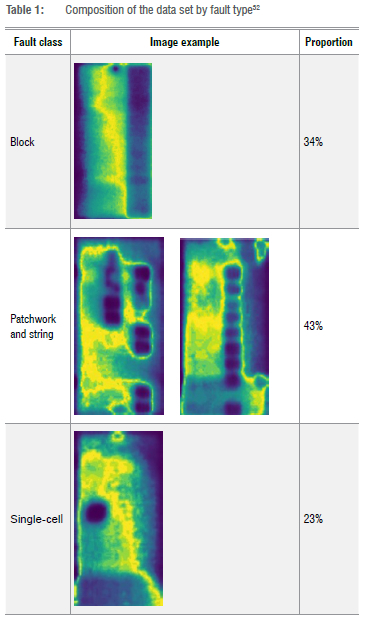
Using this new classification, the 376 fault images are categorised into three distinct classes. The composition of the data set by fault class is given in Table 1, where the three classes are easily identifiable upon examination of a thermal image.
Synthetic images
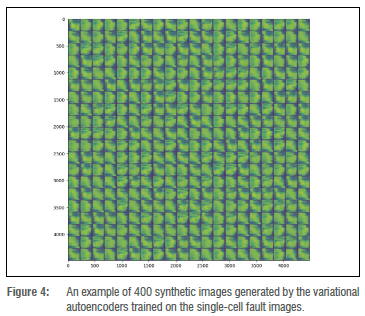
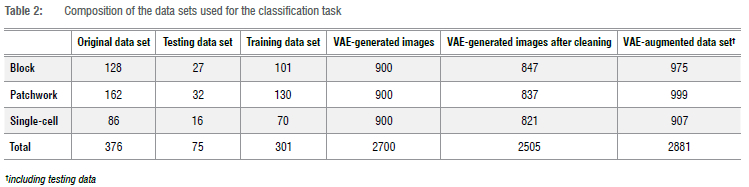
The VAE approach outlined under the 'Variational autoencoders' section above was used to expand the data set. Prior to VAE training, 75 random images were sampled from the original data set and set aside for later use in CNN testing. Thereafter, the VAEs were trained separately for the block, single-cell, and patchwork PV fault classes. Each VAE generated an additional 900 images for each class. An example of the image generation for the single-cell fault class is provided in Figure 4.
For each class of VAE-generated images, manual data cleaning was also performed to remove any potentially 'noisy' synthesised images. Noisy images were considered to be any images in which random variations in colour or brightness were observed which may influence the results of analysis. When combined with the original data, the final data set consisted of 2881 images, as shown in Table 2. Included in this data set were the 75 randomly sampled images for testing once the three CNN architectures had been trained.
Data summary and validation
Testing and validation is an imperative step in statistical or machine learning implementation. For this study, approximately 20% of the original images were randomly removed to create the testing data sets.
The testing data sets were sampled from the original data both prior to model training and prior to the generation of synthetic images using VAEs. This ensured that the testing data sets were completely unseen in both assessments. The accuracy of the trained classifiers (one using the original data and one using the VAE-generated images) was determined on their respective testing data sets. The composition of the data sets used for the classification analysis is provided in Table 2.
Classification methods: Convolutional neural networks
In this study, the deep learning approach constitutes what CNNs use to make decisions regarding fault detection and classification of PV modules. CNNs eliminate the need for manual feature extraction and are able to extract features directly from the raw image data.33 The CNNs are first trained using the training data with the corresponding classification labels, which then allows the system to find and extract features automatically.
Python 3.6.5 64-bit software was used for implementing the three CNN models/architectures: InceptionV3, ResNet and Xception. Python was used due to the vast number of packages available, as well as the easy-to-access online support community. In this study, we also made use of the tensorflow package34 and Keras35 interface for analysis, as they allow for pre-trained CNN architectures to be downloaded, implemented, and adjusted in Python.
The Inception CNN architecture was initially introduced by Szegedy et al.36 in 2014. The InceptionV3 architecture (the third version of Inception) was later released by Google and introduced to the Keras core in 2015. The new InceptionV3 architecture allowed for higher computational efficiency with fewer parameters being required. The ResNet (or ResNet50) CNN architecture was introduced by Microsoft in 2015. This architecture was designed to enable a high number of convolutional layers with strong performance, as previous CNN architectures had a drop off in effectiveness owing to additional layers. The Xception CNN architecture was proposed by the creator and chief maintainer of the Keras library, Frangois Chollet, in 2014. This architecture is an extension of the Inception architecture, which replaces the standard Inception modules with depth-wise separable convolutional layers.37 These three architectures were chosen because the ResNet50 and InceptionV3 architectures placed first and second in the 2015 ImageNet Large Scale Visual Recognition Challenge, respectively, with the Xception architecture being an extension of one of these high-performing architectures.
All architectures were trained and optimised on the training data and their performance, or classification accuracy, was determined on the testing data which were removed prior to training.
Results
Photovoltaic fault detection
Before PV faults can be classified, they first need to be detected. Each of the three CNN models were trained and tested on the training data which consisted of using greyscale images.
Each of the proposed CNN models obtained 100% testing accuracy, indicating perfect out of sample performance. These results agree with those of Dunderdale et al.5, which also produced maximum testing accuracies of 100% for fault detection using two CNN architectures, namely MobileNet and VGG-16. Table 3 provides the confusion matrix for PV fault detection using each of the architectures.
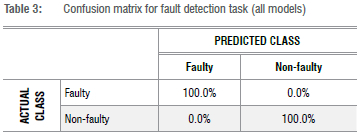
In classification models, this outcome may raise a concern that the models are overfitting the data. However, in this case it is noted both that the accuracy was determined using unseen test data and that the classification task was a straightforward one as the images under study (i.e. fault/no fault) were typically simple to differentiate.
Photovoltaic fault classification
The results of the classification analysis described in 'Data and methodology' for the VAE-augmented data set are given in Table 4 for each of the architectures. The values indicated in Table 4 are the row percentages for the confusion matrix; that is, the value of 3.8% in the first row and second column indicates that the InceptionV3 model incorrectly classified 3.8% of the block faults as patchwork faults. Table cells highlighted in grey indicate correctly classified images.
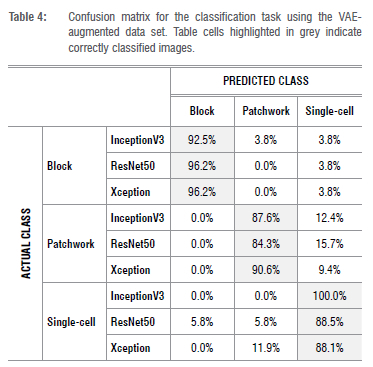
The overall classification accuracy for the InceptionV3 and Xception models was 92%, while for the ResNet50 an accuracy of 89.3% was achieved. This indicates that all the models performed well in this application. To identify the preferred model, both overall accuracy and fault-wise accuracy were considered. This ensured that the highest accuracies were achieved for all three fault types. For the best performing models (i.e. InceptionV3 and Xception), Table 4 indicates that the Xception model performed best for the classification of block and patchwork faults while the InceptionV3 model achieved a 100% classification accuracy for the single-cell fault class. This indicates that the Xception model may perform better for multiple-cell faults, which make up a sizeable proportion of faults in practice and are also of interest to operators as this type of fault can significantly reduce module power.38 These results suggest that the Xception model may be preferred in practical applications.
For comparative purposes, and to determine whether the use of VAEgenerated synthetic images in the training of the models improved the classification accuracy, the results of the same models trained on the original data set are provided in Table 5.
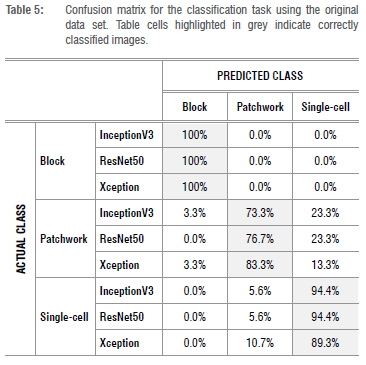
The overall accuracy for the Xception model was 90.4%, while ResNet50 and InceptionV3 achieved accuracies of 89.0% and 87.7%, respectively. Similar to the previous results, the Xception model performed best for the multiple-cell faults, and all models performed relatively poorly for the classification of the patchwork fault class. These findings are in agreement with the results found in Dunderdale et al.5 Again, the Xception model may be considered to be the best performer as it has the highest accuracy and is the most consistent. Furthermore, similar traits observed for the models trained on the original data and those trained on the VAE-augmented data validate the use of VAEs for data inflation purposes. As similar characteristics are observed for both approaches, there is evidence that the VAE process generates relevant and useful images which are in line with those from the original data set.
Table 6 provides a comparison of the accuracies of the three CNN modules based on the testing data for the VAE-augmented and original data sets.
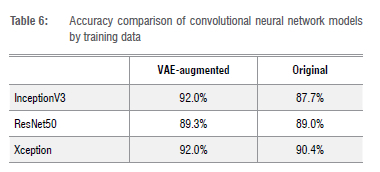
The results in Table 6 provide evidence that the artificial inflation of the data set size using the synthetic images generated using VAEs does improve the classification accuracy of the fitted models. This indicates that, in applications where only small data sets are available, the use of VAEs to generate artificial training data, based on the original data, can lead to improved classification accuracies in these models. Because small data sets are a common problem in many applications, the results suggest that VAEs provide a viable method for data inflation which can lead to improved discrimination in classification models.
The use of the VAE-augmented data set resulted in accuracy increases of between 0.3% and 4.3%. This appears to be dependent on the architecture on which the model is based, as the structurally similar InceptionV3 and Xception models both experienced considerably higher improvements than that of the ResNet50 model. For the models trained on the original data set, the results were similar to those of Dunderdale et al.5 who achieved a maximum accuracy of 89.5% for a four-category problem. The improved accuracy observed for the Xception model could simply be a result of the present study being reduced to a three-category problem. However, the improvement in accuracy as a result of the artificial inflation of data through VAEs provides a notable advancement to the work of Dunderdale et al.5
Conclusion
CNN models trained on the VAE-augmented data set showed that all three architectures were able to detect PV faults with 100% testing accuracy. These results are an improvement on those of Dunderdale et al.5 This indicates that the proposed method is highly effective in distinguishing between faulty and non-faulty PV modules using thermal images.
For fault classification, the VAE-augmented approach achieved an overall testing classification accuracy for the InceptionV3 and Xception models of 92%, with the ResNet50 model achieving an accuracy of 89.3%. This indicates that all models performed well in the classification task. Further investigation of the fault-wise accuracy found that the Xception model performed better in identifying multiple-cell faults of PV modules and tended to have a consistently higher accuracy for each fault type. As such, the Xception model is recommended ahead of the InceptionV3 and ResNet50 models.
The comparative analysis performed in this study showed that the models trained using the VAE-augmented data consistently outperformed those trained on the original data set. This improvement was more evident for the InceptionV3 and Xception models than it was for the ResNet50 model. This may indicate that improved accuracies from a VAE-augmentation of a training data set may be model dependent.
In comparing the results obtained in the study to that of Dunderdale et al.5 the use of VAE-augmented training data improved model accuracies for fault classification. Although Dunderdale et al.5 reports results on a four-category problem, the combination of the string and patchwork faults is validated both by their similar appearance on thermal images as well as by similar groupings being used in related studies.39
The VAE approach used in this study proved to be successful in artificially increasing a data set size and is therefore recommended in applications where limited data are available for analysis. This finding shows that the entry point to the use of computer vision methods in practice is lower than originally thought as smaller data sets can be inflated using synthetic VAE-generated images to train effective and accurate classification models.
Acknowledgements
The financial assistance of the South African National Research Foundation (NRF) towards this research is hereby acknowledged. Opinions expressed and conclusions arrived at are those of the authors and are not necessarily to be attributed to the NRF. The workstation is funded through NRF grants SFH180517331201 and TTK190408428135. We also thank the South African Statistical Association (SASA) and Nelson Mandela University PGRS (Postgraduate Research Scholarships) for their financial support.
Competing interests
We have no competing interests to declare.
Authors' contributions
E.J.W.: Methodology, sample analysis, data analysis, validation, data curation, writing - initial draft, writing - revisions, project management. W.J.B.: Conceptualisation, methodology, data collection, writing -revisions, student supervision, project leadership, project management, funding acquisition. C.M.C.: Conceptualisation, methodology, data collection, writing - revisions, student supervision, project leadership, project management, funding acquisition.
References
1. Kirsch S. Running out? Rethinking resource depletion. Extr Ind Soc. 2020;7(3):838-840. https://doi.org/10.10167j.exis.2020.06.002 [ Links ]
2. Chen CJ. Physics of solar energy. Hoboken, NJ: John Wiley & Sons; 2011. [ Links ]
3. South African Department of Energy. Renewable energy: Solar power [webpage on the Internet]. c2010 [cited 2021 Sep 14]. Available from: https://www.energy.gov.za/files/esources/renewables/r_solar.html [ Links ]
4. Garoudja E, Harrou F, Sun Y Kara K, Chouder A, Silvestre S. Statistical fault detection in photovoltaic systems. Sol Energy. 2017;150:485-499. https://doi.org/10.1109/icosc.2017.7958710 [ Links ]
5. Dunderdale C, Brettenny W, Clohessy C, Van Dyk EE. Photovoltaic defect classification through thermal IR imaging using a machine learning approach. Prog Photovolt. 2020;28(3):177-188. https://doi.org/10.1002/pip.3191 [ Links ]
6. Szegedy C, Vanhoucke V loffe S, Shlens J, Wojna Z. Rethinking the inception architecture for computer vision. Proceedings of the IEEE Conference on Computer Vision and Pattern Recognition. 2016:2818-2826. https://doi.org/10.1109/cvpr.2016.308 [ Links ]
7. He K, Zhang X, Ren S, Sun J. Deep residual learning for image recognition. Proceedings of the IEEE Conference on Computer Vision and Pattern Recognition. 2016:770-778. https://doi.org/10.1109/cvpr.2016.90 [ Links ]
8. Chollet F. Xception: Deep learning with depthwise separable convolutions. Proceedings of the IEEE Conference on Computer Vision and Pattern Recognition. 2017:1251-1258. https://doi.org/10.1109/cvpr.2017.195 [ Links ]
9. Energy Education. Photovoltaic effect [webpage on the Internet]. No date [cited 2019 Oct 24]. Available from: https://energyeducation.ca/encyclopedia/Photovoltaic_effect [ Links ]
10. Madeti SR, Singh SN. A comprehensive study on different types of faults and detection techniques for solar photovoltaic system. Sol Energy. 2017;158:161-185. https://doi.org/10.1016/j.solener.2017.08.069 [ Links ]
11. Hu Y Cao W, Ma J, Finney SJ, Li D. Identifying PV module mismatch faults by a thermography-based temperature distribution analysis. IEEE Transactions on Device and Materials Reliability. 2014;14(4):951-960. https://doi.org/10.1109/tdmr.2014.2348195 [ Links ]
12. Jahn U, Herz M, Parlevliet D, Paggi M, Tsanakas I, Stein J, et al. Review on infrared and electroluminescence imaging for PVfield applications. Photovoltaics Power Systems Programme: Report IEA-PVPS T13-10 [document on the Internet]. c2018 [cited 2021 Sep 24]. Available from: https://iea-pvps.org/wp-content/uploads/2020/01/Review_on_IR_and_EL_Imaging_for_PV_Field_Applications_by_Task_13.pdf [ Links ]
13. Fioresi J, Gupta R, Li M, Shah M, Davis K. Deep learning for defect classification of photovoltaic module electroluminescence images [document on the Internet]. c2020 [cited 2021 Oct 27]. Available from: https://www.crcv.ucf.edu/wp-content/uploads/2018/11/Joe_F_Report.pdf [ Links ]
14. Dos Reis Benatto GA, Mantel C, Spataru S, Lancia AA, Riedel N, Thorsteinsson S, et al. Drone-based daylight electroluminescence imaging of PV modules. IEEE J Photovolt. 2020;10(3):872-877. https://doi.org/10.1109/jphotov.2020.2978068 [ Links ]
15. Demirci MY Besli N, Gümüsçü A. Defective PV cell detection using deep transfer learning and EL imaging [document on the internet]. c2019 [cited 2021 Oct 28]. Available from: https://www.researchgate.net/profile/Ozge-Doguc-2/publication/344164531_Using_Dimensionality_Reduction_Techniques_to_Determine_Student_Success_Factors/links/5f577c4b92851c250b9d53c1/Using-Dimensionality-Reduction-Techniques-to-Determine-Student-Success-Factors.pdf#page=314 [ Links ]
16. Tang W, Yang Q, Xiong K, Yan W. Deep learning based automatic defect identification of photovoltaic module using electroluminescence images. Sol Energy. 2020;201:453-460. https://doi.org/10.1016/j.solener.2020.03.049 [ Links ]
17. Labomat. Thermography / IR temperature measurement: Theory and practice [webpage on the Internet]. No date [cited 2021 Sep 14]. Available from: https://labomat.eu/gb/faq-temperature-hygrometry/806-thermography-IR-temperature-measurement-theory-and-practice.html [ Links ]
18. De Oliveira AK, Aghaei M, Madukanya UE, Nascimento L, Rüther R. Aerial IR thermography of a utility-scale PV plant after a meteorological tsunami in Brazil. 2018 IEEE 7th World Conference on Photovoltaic Energy Conversion (WCPEC). 2018:684-689. https://doi.org/10.1109/pvsc.2018.8548019 [ Links ]
19. Alves RH, de Deus Junior GA, Marra EG, Lemos RP. Automatic fault classification in photovoltaic modules using Convolutional Neural Networks. Renew Energy. 2021;179:502-516. https://doi.org/10.1016/j.renene.2021.07.070 [ Links ]
20. Ancuta F, Cepisca C. Fault analysis possibilities for PV panels. Proceedings of the 2011 3rd International Youth Conference on Energetics (IYCE). 2011:1-5. Available from: https://ieeexplore.ieee.org/stamp/stamp.jsp?arnumber=6028341&casa_token=JCotV1YE6mcAAAAA:SMA8ewAE8tOpP_uJF8csC7vXiWiOYe0IhWnUwwL1tNXUkukjgPBW_eBM2CmUPSi3WO9GRx9cBhjrpw&tag=1 [ Links ]
21. Tsanakas JA, Vannier G, Plissonnier A, Ha DL, Barruel F. Fault diagnosis and classification of large-scale photovoltaic plants through aerial orthophoto thermal mapping. Proceedings of the 31st European Photovoltaic Solar Energy Conference and Exhibition. 2015:1783-1788. https://doi.org/10.4229/EUPVSEC20152015-5CO.15.2 [ Links ]
22. Jaffery ZA, Dubey AK, Haque A. Scheme for predictive fault diagnosis in photo-voltaic modules using thermal imaging. Infrared Phys Technol. 2017;83:182-187. https://doi.org/10.1016/jJR.2017.04.015 [ Links ]
23. Szeliski R. Computer vision: Algorithms and applications [document on the Internet]. c2010 [cited 2021 Aug 17]. Available from: https://www.cs.ccu.edu.tw/~damon/tmp/SzeliskiBook_20100903_draft.pdf [ Links ]
24. LeCun Y Bengio Y Hinton G. Deep learning. Nature. 2015;521(7553):436-444. https://doi.org/10.1038/nature14539 [ Links ]
25. Collobert R, Weston J. A unified architecture for natural language processing: Deep neural networks with multitask learning. Proceedings of the 25th International Conference on Machine Learning. 2008:160-167. https://doi.org/10.1145/1390156.1390177 [ Links ]
26. Yu D, Hinton G, Morgan N, Chien JT, Sagayama S. Introduction to the special section on deep learning for speech and language processing. IEEE Transactions on Audio, Speech, and Language Processing. 2011;20(1):4-6. https://doi.org/10.1109/tasl.2011.2173371 [ Links ]
27. Aggarwal CC. Convolutional Neural Networks. In: Neural networks and deep learning. Cham: Springer; 2018. p. 315-371. https://doi.org/10.1007/978-3-319-94463-0_8 [ Links ]
28. Burger W, Burge MJ. Filters. In: Digital image processing. London: Springer; 2016. p. 89-119. https://doi.org/10.1007/978-1-4471-6684-9_5 [ Links ]
29. Gorijala M, Dukkipati A. Image generation and editing with variational info generative adversarial networks [document on the Internet]. c2017 [cited 2021 Oct 24]. Available from: https://arxiv.org/pdf/1701.04568.pdf [ Links ]
30. Doersch C. Tutorial on variational autoencoders [document on the Internet]. c2016 [cited 2021 Aug 10]. Available from: https://arxiv.org/pdf/1606.05908.pdf [ Links ]
31. Kingma DR Welling M. An introduction to variational autoencoders. Foundations and trends in machine learning. 2019;12(4):307-392. http://dx.doi.org/10.1561/2200000056 [ Links ]
32. Westraadt E, Clohessy C, Brettenny W. Deep learning techniques for the classification of photovoltaic faults using infrared thermal imagery [master's dissertation]. Gqeberha: Nelson Mandela University; 2021. [ Links ]
33. Krishna ST, Kalluri HK. Deep learning and transfer learning approaches for image classification [document on the Internet]. c2019 [cited 2021 Jul 26]. Available from: https://www.researchgate.net/profile/Hemantha-Kumar-Kalluri/publication/333666150_Deep_Learning_and_Transfer_Learning_Approaches_for_Image_Classification/links/5cfbeeb9a6fdccd1308d6aae/Deep-Learning-and-Transfer-Learning-Approaches-for-Image-Classification.pdf [ Links ]
34. Abadi M, Agarwal A, Barham R Brevdo E, Chen Z, Citro C, et al. Tensorflow: Large-scale machine learning on heterogeneous distributed systems [document on the Internet]. c2016 [cited 2021 Aug 09]. Available from: https://arxiv.org/pdf/1603.04467.pdf [ Links ]
35. Chollet F. Keras: Deep Learning for humans [webpage on the Internet]. c2015 [cited 2021 May 24]. Available from: https://github.com/fchollet/keras [ Links ]
36. Szegedy C, Liu W, Jia Y Sermanet R Reed S, Anguelov D, et al. Going deeper with convolutions. Proceedings of the IEEE Conference on Computer Vision and Rattern Recognition. 2015:1-9. https://doi.org/10.1109/cvpr.2015.7298594 [ Links ]
37. Rosebrock, A. ImageNet: VGGNet, ResNet, Inception, and Xception with Keras [webpage on the Internet]. No date [cited 2020 Jan 09]. Available from: https://www.pyimagesearch.com/2017/03/20/imagenet-vggnet-resnet-inception-xception-keras/ [ Links ]
38. Köntges M, Kurtz S, Packard CE, Jahn U, Berger KA, Kato K, et al. Review of failures of photovoltaic modules. Rhotovoltaics Rower Systems Rrogramme: Report IEA-RVRS T13-01:2014 [document on the Internet]. c2014 [cited 2021 Aug 03]. Available from: http://repository.supsi.ch/9645/1/IEA-RVRS_T13-01_2014_Review_of_Failures_of_Rhotovoltaic_Modules_Final.pdf [ Links ]
39. Haque A, Bharath KVS, Khan MA, Khan I, Jaffery ZA. Fault diagnosis of photovoltaic modules. Energy Sci Eng. 2019;7:622-644. https://doi.org/10.1002/ese3.255 [ Links ]
 Correspondence:
Edward Westraadt
Email: s215052064@mandela.ac.za
Received: 24 Jan. 2022
Revised: 28 July 2022
Accepted: 01 Sep. 2022
Published: 31 Jan. 2023
Editor: Michael Inggs
Funding: South African National Research Foundation (SFH180517331201, TTK190408428135); South African Statistical Association; Nelson Mandela University

