


Services on Demand
Article
 English (pdf)
 Article in xml format
 Article references
Indicators

Related links
-
 Cited by Google
 -
 Similars in Google
Share

 Permalink
South African Journal of Science
On-line version ISSN 1996-7489
Print version ISSN 0038-2353
S. Afr. j. sci. vol.119 n.1-2 Pretoria Jan./Feb. 2023
http://dx.doi.org/10.17159/sajs.2023/13716
RESEARCH ARTICLE
Remote sensing monitoring of mangrove growth rate at selected planted sites in Mauritius
Mahalaksmi D.D. DoodeeI; Soonil D.D.V. RughooputhII; Shobha JawaheerI
IDepartment of Biosciences and Ocean Studies, Faculty of Science, University of Mauritius, Réduit, Mauritius
IIDepartment of Physics, Faculty of Science, University of Mauritius, Réduit, Mauritius
ABSTRACT
Mangroves are highly productive and rich ecosystems that thrive at the interface of land and sea. They provide a wide range of essential goods and services, contribute highly to coastal protection and the livelihood of coastal communities, and are also carbon-rich biomes contributing to carbon sequestration. Mangroves are primarily threatened by anthropogenic activities; a loss in biodiversity has been observed in the past years in many countries including Mauritius. Given their value to the ecosystem, it is important to have effective continuous monitoring of mangrove dynamics. We studied the rate of increase of canopy coverage of planted Rhizophora mucronata forests in two selected sites (Le Morne and Grande Rivière Noire) on a southern African island - Mauritius - using Google Earth Pro historical Landsat 7 and Landsat 8 images. Data were processed using ImageJ software. To our knowledge, this technique has not yet been applied for monitoring mangrove growth. The mangrove sites were classified into four zones based on water level and tidal variations. On average, the rate of increase of canopy coverage expressed by a coefficient 'b at Le Morne (b = 1.901) was higher than that at Grande Rivière Noire (b = 1.823). The coefficient 'b' positively correlated with the zonations (r ~ 0.8). Higher 'b values (2.319-2.886) were observed in Zone 1, where the substrate is always covered with water at low tide. The use of remote sensing data along with image processing analysis proved to be an effective tool to obtain relevant information, not only for mapping mangroves but also for monitoring the canopy growth rates of planted mangroves.
SIGNIFICANCE:
• We describe a novel technique whereby remote sensing data are processed through image processing using ImageJ software, to effectively monitor planted mangrove canopy growth by pixel count.
• This study highlights the successful application of the technique to obtain relevant information for mapping and monitoring the canopy growth rates of planted mangroves.
• This technique can be further extended to identify potential areas for mangrove propagation worldwide based on tidal level variations.
Keywords: mangroves, canopy cover, remote sensing, growth monitoring
Introduction
Mangroves are trees and shrubs that thrive in the harsh conditions between the land and sea. Mangrove forests form part of the most productive and unique ecosystems on earth. They are ecotone ecosystems occurring mostly along the tropical and subtropical coastlines.1 They adapt well to inter-tidal conditions, and play a vital role in the aquatic food web by providing a plethora of ecosystem services, particularly as a breeding ground for several fish and prawns species and as a food source for aquatic organisms. They also provide goods and services to people in fisheries; coastal protection against storm surges, rough waves and erosion; pollution abatement; and forest products.2 Mangrove forests are also important ecosystems for carbon sequestration, allowing carbon to be stored in their biomass and sediment.3 Even though mangroves are of prime importance to coastal ecosystems, the mangrove population worldwide is being threatened by anthropogenic activities and climate change.4,5
Mangroves are found in 123 countries and territories, and, as of 2016, their global coverage6 was around 136 000 km2 although mangrove forests in the southern African region account for around 7% of this area7-15. The largest southern African mangrove forests are found along the Indian Ocean coasts.9 Mozambique and Madagascar each harbours more than 3000 km2 (20% of African mangroves), making together 4% of the global distribution.10,11 In South Africa, the mangrove cover is estimated to be around 2000 km2,9,14 while for Tanzania mainland, Wang et al.12 estimated that there is about 1083 km2 of mangrove cover.13 Mauritius, a small island state off the southeast coast of the African continent, has a mangrove cover of 1.45 km2.15 Worldwide, a net loss of around 4.3% of mangroves was noted in the 20 years preceding 2016, although the average rate of mangrove loss is now reported to be slowing.6 Given the significance of mangrove forests, there is a need for continuous monitoring of their dynamics. However, precise, dependable and timely data on the world's mangrove forests are not readily available.16
In southern African countries17-21, and other regions with wide expanses of mangroves (e.g. Indonesia22, Malaysia23 and Thailand24), geographic information systems (GIS), based on digital satellite and aerial photographs, are most commonly used to create maps showing mangrove forests.25 Remote sensing techniques are ideal for inaccessible areas where in situ field data cannot be undertaken. Development in remote sensing with high spatial, spectral and temporal resolution, and historical remote sensing data provide the opportunity for better characterisation, mapping and monitoring of mangrove forests from local to global scales.26 Additionally, it allows 'indirect' access to mangrove habitats located in remote areas and areas that are usually temporarily swamped25-28, thus allowing scientists to focus their research on specific levels of ecological details26,29,30. Light detection and ranging (LiDAR), hyperspectral and multispectral optical images, and synthetic aperture radar (SAR), are among the satellite image data studied in addition to aerial imagery. The three types of digital image classification algorithms utilised for mangrove mapping and monitoring in diverse research are object-based, pixel-based, and knowledge-based classifiers.31,32 By the determination of the percentage canopy closure of mangrove forests, further investigations based on the density of the mangrove area can be undertaken.30
The main objective of this study was to use remote sensing and image processing techniques to determine the extent of canopy coverage of mangrove forests and their distributions as part of our efforts to understand the ecosystem and ecophysiology of mangals. In this work, canopy coverage was established using image classification (pixel counting) with data acquired through the Google Earth engine Google Earth Pro™. This novel method developed here can be readily extended to study the temporal and spatial evolution of mangrove areas globally.
Materials and methods
Study area
This research study was focused on the two largest planted mangrove areas on the southwestern coast of Mauritius. The Republic of Mauritius is a small island developing state with the mainland, Mauritius, centred around 20°34'84" S and 57°55'22" E whilst other islands of the republic are scattered in the South-West Indian Ocean. Mauritius has a coastal zone inhabited by two mangrove species, namely Bruguiera gymnorrhiza (L.) Lam. and Rhizophora mucronata Lam., covering ~1.45 km2.15 Mauritius has been experiencing a wide range of changes in its coastal zone over the last few decades due to anthropogenic activities (such as global warming and deforestation) and invasive plants, resulting in a loss of mangrove biodiversity. Since 1995, the Albion Fisheries Research Centre, under the aegis of the Ministry of Blue Economy, Marine Resources, Fisheries and Shipping, embarked on a Mangrove Propagation Programme to protect and restore denuded areas. As of 2019, the total area covered under mangrove propagation on mainland Mauritius was ~0.217 km2 (Ministry of Blue Economy, Marine Resources, Fisheries and Shipping 2021, written communication, September).
The study sites selected were Le Morne (LM) (centred around 20°27'46.62" S and 57°20'19.43" E) and Grande Rivière Noire (GRN) (centred around 20°22'03.96" S and 57°22'25.74" E). These leeward sites are not too far from each other, and they experience similar climates. Both sites are Rhizophora mucronata areas planted by the Albion Fisheries Research Centre - initially planted around April 2012 with some 47 000 seedlings covering an area of 23 500 m2 at LM and around May 2003 with 42 000 seedlings covering an area of 25 000 m2 at GRN (Ministry of Blue Economy, Marine Resources, Fisheries and Shipping 2021, written communication, September). It is important to emphasise that the GRN mangrove site is situated at a major estuary as opposed to the LM mangrove site (Figure 1).
The mangrove areas were classified into plot sites based on patches under mangrove cover and labelled LM (S1-S17) and GRN (S1-S3) for Le Morne and Grande Riviere Noire, respectively (Figure 1).
The planted mangrove plots were then divided into zones based on the tidal water-level variations as follows:
• Zone 1: Substrate always submerged with water at low tide
• Zone 2: Substrate exposed at low tide only
• Zone 3: Substrate exposed at intermediate times between high and low tide only
• Zone 4: Substrate exposed at high tide
Image and field data sets
The sites were studied using satellite imagery from Landsat 7 and 8 Google Earth Pro™ (available free to the public) on spatial and temporal scales. Landsat 7 imagery, of 15-m spatial resolution, was used for data before 2013, and Landsat 8 imagery, of the same resolution, was used for data as of 2013. The imagery was selected in reference to the time periods from the year of propagation for each study area, 2003 for GRN and 2012 for LM, up to 2021.
Image processing techniques and data analysis
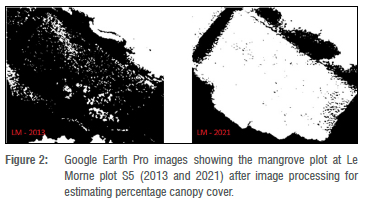
Google Earth Pro images throughout the years were selected based on the image resolution, cloud cover, time period and colour correction. From 2004 to 2009, no satellite images were available through Google Earth Pro. Image classification (pixel counting) techniques were then applied by using ImageJ (National Institutes of Health and the Laboratory for Optical and Computational Instrumentation), an open-source software for image processing. The satellite images were adjusted to a black and white threshold colour, and a number was attributed to each pixel (0 and 255). The pixels covering the mangrove plots were then counted to retrieve the percentage canopy cover. Figure 2 represents a typical plot in 2013 and 2021, after image processing techniques, for estimating the percentage canopy cover. The percentage canopy cover was then plotted in graphs using the function, y = aebt, where a and b are constants. The equation was linearised to extract 'b' the coefficient representing the rate of increase of canopy coverage. This function represents the onset of the expected sigmoid-shaped growth curves corresponding to three phases.33 The first initial phase or lag phase represents the initial growth stage, the second phase or log phase represents the exponential period of growth, and the third phase or the stationary phase represents the steady growth stage.
Field assessment
To estimate the percentage substrate underwater at high and low tides for each mangrove plot by Google Earth Pro, the GPS positioning at high and low tides was recorded using a GPS phone tracker. The pH, dissolved oxygen level and salinity were measured using portable instruments, namely a digital pH meter, dissolved oxygen meter and refractometer, respectively. The tidal water-level variations were monitored with a metre rod.
Statistical analysis
Tukey honest significant difference tests were done to detect differences between means. Correlations between the site assessment parameters and the linear equation function values were carried out using bivariate Pearson correlation analysis using the IBM SPSS Statistics 21 software.
Results
The rate of increase of canopy coverage, 'b', for each plot was determined from the second phase representing the exponential period of growth, and these were then correlated with chemical and physical parameters recorded at the mangrove sites to determine the factors affecting the growth and spread of the canopy cover.
Data processing and canopy cover
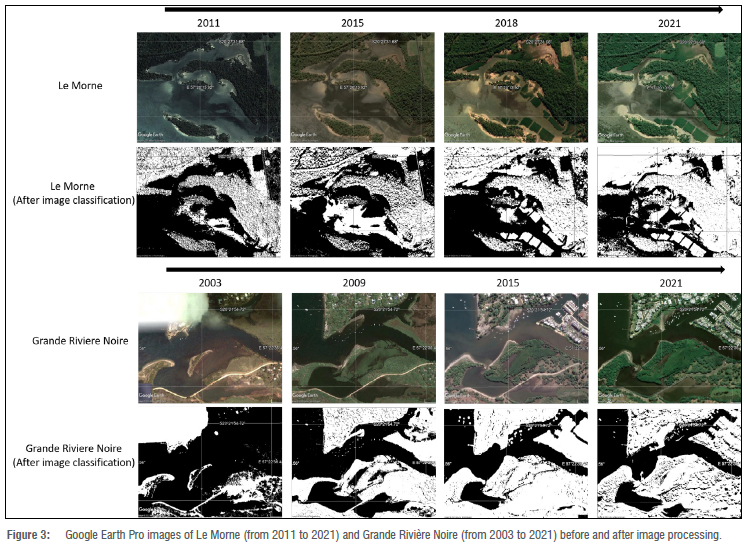
The mangrove canopy cover could easily be derived from the black and white image pixels as the mangrove plantation plots were free from other vegetation (Figure 3). At LM, S1, S2, S3, S4 and S5 plots (Zones 1-2) reached their steady growth state (percentage canopy cover >95%) as from 2019 and S8, S9, S10 and S15 plots (Zone 2) as from 2020 (~7-8 years after planting). However, as of August 2021 (~8-9 years after planting), S6, S7a, S11a, S12, S13 and S16a (Zone 3), and S7b, S11b and S16b (Zone 4) plots were still at 80-93% and 75-85%, respectively. The three mangrove plots at GRN reached their steady growth state as of 2018, i.e. ~ 15-16 years after planting. Total canopy area estimated from April 2012 to August 2021 at LM was 44 300 m2, and from May 2003 to August 2021 was 31 600 m2.
Zonal growth rates
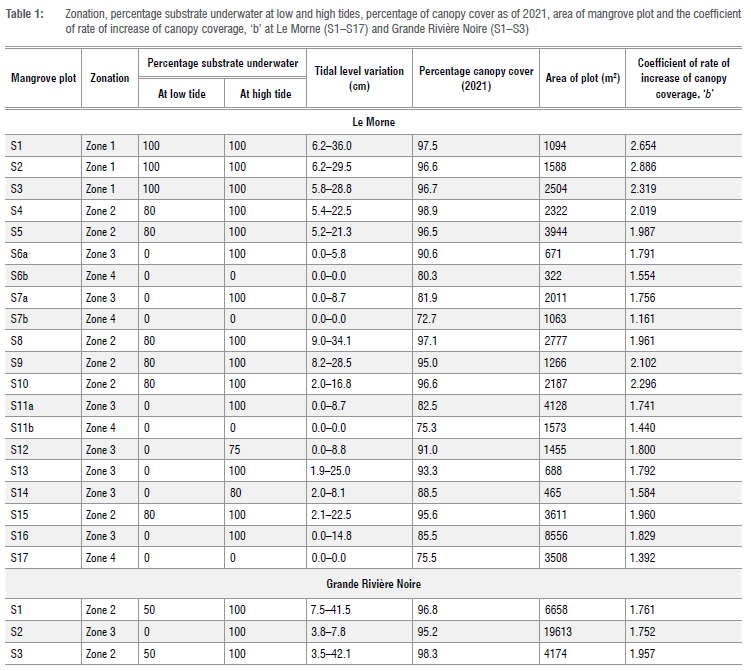
Table 1 summarises the characteristics of the plots studied with respect to their zonation. The Table also includes the percentage substrate underwater at low and high tides, tidal level variation, percentage of canopy cover in August 2021, and the coefficient of rate of increase of canopy coverage, 'b', for each site. The percentage substrate underwater and tidal level values (in cm) for Zones 1-4 were 100%, 80-100%, 0-100%, 0%, and 5.8-36.0, 2.1-34.1, 0.0-25.0, 0.0, respectively.
The range of values for 'b' for LM were compared zone-wise: Zone 1 (2.319-2.886) > Zone 2 (1.960-2.296) > Zone 3 (1.584-1.829) > Zone 4 (1.392-1.554). At GRN, similar 'b' values were obtained for Zone 2 (1.761-1.957) and Zone 3 (1.752), showing a similar rate of canopy increase. It is noteworthy that the 'b' values of LM were higher than those of GRN.
Statistically significant positive correlations were obtained between the 'b' values and the percentage substrate underwater (r=0.822, p<0.01), and tidal level variation (r=0.601, p<0.01).
Canopy cover pattern
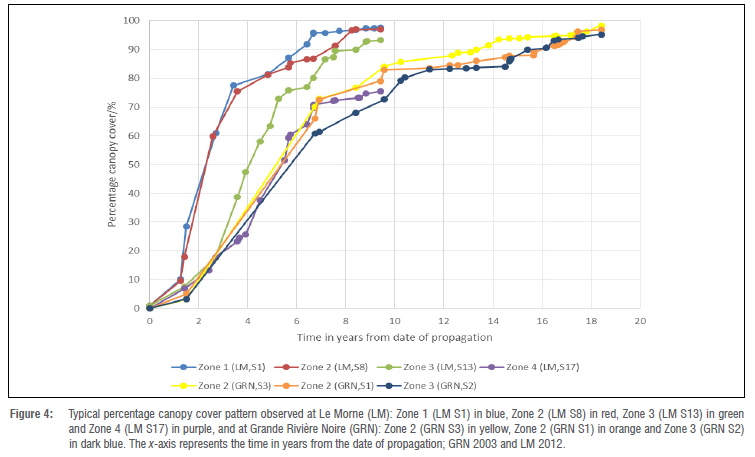
The sigmoid-shaped growth curves for representative sites in the four tidal zones are illustrated in Figure 4. It is noted that, at LM, the plots started to reach their steady state (>95%) after -6.4 years while at GRN it was achieved after -15.4 years. The exponential canopy growth for LM, as reflected by the 'b' values (Table 1) and time taken to reach the steady growth Stage was as follows: tZone 1 > tZone 2 >tZone 3 > tZone 4 At GRN, a similar pattern was obtained where tZone 2 > tZone 3.
Chemical parameters
The variation of pH and dissolved oxygen across the sites studied was found to be insignificant (p>.01). The salinity values, recorded using the practical salinity scale at LM and GRN (Table 2), were found to vary based on the positioning of the plots (Figure 1). Salinity values for LM (S1, S2 and S3) in Zone 1 and LM (S4 and S5) in Zone 2, which were all on the seaward side, ranged from 35 to 36. The salinity in the rest of the LM mangrove plots, irrespective of their zones, varied from 31 to 36. The salinity at GRN (S1 and S2) ranged from 22 to 30, while that of S3, which was in close proximity to a river, ranged from 5 to 21. The 'b' values of all mangrove plots under study displayed a positive correlation with salinity (r=0.438, p<0.01).
Discussion
The mangrove canopy for the two sites, LM and GRN, was compared over time. Higher 'b' values were recorded at LM (1.392-2.886) than at GRN (1.752-1.957). Because the mangrove planted under the Mangrove Propagation Programme at LM (2 seedlings per m2) was denser than that at GRN (1.68 seedlings per m2), it is expected that GRN plots took more time to reach a percentage canopy cover of >95% (stationary stage).
However, adjustments for the plant densities indicate that the 'b' values of GRN (-2.3 for Zone 2) are slightly higher than those of LM (-2.0 for Zone 2); which is expected given their proximity and hence similar climate conditions, but with the added advantages of slightly longer hours of sunshine and a wider salinity range for GRN sites.
The two sites were further investigated zone-wise. The 'b' values were as follows: bzone 1 > bzone 2 > bZone 3 > bZone 4 (Table 1; Figure 4). As GRN plots correspond only to Zones 2 and 3, they showed more or less the same tidal variation, thus explaining their similar 'b' values. These results suggest that higher 'b' values relate to regions with longer periods of tidal inundation. This finding is in line with studies carried out by He et al.34 and Hoppe-Speer et al.35, who found that Rhizophora mucronata was healthier in inundated areas compared to non-inundation zones. Similarly, Jackson and Drew36 and Adams37 reported that, as a response to prolonged inundation, estuarine plants grow more rapidly to increase the biomass over the water surface.
The pH and and dissolved oxygen recorded at LM and GRN were in the ranges 7.4-8.2 ppm and 7.75-9.18 ppm, respectively, while the salinity at LM and GRN were in the ranges 31-36 and 5-30, respectively. Studies involving the physicochemical properties of the mangrove ecosystem show that pH (7.4 to 8.2)38-41 and dissolved oxygen level (2.71 to 9.93 ppm)42 are not limiting factors to mangroves within these ranges. It is interesting to note that Rakotomavo et al.43 reported higher growth percentages at salinities of 15-25, with an optimum around 25 under controlled conditions44. Hoppe-Speer et al.35, on the other hand, reported an optimal salinity range of 8-18. Our results for Rhizophora mucronata under natural environmental conditions are not necessarily in disagreement when taking other factors, such as nutrient availability at the sites, into consideration.
The application of this novel technique based on pixel count and image processing of planted mangrove areas was successfully employed to determine the mangrove canopy growth rate to better understand the strategies employed for planting mangroves and determining the important parameters that promote growth. It was found that the highest 'b' values for Rhizophora mucronata growing under natural environmental conditions were favoured by two specific criteria: zones with higher percentage substrate submerged by water at low tide (Zone 1) and with salinities >30.
This technique can be further extended to identify potential areas for mangrove propagation worldwide based on the optimum growth parameters identified, especially in areas where mangroves are declining rapidly, thereby preventing them from becoming critically vulnerable, endangered, or extinct.45
Conclusions
This study highlights the potential use of remote sensing techniques along with image processing for mapping and monitoring mangrove forests. Image classification (pixel counting) with data acquired through Google Earth Pro™ was effectively used as a new approach to calculate the canopy coverage represented by b' values from the time of propagation; 'b' values were positively correlated with zonations based on substrate coverage by water, tidal level variation, and salinity for the two sites (with almost similar climates) studied. This technique can be extended to identify potential areas for mangrove propagation, especially in areas where mangroves are declining rapidly.
Acknowledgements
This paper is a component of M.D.D.'s doctoral project and the research was funded by the University of Mauritius and by the Higher Education Commission of Mauritius. We thank the Ministry of Blue Economy, Marine Resource, Fisheries and Shipping for authorisation to work at the selected mangrove sites and for provision of relevant information. We also thank the University of Mauritius for providing laboratory facilities and logistics facilities. Special thanks go to Mr Rookmoneea and Mr Khamun (who provided invaluable logistical assistance with fieldwork and the facilities) and the services section for logistic facilities.
Competing interests
We have no competing interests to declare.
Authors' contributions
M.D.D.: Conceptualisation; methodology; data collection; sample analysis; data analysis; validation; data curation; writing - the initial draft; writing -revisions; project leadership; project management; and funding acquisition. S.D.D.V.R: Conceptualisation; methodology; data analysis; validation; data curation; writing - revisions; student supervision; project leadership; project management; and funding acquisition. S.J.: Conceptualisation; methodology; data analysis; validation; data curation; writing - revisions; student supervision; project leadership; project management; and funding acquisition.
References
1. Liu H, Ren H, Hui D, Wang W, Liao B, Cao Q. Carbon stocks and potential carbon storage in the mangrove forests of China. J Environ Manage. 2014;133:86-93. https://doi.org/10.1016/j.jenvman.2013.11.037 [ Links ]
2. Sandilyan S, Kathiresan K. Mangrove conservation: A global perspective. Biodivers Conserv. 2012;21:3523-3542. https://doi.org/10.1007/s10531-012-0388-x [ Links ]
3. Mitra A. Mangrove forests in India: Exploring ecosystem services. Cham: Springer; 2020. https://doi.org/10.1007/978-3-030-20595-9 [ Links ]
4. Naidoo G. The mangroves of South Africa: An ecophysiological review. S Afr J Bot. 2016;107:101-113. https://doi.org/10.1016/j.sajb.2016.04.014 [ Links ]
5. Pysanczyn J. Threats to mangroves: The mangrove action project [document on the Internet] c2021 [cited 2022 Apr 11]. Available from: https://www.themarinediaries.com/tmd-blog/threats-to-mangroves-the-mangrove-action-project [ Links ]
6. Spalding M, Leal M. The status of the world's mangroves [document on the Internet]. c2021 [cited 2022 Apr 08]. Available from: https://www.mangrovealliance.org/wp-content/uploads/2021/07/The-State-of-the-Worlds-Mangroves-2021-FINAL.pdf [ Links ]
7. Spalding M. World atlas of mangroves. 1st ed. London: Routledge; 2010. https://doi.org/10.4324/9781849776608 [ Links ]
8. Ajonina G, Diamé A, Kairo J. Current status and conservation of mangroves in Africa: An overview. World Rainforest Movement Bulletin. 2008;133:1-6. [ Links ]
9. Adams JB, Rajkaran A. Changes in mangroves at their southernmost African distribution limit. Estuar Coast Shelf Sci. 2021;247, Art. #106862. https://doi.org/10.1016/j.ecss.2020.106862 [ Links ]
10. Western Indian Ocean Mangrove Network. Mangroves of Mozambique [document on the Internet]. c2022 [cited 2022 Aug 30]. Available from: http://wiomn.org/countries/mozambique/mangroves-of-mozambique/ [ Links ]
11. Western Indian Ocean Mangrove Network. Mangroves of Madagascar [document on the Internet]. c2022 [cited 2022 Aug 30]. Available from: http://wiomn.org/mangroves-of-madagascar/ [ Links ]
12. Wang Y Bonynge G, Nugranad J, Traber M, Ngusaru A, Tobey J, et al. Remote sensing of mangrove change along the Tanzania coast. Marine Geodesy. 2003;26:35-48. https://doi.org/10.1080/01490410306708 [ Links ]
13. Mangora MM, Lugendo BR, Shalli MS, Semesi S. Mangroves of Tanzania. In: Bosire JO, Mangora MM, Bandeira S, Rajkaran A, Ratsimbazafy R, Appadoo C, et al. editors. Mangroves of the Western Indian Ocean: Status and management. Zanzibar: WIOMSA; 2015. p. 161. [ Links ]
14. Adams JB, Veldkornet D, Tabot P Distribution of macrophyte species and habitats in South African estuaries. S Afr J Bot. 2016;107:5-11. https://doi.org/10.1016/j.sajb.2016.08.001 [ Links ]
15. Western Indian Ocean Mangrove Network. Mangroves of Mauritius [document on the Internet]. c2022 [cited 2022 Aug 30]. Available from: http://wiomn.org/mangroves-of-mauritius/ [ Links ]
16. Giri C. Observation and monitoring of mangrove forests using remote sensing: Opportunities and challenges. Remote Sens. 2016;8(9):783. https://doi.org/10.3390/rs8090783 [ Links ]
17. Hoppe-Speer SCL, Adams JB, Rajkaran A. Mangrove expansion and population structure at a planted site, East London, South Africa. South For. 2015;77(1):131-139. https://doi.org/10.2989/20702620.2014.1001622 [ Links ]
18. David RM, Rosserand NJ, Daniel N, Donoghuem M. Remote sensing for monitoring tropical dryland forests: A review of current research, knowledge gaps and future directions for southern Africa. Environ Res Commun. 2022;4(4):1-21. https://doi.org/10.1088/2515-7620/ac5b84 [ Links ]
19. Fatoyinbo TE, Simard M. Height and biomass of mangroves in Africa from ICESat/GLAS and SRTM. Int J Remote Sens. 2013;34(2):668-681. https://doi.org/10.1080/01431161.2012.712224 [ Links ]
20. Republic of Mozambique. Mapping of healthy and degraded mangrove vegetation in the Limpopo basin estuary [document on the Internet]. c2022 [cited 2022 Apr 10]. Available from: https://www.climatelinks.org/resources/mapping-healthy-and-degraded-mangrove-vegetation-limpopo-basin-estuary [ Links ]
21. RCMRD GeoPortal. Mozambique mangrove cover [document on the Internet]. c2022 [cited 2022 Aug 23]. Available from: https://rcmrd.africageoportal.com/datasets/africageoportal::mozambiquemangrovecover/explore?location=-22.294149%2C-18.715567%2C3.46 [ Links ]
22. Suhardiman A, Tsuyuki S, Sumaryono M, Sulistioadi Y Geostatistical approach for site suitability mapping of degraded mangrove forest in the Mahakam Delta, Indonesia. J Geogr Inf Syst. 2013;5:419-428. https://doi.org/10.4236/jgis.2013.55040 [ Links ]
23. Omar H, Misman MA, Musa S. GIS and remote sensing for mangroves mapping and monitoring. In: Rocha J, Abrantes P editors. Geographic information systems and science. London: IntechOpen; 2019. https://doi.org/10.5772/intechopen.81955 [ Links ]
24. Walaiporn P Manatsanan T. Mapping of mangrove change with remote sensing in Samut Songkhram Province, Thailand. In: Ahram T, Taiar R, Gremeaux-Bader V Aminian K, editors. Human interaction, emerging technologies and future applications II. Cham: Springer; 2020. p. 1152. https://doi.org/10.1007/978-3-030-44267-5_29 [ Links ]
25. Thakur S, Mondal I, Ghosh PB, Das P De TK. A review of the application of multispectral remote sensing in the study of mangrove ecosystems with special emphasis on image processing techniques. Spat Inf Res. 2020;28:39-51. https://doi.org/10.1007/s41324-019-00268-y [ Links ]
26. Kamal M, Phinn S, Johansen K. Characterizing the spatial structure of mangrove features for optimizing image-based mangrove mapping. Remote Sens. 2014;6:984-1006. https://doi.org/10.3390/rs6020984 [ Links ]
27. Ramsey EW III, Jensen JR. Remote sensing of mangrove wetlands: Relating canopy spectra to site-specific data. Photogramm Eng Remote Sens. 1996;62:939-948. [ Links ]
28. Davis BA, Jensen JR. Remote sensing of mangrove biophysical characteristics. Geocarto Int. 1998;13:55-64. https://doi.org/10.1080/10106049809354665 [ Links ]
29. Heumann BW. Satellite remote sensing of mangrove forests: Recent advances and future opportunities. Prog Phys Geogr. 2011;35(1):87-108. https://doi.org/10.1177/0309133310385371 [ Links ]
30. Kuenzer C, Bluemel A, Gebhardt S, Quoc TV Dech S. Remote sensing of mangrove ecosystems: A review. Remote Sens. 2011;3:878-928. https://doi.org/10.3390/rs3050878 [ Links ]
31. Rajkaran A, Adams JB, Du Preez D. A method for monitoring mangrove harvesting at the Mngazana estuary, South Africa. Afr J Aquat Sci. 2004;29(1):57-65. https://doi.org/10.2989/16085910409503792 [ Links ]
32. Maurya K, Mahajan S, Chaube N. Remote sensing techniques: Mapping and monitoring of mangrove ecosystem - A review. Complex Intel! Syst. 2021;7:2797-2818. https://doi.org/10.1007/s40747-021-00457-z [ Links ]
33. Karadavut U. Non-linear models for growth curves of triticale plants under irrigation conditions. Turk J Field Crops. 2009;14(2):105-110. [ Links ]
34. He B, Lai T, Fan H, Wang W, Zheng H. Comparison of flooding-tolerance in four mangrove species in a diurnal tidal zone in the Beibu Gulf. Estuar Coast Shelf Sci. 2007;74:254-262. https://doi.org/10.1016/j.ecss.2007.04.018 [ Links ]
35. Hoppe-Speer SCL, Adams JB, Rajkaran A, Bailey D. The response of the red mangrove Rhizophoramucronata Lam. to salinity and inundation in South Africa. Aquat Bot. 2011;95(2):71-76. https://doi.org/10.1016/j.aquabot.2011.03.006 [ Links ]
36. Jackson MB, Drew MC. Effects of flooding on growth and metabolism of herbaceous plants. In: Kozlowski T, editor. Flooding and plant growth. New York: Academic Press; 1984. p. 47-128. https://doi.org/10.1016/b978-0-12-424120-6.50008-0 [ Links ]
37. Adams JB. The importance of fresh water to the survival of estuarine plants [PhD thesis]. Port Elizabeth: University of Port Elizabeth; 1994. p. 172. [ Links ]
38. Sah KD, Sahoo AK, Gupta SK, Banerjee SK. Mangrove vegetations of Sunderbans and their effect on the physicochemical and nutrient status of the soils. Biol Sci. 1989;55:125-132. [ Links ]
39. Hossain MZ, Aziz CB, Saha ML. Relationships between soil physico-chemical properties and total viable bacterial counts in Sunderban mangrove forests, Bangladesh. Dhaka Univ J Biol Sci. 2012;21(2):169-175. https://doi.org/10.3329/dujbs.v21i2.11515 [ Links ]
40. Das S, De M, Ganguly D, Maiti TK, Mukherjee A, Jana TK, et al. Depth integrated microbial community and physico-chemical properties in mangrove soil of Sundarban, India. Adv Microbiol. 2012;2:234-240. https://doi.org/10.4236/aim.2012.23028 [ Links ]
41. Hossain MD, Nuruddin AA. Soil and mangrove: A review. J Environ Sci Technol. 2016;9:198-207. https://doi.org/10.3923/jest.2016.198.207 [ Links ]
42. Dubuc AIA. Dissolved oxygen as a constraint for the structure of mangrove fish assemblages and their patterns of mangrove utilisation: A comparison between natural and disturbed mangrove ecosystems through the Australian and Caledonian coastlines [PhD thesis]. Townsville, Qld: James Cook University; 2019. [ Links ]
43. Rakotomavo A, Mandimbinirina DS, Roger E. Development prospects of the mangrove relic of Foulpointe-East Madagascar. J Environ Prot. 2018;9(8):859-869. https://doi.org/10.4236/jep.2018.98053 [ Links ]
44. Aziz I, Khan M. Salt tolerance in Rhizophora mucronata Lam. Pak J Bot. 2001;33. [ Links ]
45. Duke NC, Meynecke JO, Dittmann S, Ellison AM, Anger K, Berger U, et al. A world without mangroves? Science. 2007;317(5834):41-42. https://doi.org/10.1126/science.317.5834.41b [ Links ]
 Correspondence:
Shobha Jawaheer
Email: shobha@uom.ac.mu
Received: 04 Apr. 2022
Revised: 02 Sep. 2022
Accepted: 05 Sep. 2022
Published: 31 Jan. 2023
Editors: Jennifer Fitchett, Adriaan van der Walt
Funding: University of Mauritius, Mauritian Higher Education Commission

