


Servicios Personalizados
Articulo
 Inglés (pdf)
 Articulo en XML
 Referencias del artículo
Indicadores

Links relacionados
-
 Citado por Google
 -
 Similares en Google
Compartir

 Permalink
South African Journal of Science
versión On-line ISSN 1996-7489
versión impresa ISSN 0038-2353
S. Afr. j. sci. vol.118 no.9-10 Pretoria sep./oct. 2022
http://dx.doi.org/10.17159/sajs.2022/11767
RESEARCH ARTICLE
The future is a zero-carbon building sector: Perspectives from Durban, South Africa
Naseema EliasI; Tirusha ThambiranI, II
ISchool of Environmental Sciences, University of KwaZulu-Natal, Durban, South Africa
IISmart Places, Council for Scientific and Industrial Research (CSIR), Durban, South Africa
ABSTRACT
The built environment is a critical part of the climate change problem in cities, and urban buildings can act as a scaled response to mitigating anthropogenic climate change. Buildings last for well beyond a hundred years and thus have the potential to provide cities with a healthier and safer environment for urban dwellers well into the future. The role of the building sector toward reducing greenhouse gas (GHG) emissions is now better understood, and has resulted in various initiatives globally to move toward being a net-zero carbon sector. The objective of this study was to provide an assessment of the costs in achieving the emissions-reduction potential for each high-emitting sector in the eThekwini Municipality (KwaZulu-Natal, South Africa) through the determination of a marginal abatement cost curve (MACC). The MACC was developed for 2030, 2040, and 2050 across key sectors and aligned with the approach used by the eThekwini Municipality by employing the GHG Protocol's BASIC level of reporting that excludes the Agriculture, Forestry, and Other Land-use (AFLOU) and Industrial Processes and Product Use (IPPU) sectors. We found that the building sector offers the lowest cost to mitigate each tonne of GHGs when compared to other sectors in the eThekwini Municipality. Several interventions within the building sector further display positive payback periods throughout its life cycle. The MACC produced in this study is the first of its kind for any municipality in South Africa and will provide insights into the net cost of interventions that would mitigate a tonne of carbon emissions.
SIGNIFICANCE: •The MACC produced in this study is the first of its kind for any municipality in South Africa. Developing a MACC adds to an important basket of factors that need to be considered when planning for future climates in cities and is of benefit in prioritising actions in addressing climate change. The MACC in this study demonstrates that energy efficiency interventions in the building sector offer substantial mitigation potential within the most feasible payback periods when compared to other sectors. •The MACC may be replicated by other municipalities, to support the prioritisation of actions needed to address climate change
Keywords: net-zero, zero emissions, climate change, greenhouse gases, climate action
Introduction
Cities are home to 55% of the world's population and could face the worst risks from climate change1, with many of the key and emerging global climate risks being concentrated in urban centres. Cities will be threatened by an unprecedented changing climate whilst the growing populations and development within these cities are likely to contribute to increased levels of greenhouse gas (GHG) emissions in the atmosphere.2
The building sector is one of the largest contributors to GHG emissions, largely through its energy use where it accounts for about one third of global energy use.3 It is estimated that the building sector contributes 28% of global GHG emissions, with a further 11% of emissions arising from the accounting and consideration of embodied emissions from building materials and construction activities.4 The building sector is recognised in the IPCC's 4th Assessment Report5 as displaying a substantial potential for climate change mitigation into the future. Given that buildings generally have a life span that can range from 40 to over 100 years4, reducing the output of carbon emissions of a building from the onset can offer emissions savings throughout its lifespan, providing substantial GHG emissions reductions at the lowest cost relative to other sectors5.
Increasingly there is focus placed on transitioning toward low to zero carbon buildings. In South Africa, four cities - eThekwini Municipality, the City of Cape Town, the City of Johannesburg, and the City of Tshwane - have made public declarations through the C40 platform, alongside a number of developed country cities (e.g. London, Montreal, and New York City), pledging that all new and existing buildings will have a low to zero carbon profile by 2030 and that all city-owned buildings will have a low to zero carbon profile by 2050.6 To date, there have been no marginal abatement cost curves (MACC) developed to assess the net costs of such interventions.
The definition of a low to zero carbon building (also referred to as a net-zero carbon building), according to the Green Building Council of South Africa7 is a highly energy-efficient building that is wholly powered from renewable energy sources that are on-site and/or off-site and may include off-sets that would neutralise a portion of the building operation's energy consumption. While embodied carbon is of significance as the sector represents at least 11% of global GHG emissions, embodied carbon is not considered under the definition of low to zero carbon buildings, which applies to the operational emissions from buildings.7
Energy efficiency makes up the foundation and largest component of a net-zero carbon building, where a net-zero carbon building refers to a building that emits very little to no GHGs and that is supported by supplementary renewable energy sources.7 Reducing the energy demands within a building is priority before the addition of renewable energy systems or off-sets, so that the need for these systems, and the associated costs, is reduced to a minimum.8 The building sector encompasses a diverse use of energy-intensive technologies that varies per sub-sector and building typology; however, designing a building with energy efficiency in mind can significantly conserve the energy usage of a building, such as allowing for natural sunlight to reduce the need for lighting and designing appropriate ventilation to reduce the need for space cooling.8 Energy efficiency in buildings in this paper is strongly linked to net-zero carbon building, especially as energy supply is separated from buildings into different sectors as per the Greenhouse Gas Protocol.9
The eThekwini Municipality contributes 5% of the country's total GHG emissions, responsible for 29 025 638 tCO2e.10 When accounting for emissions from electricity, the building sector represents 34% of eThekwini Municipality's GHG emissions and this amount is largely from residential and commercial buildings.11 With the eThekwini Municipality having committed to a net-zero carbon building sector6, the aim of this study was to describe the cost implications associated with such a commitment. A MACC has been developed specifically for this study to present an analysis of the mitigation potential and associated costs for key sectors in the eThekwini Municipality for the years 2030, 2040, and 2050. The MACC provides insights into the net cost of an intervention that would abate or mitigate a tonne of carbon emissions. The MACC presents time frames for 2030, 2040, 2050 across key sectors and highlights that the building sector offers significant GHG reductions at the lowest cost when compared to other high-emitting sectors in the eThekwini Municipality.
Mitigation potential within the eThekwini Municipality
The development of a MACC requires an estimation of the GHG emissions that can be mitigated per intervention within a sector (abatement costs).12 Typically, countries and cities compile GHG emission inventories and use these as a basis to understand the opportunities to mitigate these emissions into the future.12 This is commonly referred to as a Mitigation Potential Assessment, and essentially refers to the quantified potential to mitigate GHGs over specific timelines, and can also be referred to as the emissions-reduction potential.13 Mitigation potential is calculated as the difference in GHGs between a baseline or business-as-usual future where emissions reductions occur based on current policy projections and a future with enhanced emissions reductions.5 Mitigation Potential Assessments model the interventions required to achieve the emissions reductions in the future, which provides a vital foundation on which the MACC is developed and calculated. This study builds upon existing research on the mitigation potential of high-emitting sectors within the eThekwini Municipality that was developed as part of a partnership between C40 Cities and the eThekwini Municipality to develop a Climate Action Plan (hereafter referred to as the 'CAP').13
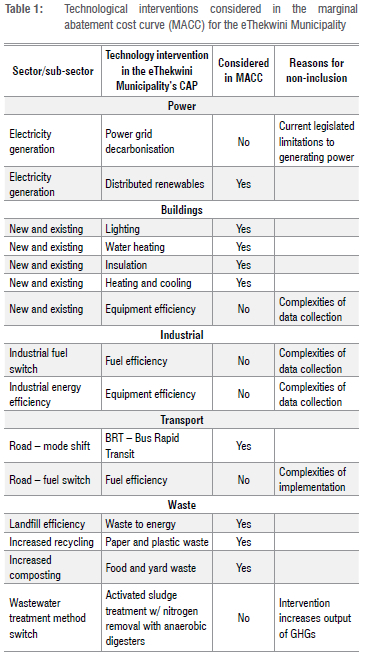
The CAP included a mitigation potential analysis that modelled emissions growth scenarios for various sectors in the eThekwini Municipality until 2050 and these emissions projections are listed in Table 1. The CAP's emissions growth projections are built on the 2015 baseline of emissions provided by the eThekwini Municipality's GHG report10 that uses guidelines for GHG reporting from the Greenhouse Gas Protocol9. The Greenhouse Gas Protocol's BASIC level of reporting excludes the Agriculture, Forestry, and Other Land-use (AFLOU) and Industrial Processes and Product Use (IPPU) sectors.9 Growth factors used within the CAP have been based on population and economic growth assumptions to inform future changes in the sectors analysed.13 The CAP's mitigation potentials are displayed as sectors based on end-user allocations (aligned to the Greenhouse Gas Protocol9) of GHG emissions where a technical and market-based approach is applied to reducing emissions up until 2050.13 A combined use of a technical and market-based approach means that emissions-reduction potentials are projected through tested interventions currently used around the world and to what portion of the market would readily adopt these interventions.13,14 Aligned to this approach, South Africa published country-wide mitigation potential analyses that included a series of MACCs14, and included a combination methodology of the two approaches to calculate the mitigation potential and its associated costs for sectors, aligned to the IPCC's 4th Assessment Report.5
However, a MACC did not accompany the mitigation potential analyses contained within the eThekwini Municipality's CAP and we seek to fulfil that gap, focusing on the building sector. The MACCs calculated in this paper are for 10-year periods going up to 2030, 2040 and 2050, using the CAP's modelled mitigation potential of sectors and their costs.
Development of a MACC for the eThekwini Municipality
Approach
Building on the work from the eThekwini Municipality's CAP Mitigation Potential Assessment, the MACC produced in this study is the first of its kind for any municipality in South Africa. The MACC of this study aligns to interventions used within the CAP13 for only those that are feasible from the current technical and legal perspectives listed in Table 1. In determining the MACC, the interventions selected were aligned to the CAP13 which used a combined technical and market-based approach based on the availability of each intervention and then modelled on the potential of the market that would adopt a GHG-reducing intervention or technology.14 Refer to the supplementary material for more information on the limitations of the model with specific regard to the interventions.
Research methodology
There is a set of core information that is necessary to generate a MACC for any area. This information includes but is not limited to:
1.calculation of the mitigation potential of sectors that would include the calculated volume of GHGs abated over a determined period
2.the full time frame of all interventions that would reduce GHGs within sectors
3.the total lifetime costs of all interventions, including both capital and operational expenses
4.financial savings or returns resulting from interventions
5.the cost of financing said interventions
6.an uptake/applicability factor
7.discount rates12,14
The formula for calculating the net annual cost (NAC) is13:
NAC (ZAR/year) = equivalent annual cost (ZAR/year) + annual operation & maintenance costs (ZAR/year) - energy cost saving (ZAR/year)
The formula for calculating the marginal abatement cost is:
MAC (ZAR/tCO2e) = net annual cost (ZAR/year) / total emissions reduction (tCO2e/year)
The CAP has modelled and detailed distinct projects and interventions that reduce GHGs projected to 2050 for each of the assessed sectors and includes details of the mitigation potential of each intervention up to 2050. For purposes of the MACC determined through this study, the costs were largely obtained from South Africa's national mitigation potential analyses14 with additional local costings for the waste and transport sectors obtained from research done in eThekwini on the costs to provide a more localised and specific context.15,16 An applicability rate was applied to each intervention already within the CAP, to effectively measure the rate of uptake that each sector would adopt for the intervention.13 This was further based on the emissions profile of the sector; for example, in the building sector, HVAC interventions were not considered for low-income houses and alternative methods of water heating were not considered for commercial warehouse buildings.13 For purposes of the MACC developed in our study, the only interventions considered were those for which the data were adequately recorded by the eThekwini Municipality and that could be legally implemented at the time of publishing.
As there may be more than one intervention with differing lifetime periods, it is important to ensure that there is consistency in comparing lifetime costs, which can be achieved by annualising the costs of each intervention.14 This can be represented by utilising net annual costs that consider the capital costs, operational costs and any associated costs minus the energy savings and/or revenue that may arise through the implementation of the intervention on an annual basis.14 The costs are annualised to allow for comparison with other interventions, where the interventions may have differing life spans, and therefore differing net annual costs.12
As we investigated the costs of mitigation potentials extending until 2050, a discount rate of 7% was applied to determine the present value of the money over a 30-year time-frame.14 A discount rate refers to the rate that will be used to discount a future value amount to its present value.14 Electricity prices have been projected using South Africa's Integrated Resource Plan (IRP) and are calculated for the building sector for avoided costs of electricity payments due to electricity usage reductions.17
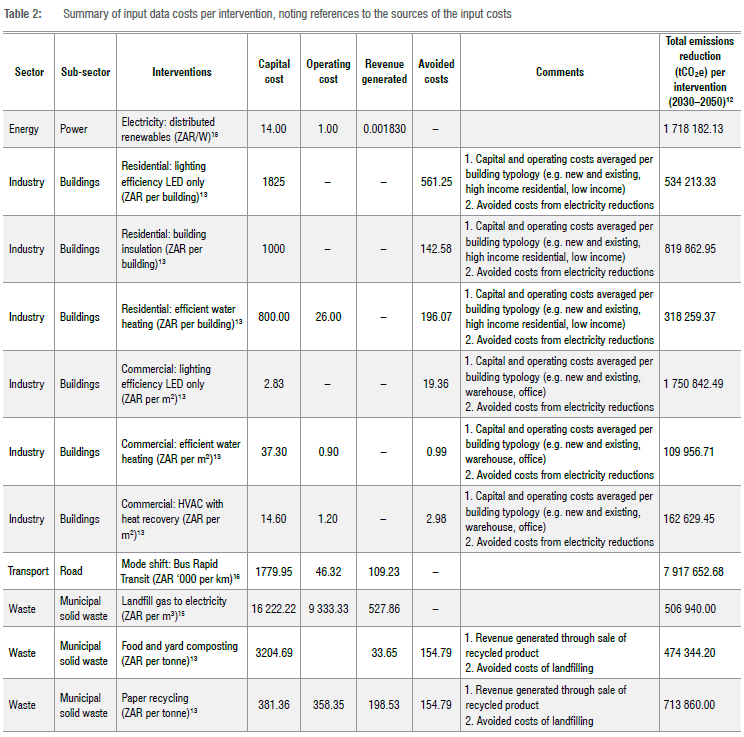
The MACC developed in this study analyses the key sectors in the municipality for the years 2030, 2040, and 2050 taking into consideration the key interventions proposed in the CAP completed for the eThekwini Municipality. Table 2 provides a summary of the cost inputs used to determine the MACC in this paper, noting that all interventions, their scale, and their emission reduction projections have been obtained from the CAP.
Marginal abatement cost curves for the eThekwini Municipality
The building sector
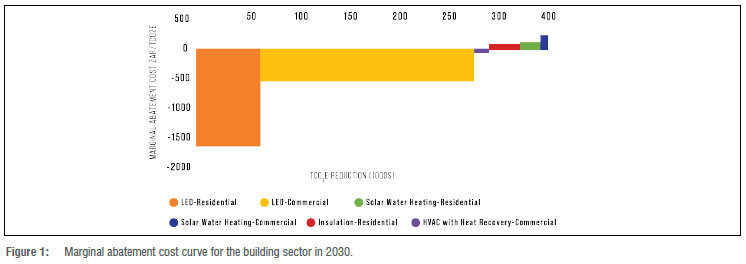
The interventions represented by the MACC show a generalised emissions reduction cost for all building typologies in the residential and commercial sectors. This cost includes a projected number of newly constructed buildings that would be built with energy-efficient interventions and the number of existing buildings that would be converted to energy-efficient buildings.
For the first period in the analysis (2030-2040), the building sector is the only sector that provides a return on investment. This is displayed on the graph as a negative cost (Figure 1). To aid in reading the MACC, it is important to note that the width of the graph on the horizontal axis specifies the amount of potential carbon emissions abatement (tCO2e) whereas the vertical axis displays the modelled costs for the reduction in carbon emissions specific to the intervention used (ZAR/tCO2e).
With six interventions arising from the building sector, three of these interventions result in a negative financial implication, which means that these interventions result in energy savings that surpass the capital and operational costs within the first 10 years. The shift from compact fluorescent lights to light-emitting diodes (LEDs) offers the most potential for emissions reductions for the residential and commercial sectors and is inclusive of existing and new buildings to provide a negative cost. Implementing efficient HVAC technologies in new commercial buildings also provides a negative cost and contributes towards emissions reductions. The 2030 MACC for the building sector (Figure 1) does show interventions that incur a cost, namely solar water heating interventions and insulation measures.
Lighting interventions within commercial buildings consistently deliver the most GHG reductions in each time frame, while residential lighting interventions offer the most cost-effective solution. Interventions to increase the insulation of residential buildings are slowly applied at a rate of 5% in 2030 and cumulatively increased to 10% for 2040, and steeply increased to 80% of all residential houses by 2050, which accounts for the significant growth in GHG reductions from this intervention.13
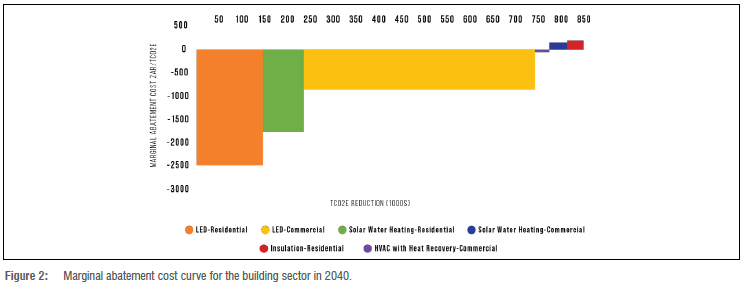
Figure 2 displays the MACC for the building sector for the period of 2030-2040. Solar water heating for the residential market now results in a negative cost in addition to lighting interventions, the commercial sector's solar water heating, and the residential sector's enhancement of insulation interventions.
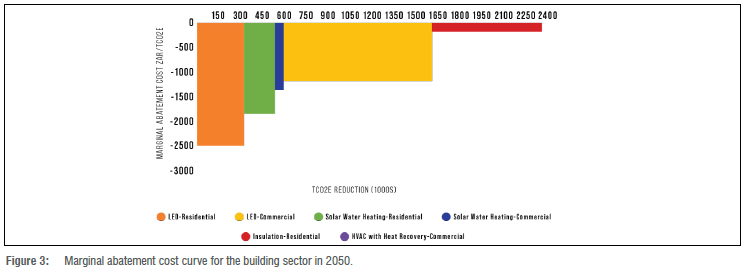
Figure 3 displays a full range of interventions within the building sector that all result in a negative cost in 2050. This means that there is not a single intervention in the building sector that does not provide a return on investment within the 10-year period from 2040 to 2050. The graph for GHG-reducing interventions for the commercial sector for the 'HVAC with Heat Recovery' aspect does not display in the scale of the graph as results show a slight negative cost of ZAR20 per kilotonne of carbon emissions reduced.
MACC for stationary energy - implementing distributed renewable energy generation
Distributed generation refers to electricity that is being produced by multiple grid-connected generation systems generally from residential and commercial buildings.17 In this manner, energy is generated closer to where it will be consumed in comparison to conventional energy supply systems in South Africa and is commonly referred to as small-scale embedded generation.18 Distributed generation of electricity is thus characterised by a decentralised supply. For small-scale distributed generation, generation is derived from buildings, and in the context of the eThekwini Municipality, it should be done via rooftop photovoltaic panels. The IRP sets out that small-scale embedded generation use is restricted to a single customer, and this implies boundaries around distributing energy.17
We calculated the costs of integrating distributed renewable energy by means of small-scale embedded energy generation that is legally allowed. The costs were calculated through utilising current market costs per Watt to install small-scale embedded energy generation in the eThekwini Municipality.18
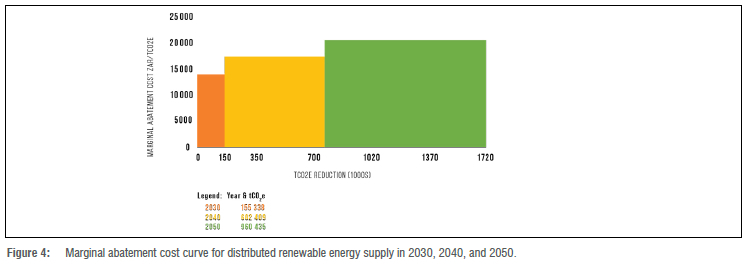
Figure 4 graphically displays the MACC for the distributed generation of renewable energy for all periods (2030, 2040, and 2050). The vertical axis represents the cost of reducing a single tonne of carbon dioxide, where there is a cost implication of ZAR13 982.30 to reduce one kilotonne of carbon emissions for the year 2030, and similar costs of ZAR17 461.65 and ZAR20 492.90 to reduce a kilotonne of emissions for 2040 and 2050, respectively.
While costs for distributed generation increase in the second decade of implementation, there is a strong reduction in emissions that increases to about 300% and further rises to over 500% in 2050.
MACC for implementing low carbon transportation
For low-carbon transportation, this MACC focuses on Bus Rapid Transit (BRT) systems; BRT refers to a road-based solution to providing public transportation services that are accessible and more affordable than rail systems.13 This intervention involves increasing the modal share of the usage of buses as opposed to passenger automobiles in the Municipality.16 Despite the name of this intervention, the eThekwini Municipality follows the approach of a dedicated lane for a high occupancy transport vehicle using standard city buses that is not of the usual BRT design.16 This approach is different from those of the City of Johannesburg, the City of Tshwane, and the City of Cape Town that operate buses designed to be specific to the needs of the BRT system.16 This means that the capital costs arising for the Municipality are largely the infrastructure costs of implementing a BRT system.
Due to the sector containing a single intervention only, the full period from 2030 to 2050 is displayed on a single graph in Figure 5. Evidently, the cost implication of this intervention reaches over ZAR35 000 to reduce a single kilotonne of carbon emissions in 2030 but drops sharply to 2040 by 79% and with the emissions reduction potential increasing substantially by 490% (Figure 5).
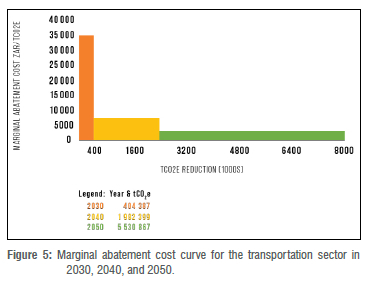
Despite the high costs, providing a safe and accessible public transportation system is already a priority in the Municipality and will provide far-reaching social and economic benefits that have not been quantified in this study.
MACC for the waste sector
The waste sector includes interventions for the recycling of paper and plastic, composting of food and garden waste, and capturing landfill gas for electricity. These interventions incur costs to reduce carbon emissions with no direct financial payback. However, the reduction and recycling of waste materials will have significant environmental and social benefits beyond reducing carbon emissions, such as conserving landfill space and reducing the leachate of pollutants from landfills.
The MACC for the recycling of waste takes into account the capital costs of setting up the collection, sorting, and recycling services specific to the waste type and the operating and ancillary costs of these services and finally considers the revenue generated from the sale of the recyclable or recycled material that would have ordinarily been discarded.14 The costs for composting of food and yard waste refer to home composting methods where it is assumed that 50% of urban households have gardens and that the uptake rates for home composting by households in the eThekwini Municipality is 50% for food waste and 75% for garden waste, and this uptake rate remains consistent across the assessed period (2030-2050).13 The cost for home composting involves the purchase of composting bins and the value of compost produced, combined with the reduced costs of waste going to landfill.14 The costs and incomes for both the recycling and composting interventions were obtained from the national report for South Africa's MACC.14
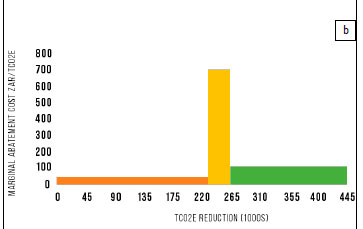
The eThekwini Municipality has been implementing landfill gas intervention programmes since the early 1990s for purposes of minimising negative health and safety impacts.15 The Municipality in 2000 pioneered the first registered Clean Development Mechanism project in Africa through their landfill gas to electricity intervention.15 The eThekwini Municipality has a noteworthy case study of converting landfill gas to electricity at the Bisasar Road landfill, and costs from this existing measure were analysed and extrapolated to present a cost estimate for increasing and maintaining this intervention in 2030, 2040, and 2050.15 The revenue generated from this intervention is derived from the sale of electricity produced from the captured gas, and is scaled upwards based on the IRP's electricity cost projections.17 Due to the sub-tropical climate of the eThekwini Municipality, the majority of available landfill gas is extracted earlier in the life of a landfill with a high methane content.15 Converting landfill gas to electricity provides the highest carbon emissions reduction for 2030 in the waste sector. However, paper recycling takes the position of highest emissions reductions in the waste sector by 2040 when emissions reductions from landfill gas to electricity drops by 30%. By 2050, emissions reductions from landfill gas to electricity drops 70.14% from the 2030 figure. It can be noted in Figure 6, that the costs of landfill gas extraction largely remain the same, while the emissions reduction potential decreases over time.
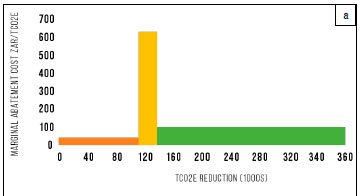
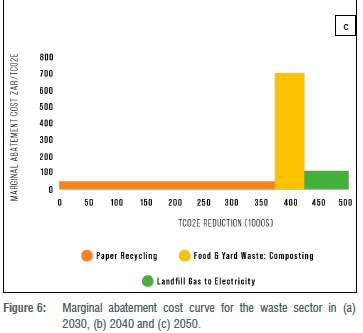
As displayed in Figure 6a, the recycling of paper to reduce GHG emissions arising from the waste sector by 2030 provides the lowest abatement cost per kilotonne of carbon emissions reduced.
It is interesting to note the low costs arising from the recycling of paper. Outside of the building sector, paper recycling has the lowest abatement cost and offers a consistently low cost until the end of the period in this study. The case for emissions reductions with paper recycling improves; Figure 6b shows that emissions reductions increased 216%. The total increase in emissions reductions for the entirety of the assessed period until 2050 is 346%, and this can be viewed through an increase from Figure 6a through to Figure 6c, where Figure 6c is the final period of assessment. While the costs for paper recycling largely remain the same, there is a compelling case to be made through the significant reduction of GHGs.
The composting of food and yard waste is a contrasting image in this sector as the costs and emissions reductions remain consistent throughout the assessed periods. These costs are the highest of all assessed interventions, and the emissions reductions potential is notably the lowest. It is important to note that the scale of intervention applied to the sector is also consistent for all three periods, implemented in three parts across the assessed periods between 2030 to 2050.13
Summary of results
The IPCC5 demonstrated that, on a global scale, the building sector could contribute towards achieving the goals outlined by science in the Paris Agreement.5,6 South Africa's national MACC calculated in 2016 highlighted the building sector to offer the most emissions reductions at the lowest cost when compared to all other sectors.14 This study confirms that the building sector in the eThekwini Municipality offers the highest abatement potential at the lowest cost when compared to any other sector, aligning to previous studies by C40 and ICLEI.3,6
The determination of the eThekwini Municipality's GHG mitigation potential conducted for the CAP provided a key departure point for the development of the MACC for emission reduction forecasts within the Municipality. Based on the MACC, the building sector offers the lowest cost to reduce GHG emissions when compared to the other studied sectors. Several interventions within the building sector display negative costs, indicating that the intervention will have a positive payback period throughout its life cycle. The building sector, out of all analysed economic sectors in the eThekwini Municipality, dominates the first percentile of abatement costs that refers to the lowest cost interventions (refer to the supplementary material for more information on the percentiles). This indicates that the building sector should be prioritised for early action as it represents the most cost-effective sector for reducing the first 25% of the eThekwini Municipality's available lifetime mitigation potential. All interventions to reduce GHG emissions up to 2050 in the building sector provide a return on investment. The intervention with the lowest cost is the installation of efficient LED lighting in both new and existing buildings for both the national MACC14 and for the MACC developed for the eThekwini Municipality in this study.
The waste sector has the second lowest abatement costs in the eThekwini Municipality. The transportation sector displays the highest abatement power across all assessed sectors for the eThekwini Municipality, followed by the power sector. The low costs for the waste sector largely arise from the revenue generated through the resale of the waste material and also from reducing the costs associated with landfilling, where there are costs to landfill in the eThekwini Municipality and in South Africa. The waste sector represents the sector with the third lowest cost for the national MACC, but this is due to the consideration of the AFLOU sector in the national MACC that was not accounted for in the CAP.13,14 It is important to note that a MACC is not meant to be the final deciding factor for policymakers, but only to add to an important basket of factors that need to be considered when planning for future climates in cities.
The building sector represents a unique opportunity for the eThekwini Municipality to serve as best practice by taking appropriate climate action, and in optimising service delivery offerings to inhabitants at lower operating and administrative costs.
Summary and recommendations
The determination of the eThekwini Municipality's GHG mitigation potential conducted for the CAP provided a key departure point for the development of the MACC for emission reduction forecasts within the Municipality. Based on the MACC, the building sector offers the lowest cost to reduce GHG emissions when compared to the other studied sectors. Interventions to reduce GHG emissions in the building sector fall into the first percentile that refers to the lowest cost interventions (refer to supplementary material) meaning that there is significant potential for mitigation of GHGs within the building sector. As the Municipality has publicly committed to ensuring that all new and all municipal-owned buildings will have a net-zero carbon profile by 2030, and that all existing buildings will have a net-zero carbon profile by 2050, the potential is that about one third of GHG emissions in the Municipality could be mitigated.
The MACC developed in this study confirms that the building sector will deliver the highest GHG reductions at the lowest costs in the eThekwini Municipality, but only through energy-efficiency measures. It is therefore recommended that the building sector be prioritised in the list of actions needed to address climate change. Not only is the building sector a low-cost and high-potential sector, it also serves as a scaled approach to address a wide variety of sustainability issues such as water conservation and waste management. Ensuring resource efficiency in the building sector will add to the continuity of operations within buildings, thus minimising disruptions and ensuring that the Municipality has an attractive space for investment and living.
Due to the magnitude of such a complex assessment, the scope of assessing the economic potential in this study was focused on the financial bottom-line costs of the interventions, which is limited to the capital and operation costs, with no consideration given to social costs and benefits and social discount rates. It would be invaluable to consider the social costs and benefits such as job creation, and the quantification of the costs of future threats to the eThekwini Municipality. It is important to note that the MACC does have limitations as it neglects to account for societal changes and behavioural studies, and does not account for a holistic representation of all externalities that may have negative local economic impacts such as local air pollution.17 Furthermore, the MACC does not account for potential benefits that will arise through mitigating climate change and from the reduction of future risks.
It is recommended that future studies explore all sectors aligned to the BASIC+ system of reporting and that outcomes assessed further include data that go beyond the scope of this research that would describe the number of jobs created per intervention, the economic implications on GDP arising from the implementation of the intervention, and the associated social benefits.
Furthermore, while this study broadly highlights the building sector as offering significant GHG emission reductions at the lowest abatement cost, a more detailed study that includes interventions within the industrial sub-sector is recommended. Industrial efficiency interventions offer a larger amount of mitigation potential than the building sector, almost three times as much; although currently accessing such data from industries has proven difficult and requires greater partnerships to unlock these barriers.
Acknowledgements
We are grateful for the contributions made by the eThekwini Municipality's Climate Action Plan (CAP) project team and the South African Department of Environment, Forestry and Fisheries (DFFE) for their contributions and inputs toward determining a marginal abatement cost curve for emission reduction forecasts within the Municipality.
Competing interests
We have no competing interests to declare.
Authors' contributions
This study forms part of the MSc undertaken by N.E. and supervised by T.T. N.E. wrote the paper and T.T. edited and reviewed the content.
References
1.Edenhofer O, Pichs-Madruga R, Sokona Y, Minx JC, Farahani E, Kadner S, et al. Intergovernmental Panel on Climate Change: Climate change 2014 mitigation of climate change: Fifth assessment report. Cambridge, UK: Cambridge University Press; 2014. http://dx.doi.org/10.1017/cbo9781107415416 [ Links ]
2.Masson-Delmotte V, Zhai P, Pörtner HO, Roberts D, Skea J, Shukla PR, et al. Intergovernmental Panel on Climate Change: Summary for policymakers. In: Global warming of 1.5°C. An IPCC special report on the impacts of global warming of 1.5°C above pre-industrial levels and related global greenhouse gas emission pathways, in the context of strengthening the global response to the threat of climate change, sustainable development, and efforts to eradicate poverty. Geneva: World Meteorological Organization; 2018. [ Links ]
3.ICLEI Local Governments for Sustainability. Cities and regions advancing global climate action at COP23: ICLEI Advocacy in focus [webpage on the Internet]. c2018 [cited 2020 Feb 06]. Available from: https://iclei.org/en/BEA.html [ Links ]
4.Global Alliance for Building and Construction: United Nations Environment Programme. Buildings global status report [webpage on the Internet]. c2018 [cited 2020 Mar 09]. Available from: https://globalabc.org/media-global-advocacy/why-buildings-our-key-messages [ Links ]
5.Core Writing Team, Pachauri RK, Reisinger A, editors. Intergovernmental Panel on Climate Change: Fourth Assessment Report (AR4): Synthesis Report of the United Nations Intergovernmental Panel on Climate Change (IPCC). Cambridge, UK: Cambridge University Press; 2007. Available from: https://www.ipcc.ch/report/ar4/wg1/ [ Links ]
6.C40 Cities. Private buildings efficiency [webpage on the Internet]. c2017 [cited 2019 Sep 08]. Available from: https://www.c40.org/networks/private-building-efficiency [ Links ]
7.Green Building Council South Africa. Net zero technical manual [document on the Internet]. c2019 [cited 2019 Oct 12]. Available from: https://gbcsa.org.za/wp-content/uploads/2019/03/GBCSA-Net-Zero-Technical-Manual-v1.0-2019-03.pdf [ Links ]
8.Becqué R, Mackres E, Layke J, Aden N, Liu S, Managan K, et al.. Accelerating building efficiency: Eight actions for urban leaders [webpage on the Internet]. c2016 [cited 2019 Oct 20]. Available from: http://publications.wri.org/buildingefficiency [ Links ]
9.Greenhouse Gas Protocol World Resources Institute, C40 Cities, ICLEI. GHG protocol for cities - an accounting and reporting standard for cities [document on the Internet]. c2014 [cited 2019 Aug 07]. Available from: https://ghgprotocol.org/greenhouse-gas-protocol-accounting-reporting-standard-cities [ Links ]
10.eThekwini Municipality, Energy Office, Environmental Planning and Climate Protection Department. GHG inventory - Technical report [document on the Internet]. c2017 [cited 2020 Jan 19]. Available from http://www.durban.gov.za/City_Services/energyoffice/Pages/GHG-Inventory.aspx [ Links ]
11.Sustainable Energy Africa (SEA), eThekwini Municipality. METIS Sustainable Energy Action Plan - Benchmarking report. Durban: eThekwini Municipality; 2016. [ Links ]
12.Kesicki F, Ekins P. Marginal abatement cost curves: A call for caution. Clim Policy. 2012;12(2):219-236. http://dx.doi.org/10.1080/14693062.2011.582347 [ Links ]
13.C40 Cities, Environmental Planning and Climate Protection Department, eThekwini Municipality. Durban Climate Action Plan 2019 - Towards climate resilience and carbon neutrality [document on the Internet]. c2019 [cited 2019 Nov 05]. Available from: https://cdn.locomotive.works/sites/5ab410c8a2f42204838f797e/content_entry5c8ab5851647e100801756a3/5e5e3f71469c8b00a735fbac/files/Climate_Action_Plan_web.pdf [ Links ]
14.South African Department of Environmental Affairs. South Africa's greenhouse gas mitigation potential analysis - Technical report [document on the Internet]. c2016 [cited 2019 Jul 18]. Available from: https://www.dffe.gov.za/sites/default/files/docs/mitigationreport.pdf [ Links ]
15.Moodley L, Parkin J, Wright M, Bailey B, Sobey D. Beyond the well - The landfill gas to electricity CDM. Presented at: Wastecon 2014; 2014 October 6-10; Somerset West, South Africa. [ Links ]
16.Sanral Soc Limited, Acer (Africa) Environmental Consultants, Local Transport Authority, eThekwini Metropolitan Municipality, KwaZulu-Natal. Feasibility study of extending the Western Freeway Corridor PT Lane to Pinetown & an assessment with mitigation measures for the EB Cloete Four Level Interchange. Unpublished report 2018. [ Links ]
17.South African Department of Energy. IRP: Integrated Resource Plan 2019 [document on the Internet]. c2019 [cited 2020 Feb 02]. Available from: www.energy.gov.za/IRP/2019/IRP-2019.pdf+&cd=1&hl=en&ct=clnk&gl=za [ Links ]
18.eThekwini Municipality, EAB Astrum. Durban Solar Financial Model [webpage on the Internet]. c2020 [cited 2020 Feb 11]. Available from: http://www.durban.gov.za/City_Services/energyoffice/Pages/Durban-Solar-Financial-Model.aspx [ Links ]
 Correspondence:
Naseema Elias
Email: nas.elias21@gmail.com
Received: 17 July 2021
Revised: 09 Mar. 2022
Accepted: 01 Apr. 2022
Published: 29 Sep. 2022
Editors: Michael Inggs
Funding: None

