


Serviços Personalizados
Artigo
 Inglês (pdf)
 Artigo em XML
 Referências do artigo
Indicadores

Links relacionados
-
 Citado por Google
 -
 Similares em Google
Compartilhar

 Permalink
South African Journal of Science
versão On-line ISSN 1996-7489
versão impressa ISSN 0038-2353
S. Afr. j. sci. vol.118 spe Pretoria 2022
http://dx.doi.org/10.17159/sajs.2022/12522
RESEARCH ARTICLE
What material flow analysis and life cycle assessment reveal about plastic polymer production and recycling in South Africa
Taahira GogaI; Kevin HardingII; Valentina RussoIII; Harro von BlottnitzI
IEnvironmental and Process Systems Engineering Research Group, Department of Chemical Engineering, University of Cape Town, Cape Town, South Africa
IIIndustrial and Mining Water Research Unit (IMWaRU), School of Chemical and Metallurgical Engineering, University of the Witwatersrand, Johannesburg, South Africa
IIISustainability, Economics and Waste Research Group, Smart Cluster Council for Scientific and Industrial Research (CSIR), Stellenbosch, South Africa
ABSTRACT
Global production and consumption of plastics have increased significantly in recent years. The environmental impacts associated with this trend have received growing attention internationally with single-use plastic packaging responsible for most plastic pollution. Locally, the SA Plastics Pact, the Industry Master Plan, and the National Waste Management Strategy all aim to transform the current linear sector model into a circular system by setting targets for increased collection and recycling rates and recycled content. However, the associated impacts of implementing such circular interventions have not yet been assessed across the plastics life cycle. Industrial ecology tools, material flow analysis and life cycle assessment, are used to generate mass-based indicators as well as indicators of climate damage in the form of the global warming potential. The carbon footprint of the South African plastics value chain from cradle to grave was estimated at 17.9 Mt CO2eq emissions in 2018, with 52% of these due to the local coal-based monomer production process. The end-of-life stage lacks proper waste collection for a third of the population, but contributes only 2% to the total greenhouse gas emissions, with recycling having a minimal environmental impact. Future projections of plastics production, use, disposal, and recycling for 2025 show that increasing mechanical recycling rates to achieve stated targets would start to have a significant effect on virgin polymer demand (in the order of several billion rands of sales annually) but would also reduce waste disposal by 28% relative to baseline growth and 18% below values calculated for 2018.
SIGNIFICANCE:
• Despite increased attention, the flows and resulting life cycle-based carbon footprint of the plastics sector have not been evaluated on a local scale.
• The carbon footprint of the South African plastics industry is sizeable at almost 18 Mt CO2eq per annum with emissions strongly associated with the linear rather than the circular stages of the value chain.
• The impacts of a key circular economy intervention, namely increased recycling rates to achieve set targets include demand reduction for virgin polymer to the tune of several billion rands.
Keywords: plastics, material flow analysis, life cycle assessment, recycling, South Africa
Introduction
Plastics play a crucial role in modern-day existence due to their unique properties of chemical resistance, durability, and low cost. As a result, plastic production globally has increased rapidly by 4% between 2010 and 2015.1 However, historical and current levels of consumption and disposal have led to several environmental concerns. Approximately 4-8% of the world's oil and gas production is used as fossil fuel feedstock for plastics production, contributing to global greenhouse gas emissions.2 Additionally, poor waste management of short-lived plastics, which are typically discarded or disposed of in landfills within a year of manufacture, has contributed to plastic pollution in the natural environment.
There have been various solutions proposed to tackle the issues associated with the plastics life cycle. The circular economy concept is described as 'an industrial economy that is restorative or regenerative by intention and design' which aims to replace the 'end-of-life' concept with restoration for the elimination of waste.3 Aligned to the principles of the circular economy is the 'New Plastics Economy' which aims to deliver improved environmental and economic systems by dissociating from fossil-based input materials, reducing plastic leakage into the ecosphere, and creating an effective after-use plastics economy.4 In line with this vision, The SA Plastics Pact has undertaken to transform the country's packaging sector by 2025, setting targets centred around the concepts of material reuse, recycling, and recovery.5 The recently published extended producer responsibility (EPR) regulations also seek to set reuse, collection, and recycling targets as well as a mandatory percentage of recyclate content for various plastic products.6 The aim of these two initiatives is to foster more closed-loop ad-hoc recycling applications which will translate into better recyclate quality to substitute virgin material.
Literature
The plastics industry in South Africa
The South African plastics industry is responsible for the conversion of over 1.8 million tons annually of both locally produced and imported polymer as well as recyclate.7 In terms of end-of-life management, there is a large disparity in the provision of formal waste management services with just under 32% of South African households lacking access to basic refuse removal services.8 Although recent plastic recycling surveys report high input recycling rates of over 40% for all plastics9, only a small fraction of recyclate is a suitable substitute for virgin polymer9. The majority of recyclate currently produced is used in open-loop recycling, i.e. it is employed in lower value markets (bottles to pipes, bags, etc.) as opposed to closed-loop recycling (bottle-to-bottle). This is highlighted by the fact that there is only a single bottle-to-bottle recycling company operating in South Africa.10 Furthermore, a fragmented waste management system leads to the disposal of a large proportion of post-consumer material into illegal dumps and unlicensed landfill sites which increases the potential of plastic leakage into the environment.
As the 32nd highest producer of plastics globally11, the South African plastics industry forms one of the key segments of the local chemicals manufacturing sector. The production of monomers, namely ethylene and propylene, are by-products of the coal-to-liquids process employed by Sasol.12 This process is recognised as a major emitter of carbon dioxide and plans are being developed to address this concern. In particular, the company's latest climate change report indicates their target of a 30% reduction of scope 1 and 2 emissions by 2030 with a view to achieving net-zero greenhouse gas (GHG) emissions by 2050.13
Industrial ecology tools
As waste management strategies evolve from disposal to recovery and reuse, indicators based on suitable tools are required to measure and monitor progress. Material flow analysis (MFA) - a tool used in resource and waste management - is defined as a systematic assessment of the flows and stocks of material within a system defined in space and time.14 As a material accounting tool, it is used to compare inputs, accumulation, and outputs of a process on various levels. On the other hand, life cycle assessment (LCA) is an analytical assessment tool used to determine the potential environmental impact of a product or process through its life cycle.15 The guidelines dictate that the assessment consists of four phases: (1) goal and scope definition, (2) inventory analysis, (3) impact assessment, and (4) interpretation. Both methods of assessment can be combined in systems analysis as MFA can be considered a technique to obtain data required for the life cycle inventory.
There have been numerous MFAs conducted for plastics, on local and national scales, for countries in Asia and Europe. In Austria, consumption increased by 15% within a 10-year period16 while the growth in India was projected to increase by a factor of six between 2000 and 203017. Recently, Babayemi et al.18 presented the first continental analysis of mass importation and consumption of polymers and plastics products in Africa, with the assessment highlighting a strong link between GDP and plastic consumption. In the case of South Africa, plastic MFAs have been commissioned by the Department of Environmental Affairs to determine issues plaguing the plastics sector as well as to provide guidance regarding policies to support sound end-of-life management.19 Another joint research project has been published in which a local inventory of plastic flows was used to identify plastic pollution and leakage hotspots.20 In both cases, the scope of the investigation differs, which results in a variation in the estimated quantities of waste generated and disposed of. The former included indirect plastic imports in their input flows which required knowledge of the plastic content of the product and the associated weight of primary and secondary plastic packaging. In terms of scope, the latter considered the use and leakage of plastics in sectors such as textiles, automotive, and electrical and electronics. Both studies highlighted the fact that there was a degree of uncertainty with respect to the estimation of certain flows due to data availability.
To minimise environmental impacts caused by plastic waste, LCAs have been conducted for national waste management systems. Results of Spanish and Austrian case studies indicate that mechanical recycling was the most favourable waste management option compared to disposal in landfills and incineration.21,22 On a global scale, Zheng and Suh23 evaluated projected life cycle GHG emissions for conventional and bio-based plastics. It was found that a combination of strategies (introducing renewable energy, increasing recycling, and curbing demand) could reduce future emissions. In Africa, LCA-based research is limited, with few studies focusing on the quantification of plastic-related impacts. In their ranking of waste management processes for municipalities in Africa, Friedrich and Trois24 found the greatest GHG savings were achieved through recycling while the highest emissions were recorded for waste disposed of in landfills. Studies have also been conducted for carrier bags by Sevitz et al.25 with updated research conducted by the Council for Scientific and Industrial Research (CSIR) incorporating additional impacts such as (materials) persistence, employment, and affordability26. Significant findings show that reusable fossil fuel-based plastic bags have lower environmental impacts than single-use carrier bags in all categories other than the persistence of plastics in the environment.
In this study, we aimed to firstly establish a baseline model to describe the status quo of the South African plastics sector in terms of material flows and their subsequent environmental impacts, and thereafter to explore the impacts of implementing a mitigation strategy, namely an increased mechanical recycling rate, to satisfy the aims of the SA Plastics Pact.
Methods
Material flow analysis
A mass balance was compiled that incorporated major process activities such as conversion, use, disposal, recycling, and trading for 2018. Figure 1 portrays the model showing relevant input and output flows.

Information regarding total plastics production (local conversion of polymer into plastic products) was obtained from the annual recycling survey published by Plastics SA.9 Imported polymers, products, and packaging as well as exported goods were included with data sourced from the South African Revenue Services (SARS) under tariff code 39. This refers to direct plastic imports and excludes products that contain plastic or are packaged in plastic and fall under another code, e.g. cosmetics or electronics. Imported recyclate was also considered under total imports. In terms of recovery, figures for recyclate were obtained from the annual South African plastics recycling survey with 2.2% of plastics recovered from the waste stream exported to be recycled internationally.9 Informal disposal of waste represents the portion of plastic waste that remains uncollected and untreated via formal management processes and is typically discarded in open dumps with an estimated 60% burned.27 Unlike other regions, South Africa does not implement waste incineration on a commercial scale. Landfill disposal is the standard employed, but not always to regulated standards. As a result, an estimated half of the formally disposed of waste ends up in what is termed 'deficient landfills'.
Life cycle assessment
Disaggregation of the total plastic flows obtained in the MFA was necessary to obtain individual polymer flows. The polymers considered include the six major polymers consumed in South Africa - low-density polyethylene, high-density polyethylene, polypropylene, polyethylene terephthalate, polyvinyl chloride, and polystyrene - as well as an additional category to represent other plastics. For import and export flows, data were subdivided according to the description of SARS sub-tariff codes. Use, both short-lived and long-term, was divided according to a breakdown of domestic virgin polymer consumption provided in the Master Plan for Growth. Waste was disaggregated according to a municipal waste management plan which included a plastic characterisation study.28
SimaPro was utilised as the modelling software with most datasets sourced from the ecoinvent database. Where local data were unavailable, international datasets were modified with the inclusion of the local electricity mix. To accurately portray local polymer production, the South African dataset representing the Fischer-Tropsch synthesis process was incorporated into the model. Similarly, the end-of-life management scenario depicted in the MFA was modelled by constructing a disposal scenario to reflect accurate proportions of waste flows. The informal disposal term was described using a combination of disposal of plastic waste to an open dump as well as uncontrolled, open burning using a 40:60 split.27 As there is no dataset which describes the presence of plastic litter, the discarding of waste in an open dump was used as a proxy dataset. The impact analysis was undertaken based on the single indicator of global warming potential with the impact assessment method selected as IPCC 2013.
Model of future flows
Flows depicted in the baseline model were projected to estimate future material flows. Based on the projected annual global demand growth rate of 4%/year, plastic flows were calculated for the year 2025. An additional scenario, using a 2%/year growth rate, was modelled to take into account the decrease in local plastic production from 2018 to 2019.29 Thereafter, a mitigation strategy was modelled, and the changes analysed. In particular, the rate of mechanical recycling was increased to satisfy two of the objectives set by the SA Plastics Pact. This revolved around achieving a higher recycled content at 30% and an increased input recycling rate of 70%. To construct an initial future model, it was assumed that the production of local polymer would be constrained and would reach a maximum threshold based on nameplate capacities. This assumption is because there is a current shortage of ethylene monomer which limits the polymerisation of polyethylene and polypropylene copolymers.7 The potential decline in liquid fuel use in the transport sector would also impact monomer supply resulting in reduced local polymer production.30 This would entail that the balance of feedstock supply would be satisfied by importing polymers. Although the increased recycling rate would ensure higher collection of material for recycling, there would still be a significant quantity of waste for disposal. Due to the ongoing initiatives by Producer Responsibility Organisations, it is anticipated that waste generated from non-serviced households would decrease. A small fraction of waste would still be transported to sanitary landfill sites with the remainder discarded under deficient landfill conditions.
Results and discussion
Baseline model
Material flow analysis for 2018
The results for the MFA on an annual basis are displayed in Figure 2. The Sankey diagram depicts major inputs, outputs and activities for 2018, with quantities expressed in kilotons. Circularity is shown in the diagram in the form of the recycling loop with accumulation built into the model to account for build-up of stock within the system.
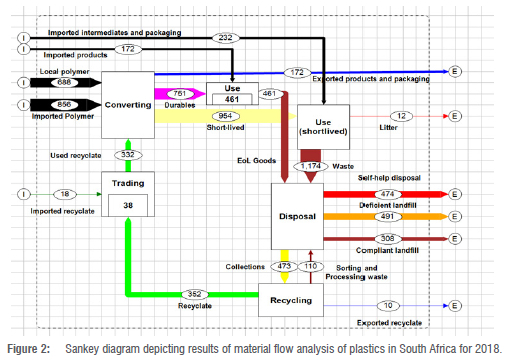
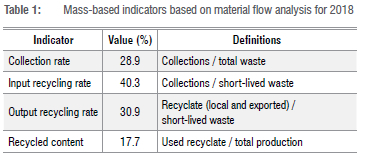
The quantity of polymer produced locally, which was calculated via a mass balance, was 20% less than the quantity of imported polymers. After the conversion process, domestic consumption was sub-divided into short-lived products and durables, with 40% of plastics locally produced embedded in long-lived applications.9 Post-use, the amount collected for recycling excluded the non-plastic 'obsolete' material that is extracted when plastics are recovered from the waste stream and typically forms part of the collected material.29 Results indicate that most of the waste is discarded via self-help disposal - a practice common amongst rural households and urban informal settlements - as well as through compliant and deficient landfills. The MFA findings also show that the amount of direct litter generated is relatively small. To evaluate the performance of the recovery and recycling loops, several mass-based indicators were calculated; the results are presented in Table 1. The input recycling rate, which is a commonly cited indicator and is defined as the percentage of collected plastic waste to short-lived waste, was calculated as 40.3%, which is comparable to the total EU plastic packaging recycling rate of 40.8% in 2016 (EU28 plus Norway and Switzerland).31 The recycled content, which is an alternative circularity indicator and is calculated as the fraction of recyclate in total polymer converted into products, is 17.7%.
Life cycle assessment for 2018
The results for a life cycle-based carbon footprint are presented in Figure 3. The inner ring represents the total GHG emissions to produce plastic products consumed in South Africa, exported products, and imported products as well as end-of-life management of local plastic goods post-consumer use. The outer ring expands on the production process by showing the distribution of impacts between polymer production, conversion, and end-of-life impacts. The latter are partitioned to illustrate individual impacts for littering, recycling, and disposal.

The LCA revealed that the South African plastics industry was responsible for emitting 17.9 Mt CO2eq over its life cycle. This amount is equivalent to 3.8% of the total emissions for South Africa in 2018 and is greater than the annual emission load for several entire country emissions, e.g. Kenya or Slovenia.32 From the graph, it is evident that the production process (comprising both polymer production and conversion) is responsible for most of the burdens in comparison to the end-of-life management process. This is mainly due to the local production of monomers (propylene and ethylene) from coal which is responsible for 52% of the total climate impact. This result is validated by LCA studies33 that verify the emission-intensive nature of coal-based monomer production pathways. Figure 3 also shows the significance of the local conversion process, contributing to 17% of the total climate impact with emissions attributed to electricity produced by the country's energy grid. The end-of-life stage makes a very small contribution, within which the disposal process accounts for the majority of climate impacts which is ascribed to the burning of plastic waste that generally occurs at some homes or at dump sites.
Model of future flows
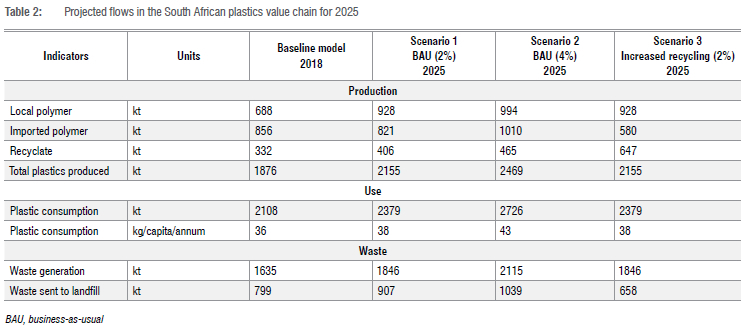
Annual flows of plastics produced, consumed, disposed of and recycled were projected for 2025 for three scenarios. Table 2 shows the business-as-usual models with a 2% and 4% annual growth rate (Scenarios 1 and 2), as well as calculated flows for the case of increased mechanical recycling (achieving the targeted input recycling rate of 70% and recycled content of 30%) as a mitigation strategy (Scenario 3).
A comparison of Scenarios 1 and 3 indicates that increasing the recycling rate would increase the quantity of recyclate available by 241 kt, which would consequentially decrease the need for virgin polymer by the same amount. This is shown in Table 2 to be entirely at the expense of lower imports, but this reduced demand relative to a 'no recycling growth situation' might have a significant economic impact on both local polymer production and imports. An analysis of the custom's value of imported polymers in 2018 estimates that the potential reduction in the quantity of imports would result in a loss in the order of four to six billion rands. This highlights the fact that, at some stage, ambitious pursuits of circularity would inevitably impact business models built on linearity.
For 2018, the per capita plastic consumption of 36 kg/year is within the 3452 kg/year range estimated in a previous MFA for 2015.19 As anticipated, the quantity of plastics produced would increase from 1876 kt to 2155 kt and 2469 kt, respectively, under the two business-as-usual future models for 2025 with no intervention. This increase in production would lead to a projected increase in plastic consumption over the 7-year period to a maximum of 43 kg/capita/annum as per Scenario 2. Although this is significantly higher than the annual per capita consumption for Africa of 16 kg in 201518, it is still lower than the historical average plastics consumption in other regions such as China and Latin America34. Table 2 also shows that an increased consumption of plastics would cause the total waste generated to exceed 2000 kt in 2025 if production increased at an annual growth rate of 4% per annum. In addition to the increased availability of recyclate, a higher recycling rate (Scenario 3) would also significantly decrease waste directed to landfills, by 28% relative to the business-as-usual baseline model, and even to levels 18% below those modelled for 2018 despite a 2% increase in the annual production rate.
Conclusions and recommendations
To establish material flows and subsequent impacts arising from the plastic industry in South Africa, a combination of an MFA and an LCA was utilised. Results indicate that, although recycling rates are higher than for other countries, a large quantity of waste is still disposed of via regulated and deficient landfills as well as self-help methods. The LCA revealed the total carbon footprint as 17.9 Mt CO2eq with local monomer production and energy use in converting identified as the major contributing factors. A model of future flows indicates that mitigation strategies, such as an increased mechanical recycling rate, have the capacity to significantly reduce virgin polymer demand as well as waste directed to landfill. This is anticipated to have a positive environmental impact on the total emissions generated by the local plastics value chain, although economic implications would also need to be considered.
To avoid burden-shifting, it is recommended that the environmental analysis be expanded to include additional indicators related to ecotoxicity and acidification. Furthermore, other circular economy strategies - such as demand management and reuse, integration of bio-based plastics as well as decarbonisation of the energy system - would need to be evaluated to determine the optimum combination of strategies.
Acknowledgements
The financial support of the National Research Foundation of South Africa is gratefully acknowledged (grant no. 121668).
Competing interests
We have no competing interests to declare.
Authors' contributions
T.G.: Conceptualisation; methodology; data collection and analysis; writing - initial draft. K.H.: Conceptualisation; student supervision. V.R.: Data analysis; student supervision. H.v.B.: Conceptualisation; student supervision.
References
1. Geyer R, Jambeck JR, Law KL. Production, use, and fate of all plastics ever made. Sci Adv. 2017;3, e1700782. https://doi.org/10.1126/sciadv.1700782 [ Links ]
2. World Economic Forum. The New Plastics Economy - Rethinking the future of plastics. Geneva: World Economic Forum; 2016. [ Links ]
3. Ellen MacArthur Foundation. Towards the circular economy. Vol. 1: Economic and business rationale for an accelerated transition. Cowes: Ellen MacArthur Foundation; 2013. [ Links ]
4. Ellen MacArthur Foundation. The New Plastics Economy: Rethinking the future of plastics and catalysing action. Cowes: Ellen MacArthur Foundation; 2017. [ Links ]
5. The SA Plastic Pact. Roadmap to 2025 [document on the Internet]. c2021 [cited 2021 Apr 21]. Available from: https://www.saplasticspact.org.za/wpcontent/uploads/2021/01/ROADMAP_5_10_20.pdf [ Links ]
6. South African Department of Forestry, Fisheries and the Environment (DFFE). Government Gazette 43879. (Notice No. 1184). Pretoria: DFFE; 2020. [ Links ]
7. South African Department of Trade and Industry (DTI). Plastics industry 2020 - Master plan for growth. Pretoria: DTI; 2020. [ Links ]
8. Rodseth C, Notten P Von Blottnitz H. A revised approach for estimating informally disposed domestic waste in rural versus urban South Africa and implications for waste management. S Afr J Sci. 2020;116(1/2), Art. #5635. https://doi.org/10.17159/sajs.2020/5635 [ Links ]
9. Plastics SA. National plastics recycling survey 2018. Johannesburg: Plastics SA; 2019. [ Links ]
10. Packaging Gateway. Extrupet's bottle-2-bottle plastic recycling plant expansion, Johannesburg [webpage on the Internet]. c2015 [cited 2022 May 19]. Available from: https://www.packaging-gateway.com/projects/extrupets-bottle-2-bottle-plastic-recycling-plant-expansion-johannesburg/ [ Links ]
11. Europe Plastics and Rubber Machinery Association (EUROMAP). Plastics resin production and consumption in 63 countries worldwide 2009-2020. EUROMAP; 2016. [ Links ]
12. Sasol. Secunda synfuels operations, secunda chemicals operations and sasol oil. Johannesburg: Sasol; 2019. [ Links ]
13. Sasol. Sasol climate change report 2021. Johannesburg: Sasol; 2021. [ Links ]
14. Brunner PH, Rechberger H. Practical handbook of material flow analysis. Boca Raton, FL: CRC Press; 2004. https://doi.org/10.1201/9780203507209 [ Links ]
15. International Organisation for Standardisation (ISO). ISO 14040: Environmental management - Life cycle assessment - Principles and framework. Geneva: ISO; 2006. [ Links ]
16. Mutha NH, Patel M, Premnath V. Plastics materials flow analysis for India. Resour Conserv Recycl. 2006;47:222-244. https://doi.org/10.1016/j.resconrec.2005.09.003 [ Links ]
17. Bogucka R, Kosinska I, Brunner PH. Setting priorities in plastic waste management - lessons learned from material flow analysis in Austria and Poland. Polimery/ Polymers. 2008;53:55-59. https://doi.org/10.14314/polimery.2008.055 [ Links ]
18. Babayemi JO, Nnorom IC, Osibanjo O, Weber R. Ensuring sustainability in plastics use in Africa: Consumption, waste generation, and projections. Environ Sci Eur. 2019;31, Art. #60. https://doi.org/10.1186/s12302-019-0254-5 [ Links ]
19. South African Department of Environmental Affairs (DEA). Plastic material flow and end of life management: Final report. Pretoria: DEA; 2017. [ Links ]
20. IUCN-EA-QUANTIS. National guidance for plastic pollution hotspotting and shaping action, Country report South Africa [document on the Internet]. c2020 [cited 2021 Oct 08]. Available from: https://www.iucn.org/sites/default/files/content/documents/2021/south_africa_-_national_guidance_for_plastic_pollution_hotspotting_and_shaping_action.pdf [ Links ]
21. Sevigné-Itoiz E, Gasol CM, Rieradevall J, Gabarrell X. Contribution of plastic waste recovery to greenhouse gas (GHG) savings in Spain. Waste Manag. 2015;46:557-567. https://doi.org/10.1016/j.wasman.2015.08.007 [ Links ]
22. Van Eygen E, Laner D, Fellner J. Circular economy of plastic packaging: Current practice and perspectives in Austria. Waste Manag. 2018;72:55-64. https://doi.org/10.1016/j.wasman.2017.11.040 [ Links ]
23. Zheng J, Suh S. Strategies to reduce the global carbon footprint of plastics. Nat Clim Chang. 2019;9:374-378. https://doi.org/10.1038/s41558-019-0459-z [ Links ]
24. Friedrich E, Trois C. Quantification of greenhouse gas emissions from waste management processes for municipalities - A comparative review focusing on Africa. Waste Manag. 2011;31:1585-1596. https://doi.org/10.1016/j.wasman.2011.02.028 [ Links ]
25. Sevitz J, Brent AC, Fourie AB. An environmental comparison of plastic and paper consumer carrier bags in South Africa: Implications for the local manufacturing industry. South Afr J Ind Eng. 2003;14:67-82. https://doi.org/10.7166/14-1-299 [ Links ]
26. Russo V, Stafford W, Nahman A. Comparing grocery carrier bags in South Africa from an environmental and socio-economic perspective: Evidence from a life cycle sustainability assessment. Report no. CSIR/SPLA/SECO/ER/2020/0009/A. Pretoria: DST/CSIR; 2020. [ Links ]
27. Intergovernmental Panel on Climate Change (IPCC). 2006 IPCC guidelines for national greenhouse gas inventories. Prepared by the National Greenhouse Gas Inventories Programme. Edited by Eggleston HS, Buendia L, Miwa K, Ngara T, Tanabe K. Hayama: Institute for Global Environmental Strategies; 2006. [ Links ]
28. Nelson Mandela Bay Municipality. Integrated Waste Management Plan 20162020: Nelson Mandela Bay Municipality. Port Elizabeth: Nelson Mandela Bay Municipality; 2016. [ Links ]
29. Plastics SA. South African plastics recycling survey 2019. Johannesburg: Plastics SA; 2020. [ Links ]
30. Marquard A, Merven B, Hartley F, McCall B, Ahjum F, Burton J, et al. Technical analysis to support the update of South Africa's first NDC's mitigation target ranges [document on the Internet[. c2021 [cited 2021 Oct 08]. Available from: https://zivahub.uct.ac.za/articles/report/Technical_Analysis_to_support_the_update_of_South_Africa_s_First_NDC_s_mitigation_target_ranges_UCT_2021_/16691950/files/30908191.pdf [ Links ]
31. PlasticsEurope. Plastics - the facts 2018 [document on the Internet]. c2018 [cited 2021 Oct 08]. Available from: https://plasticseurope.org/wp-content/uploads/2021/10/2018-Plastics-the-facts.pdf [ Links ]
32. Global carbon project. CO2 Emissions | Global Carbon Atlas 2021 [webpage on the Internet]. c2021 [cited 2021 Aug 23]. Available from: http://globalcarbonatlas.org/en/CO2-emissions [ Links ]
33. Zhao Z, Liu Y Wang F, Li X, Deng S, Xu J, et al. Life cycle assessment of primary energy demand and greenhouse gas (GHG) emissions of four propylene production pathways in China. J Clean Prod. 2017;163:285-292. https://doi.org/10.1016/j.jclepro.2015.12.099 [ Links ]
34. Ryberg M, Laurent A, Hauschild MZ. Mapping of global plastic value chain and plastic losses to the environment: With a particular focus on marine environment. 2018. [ Links ]
 Correspondence:
Taahira Goga
Email: GGXTAA001@myuct.ac.za
Received: 08 Oct. 2021
Revised: 09 Jun. 2022
Accepted: 23 Jun. 2022
Published: 31 Aug. 2022
Editor: Michael Inggs
Funding: South African National Research Foundation (grant no. 121668)

