


Serviços Personalizados
Artigo
 Inglês (pdf)
 Artigo em XML
 Referências do artigo
Indicadores

Links relacionados
-
 Citado por Google
 -
 Similares em Google
Compartilhar

 Permalink
South African Journal of Science
versão On-line ISSN 1996-7489
versão impressa ISSN 0038-2353
S. Afr. j. sci. vol.118 spe Pretoria 2022
http://dx.doi.org/10.17159/sajs.2022/12485
RESEARCH ARTICLE
An estimate of construction and demolition waste quantities and composition expected in South Africa
Sally Berge; Harro von Blottnitz
Chemical Engineering Department, University of Cape Town, Cape Town, South Africa
ABSTRACT
Construction and demolition (C&D) waste is generated from the construction, renovation, repair and demolition of the built environment. It is one of the largest waste streams and is generally not well documented or understood. Various methods for estimating C&D waste are reviewed, and the development of two methods for estimating C&D waste quantities and composition generated in South Africa is discussed. The lifetime method is based on current production quantities of key construction materials and their typical stock life. This is contrasted with the scale-up of a pocket of reasonably good statistics for Cape Town's C&D waste on a per-capita basis to determine totals for South Africa. The lifetime method yielded a result of 20.2 Mt of potential C&D waste generated in South Africa in 2017, while the per-capita method suggests that 10.8 Mt of C&D waste reached disposal sites. These quantities are much higher than the 4.48 Mt reported in official national statistics for 2017. It is important to understand and accurately quantify C&D waste in South Africa so that effective waste management can be implemented. Specifically, the reuse of C&D waste needs to be understood, as this takes precedence over recycling or downcycling according to circular economy principles. Overall, this research highlights that C&D waste quantities in South Africa appear to be considerably underreported, undermining attempts to introduce more sustainable waste management practices.
SIGNIFICANCE:
• The results of both methods used in this study were significantly higher than reported in official South African statistics, indicating considerable underreporting in national databases as in most waste statistics worldwide.
• The informal sector is plausibly an intensive reuser of discarded building materials and demolition products from the formal sector. The omission of these informal waste management practices is a likely contributor to the difference between the official statistics and both estimates.
• It is important to accurately quantify this waste stream as this can contribute to increasing materials circularity in South Africa and lower environmental impact through the achievement of circular economy goals.
Keywords: construction and demolition waste, built environment, waste management, South Africa, circular economy
Introduction
Construction and demolition (C&D) waste is generated from the construction, renovation, repair and demolition of structures such as houses and roads. Construction waste consists of unused materials or other waste generated during construction activity and is a small but variable fraction of the total material used.1 Demolition waste is generated during the demolition phase and includes almost all the material used in the original construction phase.2
The built environment consists of infrastructure, buildings and homes, and it is a major component of society's in-use stocks due to its long lifespan. It enables the flow of water, materials, energy and people, and it provides services such as shelter, transport and sanitation. In order to achieve the aims of a circular economy in the built environment, the careful selection of materials used in buildings and infrastructure needs attention. The long life of the built environment also needs to be considered, as well as end-of-life resource recovery for recycling. The built environment needs to be resource-efficient in terms of maintenance and repairability.
According to the South African State of Waste Report3, the official national statistic for C&D waste generated in South Africa in 2017 is 4.48 Mt (megatons). Information in the SAWIS (South African Waste Information System) database is largely incomplete since many local municipalities are not reporting the numbers accurately. Strikingly, the integrated waste management plan (IWMP) for Cape Town4 reports the annual C&D waste generated in Cape Town as 1.09 Mt, which would represent an implausible quarter of the national total.
There is a C&D waste data problem in South Africa, as these quantities appear to be underestimated. C&D waste is generally not well documented or understood in South Africa. It is speculated that this is due to the omission of informal waste management practices from official statistics as well as underreporting from formal recycling activities. It is important to quantify this waste stream so that effective waste management can be implemented. The purpose of this paper is to present methods for quantifying a more accurate estimate of C&D waste generated in South Africa. This estimate will be for the year 2017 so that the result can be compared to official national statistics.
Review and classification of C&D waste estimation methods
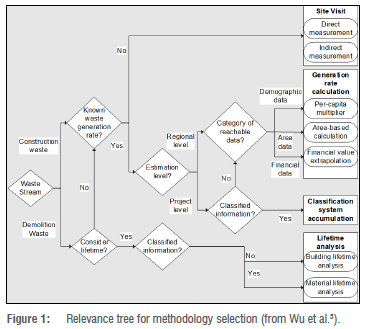
A study by Wu et al.5 analysed 57 different papers on methods for quantifying C&D waste. These methods were classified based on the waste generation activity covered, estimation level and quantification method. The waste generation activity can be divided into three different areas, namely construction of new buildings, demolition of old buildings, and civil and infrastructural works. The estimation level refers to whether the study is at a project level or a regional level. Finally, the quantification approach can be described according to one of the following different methods, namely the site visit method (which can be direct or indirect measurement), the generation rate calculation method (which can be a per-capita multiplier, financial value extrapolation or area-based calculation), the lifetime analysis method (which can be building or material lifetime analysis), the classification system accumulation method, the variables modelling method or other methods. There is no single method that is better than others, and the choice of method is dependent on the data available and the circumstances of the study to be conducted. Wu et al.5 summarise the analysed methods into a relevance tree so that the appropriate method can be selected (Figure 1).
An example of the material lifetime analysis method is described by Cochran and Townsend6, who used materials flow analysis (MFA) to estimate C&D waste generated in the USA. To calculate the construction waste, the quantity of construction materials used in the USA each year was extrapolated from data from industry associations. This was done for each material. Typical waste factors are estimated from construction guides. These waste factors are used to determine the fraction of new materials discarded during the construction phase. Demolition waste consists of almost all the materials used in the original construction phase. In this study, the average lifespan of each material was used to determine the demolition waste, by estimating the quantity of material used one lifetime ago, and therefore the amount of material used to construct a project that would be demolished today. This was based on historical consumption data. It was found that the quantity of C&D waste generated in the USA in 2002 was between 610 and 780 Mt, and the majority of this was Portland cement concrete.
A version of the per-capita multiplier method is described by McBean and Fortin7, who used the waste generation rate per person per year as well as population data to calculate the total domestic and industrial waste quantity per year. Waste generation coefficients, measured according to mass per person per year, were obtained for different dwellings and business sectors from surveys conducted in Ontario, Canada. These coefficients varied for each material type. A regression analysis was done on historical data, and this was used to forecast C&D waste data to a certain degree of confidence.
Methods
In order to develop a more accurate estimate of C&D waste generated in South Africa in 2017, two complementary methods are presented. The first is a lifetime analysis method based on estimated construction material volumes and the likely service lives of in-use stocks. Based on the review of potential C&D waste estimation methods, it was found that the material lifetime analysis method was the most suitable method for this study. This method is useful for estimating demolition waste quantities, especially when there is limited information available.
Since there are a number of uncertainties involved and assumptions used, a second method was used to attempt an additional independent estimate, namely the generation rate calculation method, which and uses a scale- up from a local municipal data source that is deemed to trustworthy, to the full population. Other estimation methods could be attempted, but this would require additional information such as area or financial data. Site visit methods were not considered for this study due to their labour and time intensity, and the results not necessarily being generalisable.
Method one: Material lifetime analysis
The first method used to estimate C&D waste in South Africa involves a material lifetime analysis based on the current production quantities of key construction materials and their typical stock life. The research described by Cochran and Townsend6 was adapted to produce this estimate.
The first step for this method is to estimate the quantity of new construction material produced in 2017 for each of the key materials. Eight different materials were investigated including timber, glass, metal, concrete, masonry, plastic, gypsum and asphalt.
Timber includes wood products and offcuts. It is assumed that 70% of sawn wood produced in South Africa is used in construction.8 The total production of sawn timber is estimated to be 4.74 Mt.9 For glass, only flat glass was considered to be used for construction purposes. It was assumed that 50% of the flat glass produced is used in construction, while the rest is used in the automotive sector. The total production quantity is estimated to be 0.36 Mt.3,10
Next, it is assumed that the main metals used in the construction sector are steel, aluminium and copper. These metals are used for frames and furnishings and account for 99% of the metals used. The quantity of steel used in construction is estimated to be 2.10 Mt.11 For this analysis, it is assumed that half this amount is used for metal frames and furnishings, while the other half is used in reinforced concrete. Aluminium is used in the automotive sector, for cans and in construction. It is estimated that 24% of the aluminium produced is used for construction purposes.12 The total quantity of aluminium is estimated to be 0.72 Mt.13 Approximately 15% of the copper produced in South Africa is used for construction purposes, mainly for plumbing.14 The total quantity of copper produced is assumed to be 0.066 Mt.15
Reinforced concrete generally consists of cement, sand and gravel in a ratio of 1:2:416, as well as steel. As mentioned already, half of the steel used in construction is used in concrete. For this analysis, it is assumed that half of the total cement production of 14.7 Mt17 is used in concrete, while the other half is used in bricks, plaster and mortar. The cement-to-sand-to-gravel ratio is used to calculate the other components.
The next category, masonry, includes clay bricks and tiles, concrete blocks, mortar and plaster, and paving. The production of clay bricks and tiles was reported to be 7.4 Mt.18 The remaining cement is split between cement bricks and mortar, and it is assumed that 25% is used in bricks and 75% in mortar and plaster. The cement-to-sand ratio of bricks is 1:8. Mortar and plaster is assumed to have a cement-to-sand ratio of 1:3.
Plastics include pipes, frames and furnishings. This is assumed to be 50% of the 0.81 Mt of plastics used durably in 2017.19 For gypsum, approximately 96% is used in construction activities20, and the total production quantity is 0.41 Mt.21 Asphalt includes bitumen and aggregate, and usage is reported to be 3.5 Mt.22 Finally, miscellaneous and other materials were assumed to comprise 5% of the total construction materials. These new production estimates are summarised in Table 1, yielding a total estimated material use of 114 Mt in South Africa's construction industry in 2017.
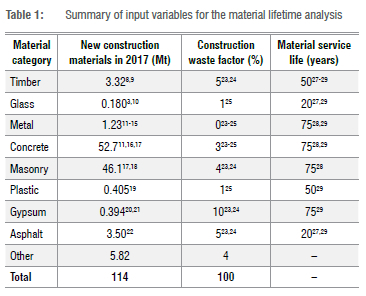
After the new production quantities have been estimated, the next step is to estimate the fraction of new construction materials that go directly to waste. This waste fraction is usually between 1% and 10% of new materials1, and varies per material type based on various literature sources.23-25 Table 1 lists the portions of new construction materials that are scrapped during the construction project.
The average of the other eight key materials was taken as the waste factor for miscellaneous and other materials.
Next, the amount of demolition waste needs to be determined. This is calculated from the material service life and average annual growth of the construction industry. The growth rate is based on the construction GDP for South Africa and was estimated as an average 2.68% per annum26 over the last 60 years, which is the oldest available data.
The stock life also varied per material type based on the literature.6,27 29 Table 1 summarises the typical lifetime of each material. A sensitivity analysis on the lifetimes for concrete and bricks was done, as these materials make up the majority of the total waste, and their lifetimes have the biggest effect on the final result.
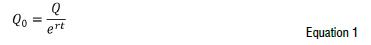
The amount of material used one lifetime ago is then calculated using an exponential growth formula shown in Equation 1 below, where Q0 is the material used for construction one lifetime ago, Q is the new material used for construction today, r is the construction industry growth rate, and t is the material service life. This result translates to the amount of demolition waste produced today.
Method two: Per-capita multiplier
The second method is based on a scale-up of a pocket of reasonably good statistics for Cape Town's C&D waste, on a per-capita basis, while also considering likely differences in construction intensity between urban and rural populations, to determine totals for South Africa. This analysis is based on research done by McBean and Fortin7. For this method, only a final result for the total C&D waste quantity is obtained, and not the composition.
Radzilani30 evaluated the quality of the IWMPs for the major metropolitan municipalities in South Africa. The study included 10 key categories as well as a number of important sub-categories. It was found that in terms of reporting, monitoring and review of waste and waste management practices, the City of Cape Town had the best-quality IWMP out of the eight that were analysed.
C&D waste generation in Cape Town is reported as 1.09 Mt.4 In order to scale this figure up to the national level, the populations of Cape Town and South Africa need to be taken into account. The population of Cape Town in 2017 was estimated as 4.01 million, while the population of South Africa was estimated to be 55.6 million.31 These figures can be used to determine the ratio of waste to population.
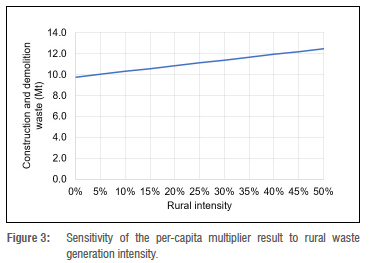
The per-capita ratio for Cape Town and other South African urban populations is assumed to be the same, but the fraction of urban and rural populations needs to be taken into account. It is estimated that 35.7% of the South African population lives in rural areas and 64.3% in urban areas.32 In order to include the impact of both urban and rural populations, five times lower generation intensity of C&D waste is assumed for the rural population than the consumption reported for Cape Town. Therefore, the average citizen's annual building waste relative to Cape Town's is 71.4%. The total C&D waste generation can then be determined. A sensitivity analysis was done on the waste generation intensity of rural populations in relation to Cape Town.
Results and discussion
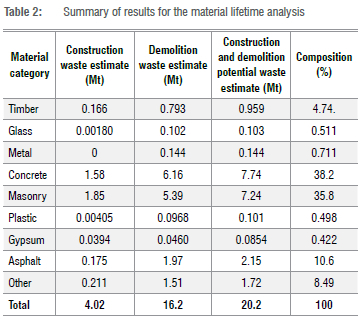
From the methods described, the final estimate of potential C&D waste generation in South Africa is 20.2 Mt for the material lifetime analysis method, while the final result for the per-capita multiplier method is 10.8 Mt. The first method allowed for the estimation of the composition of the waste, which is shown in Table 2. These results are much higher than the quantity of 4.48 Mt reported in official statistics.
For the lifetime method, the final result was most influenced by the assumed service life of concrete and masonry. A sensitivity analysis was done in which the lifetimes of both were varied from 50 to 100 years, as this was the most common range given in the literature. The result of this uncertainty analysis can be seen in Figure 2, which shows that the higher the lifetime of both materials, the lower the quantity of C&D waste. The minimum value here is 14.3 Mt when both lifetimes are set at 100. The maximum value when both lifetimes are set at 50 years is 32.5 Mt.
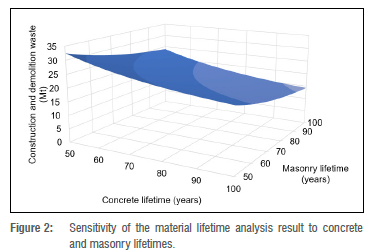
In terms of the composition of C&D waste, the dominance of concrete (38%) and masonry (36%) items is consistent with the findings of Cochran and Townsend.6 They also compared the total C&D waste estimate using long, typical and short service lives for the various materials. It was found that the total estimate increased with shorter service lives, and the short service life estimate was approximately double the estimate for long service lives. This is consistent with the findings in the sensitivity analysis shown in Figure 2.
For the per-capita method, the C&D waste generation intensity of the rural population was varied from 0% to 50% of that of urban dwellers. The upper limit of 50% was chosen due to there being more commercial and office space in the cities, so there would be much less C&D waste arising in rural areas. It can be seen from Figure 3 that there is a linear relationship between rural waste generation intensity and C&D waste. This estimate for C&D waste generation in South Africa thus ranges from 9.74 Mt to 12.4 Mt.
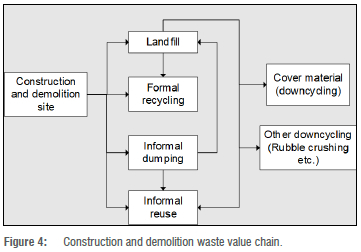
The large gap between the results of both methods needs to be addressed. For the lifetime method, it is likely that this is an overestimate of actual C&D waste due to the potential hibernation of some end-of-life stocks. It is a common observation that there are remaining 'ghost stocks', or structures that have reached the end of their life but are not demolished. For the per-capita method, since this is a scale-up of official statistics, there is still the possibility of underreporting. This also excludes some informal waste management practices as well as some formal recycling. This can be better understood from the C&D waste value chain shown in Figure 4. The lifetime method gives an estimate of all the C&D waste leaving the construction or demolition site and includes a number of fates such as formal recycling, informal dumping, informal reuse and disposal to a landfill site. The quantities in the per-capita method are scaled-up from what was reportedly measured at the gates of Cape Town's disposal sites and what actually goes over the weighbridge, so a lower estimate is expected. This estimate would include the portion of informally dumped C&D waste that is collected by the city. The results of the two methods are thus not incompatible and indicate that of the 20 Mt per annum of total potential C&D waste, approximately 10 Mt per annum has fates including hibernation, formal and informal reuse, recycling or downcycling, while the other 10 Mt is likely disposed or used as cover material in landfill sites.
Conclusions
Two methods were used to estimate the quantity of C&D waste arising in South Africa. The first method involved a material lifetime analysis. New production quantities, waste factors and material service lives for key construction materials were used to estimate the total C&D waste generated in South Africa in 2017. The second method used a per-capita multiplier based on Cape Town's waste statistics and applied population data to scale up to a national estimate. The result for the first method was 20.2 Mt, but could range between 14.3 Mt and 32.5 Mt. The second method had a final result of 10.8 Mt with a potential range between 9.74 Mt and 12.4 Mt. The first result could be an overestimate due to the possibility of hibernation of end-of-life construction materials. The second method represents the portion likely to enter waste management facilities and could be an underestimate due to the omission of informal waste management practices from official statistics as well as the exclusion of some formal recycling practices that bypass municipal disposal. The results of both methods are significantly higher than the official national estimate of 4.48 Mt.
It is important to understand and accurately quantify C&D waste so that effective waste management can be implemented. Specifically, the reuse of C&D waste needs to be understood, as this takes precedence over recycling according to circular economy principles. Overall, this research highlights that C&D waste quantities in South Africa appear to be strongly underreported, undermining attempts to introduce more sustainable waste management practices.
In order to improve the accuracy of these results, further research into construction waste factors and material service life or other input parameters could be done in the South African context. The results could also be further validated by conducting site visits and utilising a direct measurement method. Other methods such as financial value extrapolation could also be used to validate the results.
Acknowledgements
We acknowledge the National Research Foundation of South Africa, the Waste Research, Development and Innovation Roadmap, and the Minerals to Metals Initiative in the Department of Chemical Engineering at the University of Cape Town for their financial support during this research.
Competing interests
We have no competing interests to declare.
Authors' contributions
S.B.: Conceptualisation; methodology; data collection; data analysis; and writing. H.v.B.: Conceptualisation; methodology; writing - revisions; student supervision.
References
1. Shen LY Wu YZ, Chan EHW, Hao JL. Application of system dynamics for assessment of sustainable performance of construction projects. J Zhejiang Univ Sci A. 2005;6(4):339-349. https://doi.org/10.1007/BF02842066 [ Links ]
2. Poon CS, Yu ATW, See SC, Cheung E. Minimizing demolition wastes in Hong Kong public housing projects. Constr Manag Econ. 2004;22(8):799-805. https://doi.org/10.1080/0144619042000213283 [ Links ]
3. South African Department of Environmental Affairs (DEA). South Africa state of waste report. Pretoria: DEA; 2018. Available from: http://sawic.environment.gov.za/?menu=346 [ Links ]
4. City of Cape Town. 3rd generation integrated waste management plan. Cape Town: City of Cape Town; 2017. Available from: https://resource.capetown.gov.za/documentcentre/Documents/Citystrategies,plansandframeworks/IntegratedWasteManagementPlan.pdf [ Links ]
5. Wu Z, Yu ATW, Shen L, Liu G. Quantifying construction and demolition waste: An analytical review. Waste Manag. 2014;34(9):1683-1692. http://dx.doi.org/10.1016/j.wasman.2014.05.010 [ Links ]
6. Cochran KM, Townsend TG. Estimating construction and demolition debris generation using a materials flow analysis approach. Waste Manag. 2010;30(11):2247-2254. http://dx.doi.org/10.1016/j.wasman.2010.04.008 [ Links ]
7. McBean EA, Fortin MHP. A forecast model of refuse tonnage with recapture and uncertainty bounds. Waste Manag. 1993;11(5):373-385. https://doi.org/10.1006/wmre.1993.1040 [ Links ]
8. Crafford PL, Blumentritt M, Wessels CB. The potential of South African timber products to reduce the environmental impact of buildings. S Afr J Sci. 2017;113(9-10), Art. #2016-0354. https://doi.org/10.17159/sajs.2017/20160354 [ Links ]
9. Forestry in South Africa. South African forestry and forest products industry facts file [webpage on the Internet]. c2017 [cited 2021 Sep 30]. Available from: https://www.forestry.co.za/statistical-data/ [ Links ]
10. PFG. Sustainability [homepage on the Internet]. c2018 [cited 2021 Sep 30]. Available from: www.pfg.co.za [ Links ]
11. Merchantec Research. Industry supply analysis: Deliverable 1 ferrous metals downstream sector [document on the Internet]. c2014 [cited 2021 Sep 30]. Available from: https://solidariteit.co.za/wp-content/uploads/2017/03/Steel.Industry.Supply.Analysis.23.09.14.pdf [ Links ]
12. South African Department of Science and Technology, CSIR. The South African aluminium industry roadmap [document on the Internet]. c2017 [cited 2021 Sep 30]. Available from: https://www.afsa.org.za/Downloads/South-African-Aluminium-Industry-Roadmap-2017.pdf [ Links ]
13. Statista. South Africa's refined aluminum production 2010-2020 [webpage on the Internet]. 2021 [cited 2021 Sep 30]. Available from: https://www.statista.com/statistics/1038473/south-african-aluminum-production/ [ Links ]
14. Makgetla N, Levin S, Mtanga S. Moving up the copper value chain in southern Africa [document on the Internet]. c2019 [cited 2021 Sep 30]. Available from: https://sa-tied.wider.unu.edu/sites/default/files/pdf/SATIED_WP66_Makgetla_Levin_Mtanga_July_2019.pdf [ Links ]
15. Minerals Council South Africa. Facts and figures 2019 [webpage on the Internet]. c2019 [cited 2021 Sep 30]. Available from: https://www.mineralscouncil.org.za/industry-news/publications/facts-and-figures [ Links ]
16. The Constructor. Types of concrete mix ratio design and their strengths [webpage on the Internet]. c2021 [cited 2021 Sep 30]. Available from: https://theconstructor.org/concrete/types-of-concrete-mix-design/5984/ [ Links ]
17. South African Department of Forestry, Fisheries and the Environment (DFFE). National GHG inventory report South Africa. Pretoria: DFFE; 2017. Available from: https://unfccc.int/sites/default/files/resource/SouthAfricaNIR2017.pdf [ Links ]
18. Vosloo P Harris H, Holm D, Van Rooyen N, Rice G. Life cycle assessment of clay brick walling in South Africa. The Clay Brick Association of South Africa: Technical report 7A vol. 1 [webpage on the Internet]. c2016 [cited 2021 Sep 30]. Available from: https://www.claybrick.org/lca-life-cycle-assessment-clay-brick-walling-south-africa [ Links ]
19. \on Blottnitz H, Chitaka T, Rodseth C. South Africa beats Europe at plastics recycling, but also is a top 20 ocean polluter. Really? [document on the Internet]. c2018 [cited 2021 Sep 30]. Available from: http://www.epse.uct.ac.za/sites/default/files/image_tool/images/363/Publications/SAplasticsMFAcommentarybyE%26PSErev1.pdf [ Links ]
20. South African Department of Mineral Resources. Gypsum in South Africa [webpage on the Internet]. c2009 [cited 2021 Sep 30]. Available from: https://www.dmr.gov.za/LinkClick.aspx?fileticket=kpgLoOGqGDs%3D&portalid=0 [ Links ]
21. United Nations Environment Programme. Global material flows database [webpage on the Internet]. c2017 [cited 2021 Sep 30]. Available from: http://www.ces.csiro.au/forms/form-material-flows-world.aspx [ Links ]
22. Southern African Bitumen Association. Use of reclaimed asphalt in the production of asphalt. Manual 16/TRH 21 [document on the Internet]. c2017 [cited 2021 Sep 30]. Available from: http://www.sabita.co.za/wp-content/uploads/2021/03/sabitamanual-36-trh-21.pdf [ Links ]
23. DelPico WJ. Builder's essentials: Estimating building costs. Kingston, MA: RS Means; 2004. [ Links ]
24. Thomas P The contractor's field guide. Englewood Cliffs, NJ: Prentice Hall; 1991. [ Links ]
25. Bossink BAG, Brouwers HJH. Construction waste: Quantification and source evaluation. J Constr Eng Manag. 1996;122(1):55-60. https://doi.org/10.1061/(ASCE)0733-9364(1996)122:1(55) [ Links ]
26. Trading Economics. South Africa GDP from construction [webpage on the Internet]. c2021 [cited 2021 Sep 30]. Available from: https://tradingeconomics.com/south-africa/gdp-from-construction [ Links ]
27. National Association of Home Builders, Bank of America. Study of life expectancy of home components [document on the Internet]. c2007 [cited 2021 Sep 30]. Available from: https://www.homeinspectalaska.com/wp-content/uploads/2016/08/component_Life_expectancy.pdf [ Links ]
28. Celadyn W. Durability of buildings and sustainable architecture. Tech Trans. 2014;7A(14):17-26. Available from: https://www.ejournals.eu/Czasopismo-Techniczne/2014/Architektura-Zeszyt-7-A-(14)-2014/art/5824/ [ Links ]
29. Black Hills Home Inspection. Building materials life expectancy chart [webpage on the Internet]. c2016 [cited 2021 Sep 30]. Available from: https://www.bhhomeinspections.com/building-materials-life-expectancy-chart/ [ Links ]
30. Radzilani T. The quality of integrated waste management plans for metropolitan municipalities in South Africa [master's dissertation]. Potchefstroom: North-West University; 2019. https://repository.nwu.ac.za/bitstream/handle/10394/33896/RadzilaniTW24377333.pdf [ Links ]
31. Stats SA. Community survey 2016 [webpage on the Internet]. c2016 [cited 2021 Sep 30]. Available from: http://cs2016.statssa.gov.za/ [ Links ]
32. Stats SA. City of Cape Town [webpage on the Internet]. c2011 [cited 2021 Sep 30]. Available from: http://www.statssa.gov.za/?page_id=993&id=city-of-cape-town-municipality [ Links ]
 Correspondence:
Sally Berge
Email: brgsal001@myuct.ac.za
Received: 30 Sep. 2021
Revised: 22 Mar. 2022
Accepted: 26 Mar. 2022
Published: 31 Aug. 2022
Editor: Michael Inggs
Funding: South African National Research Foundation, the Waste RDI Roadmap, University of Cape Town

