


Servicios Personalizados
Articulo
 Inglés (pdf)
 Articulo en XML
 Referencias del artículo
Indicadores

Links relacionados
-
 Citado por Google
 -
 Similares en Google
Compartir

 Permalink
South African Journal of Science
versión On-line ISSN 1996-7489
versión impresa ISSN 0038-2353
S. Afr. j. sci. vol.118 spe Pretoria 2022
http://dx.doi.org/10.17159/sajs.2022/12795
RESEARCH ARTICLE
Waste characterisation in Stellenbosch Local Municipality, South Africa
Charlotte M. NellI; Catherina SchenckII; Jan de WaalIII
IAqulla Environmental, Cape Town, South Africa
IIDSI/NRF/CSIR Chair in Waste and Society, University of the Western Cape, Cape Town, South Africa
IIIDepartment of Geography and Environmental Studies, Stellenbosch University, Stellenbosch, South Africa
ABSTRACT
This article demonstrates how household solid waste (HSW) generation patterns differ in neighbourhoods of the same town by determining the composition of the residual portion of the HSW stream in 2017 in Stellenbosch. HSW was collected from 10 pre-identified suburbs out of a total of 48. These chosen suburbs and their 17 830 households were representative of all the HSW from all households in the catchment area of the Devon Valley Landfill Site. A separation at source programme was in place in nine of the suburbs. The confidence level and level of precision were set at 95% and ±8%, respectively. A total of 1543 bags of HSW were collected with a total mass of 5748.01 kg and an uncompacted volume of 84.87 m3. The samples were sorted into 7 main and 18 final fractions. The main contributor to the total waste stream was organic waste by weight (35%) and plastic wrap and packaging by uncompacted volume (32%). The average HSW generation was 0.68 kg/capita/day. Households with access to a separation at source programme tended to have lower levels of highly recyclable materials in their samples. Roll-out of a separation programme is recommended for all 48 suburbs in the study area to save landfill airspace. Correlation analysis showed that household size influenced three of the seven main waste fractions, and household income five of the seven. No statistically significant results were obtained relating to household density and waste generation. Statistically significant results were obtained through an analysis of variance for all waste fractions, excluding organics, when considering household income, indicating that both household size and income could be explanatory socio-economic factors for variations seen. Other variables, such as human behaviour, could potentially also contribute to the differences and should be further explored.
SIGNIFICANCE:
• The availability of reliable waste composition data is not only a contribution to the solid waste management field, but also to any related fields interested in beneficiating or recovering waste. These data are often unavailable, but form the basis for decision-making processes when addressing solid waste (and related) challenges.
Keywords: waste characterisation studies, waste beneflclatlon, waste data, household solid waste, correlation analysis, waste generation rate
Introduction
Solid waste management is a significant concern globally.1 In particular, local municipalities need to account for increasing volumes of municipal solid waste annually, which is typically sent to landfill.2 In many countries, substantial deficiencies exist in waste collection and disposal systems which are often coupled with inappropriate locations for processing and disposal facilities.3 In the South African context, waste can be defined as any substance that the generator has no further use of and is thus considered surplus, rejected, discarded, and abandoned or disposed of.4 Waste is continuously generated by a wide range of activities and the rate of waste generation is largely related to population dynamics, income, education and urbanisation.3 As a result, many municipalities are faced with mounting pressure to deal with an ever-increasing municipal solid waste stream and a lack of space to dispose of this waste. In Stellenbosch, South Africa, for instance, the municipal landfill ran out of space in 2009, which resulted in the construction of a third cell at the landfill site so as to extend the lifespan of the facility.5 However, by 2019, this third cell had also run out of space and diversion plans commenced whereby all municipal solid waste is transported to a landfill site located 40 km from Stellenbosch, within another municipality (De Wet J, Manager: Environmental Sustainability at Stellenbosch University Facilities Management, personal communication, 13 June 2021).
Detailed knowledge of the composition of the waste entering landfills can assist in the determination of priority waste and the identification of appropriate interventions to assist in diversions from landfill sites. However, one of the major stumbling blocks for waste managers is often the lack of reliable data on the composition of various waste streams.6-8 Waste characterisation studies enable relevant data pertaining to this composition to be gathered to assist decision-makers to identify the constraints on and opportunities for managing their streams.9 Dependable waste characterisation data are crucial to decision-making processes10, which can be hamstrung when these data are lacking11. Optimal methods of collecting and freighting household solid waste (HSW), recovering materials and appropriate 'end-of-life' methods rely heavily on the characteristics of particular waste streams.12 Thus, many HSW characterisation studies have been done in diverse geographical, environmental, political and climatic settings throughout the world.13-16 Notably, there have been relatively few waste characterisation studies conducted in South African municipalities.17 For instance, in 2012, only 17 of South Africa's 284 municipalities had conducted waste characterisation studies.17 Of these studies, several issues arise, such as the lack of standardised methodologies and sample sizes, differing waste characterisation categories and the low number of samples.17 Furthermore, these studies mostly exist within the 'grey' literature and typically focus on municipal-level analysis where different income groups are often not considered.17 As HSW generation and composition are affected by geography, income and access to separation at source programmes, suburb-level analysis is crucial to evaluate the efficacy of certain inteventions (such as separation at source) and differences in waste composition between areas. Published research regarding waste characterisation in the South African context includes food waste18-20, quantification of informally disposed waste21, waste characterisation methodologies17, management of mechanical biological waste22,23, characterisation of waste at higher education institutions24,25, and the difference in waste generation and composition between formal and informal areas26. Few studies have focused on sub-municipal level and the composition of HSW at a suburb level as well as understanding the socioeconomic factors that influence HSW composition.
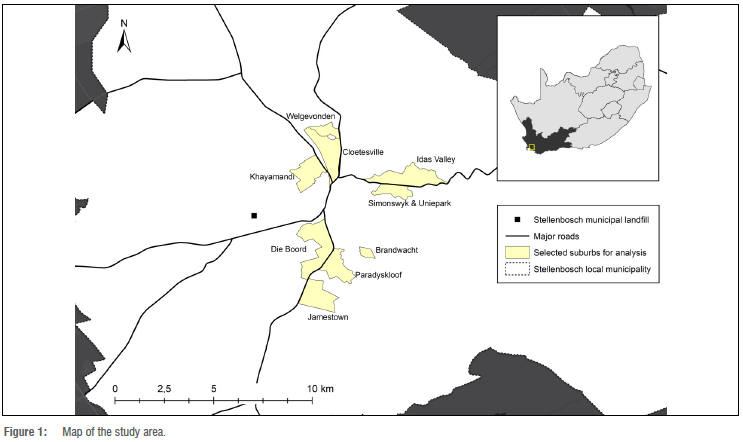
This paper presents the results of a waste characterisation study undertaken in 2017 in the Stellenbosch Local Municipality, Western Cape Province, South Africa (Figure 1). Although several investigations have identified the need for effective waste management in the Stellenbosch context27-30, to date none has focused solely on waste characterisation of the HSW stream. The purpose of this study was to demonstrate how HSW generation and composition (destined for landfill) differ among suburban areas (suburbs) and to investigate the possible socio-economic explanatory variables for any differences in waste characteristics. The findings of a 2017 study are presented but, notably, the investigation concentrated on the contents of HSW destined for landfill and excluded all HSW already separated at source for further beneficiation.
Waste characterisation
A review of several waste characterisation studies reveals that the single factor most influencing the nature of waste characterisation studies and their findings, is the methodological framework of the study. To date, no single or specific research method nor set of research methods have been accorded the status of an internationally standardised approach to conducting HSW characterisations.31 Thus, an array of generally accepted methods are found in the literature. Each method has been developed and applied in the absence of a single recognised approach and each has been employed in endeavours to remedy the same obstacle, namely the lack of data concerning the composition of HSW.8,10,11,32,33
Investigations by Edjabou et al.11, Ozcan et al.12, Emery et al.13, Al-Khatib et al.31 and Monavari et al.34 have identified two sets of factors that potentially influence waste characterisation, namely seasonal effects and socio-economic factors (particularly household size and income). Thus, seasons can have pronounced effects on the composition of waste and the rates of disposal.12,13 In particular the organic waste fraction is often influenced most by seasonal dynamics.12 Additionally, seasonal variations can significantly affect the moisture content of waste streams (dry and rainy seasons), which in turn affects the weight of these streams.11
Regarding economic factors, strong correlations often exist between income level and the consumption of goods and services. There is also ample evidence from extant research confirming that the rates at which waste is generated in city environments are generally higher than those in rural areas, as a consequence of both higher living standards and higher levels of economic activity in cities.31
Not only do the volumes of waste generated differ among income groups in particular settings, but the relative contributions of the different waste fractions to overall waste streams also vary significantly. Relatively little organic waste is typically generated by the low-income segments of communities in comparison to their medium- and high-income counterparts.11,12 Owing to economic circumstances, members of low-income households are likely to consume most of the organic materials they either grow or purchase for consumption and thus discard relatively little. Other fractions, such as waste in the form of paper and cardboard, are also generated at considerably higher rates in high- and medium-income areas than in low-income areas as a consequence of the formers' greater purchasing power, higher levels of consumption of pre-packaged foods and other products as well as their significantly higher levels of participation in activities which entail the use and consumption of paper. However, some studies have found no significant correlation or relationship between waste quantities and household income.34 These findings point to income not being the only determinant of levels of daily consumption and that higher incomes may be invested or spent in ways that do not influence the rates at which waste is generated. Typically, waste characterisation studies are conducted in four phases - (1) sample size and method determination, (2) sample collection, (3) sorting and (4) analysis.
Determination of sample size and methods phase
The sampling phase of a HSW characterisation study has two distinct steps: first, the sample size is determined and, second, the sampling methods to be used are identified.14,35 Studies typically adopt different sampling protocols and use different sample sizes. For instance, Monavari et al.34 sampled one bag for every 563 households and Gomez et al.14 sampled one bag in every 347 households. In contrast, Dangi et al.15 sampled one bag in 84 households while Ezeudu et al.16 sampled one bag for every 64 households in the population. A review of 18 waste characterisation methodologies based on physical sampling revealed that there is not a singular method appropriate for the determination of appropriate sample size and number of samples.36 The range of recommendations clearly shows the differences in sampling employed by various researchers. These differences are because characterisation studies are often constrained by time and financial resources, with data collection and sorting often being prohibitively expensive, especially in developing countries.
Sample collection phase
The collection of samples in HSW characterisation studies is crucial to the success of a study and it can significantly influence the reliability of the findings produced.32,35,37 The ways in which HSW is transported in developing countries ranges widely from rickshaws, animal-drawn carts, wheelbarrows and hand trolleys to motorcycles, tractors, trucks and compactors.38 Relevant collection-related factors to be considered are whether samples are compacted or uncompacted during collection, how regularly collections are done and the methods used to select households.39
Sorting phase
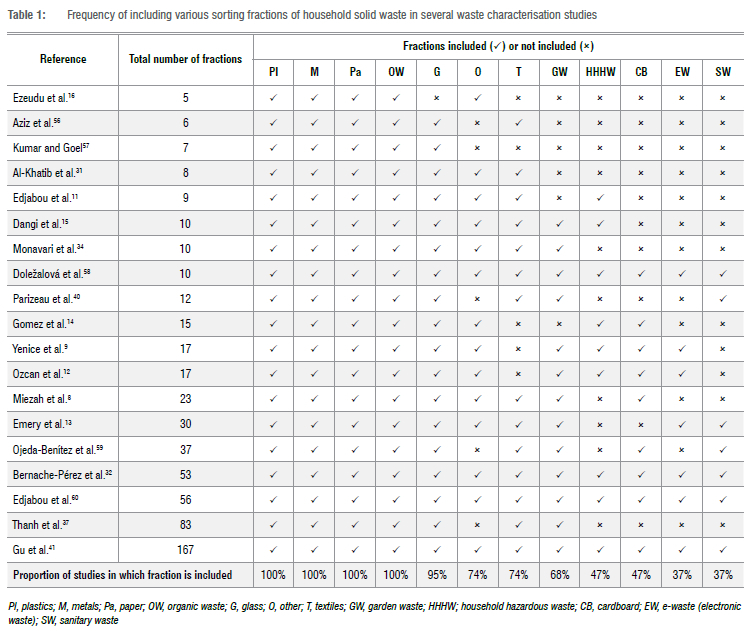
The waste materials in each sample are then physically separated into predetermined fractions.40 The number of fractions chosen is primarily determined by time, budget and human resources available to the researcher. Equally influential is the objective of each study.12 Various sorting categories were reported in 19 HSW characterisation studies conducted between 2001 and 2019 (Table 1). The numbers range from five named fractions used by Ezeudu et al.16 to the 167 main and subfractions sorted by Gu et al.41 The 12 most frequently used waste fractions were: plastics, metals, paper, organic waste, glass, other, textiles, garden waste, household hazardous waste, cardboard, electronic waste, and sanitary waste. This again clearly denotes the vast difference in methods employed for waste characterisation studies.
Data analysis phase
The crucial issue in conducting waste characterisation studies is to determine the overall composition of waste samples. The usual solution is simple interpolation of the data from an individual waste fraction over the entire population.11 Correlation and regression analyses are standard techniques for further examining the data, particularly to uncover causal relationships between waste generation and causal variables such as household income, size and density.9,34,37,41 Another statistical technique used in waste characterisation studies is analysis of variance (ANOVA) applied to determine whether deviations about the mean distributions of compositions of waste can be attributed to the geographical origins of particular samples.31
Study area
The Stellenbosch Local Municipality (WC024) is one of five local municipalities which fall within the boundaries of the Cape Winelands District Municipality (CWDM) of the Western Cape Province of South Africa. Stellenbosch Local Municipality has jurisdiction over an area of only 831 km2, with a total population of 155 728 people who reside in 43 420 households.42,43 It houses 19.78% of the total population of the Cape Winelands District Municipalityon only 3.87% of the total area under its jurisdiction. From these statistics, it is evident that the area which falls under the Stellenbosch Local Municipality is the most densely populated in the overall district (186.40 people/km2). In 2018, income inequality levels were the highest in Stellenbosch when compared to neighbouring municipalities within the Cape Winelands District Municipality as well as within the greater Western Cape, with a Gini coefficient of 0.60.44 The Stellenbosch Local Municipality provides a weekly refuse removal service to 87% of the population - the highest collection rate in the district.42
HSW produced in the study area is collected by refuse compactor vehicles. The vehicles are operated by a driver and five crew members. Houses in all formal areas are required to place their 240-litre municipal-issued wheelie bins on the pavement outside their homes on refuse collection days. HSW is collected once a week, from Monday to Friday.45 Housing complexes may also request refuse collection three times a week (Mondays, Wednesdays and Fridays), which is offered by the municipality at an increased tariff.46 A separation at source initiative, which is implemented in specific areas within the municipal area, enables residents to place recyclable waste in clear bags next to their wheelie bins on collection days. A different vehicle collects and transports recyclables to a small materials recovery facility located adjacent to the landfill site, where the recyclables are sorted manually before being baled and transported to recyclers.
HSW is collected from informal areas by removing 6-m3 skips up to five times a week. The use of skips is preferred by the municipality in these areas because access to homes is often hindered by low-hanging electrical cabling and a lack of formal roads (Heckrath N, Foreman: Disposal, Stellenbosch Municipality, personal communication, 18 January 2018). Consequently, the locations of skips are usually determined by the ease with which refuse removal vehicles are able to reach them and not necessarily by other equally significant factors such as the distances between the skips and residents (Hendricks C, Principal Technician: Collections, Stellenbosch Municipality, personal communication, 5 February 2018).
The study area map (Figure 1) shows the location of Stellenbosch within South Africa, as well as the selected suburbs in this study.
Garden, industrial, construction, demolition and household solid wastes are all accepted at the local landfill site and each load is individually recorded on the weighbridge's software system prior to disposal in terms of type of waste and weight. The municipality chips garden waste on-site whereafter it is removed for further beneficiation. Construction and demolition waste is crushed and screened on-site to predetermined specifications in accordance with tender requirements and made available for resale. Industrial waste is transported to the facility by private contractors and accepted if it can be classified as 'general solid waste'. This classification implies that it may not be classifiable as a sludge or liquid waste and may not contain any hazardous material. Households in areas where the separation at source programme is not implemented, generate waste destined for landfill only. The waste consists of a mixture of recyclable, non-recyclable and organic waste, which is disposed of in black bags. Households which participate in the programme also generate 'black bag' waste consisting of non-recyclables and organic waste destined for landfill. This waste destined for landfill is referred to as the 'residual waste' portion. All recyclable waste is placed in clear bags and the separation at source programme provides the municipality with a monthly breakdown of the types and quantities of recyclable materials separated by households from residual waste in participating suburbs. Accordingly, the contents and composition of the 'clear bags' are known. Consequently, the composition of the waste stream which enters the municipal landfill of which the Stellenbosch Municipality is most uncertain, is the residual portion of the HSW stream, which is why this study focuses on the characterisation thereof.
Materials and methods
A waste characterisation study was conducted for the Stellenbosch Municipality and involved the application and implementation of the four phases of such studies as outlined above. These phases are discussed further here. Ten suburbs within Stellenbosch were selected because they reflect different socio-economic areas within the municipality and are also serviced by municipal refuse compactor vehicles, i.e. the HSW collected in these suburbs is destined for landfill.
Determination of sample size
In March 2017, the Department of Environmental Affairs and Development Planning (DEA&DP) of the Western Cape, South Africa, published guidelines on waste characterisation47 to ensure the standardisation of waste characterisation studies conducted in the Province, in the interest of obtaining reliable and comparable results. Because the Stellenbosch Local Municipality is a local authority under the provincial jurisdiction of the DEA&DP, the guidelines were assessed to ensure standardisation of the sampling procedures and compliance with the prescriptions. The guidelines essentially are grey literature and the robustness of the sampling process has not been tested. The need for integrating these guidelines with those extracted from a broader literature was thus identified. The minimum requirements of the guidelines were complied with, but lessons learnt from other waste characterisation studies highlighted above were also incorporated into the study design.
The sample size for the study was determined by combining Cochran's formula (Equation 1) and the DEA&DP's sampling guidelines.47,48 This combination was necessary because the DEA&DP guidelines were intended for waste characterisation studies in poorly resourced municipalities, whereas a substantial budget and more human resources were available to conduct a wider, more in-depth study. Cochran's formula, which was further developed by Bartlett et al.35, has been successfully used in a number of studies to calculate sample sizes for waste characterisation8,49. The formula is appropriate for studies of large populations with unknown degrees of statistical variance. The formula is:
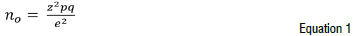
where no is the sample size;
z is the selected critical value of the desired confidence level;
p is the estimated proportion of an attribute which is present in the population;
q is 1-p; and
e is the desired level of precision.
According to the United Nations Environment Programme50, confidence levels for data collected for the characterisation of solid waste are usually set at 80% to 90%. However, a survey of relevant studies revealed that confidence levels and precision vary substantially, with confidence levels ranging from 90% to 99% and precision between ±5% and ±10%.8,12,14 The confidence level for this study was set at 95% with precision of ±8%. Table 2 provides details about each suburb studied and the number of samples required as calculated using Equation 1.
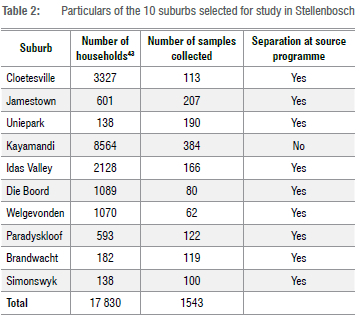
Stratified random sampling was conducted to identify the 10 suburbs selected in this study. A second round of spatially stratified random sampling was done in each suburb to ensure that the sampled households were evenly distributed spatially in each suburb. The study was undertaken with the permission of the Stellenbosch Local Municipality, but without the knowledge of household members so as to minimise any changes in their waste-related behaviour. Sample bags were, in no way, traceable back to individual houses.
Sample collection
The collection of samples started with the identification of the suburb from which samples were collected each day. Each pre-identified suburb was assigned a unique coloured sticker for the day. The appropriate sticker was attached to the bags collected in a specific suburb on a particular day. This enabled the crews of the special collection vehicles, sponsored by the municipality, to collect samples from more than one suburb per collection round before offloading the samples. By not requiring crews to separate the bags from the different suburbs, potential sampling errors were minimised and crews were not overburdened with excessively complex instructions.
Samples were collected on the same day as the scheduled municipal refuse removal day for a suburb. The municipality's solid waste management department, which is responsible for the collection of HSW, ensured that the crews collecting samples were given a head start over the department's scheduled compactor vehicles. Because HSW is collected once a week from homes in the suburbs, it was assumed that the samples represented 7 days' worth of waste per household.
Uncompacted samples were collected as this best suited the time and budget available for the study. The samples were collected by the crews consisting of two to four workers on two vehicles driven by appropriately licensed drivers. Each crew member was issued with suitable personal protective equipment. In total, 1543 samples (10.2% of the households) of a planned 1821 were collected. The samples weighed a combined total of 5748 kg and had an uncompacted volume of 84.9 m3.
Sample sorting
Each unopened bag was weighed and its mass captured by trained supervisors. The suburban origin of each bag was noted by the supervisors. The sorting team of unemployed individuals selected by the municipality and trained by the researchers opened the bags under supervision. Extreme caution was exercised when opening the bags, because the unknown contents could have contained sharp objects or hazardous substances. The use of reusable black bags minimised the creation of additional and unnecessary plastic waste.
The sorting process was supervised to ensure correctness. Seven major waste fractions were considered during the sorting phase, namely (1) hard plastics, (2) plastic wrap and packaging, (3) metals, (4) glass, (5) paper and cardboard, (6) organic waste and (7) other. Organic waste and other fractions were further divided into subfractions, a procedure that promoted a deeper understanding of the various waste fractions. Organic waste was subdivided into food waste, garden waste and leachate. Other waste was subdivided into Tetra Pak® cartons, household hazardous waste, expanded polystyrene, tissues, ash, electronic waste, small furniture items, maize meal bags, textiles and 'residual other'.
Once the entire contents of a bag had been sorted into relevant fractions, the platform scale was zeroed to account for the weight of the 20-litre buckets into which the fractions had been placed and each fraction was individually weighed and the readings captured by a supervisor. The uncompacted volume of each fraction was determined by estimating its volume in the 20-litre bucket into which the fraction had been emptied. Waste fractions that exceeded the capacity of one 20-litre bucket required the use of additional buckets. Consequently, the volume of some waste streams exceeded 100% (one bucket).
Data analysis
Two software packages were used to analyse the waste characterisation data: Microsoft Excel 2016 for a basic analysis and R for the statistical analysis.
Basic analysis
The mass (kg) of each waste fraction did not require any further conversion. The estimated volumes captured as percentages of a 20-litre container were converted to cubic metres. This was crucial because the volumes give an indication of the physical space which the uncompacted materials would occupy on a landfill site. The results were used to develop waste profiles for each suburb as well as waste profiles for each fraction in the overall waste stream, namely hard plastics, plastic wrap and packaging, metal, glass, paper and cardboard, organic waste and 'other'. The volume of waste landfilled per annum was projected. Potential seasonal fluctuations were not taken into account during this study on the basis of the findings of a study conducted by the Stellenbosch Local Municipality. The study, conducted in 2012, was to determine whether seasons influenced the overall compositions of waste streams. The findings revealed that although the size of the garden waste fraction was most affected by seasonal changes, the generation and disposal of other waste fractions were mainly unchanged, with a few exceptions, such as those which occurred as a consequence of spikes in waste generation at times such as public holidays.51
Statistical analysis
The data captured during the waste characterisation process were analysed statistically using R. In the absence of household-level demographic and socio-economic information, an ANOVA52 was performed to determine any significant differences in the waste fractions of HSW among waste generation rates and the explanatory variables household income and household size. Information available in the public domain, such as census data regarding average household size and income per suburb, was also used.
Results and discussion
Results concerning the characterisation of waste in Stellenbosch are presented here, followed by an exploration of variables which may explain these results.
Composition of residual HSW
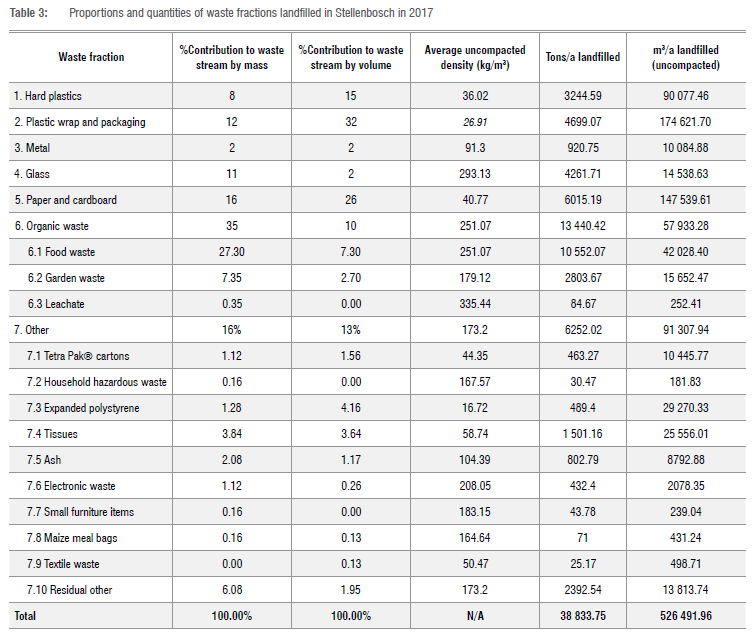
The overall composition of the characterised waste, expressed as mass and volume, is summarised in Table 3. Data from the municipal landfill weighbridge revealed that the average quantity of HSW sent to landfill over the previous 4 years (the period for which data were reported by the municipality) was 3236.2 tons per month or 38 833.8 tons per year generated by a total of 155 728 residents - an average of 0.68 kg/ capita/day. In contrast, a review of 19 published HSW characterisation studies conducted (Table 1) showed average waste generation rates of between 0.26 kg/capita/day and 0.98 kg/capita per day with an average of 0.54 kg/capita/day. These figures place this study's waste generation rate at the higher end of the spectrum.
All the densities in Table 3 were calculated for uncompacted materials. Information about uncompacted waste materials is crucial in determining the amount of space required at diversion facilities for storing unprocessed materials. The overall waste stream can also be linked to certain causal variables discussed below.
Relationship between waste composition and household socio-economic factors
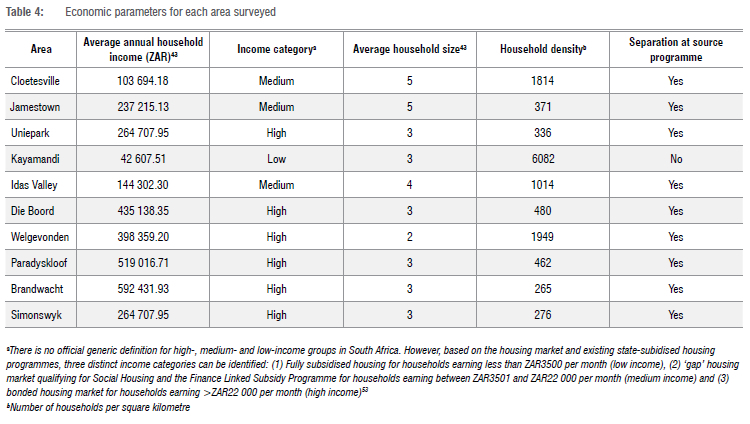
As mentioned previously, socio-economic factors are strongly linked to waste generation rates as well as the types of waste produced by households. An ANOVA was performed to determine the statistical differences between waste generation rates in each suburb and the influence that household income and household size were found to have on these rates. Table 4 summarises the economic parameters for each area surveyed.
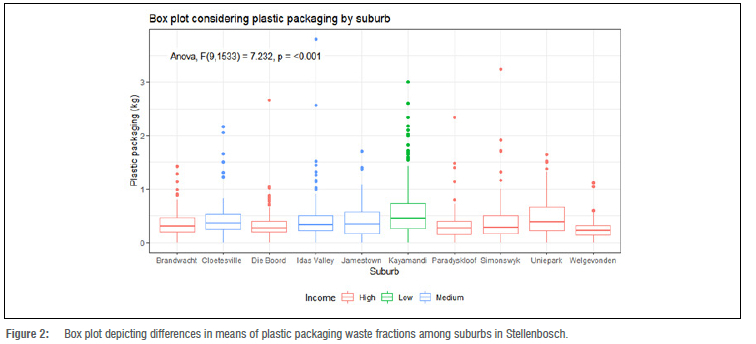
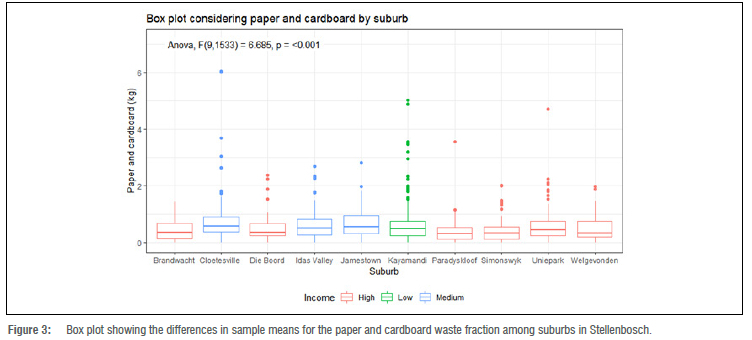
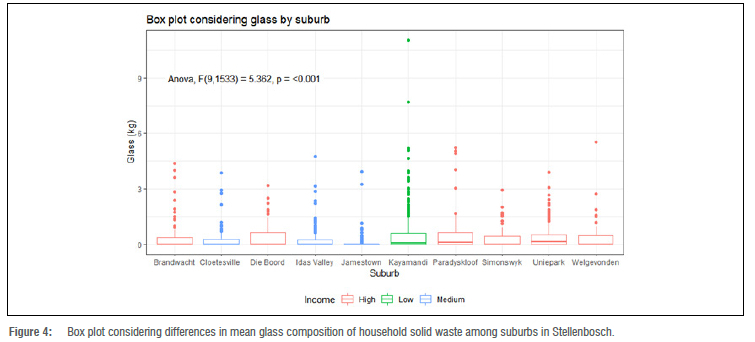
Table 5 presents the results of a one-way ANOVA of the relationships between the various suburbs studied and select waste fractions. The results of the ANOVA suggest that a statistically significant (p<0.05) difference exists between the mean mass of the different waste fractions across all the suburbs considered. Plastic wrap and packaging (Figure 2), paper and cardboard (Figure 3) and glass (Figure 4) waste fractions showed the greatest variance in means between suburbs.
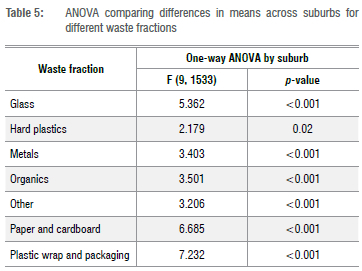
In relation to the prevalence of plastic packaging in the HSW stream between different suburbs, there is a statistically significant difference between sample means across the suburbs analysed (Table 5, Figure 2). Kayamandi has, on average, the highest amount of plastic wrapping and packaging by weight (0.5464 kg per bin) in the HSW stream destined for landfill. This is followed by Uniepark (0.4614 kg per bin) and Idas Valley (0.4418 kg per bin). Notably, Kayamandi, Jamestown, Idas Valley and Cloetesville are classified as low-medium-income areas and all show higher levels of paper and cardboard in the HSW stream when compared to higher-income suburbs (with the exception of Uniepark).
Paper and cardboard disposal between the different suburbs also differs significantly (Figure 3). The highest mean is for Cloetesville (0.8339 kg per bin), followed by Jamestown (0.6574 kg per bin), Idas Valley (0.6323 kg per bin) and Kayamandi (0.6008 kg per bin). Again, the four suburbs with the highest disposal are in medium- and low-income groups.
There is a significant difference between the means of each suburb for glass (Figure 4). Perhaps most noticeable is the high number of outliers collected from Kayamandi, while Jamestown has very limited variance. Kayamandi, Idas Valley, Jamestown and Cloetesville are often near the top in relation to the amount of recyclable materials placed in the HSW stream, particularly plastic packaging, paper and cardboard, and glass (Figures 2-4), even though three of these suburbs (Idas Valley, Cloetesville and Jamestown) have access to a separation at source programme. Strydom54,55 argues that only a minor percentage of South African households actively engage in recycling programmes (7.2% in 2015). Household recycling is often inhibited by several factors, including: limited space, time constraints, inadequate recycling knowledge and the inconvenience of recycling.54 In particular, non-recyclers indicate that a lack of time and knowledge influences household recycling activity, while those in highly dense urban areas suggest that an absence of recycling knowledge is an important variable explaining the lack of recycling in these areas.54 Given these results, it is possible that recycling behaviour is influenced by income level, which affects factors like space limitations, housing density and the inconvenience of recycling.
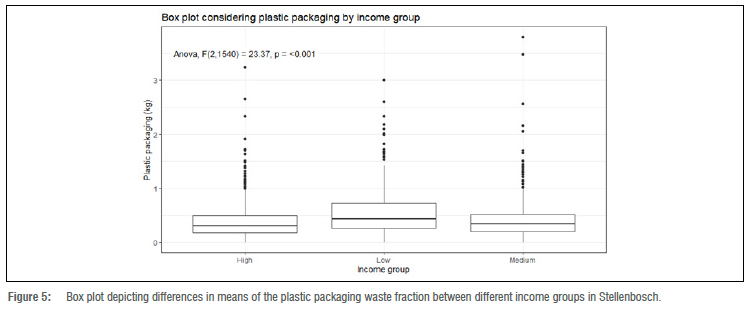
Table 6 presents the results of a one-way ANOVA of the relationships between the various income groups and select waste fractions. The results of the ANOVA indicate that a statistically significant difference exists between the mean mass of the different waste fractions across all income groups considered, with the exception of the organics category. This finding is surprising as the literature often points to low-income areas producing less organic waste than higher income suburbs.11,12 Plastic wrap and packaging (Figure 5) and paper and cardboard (Figure 6) waste fractions showed the greatest variance in means between income groups. The low-income group had the highest amount of plastic wrapping and packaging on average by weight (0.5464 kg per bin) in the HSW stream destined for landfill, followed by the medium-income group (0.4248 kg per bin) and the high-income group (0.3811 kg per bin). These results corroborate the observations made in Figure 2.
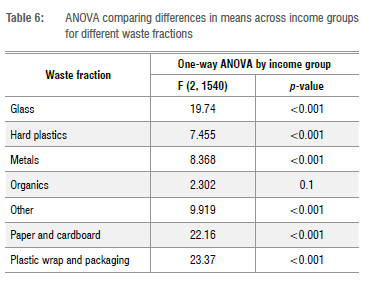
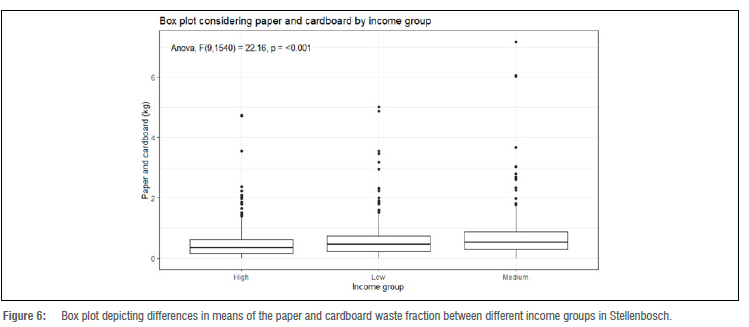
Paper and cardboard disposal between the different income groups also differs significantly (Figure 6). Here the highest mean is for the medium income group (0.6899 kg per bin), followed by the low income group (0.6008 kg per bin) and the high income group (0.4624 kg per bin). Income level clearly affects the amount of paper and cardboard in the HSW stream in Stellenbosch.
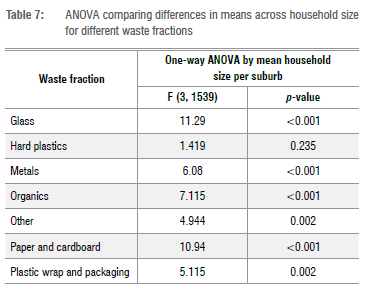
Table 7 presents the results of a one-way ANOVA of the relationship between household size and select waste fractions. The results show that the low-income group has the highest means of the following waste fractions in comparison to other income groups: hard plastics, plastic wrapping and glass. The low-income group is made up of only one suburb, Kayamandi, and is also the only suburb sampled which did not have access to the separation at source programme in Stellenbosch. Thus lack of access to a separation at source programme might be an explanatory variable relating to the higher quantities of recyclables found in Kayamandi where one would expect large quantities of recyclable waste to be disposed of in municipal skips and bins.
However, the findings also suggest that the medium-income areas (with access to a separation at source programme) tend to have higher levels of recyclable materials in the hSw stream than higher-income areas, indicating that other factors, such as recycling attitudes17 and types of waste generated in households, are important too. So while separation at source is an effective way of keeping the hard plastics, plastic wrapping and glass fractions out of the landfill, more can be done to ensure a greater use of this facility.
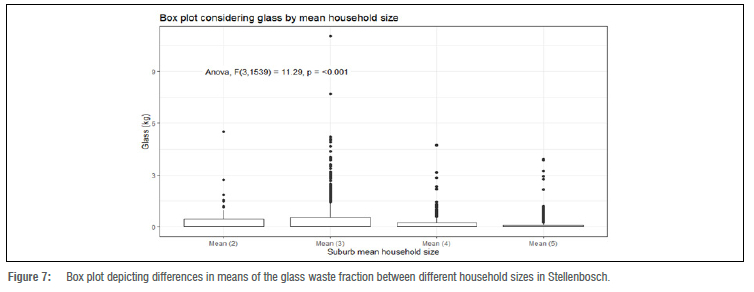
Increasing household size is typically associated with greater levels of waste generation, although the effect of household size on different waste fractions is not always clear. Table 7 shows that the results of the ANOVA indicate that a statistically significant difference exists between the mean mass of the different waste fractions across all household sizes considered, except for the hard plastics category. Glass (Figure 7) and paper and cardboard (Figure 8) waste fractions showed the greatest variance in means between household sizes.
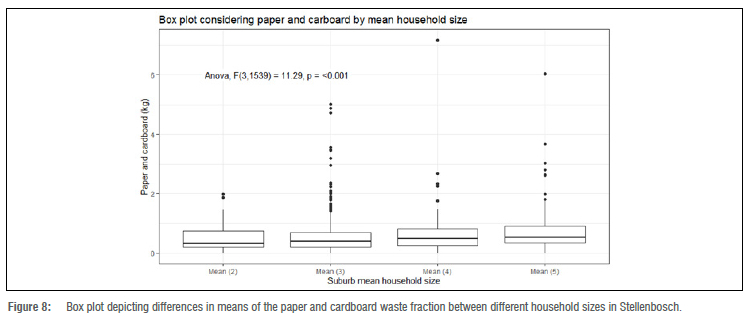
Glass disposal varied significantly depending on household size (Figure 7). Households with three members were found to dispose of the most glass on average (0.4458 kg per bin), followed by two-member households (0.4182 kg per bin), four-member households (0.2586 kg per bin) and, lastly, households with five members (0.1686 kg per bin). In accordance with the ANOVA results when considering suburbs and income groups, when considering household size, the paper and cardboard waste fraction was again amongst the top two fractions showing the most variance (Table 7, Figure 8).
Figure 8 shows that, as household size decreases, so does the amount of paper and cardboard disposed of. Households with five members disposed of 0.7197 kg paper and cardboard per bin, followed by four-member households (0.6323 kg per bin), three-member households (0.5136 kg per bin) and two-members (0.4977 kg per bin).
These results show that there are significant differences in the HSW streams of suburbs in the Stellenbosch Municipality. Mean household income and mean household size for these suburbs can be considered explanatory variables for these differences, with plastic packaging, paper and cardboard, and glass being the waste fractions that show the greatest difference in means. Lack of access to a separation at source programme may influence the high levels of recyclable materials in Kayamandi, but other (medium-income) suburbs with access to these programmes display similar levels of recyclable waste fractions in their HSW, suggesting that waste behaviour and types of waste used in households are more pertinent.
Conclusion
Few published HSW characterisation studies are conducted at submunicipal level. The composition of HSW as well as the socio-economic factors that influence HSW composition are reported here for 10 suburbs in the Stellenbosch Municipality. Organic waste made the greatest contribution to the waste stream by mass (35%), although its contribution by volume was proportionally lower. The chief contributor to the waste stream by volume was plastics (47%), followed by paper and cardboard (26%). The mean waste generation rate (0.68 kg/capita/day) in these Stellenbosch suburbs was found to be slightly higher than the average rate reported in similar studies worldwide. During this study it was found that household size and income can be used as explanatory variables for waste generation and composition for the 10 suburbs characterised. Plastic packaging, paper and cardboard, and glass waste fractions were the most affected by household income. Typically, low- and medium-income suburbs had higher levels of these waste fractions in their HSW than did high-income areas. In future, the completion of a questionnaire, per household sampled, is recommended to obtain basic demographic and socio-economic information. This information would allow for a more nuanced analysis and correlation of individual household size and income with waste composition. Other variables, such as human behaviour, could potentially contribute to the differences and further studies to explore these are also recommended. Given the influence of separation at source programmes on waste characterisation data, it is recommended that the materials processed by these programmes are sampled in addition to the residual portion of the waste streams of areas. Such sampling would aid a more accurate understanding of the waste streams of areas and enable implementation of targeted interventions. Despite this, it is difficult to draw comparisons with other international studies, thus demonstrating the need for greater detail in reporting of such information. Further roll-out of a separation at source programme in Stellenbosch is recommended to include all suburbs in order to save landfill airspace.
Acknowledgements
The authors acknowledge the funding support from the South African Department of Science and Innovation (DSI) and National Research Foundation (NRF) through the Waste RDI Roadmap, managed by the Council for Scientific and Industrial Research (CSIR). Stellenbosch Municipality and the team involved in the collection and sorting of the samples are also acknowledged.
Competing interests
We have no competing interests to declare.
Authors' contributions
C.M.N.:Conceptualisation; methodology; data collection; sample analysis; data analysis; writing - the initial draft. C.S.: Conceptualisation; writing - revisions; funding acquisition. J.d.W.: Conceptualisation; writing - revisions; student supervision; project leadership.
References
1. Chen DMC, Bodirsky BL, Krueger T, Mishra A, Popp A. The world's growing municipal solid waste: Trends and impacts. Environ Res Lett. 2020;15(7), Art. #074021. https://doi.org/10.1088/1748-9326/ab8659 [ Links ]
2. Wilson DC, Velis CA. Waste management - Still a global challenge in the 21st century: An evidence-based call for action. Waste Manag Res. 2015;33:1049-1051. https://doi.org/10.1177/0734242X15616055 [ Links ]
3. Adeleke O, Akinlabi S, Jen TC, Dunmade I. Towards sustainability in municipal solid waste management in South Africa: A survey of challenges and prospects. Trans R Soc South Africa. 2021;76:53-66. https://doi.org/10.1080/0035919X.2020.1858366 [ Links ]
4. Republic of South Africa. National Environmental Management: Waste Act No. 59 of 2008. Available from: http://www.nsw.gov.au/sites/default/files/Government_Gazette_2_December.pdf#page=15 [ Links ]
5. Swilling M. Stellenbosch landfill is full [webpage on the Internet]. c2009 [cited 2020 Jan 31]. Available from: https://www.sustainabilityinstitute.net/si-news/5001-stellenbosch-landfill-is-full [ Links ]
6. Chang N-B, Davila E. Municipal solid waste characterizations and management strategies for the Lower Rio Grande Valley, Texas. Waste Manag. 2008;28:776-794. https://doi.org/10.1016/j.wasman.2007.04.002 [ Links ]
7. Hanc A, Novak P Dvorak M, Habart J, Svehla P Composition and parameters of household bio-waste in four seasons. Waste Manag. 2011;31:1450-1460. https://doi.org/10.1016/j.wasman.2011.02.016 [ Links ]
8. Miezah K, Obiri-Danso K, Kádár Z, Fei-Baffoe B, Mensah MY Municipal solid waste characterization and quantification as a measure towards effective waste management in Ghana. Waste Manag. 2015;46:15-27. https://doi.org/10.1016/j.wasman.2015.09.009 [ Links ]
9. Yenice MK, Dogruparmak ÇÇ, Durmu§oglu E, Ozbay B, Oz HO. Solid waste characterization of Kocaeli. Polish J Environ Stud. 2011;20:479-484. [ Links ]
10. Gay BAE, Beam TG, Mar BW. Cost-effective solid-waste characterization methodology. J Environ Eng. 1993;119:631-644. https://doi.org/10.1061/(ASCE)0733-9372(1993)119:4(631) [ Links ]
11. Edjabou ME, Moller J, Christensen TH. Solid waste characterization in Kétao, a rural town in Togo, West Africa. Waste Manag Res. 2012;30:745-749. https://doi.org/10.1177/0734242X12442741 [ Links ]
12. Ozcan HK, Guvenc SY Guvenc L, Demir G. Municipal solid waste characterization according to different income levels: A case study. Sustainability. 2016;8(10), Art. #1044. https://doi.org/10.3390/su8101044 [ Links ]
13. Emery AD, Griffiths AJ, Williams KP. An in depth study of the effects of socioeconomic conditions on household waste recycling practices. Waste Manag Res. 2003;21:180-190. https://doi.org/10.1177/0734242X0302100302 [ Links ]
14. Gomez G, Meneses M, Ballinas L, Castells F. Characterization of urban solid waste in Chihuahua, Mexico. Waste Manag. 2008;28:2465-2471. https://doi.org/10.1016/j.wasman.2007.10.023 [ Links ]
15. Dangi MB, Urynowicz MA, Belbase S. Characterization, generation, and management of household solid waste in Tulsipur, Nepal. Habitat Int. 2013;40:65-72. https://doi.org/10.1016/j.habitatint.2013.02.005 [ Links ]
16. Ezeudu OB, Ozoegwu CG, Madu CN. A statistical regression method for characterization of household solid waste: A case study of Awka Municipality in Nigeria. Recycling. 2019;4:1-17. https://doi.org/10.3390/recycling4010001 [ Links ]
17. Oelofse S, Muswema AP, Koen R. The changing face of waste management - considerations when conducting a waste characterisation study. In: Proceedings of the 23rd WasteCon Conference; 2016 October 17-21; Johannesburg, South Africa. p. 345-349. [ Links ]
18. Oelofse S, Muswema A, Ramukhwatho F. Household food waste disposal in South Africa: A case study of Johannesburg and Ekurhuleni. S Afr J Sci. 2018;114, Art. #2017-0284. https://doi.org/10.17159/sajs.2018/20170284 [ Links ]
19. Oelofse S, Nahman A. Estimating the magnitude of food waste generated in South Africa. Waste Manag Res. 2013;31:80-86. https://doi.org/10.1177/0734242X12457117 [ Links ]
20. Nahman A, De Lange W, Oelofse S, Godfrey L. The costs of household food waste in South Africa. Waste Manag. 2012;32:2147-2153. https://doi.org/10.1016/j.wasman.2012.04.012 [ Links ]
21. Rodseth C, Notten P Von Blottnitz H. A revised approach for estimating informally disposed domestic waste in rural versus urban South Africa and implications for waste management. S Afr J Sci. 2020;116, Art. #5635. https://doi.org/10.17159/sajs.2020/5635 [ Links ]
22. Trois C, Simelane OT. Implementing separate waste collection and mechanical biological waste treatment in South Africa: A comparison with Austria and England. Waste Manag. 2010;30:1457-1463. https://doi.org/10.1016/j.wasman.2009.12.020 [ Links ]
23. Trois C, Griffith M, Brummack J, Mollekopf N. Introducing mechanical biological waste treatment in South Africa: A comparative study. Waste Manag. 2007;27:1706-1714. https://doi.org/10.1016/j.wasman.2006.12.013 [ Links ]
24. Owojori O, Edokpayi JN, Mulaudzi R, Odiyo JO. Characterisation, recovery and recycling potential of solid waste in a university of a developing economy. Sustainability. 2020;12(12), Art. #5111. https://doi.org/10.3390/su12125111 [ Links ]
25. Pretorius PS, De Waal J. Increasing rates of convenience food packaging use at HEIs: A case study of the Neelsie Student Centre, Stellenbosch. Geography. 2022;107:70-78. https://doi.org/10.1080/00167487.2022.2068837 [ Links ]
26. Tsheleza V, Ndhleve S, Kabiti HM, Nakin MD. Household solid waste quantification, characterisation and management practices in Mthatha City, South Africa. Int J Environ Waste Manag. 2022;29:208-229. https://doi.org/10.1504/IJEWM.2022.121212 [ Links ]
27. Steyl I. Solid waste in rural Stellenbosch: Nature, extent and handling strategies [MA thesis]. Stellenbosch: Stellenbosch University; 1996. [ Links ]
28. Van der Merwe H, Steyl I. Solid waste management in intensively farmed rural areas: Practices and problems in a South African case study. Acta Acad. 2005;37:184-211. [ Links ]
29. Van der Merwe JH, Steyl I. Rural solid waste management: A planning strategy for higher density agricultural regions. J Public Adm. 2005;40:295-313. [ Links ]
30. Puling L. Solid waste management systems in developing urban areas: Case study of Lwandle township [Msc thesis]. Stellenbosch: Stellenbosch University; 2004. [ Links ]
31. Al-Khatib IA, Monou M, Zahra ASFA, Shaheen HQ, Kasslnos D. Solid waste characterization, quantification and management practices in developing countries. A case study: Nablus district - Palestine. J Environ Manage. 2010;91:1131-1138. https://doi.org/10.1016/j.jenvman.2010.01.003 [ Links ]
32. Bernache-Pérez G, Sánchez-Colón S, Garmendia AM, Villareal AD, Sánchez-Salazar ME. Solid waste characterisation study in the Guadalajara Metropolitan Zone, Mexico. Waste Manag Res. 2001;19:413-424. https://doi.org/10.1177/0734242X0101900506 [ Links ]
33. Kaartinen T, Sormunen K, Rintala J. Case study on sampling, processing and characterization of landfilled municipal solid waste in the view of landfill mining. J Clean Prod. 2013;55:56-66. https://doi.org/10.1016/j.jclepro.2013.02.036 [ Links ]
34. Monavari SM, Omrani GA, Karbassi A, Raof FF. The effects of socioeconomic parameters on household solid-waste generation and composition in developing countries (a case study: Ahvaz, Iran). Environ Monit Assess. 2012;184:1841-1846. https://doi.org/10.1007/s10661-011-2082-y [ Links ]
35. Bartlett II JE, Kotrlik JW, Higgins CC. Determining appropriate sample size in survey research. Inf Technol Learn Perform J. 2001;19:43-50. [ Links ]
36. Dahlén L, Lagerkvist A. Methods for household waste composition studies. Waste Manag. 2008;28:1100-1112. https://doi.org/10.1016/j.wasman.2007.08.014 [ Links ]
37. Thanh NIP Matsui Y Fujiwara T. Household solid waste generation and characteristic in a Mekong Delta city, Vietnam. J Environ Manag. 2010;91:2307-2321. https://doi.org/10.1016/j.jenvman.2010.06.016 [ Links ]
38. Guerrero LA, Maas G, Hogland W. Solid waste management challenges for cities in developing countries. Waste Manag. 2013;33:220-232. https://doi.org/10.1016/j.wasman.2012.09.008 [ Links ]
39. Dhokhikah Y Trihadiningrum Y Sunaryo S. Community participation in household solid waste reduction in Surabaya, Indonesia. Resour Conserv Recycl. 2015;102:153-162. https://doi.org/10.1016/j.resconrec.2015.06.013 [ Links ]
40. Parizeau K, Maclaren V, Chanthy L. Waste characterization as an element of waste management planning: Lessons learned from a study in Siem Reap, Cambodia. Resour Conserv Recycl. 2006;49:110-128. https://doi.org/10.1016/j.resconrec.2006.03.006 [ Links ]
41. Gu B, Wang H, Chen Z, Jiang S, Zhu W, Liu M, et al. Characterization, quantification and management of household solid waste: A case study in China. Resour Conserv Recycl. 2015;98:67-75. https://doi.org/10.1016/j.resconrec.2015.03.001 [ Links ]
42. Municipalities of South Africa. Stellenbosch Local Municipality (WC024) [webpage on the Internet]. c2019 [cited 2019 Mar 06]. Available from: https://municipalities.co.za/overview/1210/stellenbosch-local-municipality [ Links ]
43. Statistics South Africa (Stats SA). Stats SA library cataloguing-in-publication (CIP) data: Census 2011 metadata. Pretoria: Stats SA; 2012. [ Links ]
44. Western Cape government. Socio-economic profile: Stellenbosch municipality [document on the Internet]. c2020 [cited 2022 Apr 06]. Available from: https://www.westerncape.gov.za/provincial-treasury/files/atoms/files/SEP-LG2020-WC024StellenboschMunicipality.pdf [ Links ]
45. Om van 'n berg 'n molshoop te maak [To turn a mountain into a molehill]. Utter Rubbish. March 2016; 8. Afrikaans. [ Links ]
46. Solid waste tariffs for the period 1 July 2019 to 30 June 2020. Utter Rubbish. 2019;6-7. [ Links ]
47. Western Cape Department of Environmental Affairs and Development Planning (DEA&DP). Waste characterisation guideline for municipalities. Cape Town: DEA&DP; 2017. [ Links ]
48. Cochran W. Sampling techniques. 3rd ed. New York: John Wiley & Sons; 1977. [ Links ]
49. Gallardo A, Bovea MD, Colomer FJ, Prades M. Analysis of collection systems for sorted household waste in Spain. Waste Manag. 2012;32:1623-1633. https://doi.org/10.1016/j.wasman.2012.04.006 [ Links ]
50. United Nations Environment Programme (UNEP). Solid waste: Guidelines for data collection and analysis. Osaka:UNEP; 2007. [ Links ]
51. De Beer T. Sustainable waste management: A decision support framework [MScEng thesis]. Stellenbosch: Stellenbosch University; 2013. [ Links ]
52. Gelman A. Analysis of variance - why it is more important than ever. Ann Stat. 2005;33(1):1-53. https://doi.org/10.1214/009053604000001048 [ Links ]
53. Western Cape Department of Environmental Affairs and Development Planning (DEA&DP). Western Cape inclusionary housing policy framework. Cape Town: DEA&DP; 2021. Available from: https://www.westerncape.gov.za/eadp/files/atoms/files/WCInclusionaryHousingPolicyFramework_FAQs.pdf [ Links ]
54. Strydom WF. Barriers to household waste recycling: Empirical evidence from South Africa. Recycling. 2018;3(3), Art. #41. https://doi.org/10.3390/recycling3030041 [ Links ]
55. Strydom WF. Applying the theory of planned behavior to recycling behavior in South Africa. Recycling. 2018;3(3), Art. #43. https://doi.org/10.3390/recycling3030043 [ Links ]
56. Aziz SQ, Aziz HA, Bashir MJK, Yusoff MS. Appraisal of domestic solid waste generation, components, and the feasibility of recycling in Erbil, Iraq. Waste Manag Res. 2011;29(8):880-887. https://doi.org/10.1177/0734242X10387462 [ Links ]
57. Kumar KN, Goel S. Characterization of municipal solid waste (MSW) and a proposed management plan for Kharagpur, West Bengal, India. Resour Conserv Recycl. 2009;53:166-174. https://dx.doi.org/10.1016/j.resconrec.2008.11.004 [ Links ]
58. Dolezalová M, Benesová L, Závodská A. The changing character of household waste in the Czech Republic between 1999 and 2009 as a function of home heating methods. Waste Manag. 2013;33:1950-1957. https://doi.org/10.1016/j.wasman.2013.04.017 [ Links ]
59. Ojeda-Benítez S, Armijo-de Vega C, Marquez-Montenegro MY Household solid waste characterization by family socioeconomic profile as unit of analysis. Resour Conserv Recycl. 2008;52:992-999. https://doi.org/10.1016/j.resconrec.2008.03.004 [ Links ]
60. Edjabou VME, Jensen MB, Gdtze R, Pivnenko K, Petersen C, Scheutz C, et al. Municipal solid wastecomposition: Sampling methodology, statistical analyses, and case study evaluation. Waste Manag. 2015;36:12-23. https://doi.org/10.1016/j.wasman.2014.11.009 [ Links ]
 Correspondence:
Charlotte Nell
Email: charlotte@aenv.co.za
Received: 16 Nov. 2021
Revised: 22 Apr. 2022
Accepted: 22 Apr. 2022
Published: 31 Aug. 2022
Editor: Jennifer Fitchett
Funding: South African Department of Science and Innovation, South African National Research Foundation

